Analysis of June-July measurements
39
Analysis of June-July measurements Nicholas Aquilina TE-MSC-MDA Acknowledgements: L. Fiscarelli, G. Montenero, L. Walckiers for measurements L. Bottura, N. Sammut, E. Todesco for fits and model CERN, FiDeL meeting, 28 th September 2010
description
CERN, FiDeL meeting, 28 th September 2010. Analysis of June-July measurements. Nicholas Aquilina TE-MSC-MDA Acknowledgements : L. Fiscarelli , G. Montenero , L. Walckiers for measurements L. Bottura , N. Sammut , E. Todesco for fits and model. Contents. List of measurements - PowerPoint PPT Presentation
Transcript of Analysis of June-July measurements

Analysis of June-July measurements
Nicholas AquilinaTE-MSC-MDA
Acknowledgements:L. Fiscarelli, G. Montenero, L. Walckiers for measurements
L. Bottura, N. Sammut, E. Todesco for fits and model
CERN, FiDeL meeting, 28th September 2010

2
Contents
• List of measurements• Decay amplitude vs ramp rate• Scaling laws• Linear correlation• Difference between measurements• Baseline analysis
9/28/2010
3
List of measurements (1)
9/28/2010
Measurement dI/dt (A/s) IFT (A) tFT (s) tPRE (s)
1 10 2000 1000 10002 10 2000 1000 10003 10 2000 0 10004 10 2000 0 -5 10 2000 0 10006 10 2000 0 10008 2 4000 1000 10009 10 4000 1000 1000
10 2 6000 1000 100012 10 6000 1000 100013 2 6000 0 -14 10 6000 0 -15 2 6000 0 -16 10 6000 0 -
4
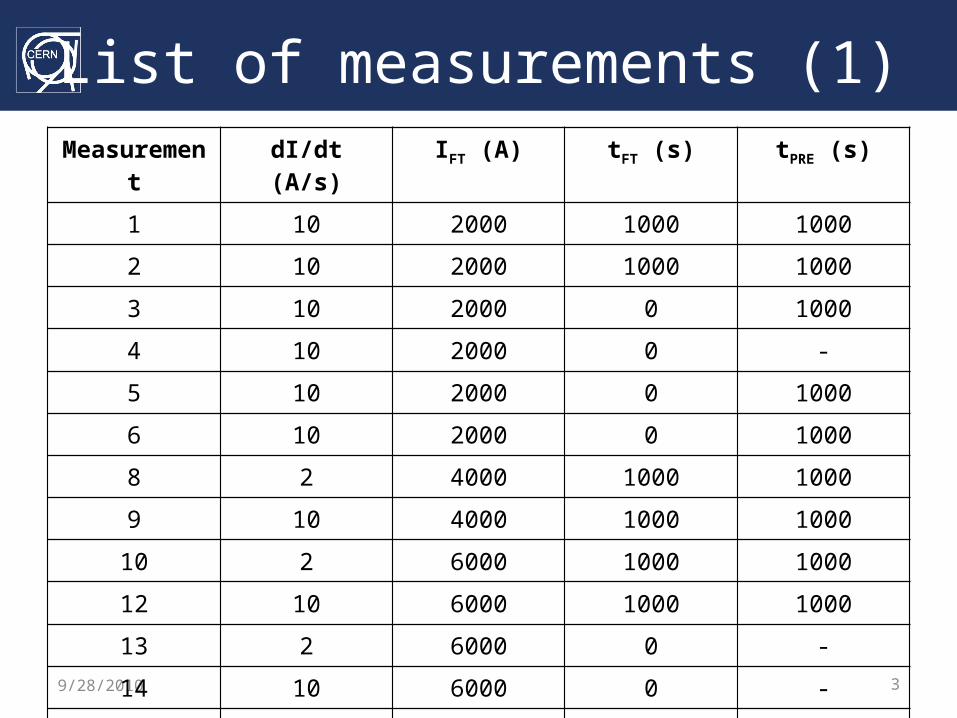
List of measurements (2)
9/28/2010
Measurement dI/dt (A/s) IFT (A) tFT (s) tPRE (s)
18 10 11850 0 100019 10 11850 0 -20 10 11850 0 100021 10 11850 0 100022 10 11850 0 -23 10 11850 0 -24 2 11850 1000 1000

5
Decay amplitude vs ramp rate
9/28/2010
• Decay amplitude is expected to increase from 2 A/s to 10 A/s by 50% to 75%
• MB2524 has been the first magnet to be measured at 2 A/s in June-July with FAME
6
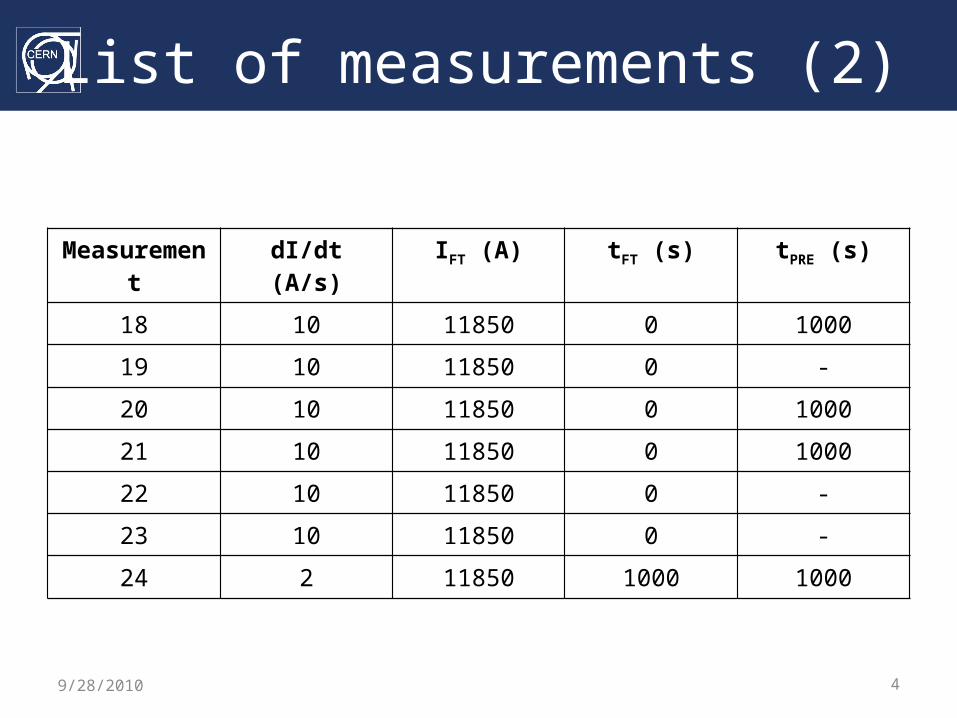
Scaling law (1)
• Ramp rate of 10 A/s• Flattop current of 11850 A• Flattop time of 1000 s• Preparation time of 0 s
9/28/2010

7
Scaling law (2)
9/28/2010
0.00.10.20.30.40.50.60.70.8
0 2 4 6 8
∆b 3
IFT (kA)
b3
Ap 1
Ap 2
FiDeL model

8
Scaling law (3)
9/28/2010
0.0
0.5
1.0
1.5
2.0
2.5
0 10 20 30 40
∆b 3
dI/dt (A/s)
b3
Ap1
Ap2
FiDeL model
∆b3 vs dI/dt for 6 kA ramps
Note that the scaling law is not accurate at low ramp rate values (decay amplitude is factor 2 less, not 5)

9
Scaling law (4)
9/28/2010
∆b5 vs dI/dt for 6 kA ramps
0.00
0.05
0.10
0.15
0.20
0.25
0.30
0 10 20 30 40
∆b 5
dI/dt (A/s)
b5
Ap1
Ap2
FiDeL model
Note that the scaling law is not accurate at low ramp rate values
10
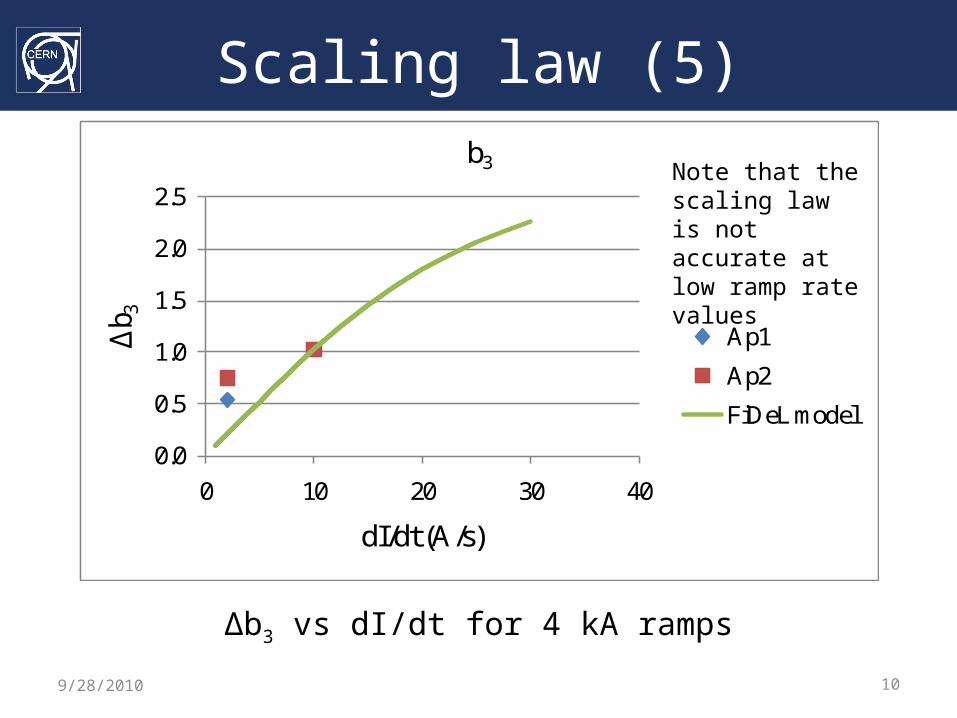
Scaling law (5)
9/28/2010
0.0
0.5
1.0
1.5
2.0
2.5
0 10 20 30 40
∆b 3
dI/dt (A/s)
b3
Ap1
Ap2
FiDeL model
∆b3 vs dI/dt for 4 kA ramps
Note that the scaling law is not accurate at low ramp rate values

11
Scaling law (6)
9/28/2010
∆b5 vs dI/dt for 4 kA ramps
0.00
0.05
0.10
0.15
0.20
0.25
0.30
0 10 20 30 40
∆b 5
dI/dt (A/s)
b5
Ap1
Ap2
FiDeL model
Note that the scaling law is not accurate at low ramp rate values

12
Linear correlation (1)• Snapback can be described by an exponential
fitting:
• Linear correlation:
9/28/2010

13
Linear correlation (2)
9/28/2010
0.0
0.1
0.2
0.3
0.4
0.5
0.6
0 1 2 3 4
∆b 3
∆I3
IFT
2 kA-Ap1
4 kA-Ap1
4 kA-Ap2
6 kA-Ap1
6 kA-Ap2
correlation (0.176)

14
Linear correlation (3)
9/28/2010
0.00
0.02
0.04
0.06
0.08
0.10
0.12
0.14
0.16
0.18
0 2 4 6 8
∆b 5
∆I5
IFT
2 kA-Ap1
4 kA-Ap1
4 kA-Ap2
6 kA-Ap1
6 kA-Ap2
correlation (0.028)

15
Linear correlation (4)
9/28/2010
0.0
0.1
0.2
0.3
0.4
0.5
0.6
0.7
0.8
0 1 2 3 4 5
∆b 3
∆I3
dI/dt
2 A/s, 4 kA
10 A/s, 4 kA
2 A/s, 6 kA
10 A/s, 6 kA
correlation (0.176)

16
Linear correlation (5)
9/28/2010
0.0
0.0
0.0
0.1
0.1
0.1
0.1
0.1
0.2
0 1 2 3 4 5 6
∆b 5
∆I5
dI/dt
2 A/s, 4 kA
10 A/s, 4 kA
2 A/s, 6 kA
10 A/s, 6 kA
correlation (0.028)

17
Difference between measurements (1)
• Dec 09-Jan 10 measurements were compared with Jun-Jul 10 measurements
9/28/2010
Observations:
•Change by a factor of 1.5
•Campaign 1 (blue) refers to Dec 09-Jan 10 measurements
•Campaign 2 (black) refers to Jun-Jul 10 measurements
Comparison of the b3 component for a 6 kA ramp.

18
Difference between measurements (2)
9/28/2010
0 1000 2000 3000 4000 5000 6000 7000 80000
1000
2000
3000
4000
5000
6000
7000
Time (s)
Curr
ent (A
)
campaign 1campaign 2P: 2, 0.05
E: 0, 0L:10, 2P:-2, -0.05
P: 2, 0.82E: 0, 0L:10, 2P:-2, -0.82

19
Baseline (1)
• Stop for 0 s at 350 A• Stop for 1000 s at
500 A (pre-injection)• Stop for 1000 s at
757.2 A (injection)
9/28/2010
0
1000
2000
3000
4000
5000
6000
7000
0 1000 2000 3000 4000 5000 6000 7000 8000
Cu
rren
t (A
)
Time (s)
Pre-cycle and ramp

20
Baseline (2)
9/28/2010
Measurement dI/dt (A/s) IFT (kA) Duration (s) of stop at 350 A
Duration (s) of stop at 500 A
Duration (s) of stop at 757.2A
2 10 2 0 1000 1000
5 10 2 0 1000 0
6 10 2 0 1000 -
10 2 6 0 1000 1000
13 2 6 0 - 0
15 2 6 0 - -
12 10 6 0 1000 1000
14 10 6 0 - 0
16 10 6 0 - -
18 10 11.85 0 1000 1000
19 10 11.85 0 - 1000
20 10 11.85 0 1000 0
21 10 11.85 0 1000 -
22 10 11.85 0 - 0
23 10 11.85 0 - -

21
Baseline (3)
0 1000 2000 3000 4000 5000 6000 70000
200
400
600
800
1000
1200
1400
1600
1800
2000
Time (s)
Cur
rent
(A)
meas 2meas 5meas 6
9/28/2010
2 10 A/s 2 kA 0 s 1000 s 1000 s
5 10 A/s 2 kA 0 s 1000 s 0 s
6 10 A/s 2 ka 0 s 1000 s -

22
Baseline (4)
740 745 750 755 760 765 770 775 780 785 790
-2.75
-2.7
-2.65
-2.6
-2.55
-2.5
-2.45
-2.4
-2.35
-2.3
-2.25
Current (A)
b 3 (uni
ts)
meas 2meas 5meas 6
9/28/2010
Decay occurs even when stopping at injection for 0 s.Please note that PELP is changed and restarted when stopping for 0 s.

23
Baseline (5)
0 2000 4000 6000 8000 10000 12000 14000 16000 180000
1000
2000
3000
4000
5000
6000
Time (s)
Cur
rent
(A)
meas 10meas 13meas 15
9/28/2010
10 2 A/s 6 kA 0 s 1000 s 1000 s
13 2 A/s 6 kA 0 s - 0 s
15 2 A/s 6 kA 0 s - -

24
Baseline (6)
740 745 750 755 760 765 770 775 780 785 790
-2.75
-2.7
-2.65
-2.6
-2.55
-2.5
-2.45
-2.4
-2.35
-2.3
-2.25
Current (A)
b 3 (uni
ts)
meas 10meas 13meas 15
9/28/2010
Decay occurs even when stopping at injection for 0 s

25
Baseline (7)
0 1000 2000 3000 4000 5000 6000 7000 80000
1000
2000
3000
4000
5000
6000
Time (s)
Cur
rent
(A)
meas 12meas 14meas 16
9/28/2010
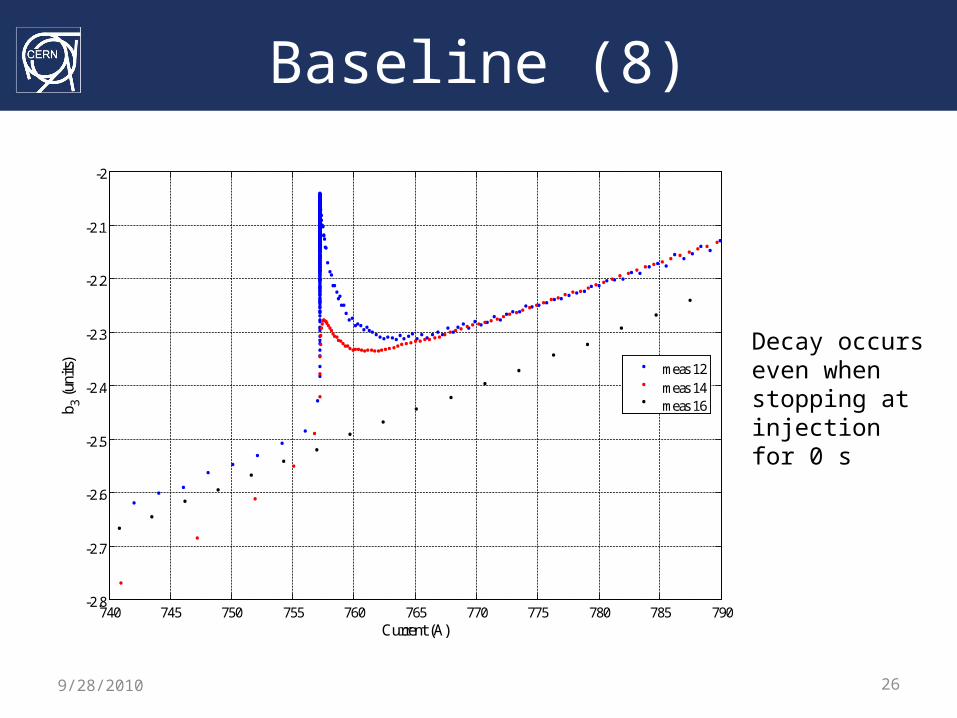
12 10 A/s 6 kA 0 s 1000 s 1000 s
14 10 A/s 6 kA 0 s - 0 s
16 10 A/s 6 kA 0 s - -
26
Baseline (8)
740 745 750 755 760 765 770 775 780 785 790-2.8
-2.7
-2.6
-2.5
-2.4
-2.3
-2.2
-2.1
-2
Current (A)
b 3 (uni
ts)
meas 12meas 14meas 16
9/28/2010
Decay occurs even when stopping at injection for 0 s

27
Baseline (9)
9/28/2010
0 1000 2000 3000 4000 5000 6000 7000 8000 9000 100000
2000
4000
6000
8000
10000
12000
Time (s)
Cur
rent
(A)
meas 18meas 19meas 20meas 21meas 22meas 23
18 10 A/s 11.85 kA 0 s 1000 s 1000 s
19 10 A/s 11.85 kA 0 s - 1000 s
20 10 A/s 11.85 kA 0 s 1000 s 0 s
21 10 A/s 11.85 kA 0 s 1000 s -
22 10 A/s 11.85 kA 0 s - 0 s
23 10 A/s 11.85 kA 0 s - -

28
Baseline (10)meas 18 meas 19 meas 20 meas 21 meas 22 meas 23 units
Flattop current, 11.85 kA for 0 0 0 0 0 0 s
Pre-cycle ramp-down
P -0.05 -0.05 -0.05 -0.05 -0.05 -0.05 As-2
E 0 0 0 0 0 0 sL -10 -10 -10 -10 -10 -10 As-1
P 0.05 0.05 0.05 0.05 0.05 0.05 As-2
Stop at 350 A for 0 0 0 0 0 0 s
Going to pre-injection
P 0.05 - 0.05 0.05 - - As-2
E 0 - 0 0 - - sL - - - - - - As-1
P -0.05 - -0.05 -0.05 - - As-2
Pre-injection porch, 500 A for 1000 - 1000 1000 - - s
Going to injection
P 1.5 1.5 1.5 - 1.5 - As-2
E 0 0 0 - 0 - sL 10 10 10 - 10 - As-1
P -1.5 -1.5 -1.5 - -1.5 - As-2
Injection plateau, 760 A for 1000 1000 0 - 0 - s
Ramp-up
P 0.0089 0.0089 0.0089 0.0089 0.089 1.5 As-2
E 0 0 300 0 300 0 sL 10 10 10 10 10 10 As-1
P -0.176 -0.176 -0.179 -0.18 -0.18 -1.5 As-2
Flattop current, 11.85 kA for 1000 1000 0 0 0 0 s
9/28/2010

29
Baseline (11)
9/28/2010
• Note how measurements 19, 22 and 23 take a different path then the others • This can be the effect of the fast PELP used to ramp up from 350 A to the next level • Measurements 18 and 20 join these three when using the same PELP• Decay occurs even when stopping at injection for 0 s
30
Conclusion
• Linear correlation has been confirmed once again• The flattop current scaling law has been confirmed• The ramp rate scaling law was extended to a lower value of
2 A/s, and it was found that the decay amplitude was a factor of 2 less, not 5.
• PELP values used to go from one plateau to the other (even between the pre-injection and the injection plateau) affects the amount of decay. – This was concluded after comparing two different ramps which
were used in two separate measurement campaigns.• Decay also occurs when a stop for 0 s followed by a slow
acceleration (restart of PELP) is done.9/28/2010

Analysis of August-September measurements
CERN, FiDeL meeting, 28th September 2010

32
List of measurementsMeasurement name DescriptionMeasurement 1 Actual pre-cycle up to 6kA (up-10A/s, down-10A/s), physics run up to 6kA (up-2A/s, down-
10A/s)Measurement 2 Physics run as pre-cycle (up-2A/s, down-10A/s), physics run up to 6kA (up-2A/s, down-
10A/s) (#1 and #2 are combined in 1 measurement)
Measurement 3 Actual pre-cycle up to 6kA (up-10A/s, down-10A/s), physics run up to 6kA (up-10A/s, down-10A/s)
Measurement 4 Physics run as pre-cycle (up-10A/s, down-10A/s), physics run up to 6kA (up-10A/s, down-10A/s) (#3 and #4 are combined in 1 measurement)
Measurement 5 Physics run as pre-cycle (up-10A/s, down-10A/s), physics run up to 6kA (up-10A/s, down-10A/s), normal with no E
Measurement 6 Physics run as pre-cycle (up-10A/s, down-10A/s), physics run up to 6kA (up-10A/s, down-10A/s), 2 times normal, no E
Measurement 7 Physics run as pre-cycle (up-10A/s, down-10A/s), physics run up to 6kA (up-10A/s, down-10A/s), 4 times normal, no E
Measurement 8 Physics run as pre-cycle (up-10A/s, down-10A/s), physics run up to 6kA (up-10A/s, down-10A/s), 4 times normal, no E, no flattop
Measurement 9 Physics run as pre-cycle (up-10A/s, down-10A/s), physics run up to 6kA (up-10A/s, down-10A/s), 4 times normal, no E, fast parabolic
9/28/2010

33
Aim of the measurements
• Difference between using an actual pre-cycle as a pre-cycle and using the previous physics run as a pre-cycle
• Effect of ramping up with 2 A/s and ramping down with 10 A/s.
• Modifying the PELP
9/28/2010

34
Aim of measurements 1 to 4
0 2000 4000 6000 8000 10000 12000 14000 16000 180000
1000
2000
3000
4000
5000
6000
7000
Time (s)
Cur
rent
(A)
meas 1+2
9/28/2010
• Difference between using an actual pre-cycle and a physics run as a pre-cycle• The effect of ramping up with 2 A/s and down with 10 A/s
• End of July, ramp up and ramp down rates of pre-cycle were 10 A/s, ramp up of physics run was 10 A/s and ramp down was 2 A/s
0 2000 4000 6000 8000 10000 12000 140000
1000
2000
3000
4000
5000
6000
7000
Time (s)
Cur
rent
(A)
meas 3+4
35
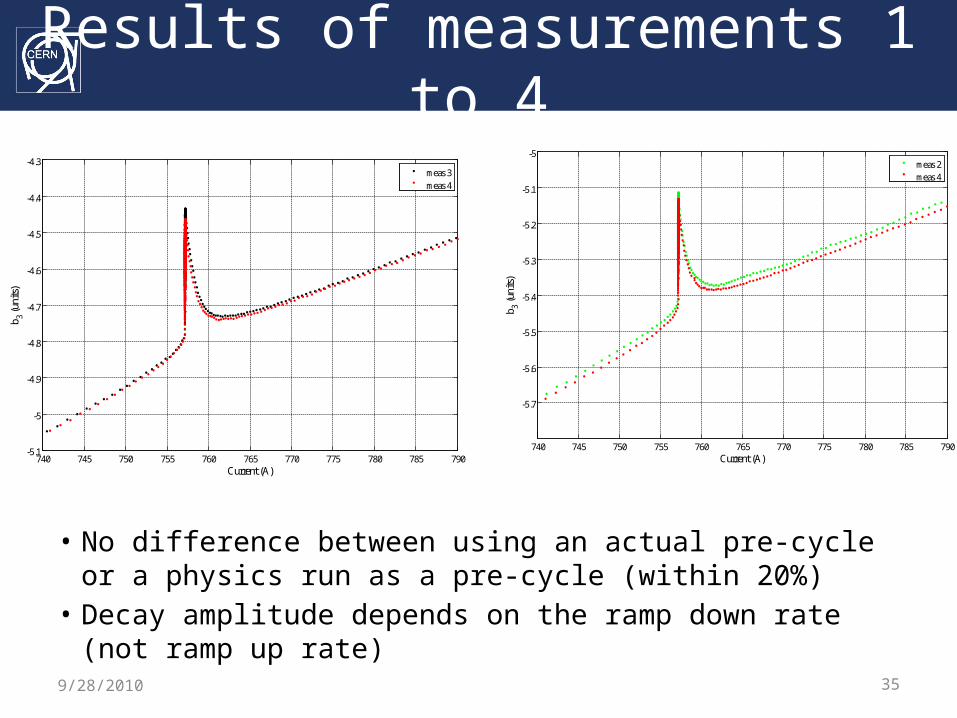
Results of measurements 1 to 4
• No difference between using an actual pre-cycle or a physics run as a pre-cycle (within 20%)
• Decay amplitude depends on the ramp down rate (not ramp up rate)
9/28/2010
740 745 750 755 760 765 770 775 780 785 790-5.1
-5
-4.9
-4.8
-4.7
-4.6
-4.5
-4.4
-4.3
Current (A)
b 3 (uni
ts)
meas 3meas 4
740 745 750 755 760 765 770 775 780 785 790
-5.7
-5.6
-5.5
-5.4
-5.3
-5.2
-5.1
-5
Current (A)
b 3 (uni
ts)
meas 2meas 4

36
Measurements 4 and 5
• Aim:– Exponential part of the ramp removed (PLP)
• Result– No effect on the decay amplitude
9/28/2010
0 2000 4000 6000 8000 10000 120000
1000
2000
3000
4000
5000
6000
7000
Time (s)
Cur
rent
(A)
meas 4meas 5
740 745 750 755 760 765 770 775 780 785 790-5.1
-5
-4.9
-4.8
-4.7
-4.6
-4.5
-4.4
-4.3
Current (A)
b 3 (uni
ts)
meas 4meas 5

37
Measurements 5 to 7
• Aim– Increasing the P term in the PLP
• Result– No difference in the decay amplitude
9/28/2010
0 1000 2000 3000 4000 5000 6000 7000 8000 9000 100000
1000
2000
3000
4000
5000
6000
7000
Time (s)
Cur
rent
(A)
meas 5meas 6meas 7
38
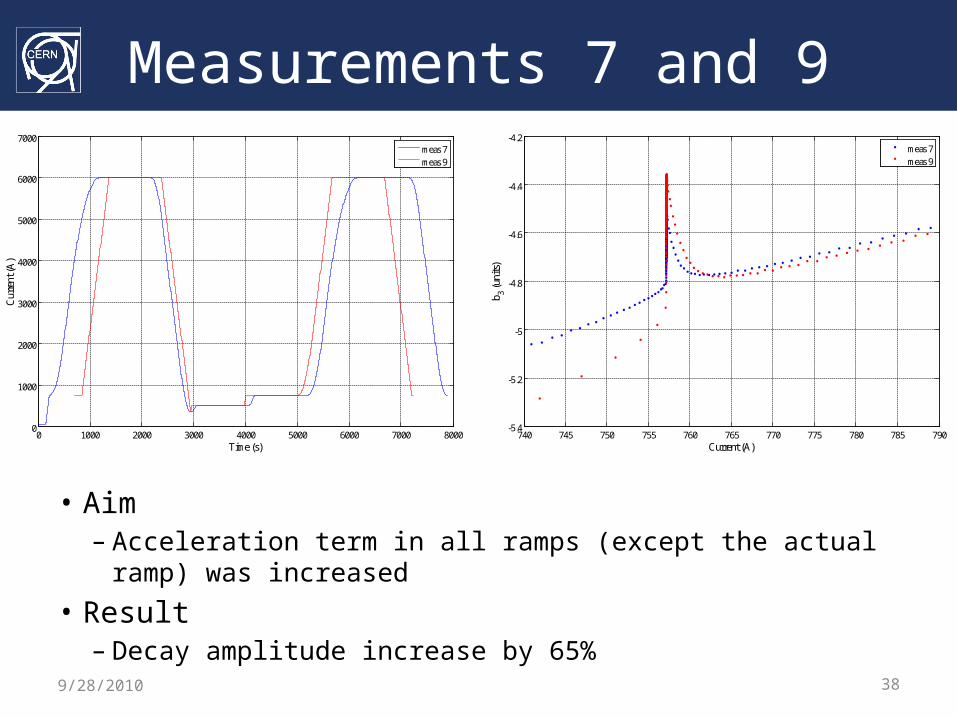
Measurements 7 and 9
• Aim– Acceleration term in all ramps (except the actual ramp) was increased
• Result– Decay amplitude increase by 65%
9/28/2010
0 1000 2000 3000 4000 5000 6000 7000 80000
1000
2000
3000
4000
5000
6000
7000
Time (s)
Cur
rent
(A)
meas 7meas 9
740 745 750 755 760 765 770 775 780 785 790-5.4
-5.2
-5
-4.8
-4.6
-4.4
-4.2
Current (A)
b 3 (uni
ts)
meas 7meas 9

39
Measurements 7 and 9
• Result– Different path taken by measurement 9 because of the fast
acceleration used9/28/2010