Analysis of interviews with people holding multiple jobs ...
35
Analysis of interviews with people holding multiple jobs in the café and restaurant sector by Julie Warren Luke Procter Working paper No. 7 Multiple Job Holding in New Zealand (FRST Research Project TBAX0204) Taylor Baines & Associates June 2004 ISSN 1176-3523
Transcript of Analysis of interviews with people holding multiple jobs ...

Analysis of interviews with people holding multiple jobs in the caféand restaurant sector
byJulie WarrenLuke Procter
Working paper No. 7Multiple Job Holding in New Zealand
(FRST Research Project TBAX0204)
Taylor Baines & AssociatesJune 2004
ISSN 1176-3523

CONTENTS
1 Introduction .................................................................................................................................. 11.1 Research objectives ........................................................................................................... 11.2 Multiple job holding in the hospitality sector ................................................................... 11.3 Method .............................................................................................................................. 3
2 Current and past work ................................................................................................................ 42.1 Current work ..................................................................................................................... 42.2 Length of employment ...................................................................................................... 62.3 Daily and weekly work arrangements ............................................................................... 82.4 Extra curricular activities .................................................................................................. 9
3 Getting to work .......................................................................................................................... 10
4 Work History .............................................................................................................................. 12
5 Factors Behind Multiple Job Holding ...................................................................................... 135.1 Reasons for having more than one job ............................................................................ 135.2 Issues around finding work ............................................................................................. 145.3 Effects of changes in the hospitality sector on finding jobs ........................................... 15
6 Qualifications, skills, experience and pathways to work ........................................................ 196.1 Qualifications, skills and work experience ..................................................................... 196.2 Pathways into work ......................................................................................................... 20
7 The effects of multiple job holding ........................................................................................... 227.1 Benefits of more than one job ......................................................................................... 227.2 Effects of more than one job ........................................................................................... 237.3 Work expectations .......................................................................................................... 24
8 Income and standard of living .................................................................................................. 27
APPENDIX 1: Further information on respondents ................................................................................ 30
APPENDIX 2: Total hours worked by reasons for and benefits of, multiple job holding; importance tostandard of living; and overall impact ............................................................................. 32
LIST OF TABLES
Table 1 Multiple job holding in the New Zealand hospitality sector, 2001 ................................................ 2Table 2 Multiple job holding in the Wellington hospitality sector, 2001 .................................................... 2Table 3 Multiple job holding in the Christchurch hospitality sector, 2001 ................................................. 3Table 4 Main occupation, main job and other jobs ...................................................................................... 4Table 5 Main job and other jobs - hours worked during most recent working week .................................. 6Table 6 All jobs - total hours worked during the most recent working week .............................................. 6Table 7 Length of time worked by respondents in their main jobs .............................................................. 7Table 8 Activities undertaken in the past year considered to be a job ......................................................... 7Table 9 Usual number of days worked in jobs ............................................................................................. 8Table 10 Usual times of the day worked in jobs ............................................................................................ 9Table 11 Activities respondent spends a lot of time on ................................................................................. 9Table 12 Location of main, second and third jobs ....................................................................................... 10Table 13 Means of travel to work ................................................................................................................ 10Table 14 Travel time to jobs ........................................................................................................................ 11Table 15 Problems getting to work .............................................................................................................. 11Table 16 Types of jobs previously held ....................................................................................................... 12Table 17 Reasons for having more than one job .......................................................................................... 12Table 18 Incentives for multiple job holding ............................................................................................... 13Table 19 Further reasons for having more than one job .............................................................................. 14Table 20 Degree of difficulty finding work in main occupation ................................................................. 14Table 21 Explanation for ease or difficulty finding work in main occupation ............................................ 15Table 22 Degree of difficulty finding work in other jobs ............................................................................ 15Table 23 Explanation of how easy or difficult it is to find work ................................................................. 15Table 24 Finding work in hospitality sector given changes over last 10 years ........................................... 16Table 25 Effects of change in hospitality sector on finding work ............................................................... 16Table 26 Suggested reasons for multiple job holding in cafes and restaurants ........................................... 16Table 27 Changes in workplaces that have affected jobs ........................................................................... 17Table 28 Effect of changes in personal or family circumstances on respondents’ decision to hold current
jobs ................................................................................................................................................ 18Table 29 Highest qualifications of respondent ............................................................................................ 19Table 30 Other skills and work experience that help respondent get work ................................................. 19Table 31 Nature of match between skills experience and current jobs ....................................................... 20Table 32 Reasons for lack of match between skills experience and current jobs ........................................ 20Table 33 Sources of assistance for getting current work ............................................................................. 21Table 34 Benefits to respondent of multiple job holding ............................................................................ 22Table 35 Effect of multiple job holding on personal and family life .......................................................... 24Table 36 Factors that would make having more than one job better .......................................................... 24Table 37 Factors that would make having more than one job worse .......................................................... 25Table 38 Ideal job/mix of jobs ..................................................................................................................... 25Table 39 Steps needed to reach ideal situation ............................................................................................ 25Table 40 Expected length of time in multiple job holding .......................................................................... 26Table 41 Overall personal view of MJH ...................................................................................................... 26Table 42 Total pre-tax income from all sources 2002-3 .............................................................................. 27Table 43 Importance of income to household .............................................................................................. 27Table 44 Comments on importance of income to households ..................................................................... 28Table 45 Importance of multiple job holding to standard of living ............................................................. 28Table 46 Comments on importance of multiple job holding to standard of living ...................................... 28Table 47 Comparison of respondents’ standard of living with that of friends and family .......................... 29Table 48 Sex of respondents ........................................................................................................................ 30Table 49 Ethnicity of respondents ............................................................................................................... 30Table 50 Café/Restaurant respondent’s by age ............................................................................................ 30Table 51 Number of other members in respondent’s household ................................................................. 31Table 52 Households with other multiple job holders ................................................................................. 31Table 53 Total hours worked per week by reasons for having more than one job (n=59) .......................... 32Table 54 Total hours per week by benefits of having more than one job .................................................... 32Table 55 Total hours worked per week by importance of multiple job holding to current standard of
living ............................................................................................................................................. 32Table 56 Total hours worked per week by overall impact of multiple job holding ..................................... 32

1 The research is funded by the Foundation for Research, Science and Technology, contract TBAX0204.
1
1 Introduction
1.1 Research objectives
This report covers analysis of results from interviews with 60 men and women who are multiple jobholders, with at least one of those jobs in the café and restaurant sector. These interviews were part ofa research programme on multiple job holding (MJH) in New Zealand.
The purpose of this research programme1 is to provide knowledge about the way individuals, familiesand communities are adapting to social and economic change through multiple job holding. Theprogramme complements and extends previous research into the characteristics of work in naturalresource sectors to provide comprehensive information on multiple job holding across a range ofsectors. It is anticipated that the research findings will be useful to a range of agencies and groupsinvolved in social and economic policy, including for the hospitality sector, and to communities asthey respond to a range of social and economic changes.
The research, which began in 2001 and is contracted through to 2007, has two main objectives. Thework in these objectives is focused on:
• developing a profile of multiple job holding in New Zealand over recent years, using datafrom the 2001 Census, the Time Use Survey 1998/9, the NZ Household Labour Force Surveyseries, and a longitudinal analysis of census data on the workforce 1981-2001
• identifying factors which encourage or inhibit the adoption of multiple job holding as a changestrategy, and determining the impacts of multiple job holding on individuals, families andcommunities, through a survey of three sectors in 2003 - café and restaurant workers, farmmen and women and health professionals - with a second round of interviews over threefurther sectors to follow.
The aim of the working paper is to provide basic quantitative and qualitative results from the survey. Further commentary and interpretation of these results will be provided in papers and publicationsthat draw on this basic survey material, as well as the analysis of census data on multiple job holdingby restaurant and café workers.
1.2 Multiple job holding in the hospitality sector
Café and restaurant workers are part of the wider hospitality sector. The research focused on thehospitality sector because multiple job holding amongst café and restaurant workers is relatively highcompared with other occupational areas. In 2001 (the most recent census) more than 62,000 peoplewere employed as café or restaurant workers. Almost two thirds (64%) were female. Overall, 8.9 percent of these workers were multiple job holders. However, multiple job holding was more prevalentamongst female workers (at 9.3%) than male workers (8.3%). See Table 1 below for further detail. For both males and females, multiple job holding was more common amongst the occupational groupsof waiters and bartenders.

2
Table 1 Multiple job holding in the New Zealand hospitality sector, 2001Occupation Multiple job holders Total work force MJH rate %
Female Male Female Male Female MaleRestaurant or Tavern Manager 189 192 2,124 2,211 8.9 8.7
Chef 234 330 3,387 6,117 7 5.4
Cook 435 183 4,722 2,607 9.3 7.1
Wine Waiter 3 6 39 27 8.3 22.2
Waiter 1,128 249 9,552 2,280 11.9 11.1
Catering Counter Assistant 831 312 10,095 3,591 8.3 8.8
Kitchenhand 498 327 6,333 3,375 7.93 9.8
Bartender 381 294 3,543 2,589 10.8 11.5
Total 3,699 1,893 39,795 22,797 9.3 8.3
The 2001 census data shows the prevalence of multiple job holding differed for Wellington andChristchurch-based hospitality sector workers. As in Tables 2 and 3, multiple job holding wasconsiderably more prevalent in Wellington (10.4% of females and 9.8%of males) compared withChristchurch (8.5% and 7.5% respectively). However, the profiles of workers in the two cities alsodiffer: in Wellington 51 per cent of the workers were female, compared with 61 per cent inChristchurch. In both Wellington and Christchurch, as nationally, multiple job holding was generallymost prevalent amongst waiters and bartenders.
Table 2 Multiple job holding in the Wellington hospitality sector, 2001Occupation Multiple job holders Total work force MJH rate %
Female Male Female Male Female MaleRestaurant or Tavern Manager 3 15 114 150 2.6 10.2
Chef 9 18 195 489 4.6 3.7
Cook 12 18 141 186 8.5 9.7
Wine Waiter 0 0 3 6 0 0
Waiter 93 30 609 222 15.4 13.5
Catering Counter Assistant 51 39 516 324 10.1 12.3
Kitchenhand 24 36 234 309 10.3 11.8
Bartender 12 30 141 219 8.7 13.7
Total - café & restaurant workers 204 186 1,953 1,905 10.4 9.8

2 Interviews were conducted by Luke Procter, Margie Scotts and Nicola Robertson and analysed by LukeProcter and Julie Warren. Illustrative vignettes were prepared by Wayne McClintock. The researchteam is grateful for the cooperation of all who took part in these interviews.
3
Table 3 Multiple job holding in the Christchurch hospitality sector, 2001Occupation Multiple job holders Total work force MJH rate %
Female Male Female Male Female MaleRestaurant or Tavern Manager 18 12 231 210 7.9 5.9
Chef 18 45 345 747 5.3 6.1
Cook 24 9 366 234 6.7 3.9
Wine Waiter 0 0 3 0 0 0
Waiter 108 24 1,086 285 10.1 8.7
Catering Counter Assistant 90 33 1,026 363 8.9 9.2
Kitchenhand 48 42 642 423 7.6 10.1
Bartender 42 27 396 309 10.6 8.9
Total - café & restaurant workers 348 192 4,095 2,571 8.5 7.5
1.3 Method
As part of the second research objective, a sample of 60 café and restaurant workers was interviewedin Wellington and Christchurch cities in 2003. They were identified through a direct approach toworkplaces, local contacts and snow-balling (that is, asking respondents to identify potential people tointerview that met the MJH criteria). The sex breakdown of respondents was 20 males (33%) and 40females (67%). Further background information is available in Appendix 1.
The principal definition of multiple job holding used in these interviews was participation in paid orunpaid work for more than one employer or family business in the course of the most recent week. Those who did not qualify by this criteria were screened out of the research at the beginning of theinterview and this interview was not included in this analysis. The interviews were based on acomprehensive schedule combining closed and open questions and typically took around one to oneand a half hours to complete2.
Here are some of the key experiences from carrying out this research:• there were not as many cafés and restaurants with multiple job holders as expected• there were not as many multiple job holders that were able to identify other multiple job
holders as expected• some participants were concerned that researchers would pass on information to agencies, thus
putting their cash under-the-table jobs at risk• the research method (for instance snow-balling) may have shaped the profile of the sample
recruited versus the census profile• there were difficulties trying to locate café and restaurant workers through their managers
(who may not have passed on information).
Some respondents reported that they enjoyed being able to reflect and evaluate how their current worksituation affected the rest of their lives.

4
Funding for overseas travelC (age 27) is a gym instructor who has a main job asa barista during the day and a third job one eveningper week as a barmaid. A qualified chef, she alsohas a polytechnic qualification in fitness training.Her roster at the gym is scheduled for evenings andSaturdays. In the most recent week C worked 35hours as a barista, 18 hours as a gym instructor and6½ hours as a barmaid. She has held these threejobs for six months to earn money to travel overseas,and expected to leave New Zealand shortly after theinterview. When C has a more settled lifestyle sheintends to become a self-employed personal trainerand work for 30-35 hours per week.
A pattern of multiple job holdingF (age 21), a gym receptionist, had only one paper tocomplete for a university degree. As well as spending 21hours at a gym during the most recent week she had worked7 hours at a café and 7 hours as a volunteer for a drug test.Over the past year she had held several casual paid positionsas a nanny, babysitter, and receptionist’s assistant at a dentalpractice. Before then F had been a multiple job holder on twooccasions, and intends to do so over the long-term.
2 Current and past work
2.1 Current work
In general, respondents were working in their identifiedoccupation as their main job. Table 4 shows the occupations ofthe café and restaurant workers as well as the nature of theirmain job, and their second and third jobs. By far the mostcommonly identified occupation was café worker. Café workerwas also identified as the most commonly held job, whether as amain job or as second or third job. The second most commonlyidentified occupation was barista, and this was also the secondmost commonly identified main job. Twelve percent of thoseidentified described their occupation as student.
Table 4 Main occupation, main job and other jobsType of job Occupation % Main job % 2nd job % 3rd Job %Café worker 19 32 27 45 28 47 3 5
Barista 10 17 12 20 2 3
Café owner/manager 7 12 7 12 3 5
Student 7 12
Performer/musician/dj 4 7 1 2 4 7 3 5
Fitness/trainer/instructor 3 5 1 2 1 2 1 2
Retail/sales 2 3 5 8 3 5 1 2
Teacher/Tutor 4 7
Caregiver 3 5 1 2
Cleaner 2 3
Office worker 1 2 3 5
Other 7 12 6 10 9 15 6 10
Not specified/applicable 1 2 1 2 42 70
Total 60 100 60 100 60 100 60 100
In addition to the occupations listed in Table 4, respondents identified the following:• media consultant• mum - most time• espresso technician• tiler• beauty therapist• IT• gym receptionist.
In addition to the main jobs identified in Table 4, respondents identified the following:• postie• receptionist at gym• nannying• distributor (music)• media consultant• espresso technician.

5
A short-term strategy for overseas travelH (age 30) is a trainer by occupation, and lives alone. She has twopositions in the hospitality sector and worked for 74 hours in the mostrecent week. She travels 20 minutes by train to her main job at a caféin the city centre, and 10 minutes by car to her second job as a barmanager in a nearby suburb. H took a second job in a café a fewmonths before the interview so she could save for overseas travel. Overthe previous year she had also worked in an unpaid capacity as anexercise instructor at a local gym.
Short-term plansE (age 24) has a university degree and is astudent of midwifery. She resides withthree other people. In her most recentweek she had worked 40 hours as a chef,12 hours as a barista, and 17 hours as aself employed caterer. Earlier in the yearE had owned a café, and she anticipatesholding more than one job for less than ayear.
A longer term employment strategyG (age 35) shares a household with his wife and twodaughters. He is a media consultant and café managerwho spent 78 hours in these positions during his mostrecent working week. This is the fourth occasion Ghas been a multiple job holder since entering theworkforce. On three earlier occasions he held two jobsover a period of seven years for financial and socialreasons, and expects that he will pursue this strategyfor at least three more years. job holder on twooccasions, and intends to do so over the long-term.
In addition to the second jobs identified in Table 4, respondents identified the following:
• projectionist• painter• life drawing modelling• beauty therapy• property investment• coat check (nightclub)• designers assistant• rental houses• merchandising.
In addition to the third jobs identified in Table 4, respondents identified the following:• drug test volunteer• usher• health assessments• farm• self employed designer• food styling.
Three quarters of the respondents were working in their main jobs for less than 40 hours a week. AsTable 5 shows, ten percent were working fifty hours or more per week in their main jobs with furtherhours worked in their second and third jobs.
Fifteen percent of respondents were working 20 hours or morein their second job; one respondent was working more than 40hours per week in their second job with total hours workedexceeding 80 hours. One respondent’s reaction to interviewquestions around lifestyle and the effects of MJH exposed thestress long work hours had created for her. She became verytearful as she counted up the number of hours worked in theprevious week.
Most respondents with three jobs were working less than 10 hours per week in their third job.
The total hours worked, as shown in Table 6 showthat most respondents were working for more than40 hours per week. In fact, 61 per cent wereworking 40 hours or more. Sixteen percent wereworking 60 hours or more in their most recentworking week.

6
Table 5 Main job and other jobs - hours worked during most recent working weekHours per week Main job Second job Third job
Number Per cent Number Per cent Number Per centLess than 10 3 5 27 45 14 23
38643 13 22 23 38 2 3
20-29 13 22 6 10 1 2
30-39 15 25 2 3
40-49 10 17 1 2
50-59 3 5
60-69 2 3
70+ 1 2
Not applicable 1 2 43 72
Total 60 101 60 100 60 100
Table 6 All jobs - total hours worked during the most recent working weekHours per week Total hours
Number Per cent38643 8 13
20-29 7 12
30-39 8 13
40-49 17 28
50-59 10 17
60-69 5 8
70-79 3 5
80 & over 2 3
Total 60 100
2.2 Length of employment
The period of time respondents had worked in their main and other jobs (Table 7) reflected theircomparatively young age, (the majority were under 25 year of age). Almost 70 per cent had been intheir main job for less than a year. Twenty percent had worked in their main job for two years ormore.
A similar pattern is apparent for their second and third job tenure. That is, almost 70 per cent ofrespondents had spent less than a year in their second job, and two thirds had been in their third jobfor less than a year.

7
Table 7 Length of time worked by respondents in their main jobsTime Main job Second job Third job (n=17)
Number Per cent Number Per cent Number Per cent>1 Month 5 8 3 5 3 18
1-2 Months 6 10 9 15 0 0
3-4 Months 12 20 4 7 3 18
5-7 Months 12 20 15 25 5 28
8-11 Months 6 10 9 15 0 0
12-23 Months 7 12 7 12 3 18
2 years and over 12 20 13 22 3 18
Total 60 100 60 101 17 100
Respondents were also asked about other jobs they may have had in the last month that were notincluded in their job mix. That nearly a quarter of the respondents (22%) indicated they had workedin another job in the last month may indicate the general instability of their job tenure. These otherjobs ranged from café/restaurant work and catering and bar work, through to dance teaching, babysitting and farming. Respondents had worked in these jobs from anywhere between 4 months and 2years.
Thirty-five respondents (58%) had held other jobs, so far not listed, in the previous year. The range ofjobs they identified in the past year are listed in Table 8. Some respondents had held up to five otherjobs (paid or unpaid) in the past year.
Table 8 Activities undertaken in the past year considered to be a jobActivity Responses Per cent of respondents
(n=35)Café/restaurant/bar work 31 48
Administration/office work 8 13
Voluntary work 5 8
Retail 3 5
Landscaping/gardening 2 3
Camp counsellor 2 3
Parent/caring for family 2 3
Baby sitting/nanny 2 3
Other 9 14
Total responses 64 100
Seasonal work was relatively uncommon. Five respondents (8%) indicated that they had undertakenseasonal work in the past, always in summer. The jobs described were cherry selling, catering work,vineyard work, kiwifruit and apple thinning and dressmaking.

8
2.3 Daily and weekly work arrangements
Respondents’ daily and weekly work arrangements varied considerably. For some respondents, theirworking weeks comprised some full days in one job, and other full days in their second and maybethird jobs. For other respondents, they might work full days in one job, and evenings and part days intheir second and maybe third jobs. For a third group their working week comprised short shifts (thatis less than 8 hours) in more than one job.
As Table 9 shows, the biggest percentage of respondents (27%) worked in their main job for five daysper week. The next biggest group (22%) worked in their main jobs for three days per week. Seventeen percent worked in their main job for six or seven days per week. For 10 per cent ofrespondents stated that the days per week worked in their main job varied as required. A further 15per cent of respondents worked only one or two days in their main job per week.
The patterns of weekly work for second jobs were quite different. The largest group (37%) worked intheir second job over two days of the week. The second largest group (28%) worked in their secondjob for only one day per week.
The patterns of work for third jobs were similar to that of second jobs. That is, 50 per cent ofrespondents worked at their third job on one day per week and 31 per cent of respondents worked intheir third job over two days of the week.
It was relatively rare for respondents to work in their second and third jobs on three or more days ofthe week.
Table 9 Usual number of days worked in jobsNumber of Days Main job Second job Third job
Number Per cent Number Per cent Number Per centOne day 2 3 17 28 8 50
Two days 7 12 22 37 5 31
Three Days 13 22 4 7 0 0
Four Days 6 10 4 7 0 0
Five Days 16 27 3 5 1 6
Six Days 7 12 2 3 0 0
Seven Days 3 5 0 0 1 6
Varies/as required 6 10 8 13 1 6
Total 60 100 60 100 16 100
The times of day that respondents worked in cafes and restaurants is interesting, for it suggests thatcafes and restaurants tend to be open during day time. However it may reflect the time of day theresearch was carried out - during normal working hours. Research results also show that café andrestaurant workers have predictable and stable shifts. Most respondents (43%) indicated that theywork in their main jobs during the day. The next largest group (28%) worked in day and eveningshifts. Thirteen percent indicated evening shifts for their main job. Only five percent indicated thatthe times of day they work vary.
Similar patterns were apparent for second jobs, where 48 per cent of respondents worked during theday. However, a larger group compared with main jobs (23% compared with 13%) worked eveningshifts in their second jobs.

9
Combining study with workD, a 20 year old student, works as a postman and adishwasher at a café. He lives at home with his parents andsister who also is a multiple job holder. D usually works onemorning and one evening per week, and clocked up a total of9½ hours in the most recent week. Outside term time heworks more hours as a postman, while his actual hours at the
In their third jobs the largest group (44%) worked evening shifts. See Table 10 for more details.
Table 10 Usual times of the day worked in jobsTime of day Main job Second job Third job
Number Per cent Number Per cent Number Per centMorning 4 7 2 3 2 13
Morning/day 2 3 0 0 1 6
Day 26 43 29 48 3 19
Day/evening 17 28 6 10 0 0
Evening 8 13 14 23 7 44
Varies 3 5 9 15 3 19
Total 60 100 60 100 16 100
2.4 Extra curricular activities
The other activities that respondents were involved in canbe loosely grouped as domestic/family activities and study. Almost half the respondents identified household work orchildcare activities. Thirty-one percent identified study,and a small group (8%) were involved incommunity/volunteer activities.
Table 11 Activities respondent spends a lot of time onActivities Responses Per cent of respondents
(n=51)Household work 21 34Studying 19 31
Childcare 7 11
Community/volunteer 5 8
None of these 10 16
Total responses 62 na

10
3 Getting to work
Respondents were asked a group of questions around where their jobs were located, how they got towork, how long it took and if they experienced any problems getting to work. For café and restaurantworkers interviewed for this work, the vast majority worked in a city location. For the main job 73per cent worked in the city, for their second job 58 per cent worked in the city, and for their third job43 per cent worked in the city. As Table 12 shows, respondents were increasingly likely to work insuburban areas for their second and third jobs.
Most respondents travelled to work by car or motorcycle. However, while 37 per cent walked to theirmain job, increasingly smaller percentages walked to their second and their third jobs. Conversely,while 43 per cent travelled by car or motorcycle, 50 per cent travelled like this to their third job. Similar proportions used public transport across all jobs. These patterns of means of travel areconsistent with location information. That is, second and third jobs were suburban.
The time it took most respondents to get to work tended to reflect both the mid-city location of theirjobs and increasing city living. So, almost half of the respondents spent less than 15 minutes gettingto their main jobs, 40 per cent of those with second jobs spent less than 15 minutes getting to thosejobs, and 40 per cent of those with third jobs spent less than 15 minutes getting to them. It was rarefor people to spend more than thirty minutes getting to their main job; only 7 per cent spent more thanthirty minutes. However, the time taken to get to second and third jobs was often longer, reflectingthe more common suburban location of these jobs. So, 17 per cent of those with second jobs and 20per cent of those with third jobs spent more than 30 minutes getting to them.
Table 15 shows that nearly a quarter (23%) of respondents encountered problems getting to and fromwork.
Table 12 Location of main, second and third jobsLocation Main job Second job Third job
Number Per cent Number Per cent Number Per centCity 44 73 35 58 7 44
Suburb 13 22 17 28 7 44
Minor Urban 1 2 0 0 0 0
Other 2 3 8 13 2 13
Total 60 100 60 100 16 100
Table 13 Means of travel to workMeans of travel Main job Second job Third job
Number Per cent Number Per cent Number Per centWalk 22 37 19 32 4 25
Cycle 1 2 2 3 0 0
Car/motorcycle 26 43 26 43 8 50
Public Transport 8 13 8 13 2 13
Other 2 3 4 7 1 6
Combinations 1 2 1 2 1 6
Total 60 100 60 100 16 100

11
Table 14 Travel time to jobsTravel time Main job Second job Third job
Number Per cent Number Per cent Number Per centLess than 5 minutes 3 5 4 7 1 7
5-9 minutes 12 20 8 14 2 13
10-14 minutes 11 18 11 19 3 20
15-19 minutes 14 23 6 10 0 0
20-29 minutes 16 27 13 22 3 20
30-59 minutes 4 7 10 17 3 20
Varies 0 0 7 12 3 20
Total 60 100 59 100 15 100
Table 15 Problems getting to workProblem Responses Per centTime and cost 4 29
Public transport 5 36
Weather 4 29
Heavy load 1 7
Total responses 14 101Note: No response = no problem
12
4 WORK HISTORY
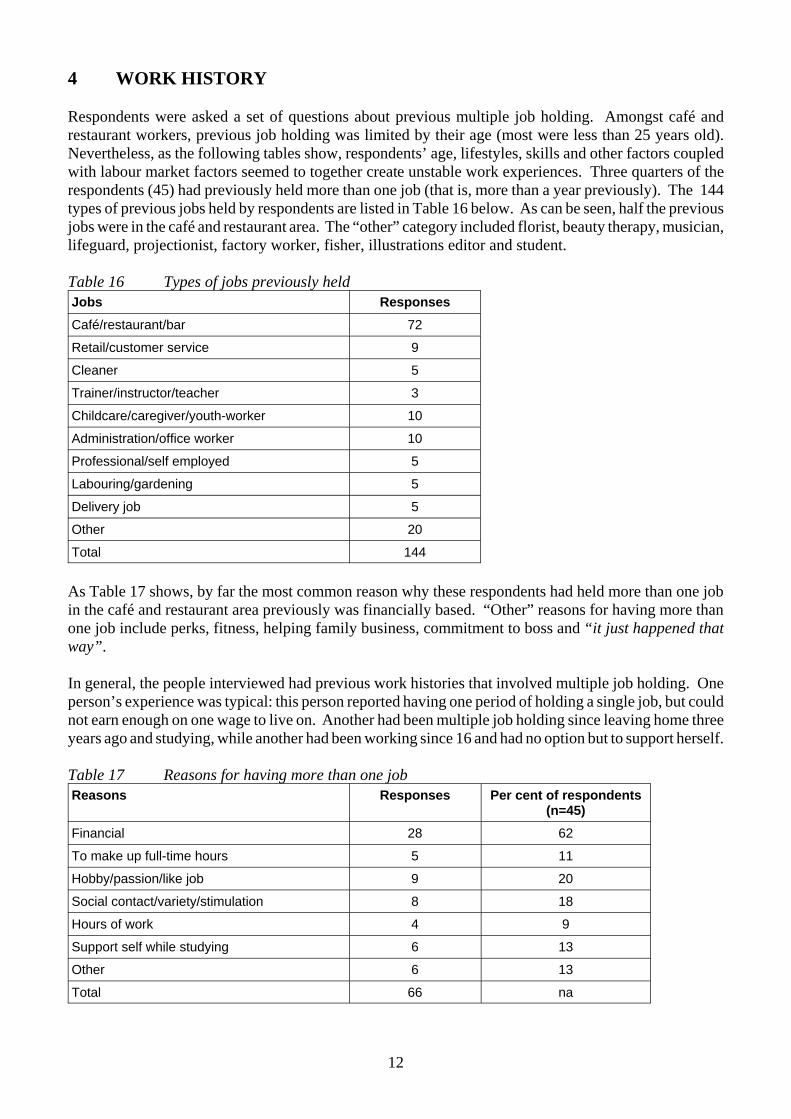
Respondents were asked a set of questions about previous multiple job holding. Amongst café andrestaurant workers, previous job holding was limited by their age (most were less than 25 years old).Nevertheless, as the following tables show, respondents’ age, lifestyles, skills and other factors coupledwith labour market factors seemed to together create unstable work experiences. Three quarters of therespondents (45) had previously held more than one job (that is, more than a year previously). The 144types of previous jobs held by respondents are listed in Table 16 below. As can be seen, half the previousjobs were in the café and restaurant area. The “other” category included florist, beauty therapy, musician,lifeguard, projectionist, factory worker, fisher, illustrations editor and student.
Table 16 Types of jobs previously heldJobs ResponsesCafé/restaurant/bar 72
Retail/customer service 9
Cleaner 5
Trainer/instructor/teacher 3
Childcare/caregiver/youth-worker 10
Administration/office worker 10
Professional/self employed 5
Labouring/gardening 5
Delivery job 5
Other 20
Total 144
As Table 17 shows, by far the most common reason why these respondents had held more than one jobin the café and restaurant area previously was financially based. “Other” reasons for having more thanone job include perks, fitness, helping family business, commitment to boss and “it just happened thatway”.
In general, the people interviewed had previous work histories that involved multiple job holding. Oneperson’s experience was typical: this person reported having one period of holding a single job, but couldnot earn enough on one wage to live on. Another had been multiple job holding since leaving home threeyears ago and studying, while another had been working since 16 and had no option but to support herself.
Table 17 Reasons for having more than one jobReasons Responses Per cent of respondents
(n=45)Financial 28 62
To make up full-time hours 5 11
Hobby/passion/like job 9 20
Social contact/variety/stimulation 8 18
Hours of work 4 9
Support self while studying 6 13
Other 6 13
Total 66 na

13
5 FACTORS BEHIND MULTIPLE JOB HOLDING
5.1 Reasons for having more than one job
This section focuses on why respondents had more than one job and their experiences of findingwork.
Respondents were asked to consider whether they were multiple job holders because they wanted to,or because they had to. As the table below shows, respondents reported the influence of both wantingand having to be a multiple job holder.
Table 19 provides a little more explanation. Of the 26 respondents who provided further explanation,10 related the reason to needing extra money (for instance to pay bills), six were in multiple jobholding because they enjoyed the variety, and four were saving to go overseas. “Other” reasonsinclude:
“Started doing one then eased into the other”“It helps my partner keep his business cost down”“No plan, I just like to follow my nose”“Balance and more responsibility”.
Interestingly, whether respondents were in more than one job because they had to or because theywanted to seemed to have little to do with the total number of hours they worked. For instance, thoseworking for less than 40 hours per week were far more likely to say they held more than one jobbecause they had to, than those working for 40 hours or more. Conversely, those working 40 hoursand more were more likely to say they held more than one job because they wanted to. In fact, morethan half of those who in more than one job because they wanted to were working 50 hours or moreper week.
Most of those working in more than one job because they had to were working part-time. It may bethat a large proportion of these were students and had to work in several part time-jobs, still with lowcollective hours, to support themselves (see Table 1 in Appendix 2).
Table 18 Incentives for multiple job holdingIncentives Responses Per centBecause I have to 12 20
Because I want to 22 37
Both 25 42
Neither 1 2
Don’t know 0 0
Total 60 100

14
Table 19 Further reasons for having more than one jobReasons Responses Per cent of respondents
(n=19)Extra money/bills 10 53
Enjoy - work/variety/flexibility 6 32
Saving for overseas 4 21
Better standard of living/lifestyle 3 16
Planned career move/investment 3 16
Other 6 32
Total 32 na
5.2 Issues around finding work
It was interesting to note how rarely respondents identified difficulties finding work in their identifiedoccupation or in other work as an explanation for multiple job holding. As Tables 20 to 23 show, onein three respondents indicated that finding work in their main occupation was very easy, and a furtherthird indicated that finding work was easy. Only 12 per cent indicated that finding work was difficultor very difficult. Table 21 provides a little more explanation. The most commonly identified reasonrelated to the availability of jobs in hospitality generally or in hospitality in Wellington. “Other”explanations include:
“Student Job Search makes it easier”“Just took it over and never had experience in hospitality prior”“New Zealanders seem unreliable and irresponsible”.
Responses were similar in relation to finding work in other jobs. In general, respondents found it easyrather than difficult to find work in other jobs. Table 23 lists further explanations for the ease ordifficulty in finding work.
Table 20 Degree of difficulty finding work in main occupationDegree of difficulty Number Per centVery easy 20 33
Easy 21 35
Moderate 9 15
Difficult 6 10
Very difficult 1 2
Not applicable 3 5
Total 60 100

15
Table 21 Explanation for ease or difficulty finding work in main occupationExplanation Responses Per cent of respondents
(n=58)Availability of jobs in hospitality 24 41
Experience/skills/personality 16 28
Need qualifications/skills/experience 9 16
Through friends/family/network 7 12
Lots competition/hard to break into 6 10
High turnover 5 9
Hard to say 3 5
Other 5 9
Total 75 na
Table 22 Degree of difficulty finding work in other jobsDegree of difficulty Responses Per cent of respondents
(n=52)Very easy 18 35
Easy 13 25
Moderate 9 17
Difficult 11 21
Very difficult 1 2
Total 52 na
Table 23 Explanation of how easy or difficult it is to find workExplanation Responses Per cent of respondents
(n=49)Through friend/family/network/agency 10 20
Need qualifications/skills/experience 9 18
Availability of jobs in hospitality/specific occupation/Wellington 8 16
Have experience/skills/personality 7 14
Lots of competition/hard to break into 7 14
“It’s easy” 6 12
Low skilled 4 8
Other 4 8
High turnover 3 6
Total 58 na
5.3 Effects of changes in the hospitality sector on finding jobs
Respondents were asked a set of questions around the characteristics of, and changes in, the hospitalitysector that might explain the availability of work. Respondents’ experiences need to be interpretedcarefully as most of their work lives were still relatively short (the majority were aged less than 25 years).Nevertheless, given that some had been working from a comparatively young age, respondents were stillable to make some observations about change in the sector and the impact of this on employment.

16
Most respondents indicated that it is easier to find a job now than it was 10 years ago. While most ofthese respondents could not identify particular changes in the hospitality sector that had contributed tothis change, one in three could identify changes.
Table 24 Finding work in hospitality sector given changes over last 10 yearsFinding work Responses Per centHarder to find a job 9 16
Easier to find a job 32 53
Neither 3 5
Don’t know 14 24
Total 58 100
Table 25 Effects of change in hospitality sector on finding workEffects of change Responses Per centYes 18 33
No 36 67
Total 54 100
It seemed that respondents’ reasons for multiple job holding were a reflection of the way café andrestaurant work is arranged and pay scales. There were both positive and negative aspects of workarrangements identified by respondents. On the one hand, respondents talked about the need for multiplejob holding because they couldn’t get enough hours in one job, because the pay was low, or they neededmore money to pay bills. But on the other hand, they liked the flexibility of hours and the social contactand stimulation provided through the way café and restaurant work was organised.
Table 26 Suggested reasons for multiple job holding in cafes and restaurantsReasons Responses Per cent of respondentsCan't get enough hours in one job 30 50
Lifestyle/flexibility of hours 18 30
Low pay 17 28
Social contact/stimulation/variety 17 28
Extra money/save/bills 15 25
Job security 4 7
To get experience 3 5
Other 1 1
Total 105 na
Respondents were more likely to attribute the ease or difficulty in finding work to changes inparticular work places. Thus, 46 per cent said that changes had had an effect on their job. The mostcommon reasons, as shown in Table 27, were reduced hours or staffing levels and the need fordifferent skills or promotion opportunities.

17
Motives and the flexible approach of the hospitality sectorK (age 25) has two jobs as a barista and projectionist, and lives in ahousehold with three other adults. A multiple job holder for 3½years, he originally obtained a second job to work longer hours andearn more money. He began by clocking up 60 to70 hours everyweek, but since then has found it easier to manage two jobs becauseof the flexible approach to scheduling hours of work and the betteraccess to part-time employment in the hospitality sector. K worked35 hours during the most recent week, and enjoys the flexibility ofhis two current jobs that make it relatively easy for him to arrangeholidays and take time off. He believes “it would get too boring” ifhe was to be employed full-time in either of his present jobs.
Table 27 Changes in workplaces that have affected jobs Changes Responses Per cent of respondents
(n=28)Reduced hours/staffing levels 12 43
More or different skills/promotion 11 39
Patronage/location 7 25
Management skill/staff turnover/change in ownership 6 21
Reduced perks 2 7
Other 3 11
Total 41 na
5.4 Personal reasons for multiple job holding
The personal reasons for multiple job holding identified by respondents, as with other sets ofquestions, were influenced by their young age. Thus, the largest group of respondents, (43%)identified tertiary study as the reason for holding more than one job. The next most common reasonswere changes in where respondents lived (38%) and leaving school (22%). Other reasons are shownin the table below. Reasons included in the “Other” category include:
“Having a student loan”“Needing a break, time-off”“Birth of little brother”“Overseas travel”“Saving to go overseas”“Desire to work in IHC”“Planning to study”“Travel”“Wanting to start my own business”“Saving to go overseas”“It was a planned process”“To get money”“Change in relationship”“Looking for a change”“To help my parents out”“Saving for overseas”.

18
Table 28 Effect of changes in personal or family circumstances on respondents’ decision tohold current jobs
Circumstances Responses Per cent of respondentsTertiary study 26 43
Change in place where I live 23 38
Leaving school 13 22
Starting long term relationship 4 7
Home ownership/mortgage 2 3
Ending long term relationship 2 3
Planning for retirement 1 2
Starting a family 1 2
Redundancy 1 2
Children’s education 1 2
Other family finances 1 2
Children leaving home 0 0
Retirement from long-term job 0 0
Other 16 27
None of these 13 22
Total 104 na
A further 11 interviewees (19%) provided further comment about their decision to hold more thanone job. These comments included:
“Relocation”“Life cycle stage”“Saving for travel”“Study”.

19
6 Qualifications, skills, experience and pathways to work
This section of the report focuses on the match between respondents’ skills and experience and thejobs they held. It also focuses on how respondents got their work.
6.1 Qualifications, skills and work experience
Compared with the working population of New Zealand as a whole, respondents were well qualified. This reflects both their young age and the relatively high proportion of tertiary education studentsamongst the sample. Thus, 57 per cent had tertiary qualifications and only 5 per cent had noqualifications (Table 29). As Table 30 shows, 61 per cent could identify other specific training,qualifications or skills that helped them get their current jobs. A smaller proportion (37%) identifiedexperience as a factor in getting their current work.
Table 29 Highest qualifications of respondentQualifications Number Per centNone 3 5
NZ School Cert. 2 3
UE or 6th Form Cert. 8 14
NZ Bursary 5 8
Other Secondary School 0 0
Overseas school qual. 3 5
Polytech 8 14
University 18 31
Other tertiary qualification 7 12
Other/combinations 5 8
Total 59 100
Table 30 Other skills and work experience that help respondent get workSkills Responses Per cent of respondents
(n=53)Practical industry experience 20 38
Complementary/transferable training/qualifications 13 25
Industry specific qualification 20 38
Language skills/communication/personal attributes 28 53
Hospitality/customer service 17 32
Other 2 4
Total 100 na
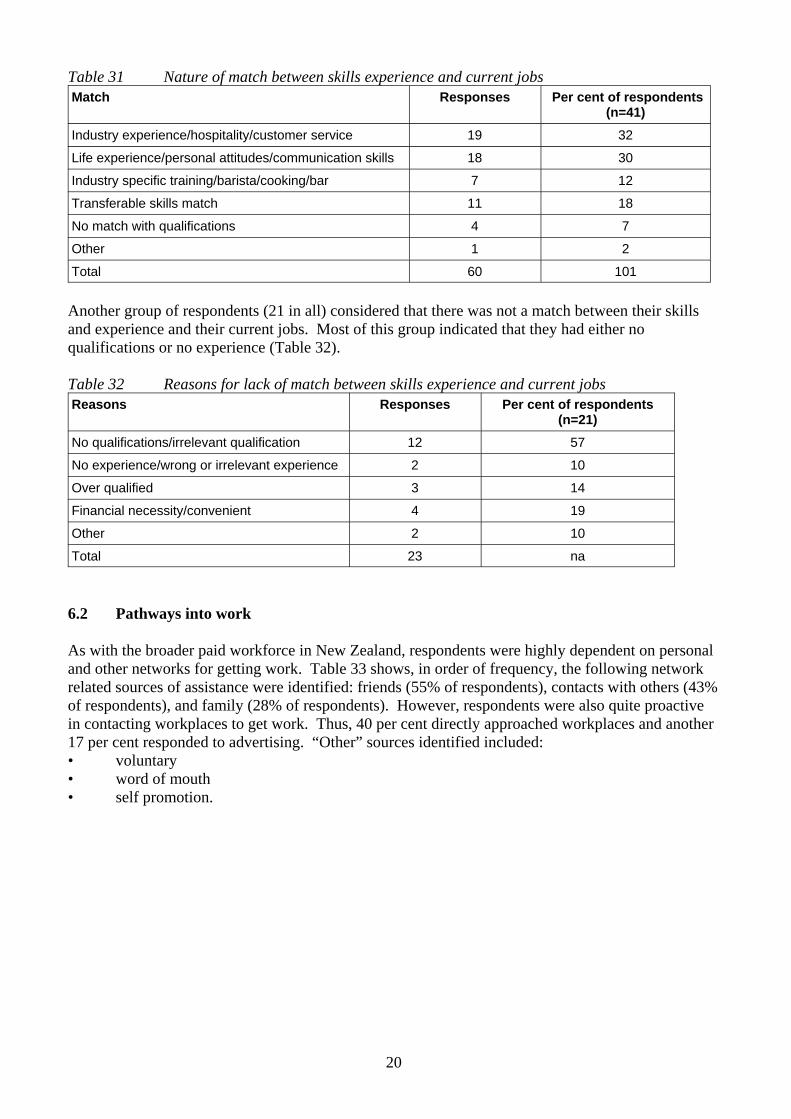
Sixty-seven percent of respondents considered that there was a match between their qualifications,skills and experience and their current jobs. As Table 31 shows, almost a third of that group felt thattheir industry experience and hospitality and customer service skills were reflected in their currentwork. Another 30 per cent considered that their life experience and personal attributes andcommunication skills were reflected in their current work. Others identified specific skills thatmatched their current work experience.
20
Table 31 Nature of match between skills experience and current jobs Match Responses Per cent of respondents
(n=41)Industry experience/hospitality/customer service 19 32
Life experience/personal attitudes/communication skills 18 30
Industry specific training/barista/cooking/bar 7 12
Transferable skills match 11 18
No match with qualifications 4 7
Other 1 2
Total 60 101
Another group of respondents (21 in all) considered that there was not a match between their skillsand experience and their current jobs. Most of this group indicated that they had either noqualifications or no experience (Table 32).
Table 32 Reasons for lack of match between skills experience and current jobsReasons Responses Per cent of respondents
(n=21)No qualifications/irrelevant qualification 12 57
No experience/wrong or irrelevant experience 2 10
Over qualified 3 14
Financial necessity/convenient 4 19
Other 2 10
Total 23 na
6.2 Pathways into work
As with the broader paid workforce in New Zealand, respondents were highly dependent on personaland other networks for getting work. Table 33 shows, in order of frequency, the following networkrelated sources of assistance were identified: friends (55% of respondents), contacts with others (43%of respondents), and family (28% of respondents). However, respondents were also quite proactivein contacting workplaces to get work. Thus, 40 per cent directly approached workplaces and another17 per cent responded to advertising. “Other” sources identified included:• voluntary• word of mouth• self promotion.

21
Table 33 Sources of assistance for getting current workSource Responses Per cent of respondentsFriends 33 55
Contacts with others 26 43
Direct approach workplace 24 40
Family 17 28
Advertising 17 28
Student Job Search 5 8
Professional association 1 2
Voluntary work 1 2
WINZ 1 2
Careers advisor 1 2
Training organisation 1 2
Community group/trust 0 0
Union or workers group 0 0
Other 5 8
None of these 0 0
Total responses 132 na

22
Benefits and costs of returning to the hospitality sectorL (age 32), a qualified chef, works early mornings and lateevenings as a fitness consultant and as a cook at a caféduring the day. He has only held two jobs for a fewmonths and worked 45 hours during the week before theinterview. Most weeks, L works seven days and his wifeis also a multiple job holder. The previous Christmas hetook a position as a catering assistant. His return to thehospitality sector was part of a planned process toreestablish himself as a chef to complement his work as afitness consultant. While L appreciates the social contactshe makes through his jobs and the ability to use his skillsin two very different environments, he can only meet hisfriends on rare occasions. His two jobs also hinder hisother personal and family relationships, leisure activitiesand participation in organised sport and communityactivities.
7 The effects of multiple job holding
In this section we report respondents’ views about the benefits of multiple job holding; the effects ofmultiple job holding on personal and family lives; factors that would make multiple job holdingbetter or worse; the ideal job mix and strategies to reach that ideal; and anticipated multiple jobholding for the future.
7.1 Benefits of more than one job
The identified benefits of multiple job holding arereminiscent of factors behind multiple job holdingidentified by respondents. That is, the benefits includefinancial and lifestyle related factors. As Table 34 shows,the level and security of income is very important. However, of equal or more importance are factors such asvariation and stimulation and social contact and hours ofwork. Respondents also identified capacity buildingreasons such as helping to build work experience andkeeping their “hand in”. “Other” reasons identified includeaccess to cheap books, good friends, free shows, andhelping to pay student loans.
Fourteen respondents provided further comment about the benefits of having more than one job. Generally, comments centred around the flexibility and variety of the work, the opportunity tobroaden experience, and financial and fringe benefits.
Interestingly, people working for long hours per week were more likely to identify socialcontact/making friends and variation and stimulation as a benefit than those working shorter hoursper week. The group most likely to identify level of income as a benefit of having more than one jobwas the group working between 60 and 69 hours per week. See Table 2 in Appendix 2 for moredetails.
Table 34 Benefits to respondent of multiple job holdingBenefits Responses Per cent of respondentsLevel of income 47 78
Variation and stimulation 47 78
Social contact 47 78
Helps build work experience 33 53
Hours of work 31 52
Security of income 30 50
Keeps my “hand in” 16 27
Other 4 7
Suits my family 6 10
None 0 0
Total 261 na
23
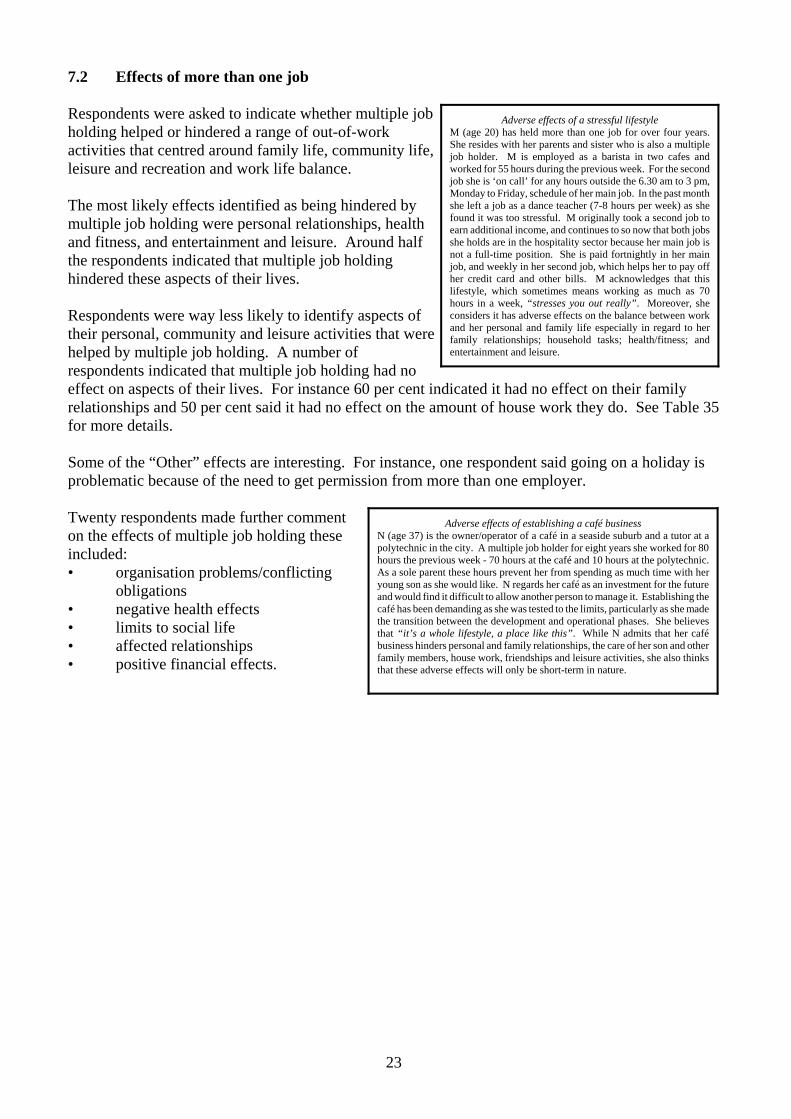
Adverse effects of a stressful lifestyleM (age 20) has held more than one job for over four years.She resides with her parents and sister who is also a multiplejob holder. M is employed as a barista in two cafes andworked for 55 hours during the previous week. For the secondjob she is ‘on call’ for any hours outside the 6.30 am to 3 pm,Monday to Friday, schedule of her main job. In the past monthshe left a job as a dance teacher (7-8 hours per week) as shefound it was too stressful. M originally took a second job toearn additional income, and continues to so now that both jobsshe holds are in the hospitality sector because her main job isnot a full-time position. She is paid fortnightly in her mainjob, and weekly in her second job, which helps her to pay offher credit card and other bills. M acknowledges that thislifestyle, which sometimes means working as much as 70hours in a week, “stresses you out really”. Moreover, sheconsiders it has adverse effects on the balance between workand her personal and family life especially in regard to herfamily relationships; household tasks; health/fitness; andentertainment and leisure.
Adverse effects of establishing a café businessN (age 37) is the owner/operator of a café in a seaside suburb and a tutor at apolytechnic in the city. A multiple job holder for eight years she worked for 80hours the previous week - 70 hours at the café and 10 hours at the polytechnic.As a sole parent these hours prevent her from spending as much time with heryoung son as she would like. N regards her café as an investment for the futureand would find it difficult to allow another person to manage it. Establishing thecafé has been demanding as she was tested to the limits, particularly as she madethe transition between the development and operational phases. She believesthat “it’s a whole lifestyle, a place like this”. While N admits that her cafébusiness hinders personal and family relationships, the care of her son and otherfamily members, house work, friendships and leisure activities, she also thinksthat these adverse effects will only be short-term in nature.
7.2 Effects of more than one job
Respondents were asked to indicate whether multiple jobholding helped or hindered a range of out-of-workactivities that centred around family life, community life,leisure and recreation and work life balance.
The most likely effects identified as being hindered bymultiple job holding were personal relationships, healthand fitness, and entertainment and leisure. Around halfthe respondents indicated that multiple job holdinghindered these aspects of their lives.
Respondents were way less likely to identify aspects oftheir personal, community and leisure activities that werehelped by multiple job holding. A number ofrespondents indicated that multiple job holding had noeffect on aspects of their lives. For instance 60 per cent indicated it had no effect on their familyrelationships and 50 per cent said it had no effect on the amount of house work they do. See Table 35for more details.
Some of the “Other” effects are interesting. For instance, one respondent said going on a holiday isproblematic because of the need to get permission from more than one employer.
Twenty respondents made further commenton the effects of multiple job holding theseincluded: • organisation problems/conflicting
obligations• negative health effects• limits to social life• affected relationships• positive financial effects.

24
Table 35 Effect of multiple job holding on personal and family life Effects No
effect% Helps % Hinders % N/A % Other %
Personal relationships 19 32 10 17 29 48 0 0 2 3
Family relationships 36 60 5 8 17 28 0 0 2 3
Caring/supporting children 2 3 1 2 4 7 47 78 6 10
Caring/supporting other family 21 35 6 10 5 8 23 38 5 8
Amount of housework you do 30 50 4 7 23 38 2 3 1 2
Friendships 21 35 17 28 20 33 0 0 2 3
Health/Fitness 16 27 13 22 29 48 2 3 0 0
Involvement in sport 15 25 3 8 17 28 24 40 1 2
Entertainment/leisure 15 25 15 25 29 48 0 0 1 2
Inv. Community 19 32 5 8 13 22 21 35 2 3
Inv. Ongoing education 15 25 5 8 19 32 20 33 1 2
Balance work/personal 21 35 7 12 30 50 0 0 2 3
Other 1 3 3
7.3 Work expectations
The factors identified by respondents as making multiple job holding better or worse are consistentwith the reasons they identified for having more than one job (section 5). For instance, given theimportance of financial factors in seeking more than one job, almost half the respondents said thatbetter pay, hours, conditions and/or perks would make having more than one job better. They alsosaid that more shift flexibility and other factors around the arrangement of hours of work wouldimprove multiple job holding. Conversely, factors that would make having more than job worseinclude less free time and flexibility, worse pay, conditions, shifts, hours. Tables 36 and 37 providemore detail.
Table 36 Factors that would make having more than one job better Factors Responses Per cent of respondents
(n=58)Better pay/hours/conditions/perks 32 55
More shift flexibility/variety/opportunity/recognition 18 31
Tax break/Remove secondary tax 12 21
Getting more experience/better management 3 5
Nothing can’t think of anything 3 5
Other 3 5
Total 71 na

25
Financial support for a preferred occupationB is a 25 year old disc jockey for various cafesduring the midnight hours, and a retail assistant ina record store between 9am and 5pm. He workedfor 43 hours in the most recent working week - 8hours in his main occupation as a DJ and 35 hoursin his job at the record store. B has held these twojobs together for three years, and expects to remaina multiple job holder for between one and threeyears. In his experience there are many peoplewanting to be disc jockeys, but few positionsavailable for them in the city where he lives.
Table 37 Factors that would make having more than one job worse Factors Responses Per cent of respondents
(n=56)Less free time/more hours worked/less flexibility 18 32
Worse pay/conditions/shifts/reduced hours 15 27
Poor staff relationships/poor owners or managers 11 20
Less sleep/negative health impacts 10 18
More tax/increased travel costs and stress 6 11
Changes in market/regulations/patronage 5 9
Other 6 11
Total 71 na
Respondents’ reflection upon the ideal job or mix of jobsindicated that they do not see hospitality work as their life work. Instead, their comments suggest that their current work is aninterim measure before moving on to their preferred careerchoices. For instance, 41 per cent of respondents said that theirideal job would be in their own profession (not hospitality) or adifferent profession. In keeping with this, 36 per cent ofrespondents indicated that they would need more skills andtraining to make the move to the ideal situation. See Tables 38and 39.
And, as Table 40 shows, the great majority (75%) expected to be holding more than one job for lessthan three years. Indeed, more than half of these expect to be holding multiple jobs for a year or less. Only 10 per cent indicated an expectation to be holding multiple jobs for the long term.
Table 38 Ideal job/mix of jobsIdeal Responses Per cent of respondents
(n=57)Job in (not hospitality)/different profession 29 51
Work arrangement (flexibly hours, variety, life balance) 17 30
Other hospitality industry jobs 9 16
In current ideal situation 7 12
Self employed/managing business 4 7
Other 4 7
Total 70 na
Table 39 Steps needed to reach ideal situationSteps Responses Per cent of respondents
(n=34)More skills/training 16 47
More time/experience 11 32
Change industry or profession 8 24
Build customer base/grow business 3 9
In current ideal 2 6
Other 4 12
Total 44 na

26
An interim strategy before pursuing another occupationA (age 21) is a waitress and shop assistant. She views the latter positionas her main job as the number of hours she works every week as awaitress is very inconsistent. During her most recent week she worked26 hours as a waitress and 18 hours as a shop assistant. In the previousmonth A had also been employed as a caterer for three nights, andbefore then had held several short-term jobs in New Zealand and theUnited States during the rest of the year. She expected to continueholding more than one job for less than a year, and would ideally like tobecome a photographer or actress and support herself solely from thisnew occupation.
Table 40 Expected length of time in multiple job holdingLength of time Number Per centShort term (0-2 months) 4 7
Less than a year (3-12 months) 20 34
1-3 years 20 34
More than 3 years 4 7
Long term (until I retire) 6 10
Don’t know 5 8
Total 59 100
Despite the effect on family and community lifeand recreation and entertainment, respondentsoverall view of multiple job holding was generallypositive. As the table below, shows 63 per centviewed multiple job holding as positive, while only10 per cent viewed it as negative. Twenty-sevenpercent identified both positive and negativeaspects to multiple job holding.
Those respondents who considered working in more than one job as generally positive were morelikely to be working between 40 and 59 hours per week. Only a small percentage of those whoconsidered multiple job holding as positive were working more than 60 hours per week. On the otherhand, half of those who considered multiple job holding as generally negative were working 60 hoursor more per week. See Table 56, Appendix 2.
Table 41 Overall personal view of MJHView Number Per centPositive 38 63
Negative 6 10
Both 16 27
Total 60 100

27
8 Income and standard of living
Questions posed to respondents around income focused on sources of income, level of income,importance of that income to their household and standard of living, and their standard of livingcompared to that of friends and family. As might be expected of a relatively young group of people,the majority of respondents relied only on their paid work for their income. Thirty per cent had otherincome sources, including, in order of frequency; student allowance, interest/dividends, student loan,and financial support from outside of their household.
Table 42 shows the distribution of respondents’ income levels for the previous calendar year. Mostrespondents earned somewhere between $10,000 and $30,000. Very few were earning above$30,000.
Table 42 Total pre-tax income from all sources 2002-3Income Number Per centLoss 0 0
Zero 0 0
$1 - $5,000 6 11
$5,001 - $10,000 9 16
$10,001 - $20,000 14 25
$20,001 - $30,000 16 29
$30,001 - $50,000 9 16
$50,001 - $100,000 0 0
$100,001 or more 1 2
Total 55 99
Most of the people interviewed as café and restaurant workers were young and living in flattingsituations. For these people, their income was not important to their household, although, obviouslyit was essential to their own survival. For some respondents, for instance those living at home, theirincomes provided discretionary spending. For a small number, their incomes made an essentialcontribution to the households, for instance because they had dependents, they were rent payers orthey paid board (see Table 43).
Table 43 Importance of income to householdImportance Number Per centVery important 12 20
Important 4 7
Moderately 7 12
Not very important 2 3
Not important at all 28 47
Blank/other 7 12
Total 60 101
Fifty one respondents made additional comments on the importance of their income to theirhouseholds (Table 44).

28
Table 44 Comments on importance of income to householdsComments Responses Per cent of respondents
(n=51)No dependants/flatting/sharing household expenses 31 55
Discretionary income/live at home 11 22
Have dependants 5 10
Debt repayment 4 8
For basic living costs/sole rent payer/pay board 2 4
Other 2 4
Total 55 100
For most respondents (51%), multiple job holding was important or very important to their standardof living. These included respondents who were working longer hours. However, 37 per cent ofrespondents said that multiple job holding was not very important or not at all important to theirstandard of living (Table 45).
Table 45 Importance of multiple job holding to standard of livingImportance Number Per centVery important 17 28
Important 14 23
Moderately 6 10
Not very important 10 17
Not important at all 13 22
Blank/other 0 0
Total 60 100
Forty-nine respondents made further comments about the importance of multiple job holding to theirstandard of living. As Table 46 shows, the most common reasons for this importance are thatmultiple job holding allows money for extras, non-essentials or other interests, is essential to coverbasic living costs or support study, or is a lifestyle choice.
Table 46 Comments on importance of multiple job holding to standard of livingImportance Responses Per cent of respondents
(n=49)Allows money for extras/non-essentials/other interests 15 31
Essential to cover basic living costs/support study 13 27
Lifestyle choice 11 22
No financial importance/not important 9 18
Allows me to save 7 14
Other 2 4
Total 57 100
Overall, respondents indicated that their standard of living was much the same as that of friends andfamily. Small percentages (12% in each case) considered their standard of living to be higher orlower. A number of respondents said they could not generalise about their standard of living as betteror worse than family or friends. Rather, it was better than some, worse than others (see Table 47).

29
Table 47 Comparison of respondents’ standard of living with that of friends and familyComparison Number Per centMuch better 1 2
Better 6 10
Similar 37 62
Somewhat worse 6 10
Much worse 1 2
Blank/other 9 15
Total 60 101
There seemed to be little relationship between the importance of multiple job holding to maintainingstandard of living and the hours respondents worked. So, those working on a part-time basis were aslikely, or more likely, to indicated that their jobs were very important as those working 40 hours ormore. On the other hand, those indicating that their jobs were not important to their current standardof living were as likely to be working longer hours.
It seems then, that the people working long hours were doing so for reasons other than money. Forinstance, it may be that they are running their own business or managing a business, or enjoyed thestimulation and social contact of their various jobs. See Table 55 in Appendix 2.

30
APPENDIX 1: Further information on respondents
As the three tables below show, the majority of respondents were female and Pakeha/New ZealandEuropean, and sixty nine per cent were aged below 25 years old. Only four respondents had children.
Table 48 Sex of respondentsSex Number Per centMale 20 33
Female 40 67
Total 60 100
Table 49 Ethnicity of respondentsEthnicity Responses Per centPakeha/NZ European 42 71
Maori 3 5
Pakeha/Maori 2 3
North American 3 5
English 2 3
New Zealander 2 3
Other 5 8
Total 59 98“Other” ethnicities represented by respondents were Japanese, Iranian, Indonesian, Australian, andPakeha/Indian.
Table 50 Café/Restaurant respondent’s by ageAge Males % Females % Total %15 - 19 3 5 10 17 13 22
20 - 24 7 12 21 35 28 47
25 - 29 4 7 4 7 8 13
30 - 34 3 5 3 5 6 10
35 - 39 2 3 2 3 4 7
40 - 44 0 0 0 0 0 0
45 - 49 0 0 0 0 0 0
50 - 54 0 0 0 0 0 0
55 - 59 1 2 0 0 1 2
60 - 64 0 0 0 0 0 0
65 - 69 0 0 0 0 0 0
70 + 0 0 0 0 0 0
Total 20 34 40 67 60 101

31
More than two thirds of respondents lived in households where there were three or more othermembers. Often these were flatting situations. Twenty-seven percent of respondents have one ormore multiple job holders in their households.
Table 51 Number of other members in respondent’s householdOthers in household Number Per centNone 3 5
One 7 12
Two 10 17
Three 20 33
Four 13 22
Five 4 7
Six 1 2
Seven 2 3
Total 60 101
Table 52 Households with other multiple job holdersHouseholds Number Per centWith MJHs 16 27
Without MJHs 44 73
Total 60 100

32
APPENDIX 2: Total hours worked by reasons for and benefits of, multiple job holding;importance to standard of living; and overall impact
Table 53 Total hours worked per week by reasons for having more than one job (n=59)Total hours per week 10 - 19 20 - 29 30 - 39 40 - 49 50 - 59 60 - 69 70 - 79 80+ TotalBecause I have to 17% 25% 25% 8% 8% 8% 8% 0% 100%
Because I want to 14% 0% 14% 18% 36% 5% 9% 5% 100%
Both 8% 21% 8% 42% 4% 13% 4% 0% 100%
Neither 0% 0% 0% 100% 0% 0% 0% 0% 100%
Table 54 Total hours per week by benefits of having more than one jobTotal hours per week 10 - 19 20 - 29 30 - 39 40 - 49 50 - 59 60 - 69 70 - 79 80+Level of income obtained 19% 18% 18% 16% 19% 26% 18% 0%
Security of income 11% 13% 12% 10% 14% 16% 12% 0%
Variation and stimulation 19% 18% 21% 19% 14% 16% 18% 20%
Social contact/making friends 11% 15% 18% 21% 19% 26% 24% 0%
Hours of work 16% 15% 18% 10% 8% 5% 6% 20%
Suits my family better 0% 5% 0% 1% 3% 0% 6% 20%
Keeps my “hand in” my mainoccupation
8% 3% 6% 8% 6% 0% 6% 20%
Helps build my work experience 16% 13% 6% 12% 17% 11% 12% 20%
Other 0% 3% 0% 3% 0% 0% 0% 0%
Total 100% 100% 100% 100% 100% 100% 100% 100%
Table 55 Total hours worked per week by importance of multiple job holding to currentstandard of living
Total hours per week 10 - 19 20 - 29 30 - 39 40 - 49 50 - 59 60 - 69 70 - 79 80+Very important 14% 50% 38% 25% 20% 60% 0% 0%
Important 43% 25% 38% 19% 10% 20% 0% 0%
Moderate 14% 0% 13% 0% 20% 20% 25% 0%
Not very important 14% 0% 0% 25% 20% 0% 50% 100%
Not important at all 14% 25% 13% 31% 30% 0% 25% 0%
Total 100% 100% 100% 100% 100% 100% 100% 100%
Table 56 Total hours worked per week by overall impact of multiple job holdingTotal hours per week 10 - 19 20 - 29 30 - 39 40 - 49 50 - 59 60 - 69 70 - 79 80+ TotalPositive 14% 11% 14% 27% 22% 8% 5% 0% 100%
Negative 17% 17% 0% 17% 0% 17% 33% 0% 100%
Both 6% 19% 19% 31% 13% 6% 0% 6% 100%