Analysis of incentives and disincentives for beef in Uganda€¦ · Beef is also derived from...
30
ANALYSIS OF INCENTIVES AND DISINCENTIVES FOR BEEF IN UGANDA DECEMBER 2012
Transcript of Analysis of incentives and disincentives for beef in Uganda€¦ · Beef is also derived from...

ANALYSIS OF INCENTIVES AND DISINCENTIVES
FOR BEEF IN UGANDA
DECEMBER 2012

This technical note, a product of the Monitoring African Food and Agricultural Policies project (MAFAP), intended primarily for internal use as background for the MAFAP Country Report. This technical note may be updated as new data becomes available.
MAFAP is implemented by the Food and Agriculture Organization of the United Nations (FAO) in collaboration with the Organisation for Economic Co-operation and Development (OECD) and national partners in participating countries. It is financially supported by the Bill and Melinda Gates Foundation, the United States Agency for International Development (USAID), and FAO.
The analysis presented in this document is the result of the partnerships established in the context of the MAFAP project with governments of participating countries and a variety of national institutions.
For more information: http://www.fao.org/mafap
Suggested citation: Mbabazi M.C., Ahmed M., 2012. Analysis of incentives and disincentives for beef in Uganda. Technical notes series, MAFAP, FAO, Rome. © FAO 2013 FAO encourages the use, reproduction and dissemination of material in this information product. Except where otherwise indicated, material may be copied, downloaded and printed for private study, research and teaching purposes, or for use in non-commercial products or services, provided that appropriate acknowledgement of FAO as the source and copyright holder is given and that FAO’s endorsement of users’ views, products or services is not implied in any way. All requests for translation and adaptation rights, and for resale and other commercial use rights should be made via www.fao.org/contact-us/licence-request or addressed to [email protected].

SUMMARY OF THE NOTE Product: Beef Period analyzed: 2008 – 2011 Trade status: Thinly-traded in all years
• Livestock production constitutes an important sub-sector of Uganda’s agriculture, contributing about 9 per cent of Gross Domestic Product and 17 per cent of Agricultural Gross Domestic Product and is a source of livelihood to about 4.5 million people in the country
• Most of the beef production is the done on extensive production systems mainly located in the cattle corridor system in Central Uganda.
• The current per capita availability of meat in Uganda is low estimated at 12.1 kg, of which beef constitutes 6.3 kg compared to 50 kg of meat recommended by FAO and WHO.
• There seems to be increased informal and formal exports of meat products and live animals from Uganda to regional markets but Uganda’s performance of exports of livestock and livestock products is still dismal.
• The livestock sector is governed by several policies and regulations including the national delivery of veterinary services, national veterinary drug policy, national hides, skins and leather policy, animal breeding policy and the animal feeds policy among others. The recently enacted Meat Industry development law was instituted to improve production, processing and marketing of meat and meat products.
The limited analysis undertaken revealed that the observed incentives to cattle farmers are declining (red line) and substantial market development gap exists in the beef industry in Uganda caused by the excessive taxation, the poorly organized value chain with excessive taxation and profit margins for traders and beef processors. With the country well-advanced in its plan for liberalizing the economy and commercialization of agriculture and adoption of policies geared towards the development of livestock sector, the Government of Uganda may need to focus on solving the structural problems leading to the market development gap.
-60.00%
-40.00%
-20.00%
0.00%
20.00%
40.00%
60.00%
2008 2009 2010
Market development gap (MDG)
Observed nominal rate of protection at farm gate
Adjusted nominal rate of protection at farm gate
3
TABLE OF CONTENTS SUMMARY OF THE NOTE .................................................................................................................................. 3
1. PURPOSE OF THE NOTE............................................................................................................................. 5
2. commodity CONTEXT ................................................................................................................................ 6
Production..................................................................................................................................................... 6
Consumption ................................................................................................................................................. 8
Marketing and Trade .................................................................................................................................... 9
Description of the Value Chain and Processing .......................................................................................... 10
Policy Decisions and Measures ................................................................................................................... 14
3. DATA REQUIREMENTS, DESCRIPTION AND INDICATORS........................................................................ 15
BENCHMARK PRICES ................................................................................................................................... 16
DOMESTIC PRICES ....................................................................................................................................... 16
EXCHANGE RATES ....................................................................................................................................... 17
MARKET ACCESS COSTS .............................................................................................................................. 18
EXTERNALITIES ............................................................................................................................................ 20
QUALITY AND QUANTITY ADJUSTMENTS ................................................................................................... 20
data overview ............................................................................................................................................. 20
4. INTERPRETATION OF THE INDICATORS ................................................................................................... 24
5. PRELIMINARY CONCLUSIONS AND RECOMMENDATIONS ...................................................................... 26
6. BIBLIOGRAPHY ........................................................................................................................................ 27
ANNEX I: Methodology Used .......................................................................................................................... 28
ANNEX II: Data and calculations used in the beef analysis ............................................................................. 29
4

1. PURPOSE OF THE NOTE This technical note is an attempt to describe the market incentives and disincentives for beef in Uganda.
For this purpose, yearly averages of farm gate and wholesale prices are compared with reference prices calculated on the basis of the price of the commodity in the international market for an observed and adjusted scenarios. The price gaps between the reference prices and the prices along the value chain indicate the extent to which incentives (positive gaps) or disincentives (negative gaps) are present at farm gate and wholesale level. In relative terms, the price gaps are expressed as Nominal Rates of Protection. These key indicators are used by MAFAP to highlight the effects of policy and market development gaps on prices.
The note starts with a brief review of the production, consumption, trade and policies affecting the commodity and then provides a detailed description of how the key components of the price analysis have been obtained. The MAFAP indicators are then calculated with these data and interpreted in the light of existing policies and market characteristics. The analysis that has been carried out is commodity and country specific and covers the period 2008-2011. The indicators have been calculated using available data from different sources for this period and are described in Chapter 3.
The outcomes of this analysis can be used by those stakeholders involved in policy-making for the food and agricultural sector. They can also serve as input for evidence-based policy dialogue at country or regional level.
This technical note is not to be interpreted as an analysis of the value chain or detailed description of production, consumption or trade patterns. All information related to these areas is presented merely to provide background on the commodity under review, help understand major trends and facilitate the interpretation of the indicators.
All information is preliminary and still subject to review and validation.
5

2. COMMODITY CONTEXT
PRODUCTION Livestock production constitutes an important sub-sector of Uganda’s agriculture, contributing about 9 per cent of Gross Domestic Product and 17 per cent of Agricultural Gross Domestic Product and is a source of livelihood to about 4.5 million people in the country (UIA, 2009). It is an integral part of the agricultural system in many parts of the country. Livestock contribute significantly to the welfare of the population at both household and national levels. Livestock in Uganda play important roles in many families, including raising household incomes, providing protein and acting as mobile banks.
Livestock is predominantly used for supporting rural households (80 per cent owned by smallholders) with herd size of 5-100. In economic value, cattle are considered the most important livestock although other animals such as goats, sheep, pigs and poultry are equally important. Cattle are the main source of meat in the country and are reared on rangelands which occupy 84 000 km². The greatest concentration of livestock is found in the "cattle corridor", extending from South-Western to North Eastern Uganda (Figure 1). This corridor covers the districts of Ntungamo, Mbarara, Mpigi, Kiboga, Luwero, Apac, Lira, Soroti, Kumi, Mbale, Moroto, and KAtido (INFOTRADE, 2011).
Figure 1: Major Livestock production districts in Uganda
Source: INFOTRADE (2011).
The annual production of livestock products has recorded progressive growth since 2004. Beef production by 2008 stood at 200,743 Mt, an 8 per cent increment from 147 552 Mt in 2004 (MAAIF 2009). Beef production in Uganda uses predominantly indigenous breeds (INFOTRADE, 2011) while improved cattle
6
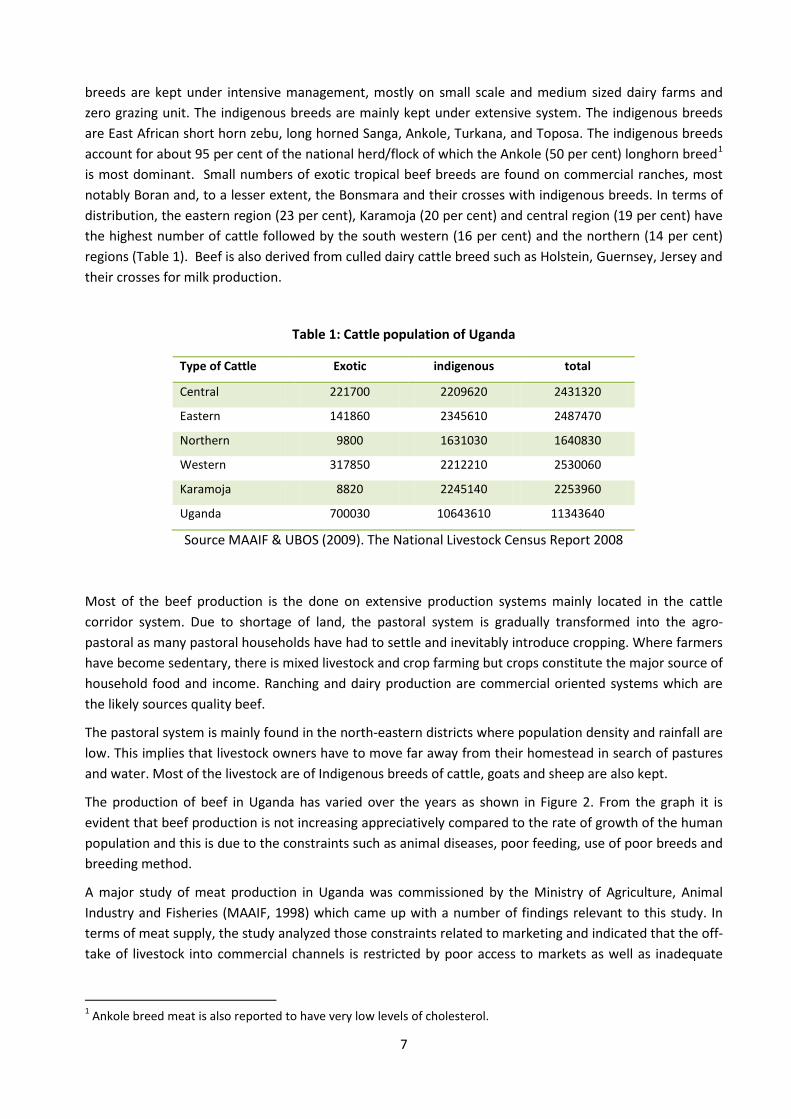
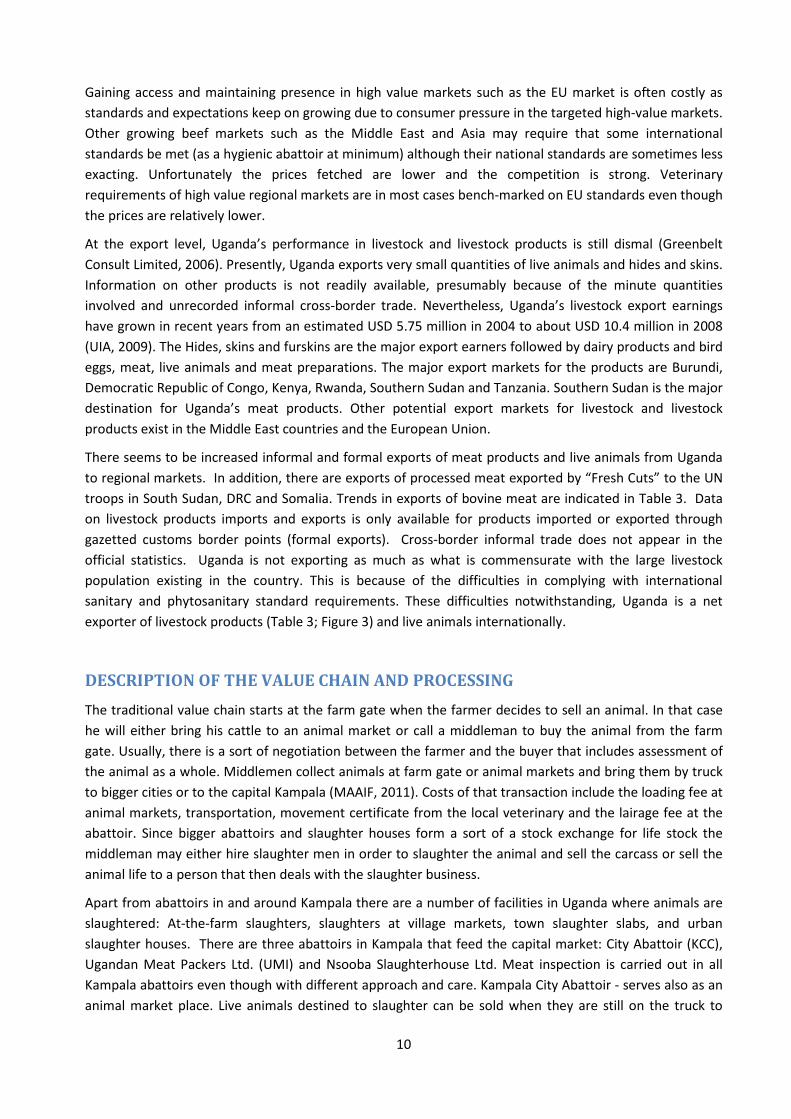
breeds are kept under intensive management, mostly on small scale and medium sized dairy farms and zero grazing unit. The indigenous breeds are mainly kept under extensive system. The indigenous breeds are East African short horn zebu, long horned Sanga, Ankole, Turkana, and Toposa. The indigenous breeds account for about 95 per cent of the national herd/flock of which the Ankole (50 per cent) longhorn breed1 is most dominant. Small numbers of exotic tropical beef breeds are found on commercial ranches, most notably Boran and, to a lesser extent, the Bonsmara and their crosses with indigenous breeds. In terms of distribution, the eastern region (23 per cent), Karamoja (20 per cent) and central region (19 per cent) have the highest number of cattle followed by the south western (16 per cent) and the northern (14 per cent) regions (Table 1). Beef is also derived from culled dairy cattle breed such as Holstein, Guernsey, Jersey and their crosses for milk production.
Table 1: Cattle population of Uganda
Type of Cattle Exotic indigenous total
Central 221700 2209620 2431320
Eastern 141860 2345610 2487470
Northern 9800 1631030 1640830
Western 317850 2212210 2530060
Karamoja 8820 2245140 2253960
Uganda 700030 10643610 11343640
Source MAAIF & UBOS (2009). The National Livestock Census Report 2008
Most of the beef production is the done on extensive production systems mainly located in the cattle corridor system. Due to shortage of land, the pastoral system is gradually transformed into the agro-pastoral as many pastoral households have had to settle and inevitably introduce cropping. Where farmers have become sedentary, there is mixed livestock and crop farming but crops constitute the major source of household food and income. Ranching and dairy production are commercial oriented systems which are the likely sources quality beef.
The pastoral system is mainly found in the north-eastern districts where population density and rainfall are low. This implies that livestock owners have to move far away from their homestead in search of pastures and water. Most of the livestock are of Indigenous breeds of cattle, goats and sheep are also kept.
The production of beef in Uganda has varied over the years as shown in Figure 2. From the graph it is evident that beef production is not increasing appreciatively compared to the rate of growth of the human population and this is due to the constraints such as animal diseases, poor feeding, use of poor breeds and breeding method.
A major study of meat production in Uganda was commissioned by the Ministry of Agriculture, Animal Industry and Fisheries (MAAIF, 1998) which came up with a number of findings relevant to this study. In terms of meat supply, the study analyzed those constraints related to marketing and indicated that the off-take of livestock into commercial channels is restricted by poor access to markets as well as inadequate
1 Ankole breed meat is also reported to have very low levels of cholesterol.
7

market infrastructure. Organized links in terms of roles and activities among pastoralists, small-scale farmers, large-scale ranchers, companies and cooperatives are practically non-existent.
Figure 2: Beef Production in Uganda 2005-2010 (Thousands of Metric tonnes)
Source: Department of Animal Production and marketing, MAAIF, 2012.
CONSUMPTION There are different approaches to determine the actual per capita meat consumption, either from the primary production side (minus exports plus imports), or from the slaughter statistics, or from the consumer side according to a household survey. Slaughter statistics is always incomplete as not all slaughters are recorded.
The turnoff rate (off take rate) for cattle in Uganda is estimated at 12 per cent (MPMPS, 1998) and an additional 3 per cent consumed at farm/household level. The demand for livestock products, including beef has steadily been rising due to changes in social and economic structure of the population, urbanization and population growth. The current per capita availability of meat stands at 12.1 kg, of which beef constitutes 6.3 kg (Table 2), compared to 50 kg of meat recommended by FAO and WHO (Greenbelt Consult Limited, 2006). This consumption is relatively low as shown by the table below. According to the 1992/93 National Household Survey, the per capita consumption of beef in rural areas is about half that found in urban areas.
0
20
40
60
80
100
120
140
160
180
2005 2006 2007 2008 2009 2010
000'S MT
8

Table 2: Meat Consumption in Uganda (2010)
Species Total no. Slaughtered
Equivalent Weight of Carcass (tonne)
Full "Carcass" Weight (kg)
Human Population
Per Capita Consumption
(kg) Beef 2,084,000 312,580 150.0 35,000,000 6.3
Pigs 1,885,000 113,100 60.0 35,000,000 3.2
Goat 2,750,000 32,100 11.7 35,000,000 0.9
Sheep 648,000 9,072 14.0 35,000,000 0.3
Poultry 37,500,000 48,750 1.3 35,000,000 1.4
Total 332,622 12.1
Source: FAOStat (2010). Note: FAO calculates carcass weight and not meat without bones.
MARKETING AND TRADE Marketing of Livestock, livestock products and by-products plays a key role in increasing farmers’ incomes, promoting food security, improving people’s welfare and stimulating the growth of the animal industry and the national economy in general. At farmer level, animals are purchased through direct negotiation with the producer either at the farm or at the spot markets. There are no standards or weighing facilities to guide the negotiation process. Price is determined from the physical attributes of the animal and guessed meat yield. The animals are resold in the primary, secondary or tertiary markets by cattle traders or intermediaries through direct negotiation. The prices received therefore depend on the negotiation skills and experience of the farmer or trader. Having market information is a vital tool for negotiation. However, for the most part, the farmers are lacking in all these aspects and end up with lower than anticipated price.
Costs incurred are in the form of labor for ferrying the animal and payment of token market dues. Cattle traders normally interact with farmers in rural cattle markets to procure cattle. Apart from the producer price, the traders incur transport costs to the main urban areas and costs for waiting at the slaughter houses, such as (feed, food and accommodation). Transport costs depend on the number of cattle on a truck.
Most of the livestock markets at primary and secondary level belong to the local governments. However, in line with the government policy of liberalization and privatization, they are tendered to the private sector for management and revenue collection. The contractors pay a fee, collect the market levies, care for security and cleanliness and, in principle, maintain the infrastructure. Movement permits are issued at livestock markets.
Exports are limited because of the prevalence of diseases, lack of an export-standard abattoir and the high demand of the national market (MAAIF, 2011). Access to export markets of livestock and livestock products requires at times significant investments to meet veterinary requirements largely intended to protect the importing country’s animal and human populations. Furthermore, the exporting country must meet additional product quality requirements with respect to production, marketing and processing. Generally, compliance with international or regional standards is often achieved by developing countries at a great cost.
9
Gaining access and maintaining presence in high value markets such as the EU market is often costly as standards and expectations keep on growing due to consumer pressure in the targeted high-value markets. Other growing beef markets such as the Middle East and Asia may require that some international standards be met (as a hygienic abattoir at minimum) although their national standards are sometimes less exacting. Unfortunately the prices fetched are lower and the competition is strong. Veterinary requirements of high value regional markets are in most cases bench-marked on EU standards even though the prices are relatively lower.
At the export level, Uganda’s performance in livestock and livestock products is still dismal (Greenbelt Consult Limited, 2006). Presently, Uganda exports very small quantities of live animals and hides and skins. Information on other products is not readily available, presumably because of the minute quantities involved and unrecorded informal cross-border trade. Nevertheless, Uganda’s livestock export earnings have grown in recent years from an estimated USD 5.75 million in 2004 to about USD 10.4 million in 2008 (UIA, 2009). The Hides, skins and furskins are the major export earners followed by dairy products and bird eggs, meat, live animals and meat preparations. The major export markets for the products are Burundi, Democratic Republic of Congo, Kenya, Rwanda, Southern Sudan and Tanzania. Southern Sudan is the major destination for Uganda’s meat products. Other potential export markets for livestock and livestock products exist in the Middle East countries and the European Union.
There seems to be increased informal and formal exports of meat products and live animals from Uganda to regional markets. In addition, there are exports of processed meat exported by “Fresh Cuts” to the UN troops in South Sudan, DRC and Somalia. Trends in exports of bovine meat are indicated in Table 3. Data on livestock products imports and exports is only available for products imported or exported through gazetted customs border points (formal exports). Cross-border informal trade does not appear in the official statistics. Uganda is not exporting as much as what is commensurate with the large livestock population existing in the country. This is because of the difficulties in complying with international sanitary and phytosanitary standard requirements. These difficulties notwithstanding, Uganda is a net exporter of livestock products (Table 3; Figure 3) and live animals internationally.
DESCRIPTION OF THE VALUE CHAIN AND PROCESSING The traditional value chain starts at the farm gate when the farmer decides to sell an animal. In that case he will either bring his cattle to an animal market or call a middleman to buy the animal from the farm gate. Usually, there is a sort of negotiation between the farmer and the buyer that includes assessment of the animal as a whole. Middlemen collect animals at farm gate or animal markets and bring them by truck to bigger cities or to the capital Kampala (MAAIF, 2011). Costs of that transaction include the loading fee at animal markets, transportation, movement certificate from the local veterinary and the lairage fee at the abattoir. Since bigger abattoirs and slaughter houses form a sort of a stock exchange for life stock the middleman may either hire slaughter men in order to slaughter the animal and sell the carcass or sell the animal life to a person that then deals with the slaughter business.
Apart from abattoirs in and around Kampala there are a number of facilities in Uganda where animals are slaughtered: At-the-farm slaughters, slaughters at village markets, town slaughter slabs, and urban slaughter houses. There are three abattoirs in Kampala that feed the capital market: City Abattoir (KCC), Ugandan Meat Packers Ltd. (UMI) and Nsooba Slaughterhouse Ltd. Meat inspection is carried out in all Kampala abattoirs even though with different approach and care. Kampala City Abattoir - serves also as an animal market place. Live animals destined to slaughter can be sold when they are still on the truck to
10

another trader/middle man who offload them and keep them in the holding facilities waiting for a butcher or another middle-man to buy them.
The animals slaughtered in the city abattoirs come mostly from the high concentration cattle keeping districts of the cattle corridor. Live animals are transported to metropolitan areas where they are slaughtered and beef is offered for sale largely in its fresh state and consumers seem to prefer this type of beef. Animals are brought to the abattoirs either by truck or on foot. Because of the long distances to the slaughter place, the costs of transporting live cattle and the risk of disease spread are therefore relatively high. At the abattoir, animals may be kept alive for 2 to 10 days before slaughtering, depending upon demand for beef.
There are a number of small scale meat processing establishments producing meat products for the local market. They are engaged in processing of beef to produce some value added products. Uganda’s meat processing industry consists currently of two companies dominating the market for packaged retail cuts and processed beef. These companies offers the full range of meat products (both from beef and pork, small quantities of poultry meat): prime cuts, retail cuts plastic packed, sausages (hot dogs, boiled sausages), ham, minced meat. One of these two processing companies is also engaged in processed meat exports to the UN troops in DRC and Sudan on a contractual basis. The quantity exported that way accounts for 50 per cent of the total quantity of meat processed by the company.
Table 3: Formal imports and export of beef (2005-2010)
Year Exports Imports Live animal
export value
Net trade
balance
tonne USD tonne USD USD USD
2005 288.951 733,851 0.990 8,394 29,000 754,457
2006 124.320 323,101 0.596 820 28,000 350,281
2007 66.516 92,763 8.750 47,908 1,551,000 1,595,855
2008 50.071 50,004 4.906 9,112 1,822,000 1,862,892
2009 17.030 52,577 2.786 4,549 3,908,000 3,956,028
2010 240.464 818,778 3.637 12,727 3,985,000 4,791,051
2011 34.203 148,881 1.174 6,667 1,654000 1,796214
Source: UBOS (2012).
11

Figure 3: Beef trade balance (exports minus imports) in Uganda (2005-2010)
Source: compiled from data in Table 3.
0
50
100
150
200
250
300
350
2005 2006 2007 2008 2009 2010 2011
trad
e ba
lanc
e (t
on)
12

Figure 4: Beef and live cattle marketing chain
Source: constructed from description of marketing chain in Landell Mills LTD (2011).
Cattle Farmer
Primary stock market
Secondary stock market
Tertiary stock market
Village Middleman
Local slaughter slab
Wholesaler
Cattle trader
Abattoir
Processor (Wholesaler)
Live cattle export
Local Market (Supermarket
Border
13

POLICY DECISIONS AND MEASURES The livestock sector is governed by several policies and regulations to ease smooth operation and investment. The policies include the national delivery of veterinary services, national veterinary drug policy, national hides, skins and leather policy, animal breeding policy and the animal feeds policy among others (UIA, 2009). The laws and regulations include the Animal Diseases Act, importation of poultry and poultry products Act, Cattle Trading Act and Code of Meat Inspection Act. Uganda is reviewing some of the laws in view of its membership in regional trade groupings such as the East African Community, Common Market for East and Southern Africa and the World Trade Organization. The recently enacted Meat Industry development law was instituted to improve production, processing and marketing of meat and meat products.
Since late 1980s the Government of Uganda has placed emphasis on increased agricultural production to make the country self-sufficient, have surplus for sale in the local market and international market. This was since the 1990s accompanied with various policy reforms affecting the entire economy and with the agricultural-sector being affected by those changes. In 1993, trade privatization and liberalization of all commodities including livestock based commodities was introduced promoting the emergence of many players in the subsector such as many small slaughterhouses and the collapse of the major meat processing plants such as Uganda meat and Soroti meat packers causing cessation of the export trade.
During the process of privatization, government divested itself from provision of infrastructure, and inputs for production and control of animal diseases. Dipping services were transferred to communities but the number of operational dips has also dropped. Under the same policy, provision of drugs at cost recovery was started while clinical and artificial insemination and other veterinary service have been privatized.
Under decentralization, the delivery of veterinary services and control and pests become a responsibility of the local government with the ministry of agriculture maintaining a role of controlling disease of public good nature e.g. Foot and Mouth Disease and rabies. The control of production diseases remained the reasonability of farmers.
The central authority charged with the development of the livestock industry is the Ministry of Agriculture, Animal Industry and Fisheries. Specifically, the industry is managed by the Directorate of Animal Resources. The mandate of the directorate is:
“…to support, promote and guide all livestock, fisheries, apiculture and sericulture production to enable the country to achieve and maintain qualitative and quantitative self sufficiency in Animal protein, animal by-products, honey, bee wax, propolis and silk products”.
The directorate executes this mandate through three departments but only two of them focus on livestock production and animal disease, namely: Department of Animal Production and Marketing and Department of Livestock Health and Entomology. The animal health sector is well equipped by the necessary legal and certification tools to provide adequate information to potential importers of livestock and livestock products and to regulate the veterinary profession and the animal health sector in the country. Veterinary inspections at slaughterhouses are the responsibility of veterinary officers belonging to MAAIF, supported by properly trained technician.
Under the Development Strategy and Investment Plan (DSIP), the beef and dairy industries have been prioritized for support because they are have a high potential for export, particularly in the regional market. Under the EAAP project, support has been provided to support the dairy industry to build it capacity in providing appropriate dairy breed of cattle. Cull animals from dairy production contribute
14

substantial amounts of beef. Support to farmers included provision of improved breeding animals, particularly the Boran bulls for cross breeding to obtain beef animals which has good production traits such as high birth weights, faster growth rates while at the same time are more resistant to disease.
At the international level, to some extent, Uganda’s livestock policies have mainstreamed or integrated various provisions of the global protocols to which Uganda is a party especially those linked to the World Trade Organization such as the Sanitary and Phytosanitary Agreement (SPS) (Greenbelt Consult Limited, 2006). However, the stringent regulations, which are linked to the World Trade Organization, and other barriers to trade, have high costs of compliance attached to them. These are reflected, for instance, in the repeated inspection requirements in various cattle markets as will be reviewed in a later section. Constraints related to meeting the requirements of regional agreements were similar to those of international regulations (Greenbelt Consult Limited, 2006).
Greenbelt Consult Limited (2006) reported a number of policy gaps were found that need to be addressed in order to enhance livestock trade. For example, most of the livestock policies were found to lack strategic linkages with related government ministries and other relevant public institutions, exporters and export associations which facilitate proper planning and the provision of appropriate expert information and guidance. Besides policy gaps, the study found that animal diseases are a major constraint to livestock production and trade in Uganda including Contagious Bovine Pleuropneumonia, Foot and Mouth Disease, Contagious Caprine Pleuropneumonia, African swine fever and Lumpy skin disease, among others.
3. DATA REQUIREMENTS, DESCRIPTION AND INDICATORS To calculate the indicators needed to estimate incentives or disincentives to production (NRP, NRA) as well as the Market Development Gaps (MDGs), several types of data are needed. They were collected and are presented and explained hereafter.
The data on livestock and livestock product prices in Uganda is rather limited. The available data from different sources is inconsistent at times. In this section, we describe the data used in the analysis. Although this analysis is intended to cover the period of 2005-2011, the time series data is incomplete. Therefore, we focus on the period of 2008-2011 for which a complete data set is available.
TRADE STATUS OF THE PRODUCTS
Although trade in processed beef is limited, Uganda is net exporter (Figure 3) given that Uganda also exports live animals (Table 3).
15

BENCHMARK PRICES Observed
Beef FOB prices are very sensitive to its origin due to differences in quality of meat export and the extent of processing. Quality conversion factors are difficult to obtain. As such, the most suitable price to use as benchmark price is the unit export value from the country of origin, i.e., Uganda.
In addition to live animals (cattle), Uganda exports variety of beef products, namely fresh or chilled boneless beef, carcasses and half carcasses. In this analysis, the unit export prices are derived from the value and quantity of meat export reported in the official statistics by Uganda Bureau of Statistics (UBoS). Actual export prices were preferred because quoted international prices may vary from those at which transactions actually occur, due to quality, timing, mode of payment and delivery, or other practical considerations. The use of actual export prices of beef also helps to address the issue of quality differences and the resulting price differences between domestic and international commodities. Figure 5 presents the real FOB beef prices in local currency.
Adjusted
In this analysis, adjusted benchmark prices are not used assuming that the export unit value reflects the opportunity costs of beef export.
DOMESTIC PRICES Observed
Livestock producers, middlemen and traders usually trade live animals which are processed into meat – carcasses - by processors at the slaughtering facilities. For lack of data on live cattle prices, the analysis is based on average prices of beef. Beef wholesale market in Kampala is assumed to be the point of competition. Average wholesale prices of beef (2008-2011) are obtained from INFOTRADE (2012) database on market information. Figure 5 presents real wholesale price of beef in Kampala.
Producers’ prices of both beef and live cattle are unavailable. For this analysis, the equivalent beef prices at the farm gate are estimated from wholesale prices of beef in the primary beef markets (district markets) adjusted by the specific marketing costs between the farm gate and the district markets (shown below). The wholesale beef prices in the primary market is defined as the average prices in the twelve major district markets in the cattle corridor among which are Mbarara, Lira, Kiboga and Mbale.
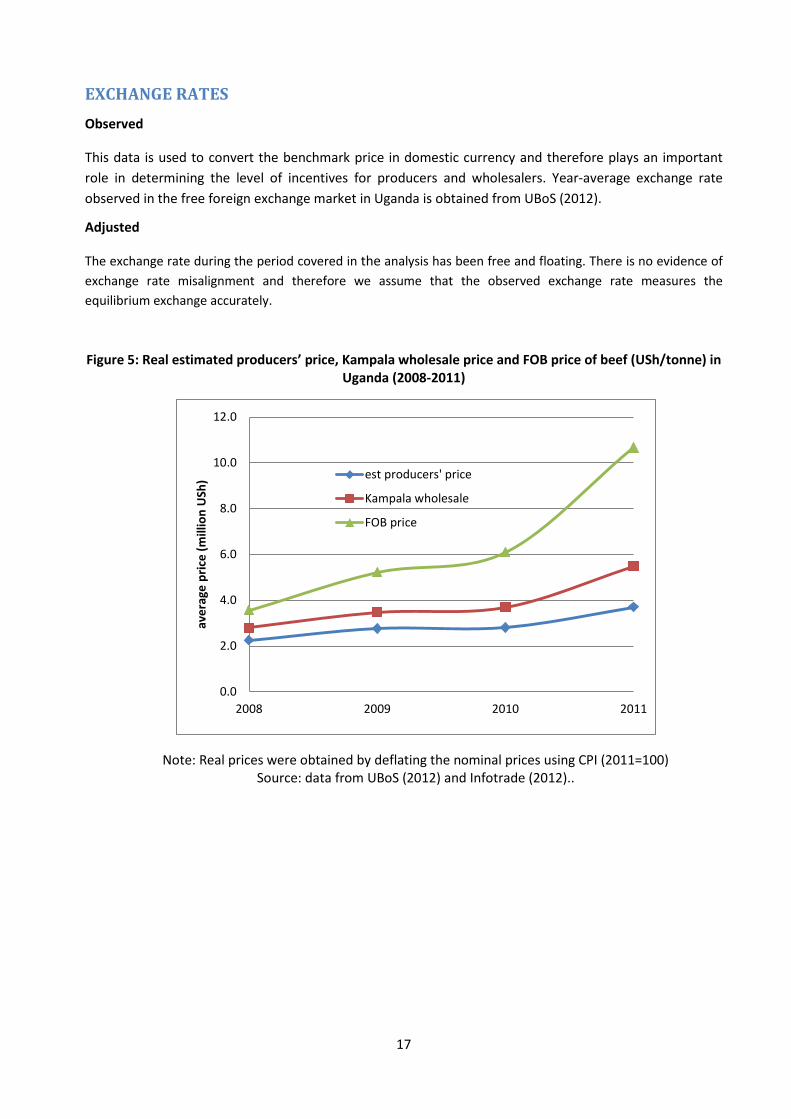
Figure 5 compares the estimated real producers’ prices, Kampala wholesale and FOB export prices (2008-2011). In real terms, both the wholesale price and the estimated producer prices have been rising since 2008 but are relatively more stable than the FOB price. In 2008-2011, real FOB price of beef began to recover from the low level of 2007 with significant increase in 2011. Specifically, the real FOB price rose by almost 75 per cent in 2011 while wholesale rose by 50 per cent and farm gate price by only 32 per cent. This is likely to put pressure on domestic prices although the export market for Uganda beef is very small.
16
EXCHANGE RATES Observed
This data is used to convert the benchmark price in domestic currency and therefore plays an important role in determining the level of incentives for producers and wholesalers. Year-average exchange rate observed in the free foreign exchange market in Uganda is obtained from UBoS (2012).
Adjusted
The exchange rate during the period covered in the analysis has been free and floating. There is no evidence of exchange rate misalignment and therefore we assume that the observed exchange rate measures the equilibrium exchange accurately.
Figure 5: Real estimated producers’ price, Kampala wholesale price and FOB price of beef (USh/tonne) in Uganda (2008-2011)
Note: Real prices were obtained by deflating the nominal prices using CPI (2011=100) Source: data from UBoS (2012) and Infotrade (2012)..
0.0
2.0
4.0
6.0
8.0
10.0
12.0
2008 2009 2010 2011
aver
age
pric
e (m
illio
n U
Sh) est producers' price
Kampala wholesale
FOB price
17
MARKET ACCESS COSTS To correctly be compared with the farm gate price, the border price must be made equivalent to the farm gate price, i.e. it must be adjusted for marketing margins, which include the costs of processing, transportation and handling of a product incurred between the farm gate and the border (OECD, 2010). Noting that MAFAP indicators are calculated for observed and adjusted scenarios, the OECD methodology referred to above represents the adjusted scenario where transfers including taxes and subsidies and marketing margins are not included in the marketing margins2.
Livestock marketing (both live animals and beef) involves many stages and marketing agents. Marketing costs in this analysis are based on movement of cattle from producers at the farm gate in the cattle corridor to primary and secondary market within the district and then to the major livestock wholesale markets in Kampala. Cattle are then slaughter and processed for domestic consumption and export.
Observed
Observed access costs from the farm gate to wholesale markets include transportation between the various markets, loading and unloading, lairage and a variety of local fees and taxes and profit margins. Table 4 presents the costs elements involved in each market segment based on data from the study on promoting a commercial beef industry in Uganda prepared by Landell Mills LTD for MAAIF in 2011. This data reflects the observed marketing costs and margins for 2010. To extrapolate to other years, the data is adjusted by the consumers’ price index (CPI) for inflation. Data on CPI is obtained from Uganda Bureau of Statistics (UBoS). For 2010, the observed access costs from the farm gate to wholesale are estimated at USh 122 000 per cattle (or USD 373.4 per tonne of processed carcass assuming average carcass weight of 150 kg per cattle).
Observed access costs from the abattoir (Ex-wholesale) to border include slaughtering3, storage (chilling and freezing), processing and packaging, transport and handling at Entebbe air port and profit margin in addition to large and local authority fees. Table 5 presents the itemized observed access costs for this segment. Handling costs are obtained from the study on domestic resource costs of the Bank of Uganda (2011) while other costs are based the study of Landell Mills LTD (2011). For 2010, the observed access costs from the abattoir to the border are estimated at USh 2.174 million per tonne (or USD 998.3 per tonne). Indeed these are substantial costs with the process, packaging and storage contributing the major share of these costs (Table 5).
The observed difference between farm gate and wholesale prices of meat is much higher than the estimated costs in all years. This may indicate that profit margin reported were probably underestimated which is not surprising as respondents usually under-report their true income and profit. On the other hand, the observed difference between the FOB price and wholesale price of beef is lower than the estimated access costs for 2008 while it is higher than the estimated costs for 2009-2011 (see Annex I).
Adjusted
2 The treatment of access costs as observed and adjusted costs corresponds closely to private versus social costs or financial versus economic costs where financial costs (observed) are derived from the market prices (current or expected) of the transactions as they are experienced. By contrast, in economic analysis (such as cost benefit analysis), the (adjusted) costs and benefits of a project are analyzed from the point of view of society and not from the point of view of a single agent ( ). As such, interest on borrowing, taxes, direct or indirect subsidies are transfers that do not therefore constitute an economic cost. 3 The revenue from by-products (head, skin, etc.) is deducted from the abattoir costs.
18

Adjusted access costs are calculated on the basis of the opportunity cost, of marketing services. As such, all cost elements of transfer nature (profit margins, local taxes and fees not rendered for service) are firstly netted out of the observed access costs. Second, we assume that the private costs of non-traded goods and services such as transportation and marketing provide reasonable estimates of their opportunity costs as post-farm services are usually non-traded and the costs of transportation and processing are locally determined. Third, a normal margin of profit for traders, the lesser of observed margin and 10 per cent of costs, is added. Table 4 presents the adjusted access costs from the farm gate to wholesale market in Kampala derived directly from the data on observed access cost.
To derive the adjusted costs from the abattoir to border, Observed access costs were adjusted for local authority taxes (Table 5). The estimated adjusted costs for 2010 are USD 958.5 per tonne (or USh 2.088 million per tonne). As with the case of the observed costs, costs for 2010 are adjusted by the consumers’ price index (CPI) for inflation to extrapolate to other years. While the adjusted access costs from the abattoir to border are only slightly lower than the observed costs, the adjusted costs from the farm gate to wholesale market represents only 60 per cent of the observed access costs. This reflects the excessive taxation and margins in this latter segment of the market.
Table 4: Observed and adjusted access costs of live cattle and beef equivalent between the farm gate and wholesale market in Kampala, Uganda (2010)
Market segment Cost element Observed access costs Adjusted access costs
Live cattle USh/animal
beef USh/tonnea
Beef USh/tonne
Farm gate-primary/ secondary market
Permit 2,000 13,333.3 13,333.3 Loading 5,000 33,333.3 33,333.3 Local tax at the secondary market 5,000 33,333.3 - transportation cost 50,000 333,333.3 333,333.3 lairage fee 10,000 66,666.7 66,666.7 other fees and lossesb 10,000 66,666.7 - profit margin 20,000 133,333.3 133,333.3 Subtotal 102,000 680,000.0 580,000.00
Secondary-tertiary (wholesale)
Inspection fees 500 3,333.3 3,333.3 Permit costs 1,000 6,666.7 6,666.7 Levy at the tertiary market 5,500 36,666.7 - Handling fees (loading, transit) 1,500 10,000.0 10,000.0 Trucking costs 7,250 48,333.3 48,333.3 traffic police (NTB) 1,000 6,666.7 - profit margin 3,250 21,666.7 21,666.7 Subtotal 20,000 133,333.3 90,000.0
Abattoir to processor
Liarage costs 2,000 13,333.3 13,333 Local authority fees 2,000 13,333.3 - revenue from offal -263,000 -1,753,333.3 -1,753,333) Processing cost 352,200 2,348,000.0 2,348,000 Storage cost (chilling & freezing) 5,000 33,333.3 33,333 profit margin 297,800 1,985,333.3 901,467 Subtotal 396,000 2,640,000 1,542,800
Total access costs from farmgate to the point of competition 518,000 3,453,333 2,212,800 Processor to border transport to and handling at Entebbe
airport - 263,303 263,303
Total access costs from the point of competition to the border - 263,303 263,303 a. Cattle are converted to equivalent carcasses weight assuming average weight of 150 kg/animal.
Source: Observed access costs are compiled from Landell Mills LTD (2011).
19

EXTERNALITIES Externalities were not accounted for in this analysis for lack of information on types of externalities and data to estimate them.
BUDGET AND OTHER TRANSFERS
This data is expected to be computed in the expenditure analysis, an integral part of this analysis. This is on-going work and will be included as it becomes available.
QUALITY AND QUANTITY ADJUSTMENTS For lack of producers’ prices of live animals, the analysis here is based on beef (carcasses) prices as explained above. Therefore, quantity adjustment is not needed. We assume that there are no quality difference between exported and domestically traded meat and hence quality adjustment is irrelevant. Table 5 summarizes sources of the data used in estimating the policy indicators for beef and Table 6 summarize the data used in the analysis as described above.
DATA OVERVIEW Sources of the data variables used in the analysis of the policy and market indicators of rice at the household and wholesale levels are summarized in Table 5. Table 6 presents the data used in the calculation of the indicators as described above. The data and the computation of the various indicators is presented in Annex 2.
20

Table 5: Summary of the description of the data used in the estimation of policy indicators for beef in Uganda
data Description Observed Adjusted
Benchmark price CIF price calculated as unit value from export data reported in by UBoS (see Figure 5)
N.A.
Domestic price at point of competition
Export unit price of processed beef minus the transportation and handling costs at Entebbe airport (see Figure 5)
N.A.
Domestic price at farm gate
Annual average wholesale price in main producing area as reported by Infotrade (2012) adjusted by marketing costs (see Figure 5)
N.A.
Exchange rate Annual average of exchange rate as reported by UBoS (2012)
NA
Access cost from the border to the point of competition (Entebbe airport)
Transportation and handling costs at Entebbe airport as reported by Bank of Uganda (2011) (see table 4)
Transportation and handling costs at Entebbe airport as reported by Bank of Uganda (2011) (see table 4)
Access costs from farm gate to point of competition
All observed marketing costs involved in marketing and processing of cattle from the farm gate to point of competition including transportation, fees, taxes and levies, slaughtering and processing, non-tariff measures and marketing margins as reported by Landell Mills LTD (2011) (see Table 4)
All observed marketing costs involved in marketing and processing of cattle from the farm gate to point of competition including transportation, slaughtering and processing and marketing margins as reported by Landell Mills LTD (2011) (see table 4)
CALCULATION OF INDICATORS
The indicators and the calculation methodology used is described in Box 1. A detailed description of the calculations and data requirements is available on the MAFAP website or by clicking here.
The estimated indicators include the observed and adjusted price gaps at the farm gate and the wholesale markets and the associated observed and adjusted nominal rate of protection. Table 7 presents the estimated price gaps at the two markets for 2008-2011 while Table 8 presents the estimated rates of protection for the same time period and Table 9 provides estimates of market development gap.
21
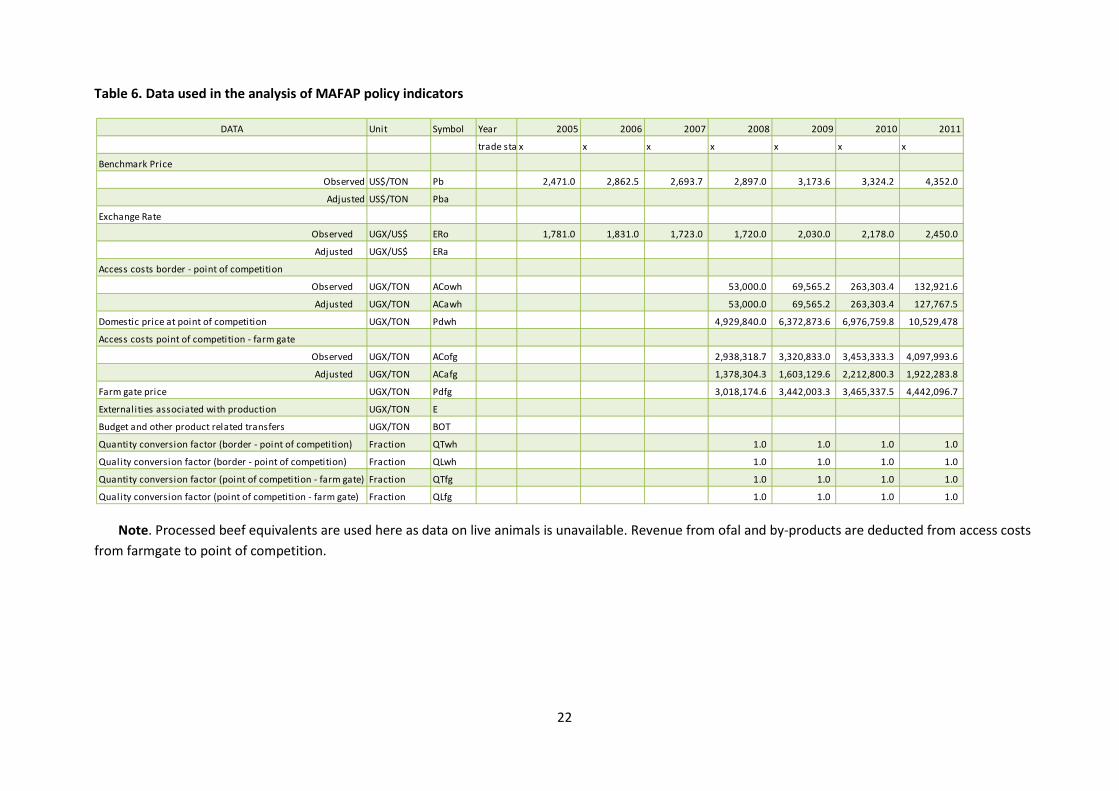
Table 6. Data used in the analysis of MAFAP policy indicators
Note. Processed beef equivalents are used here as data on live animals is unavailable. Revenue from ofal and by-products are deducted from access costs from farmgate to point of competition.
DATA Unit Symbol Year 2005 2006 2007 2008 2009 2010 2011
trade sta x x x x x x x
Benchmark Price
Observed US$/TON Pb 2,471.0 2,862.5 2,693.7 2,897.0 3,173.6 3,324.2 4,352.0
Adjusted US$/TON Pba
Exchange Rate
Observed UGX/US$ ERo 1,781.0 1,831.0 1,723.0 1,720.0 2,030.0 2,178.0 2,450.0
Adjusted UGX/US$ ERa
Access costs border - point of competition
Observed UGX/TON ACowh 53,000.0 69,565.2 263,303.4 132,921.6
Adjusted UGX/TON ACawh 53,000.0 69,565.2 263,303.4 127,767.5
Domestic price at point of competition UGX/TON Pdwh 4,929,840.0 6,372,873.6 6,976,759.8 10,529,478
Access costs point of competition - farm gate
Observed UGX/TON ACofg 2,938,318.7 3,320,833.0 3,453,333.3 4,097,993.6
Adjusted UGX/TON ACafg 1,378,304.3 1,603,129.6 2,212,800.3 1,922,283.8
Farm gate price UGX/TON Pdfg 3,018,174.6 3,442,003.3 3,465,337.5 4,442,096.7
Externalities associated with production UGX/TON E
Budget and other product related transfers UGX/TON BOT
Quantity conversion factor (border - point of competition) Fraction QTwh 1.0 1.0 1.0 1.0
Quality conversion factor (border - point of competition) Fraction QLwh 1.0 1.0 1.0 1.0
Quantity conversion factor (point of competition - farm gate) Fraction QTfg 1.0 1.0 1.0 1.0
Quality conversion factor (point of competition - farm gate) Fraction QLfg 1.0 1.0 1.0 1.0
22

Box 1: MAFAP POLICY INDICATORS
MAFAP analysis uses four measures of market price incentives or disincentives. First, are the two observed nominal rates of protection one each at the wholesale and farm level. These compare observed prices to reference prices free from domestic policy interventions.
Reference prices are calculated from a benchmark price such as an import or export price expressed in local currency and brought to the wholesale and farm levels with adjustments for quality, shrinkage and loss, and market access costs.
The Nominal Rates of Protection - observed (NRPo) is the price gap between the domestic market price and the reference price divided by the reference price at both the farm and wholesale levels:
𝑁𝑅𝑃𝑜𝑓𝑔 = (𝑃𝑓𝑔 − 𝑅𝑃𝑜𝑓𝑔) 𝑅𝑃𝑜𝑓𝑔; ⁄ 𝑁𝑅𝑃𝑜𝑤ℎ = (𝑃𝑤ℎ − 𝑅𝑃𝑜𝑤ℎ) 𝑅𝑃𝑜𝑤ℎ; ⁄
The NRPofg captures all trade and domestic policies, as well as other factors which impact on the incentive or disincentive for the farmer. The NRPowh helps identify where incentives and disincentives may be distributed in the commodity market chain.
Second are the Nominal Rates of Protection - adjusted (NRPa) in which the reference prices are adjusted to eliminate distortions found in developing country market supply chains. The equations to estimate the adjusted rates of protection, however, follow the same general pattern:
𝑁𝑅𝑃𝑎𝑓𝑔 = (𝑃𝑓𝑔 − 𝑅𝑃𝑎𝑓𝑔) 𝑅𝑃𝑎𝑓𝑔; ⁄ 𝑁𝑅𝑃𝑎𝑤ℎ = (𝑃𝑤ℎ − 𝑅𝑃𝑎𝑤ℎ) 𝑅𝑃𝑎𝑤ℎ; ⁄
MAFAP analyzes market development gaps caused by market power, exchange rate misalignments, and excessive domestic market costs which added to the NRPo generate the NRPa indicators. Comparison of the different rates of protection identifies where market development gaps can be found and reduced.
Table 7: MAFAP price gaps for beef in Uganda 2008-2011 (USD per Mt)
2008 2009 2010 2011 Trade status for the year x x x x Observed price gap at wholesale - - - - Adjusted price gap at wholesale - - - (5,154) Observed price gap at farm gate 1,026,653 389,963 (58,089) (1,989,388) Adjusted price gap at farm gate (533,361) (1,327,741) (1,298,622) (4,165,098)
Note. The price gaps at the point of competition are zero since processors export directly and receive the full export price less the relevant cost of exporting. Source: Own calculations using data as described above.
23

Table 8: MAFAP nominal rates of protection (NRP) for beef in Uganda 2008-2011 (%)
2008 2009 2010 2011 average Trade status for the year x x x x x Observed NRP at wholesale 0.0% 0.0% 0.0% 0.0% 0.0% Adjusted NRP at wholesale 0.0% 0.0% 0.0% 0.0% 0.0% Observed NRP at farm gate 51.6% 12.8% -1.6% -30.9% 7.9% Adjusted NRP at farm gate -15.0% -27.8% -27.3% -48.4% -29.6%
Note. The NRP at the point of competition are zero since processors export directly and receive the full export price less the relevant cost of exporting.
Source: Own calculations using data as described above.
Table 9: MAFAP Market Development Gaps for beef in Uganda 2008-2011 (USD per Mt)
2008 2009 2010 2011 Trade status for the year x x x x International markets gap (IRG) 0 0 0 0 Exchange policy gap (ERPG) 0 0 0 0 Access costs gap to wholesale market (ACGwh)
0 0 0 0
Access costs gap to farm gate (ACGfg) -1,560,014 -1,717,703 -1,240,533 -2,175,710 Access costs gap to farm gate (ACGfg) as a percentage of the adjusted reference price at the farmgate -43.93% -36.01% -26.04% -25.28%
Source: Own calculations using data as described above.
4. INTERPRETATION OF THE INDICATORS Despite the limited contribution of livestock and livestock products to export earnings of Uganda, its export of beef apparently are receiving lucrative prices in recent years compared to domestic prices (Figure 5) as exporters of processed beef are exploiting niche markets in neighboring countries and peace keeping missions in the region. Thus, processed beef is considered here as a thinly-traded commodity given the small fraction of the product traded internationally. As sufficient information on live cattle markets is unavailable, the beef processing industry may give some insight into the incentives/disincentives to cattle owners.
Similar to the case of other exports, beef exports are benefiting from the export promotion measures adopted to diversify Uganda’s exports. With no export taxes, processed beef exporters receive the full FOB export price less applicable costs from the point of competition to the border. These costs represent transportation from the processing factory and handling at Entebbe airport from which the product is shipped to importers. Therefore, the price gaps and the nominal rates of protection are, by definition, equal to zero. This export market structure give the advantage for the processors/exporters to reap all potential profit margins estimated at 18% of the unit cost of beef production (the price of live animals plus operation costs) according to 2010 data reported in Landell Mills LTD (2011). In view of the analysis here, this is considered as excessive profit margin.
At the farmgate, the analysis reveals that the structure of the incentives/disincentives in the beef market is quite variable over time within the short time frame of the analysis (2008-2011). The estimated observed price gaps and nominal rate of protection for beef were initially (2008-2009) positive and substantial
24

representing 12.8-51.6 per cent of the FOB reference price for cattle farmers. These represent considerable support for producers in these two years. However, export prices started to rise rapidly in 2010-2011 while the domestic prices at farm gate were only increased slightly. This eroded the support experienced in previous years, reversing the price gaps and nominal rate of protection. The negative price gaps during these two years were as high as USD 1117 per tonne (equivalent to USD 167.7 per head) at the farm gate (Table 7). This is substantial price gap. The observed nominal rates of protection during these two years were -1.6 per cent and -30.9 per cent (Table 8). For the four years (2008-2011), the observed nominal rate of protection averaged 7.9 per cent (Table 7).
Despite the initial positive value of observed indicators, the adjusted indicators at the farmgate were negative throughout the period of analysis. The adjusted price gaps ranged from US -$299.5 to -$2338.6 and adjusted nominal rates of protection ranged from -15.0 to -48.4 per cent and averaged -29.6 per cent (Table 7-8). The main driver of the deviation of the observed indicators from their corresponding adjusted ones is the existence of substantial market development gaps estimate at 33 per cent on average (Table 9). The underlying causes of this market development gap include the excessive local taxes at each marketing stage of live cattle en route to wholesale markets, excessive profit margins accumulated from the multiple transactions at the primary, secondary and wholesale markets.
In the current marketing chains, cattle moves through several markets with cumulative profit margins accruing to each participating marketing agents and local taxes and fees paid at each transaction. This poorly structured value chain leads to high marketing costs of cattle which, in turn, lowers producers’ prices and hence disincentives to cattle farmers. However, the unexplained part of the market development gap (the difference between the estimated price gap and access cost gap) is still substantial4. The market development gap in Uganda may be due to asymmetry of market information between livestock producers and wholesalers on one side and between wholesalers and processors/exporters on the other side. This is evident from the relatively high profit of meat processors/exporters compared to those accrue to traders even when price gaps were negative. In addition, the potential for market power exists in the processing/export of beef. Only few (three) beef processor plants with the potential for export are currently operating.
Uganda has liberalized its economic policy; there are no known policy measures to influence domestic beef prices other than local taxes and marketing levies5. There is no export restriction on agricultural products, nor has the government instituted any recent ban on trade. Under these conditions, the nominal rates of protection and price gaps were expected to be close to zero. Accordingly, these price gaps are likely to be due to factors not related to agricultural policies. The above discussion suggests that domestic prices substantially deviate negatively from export (world) prices. As Figure 5 indicates, price transmission from world markets to domestic markets is apparently weak. As such, incentives/disincentives in the beef markets are primarily driven by the domestic market factors as domestic prices respond only weakly to the ups and downs of the world market prices.
4 This difference cannot be explained by other macroeconomic factors considered in the analytical approach such as export price or exchange rate misalignment. 5 These were accounted for in the observed access costs estimates.
25

5. PRELIMINARY CONCLUSIONS AND RECOMMENDATIONS MAIN MESSAGE
Domestic beef prices during the period of 2008-2011 deviate negatively or positively from export (world) prices as indicated by the high positive and negative price gaps and nominal rates of protection. As Uganda has liberalized its economic policy, there are no known policy measures to influence domestic beef prices other than local taxes and marketing levies, these price gaps are likely to be due to factors not related to agricultural or economic policies. Rather, the analysis suggests existence of development gap in the beef and livestock market partly explained by the gap between the observed marketing costs and margins - access costs - and a reasonable estimate of these costs that reflect the opportunity cost of livestock and beef marketing. Possible factors related to lack of symmetrical market information for both buyers and sellers of livestock and market power.
PRELIMINARY RECOMMENDATIONS
With the country well-advanced in its plan for liberalizing the economy and commercialization of agriculture and adoption of policies geared towards the development of livestock sector, the Government of Uganda may need to focus on solving the structural problems leading to the market development gap.
LIMITATIONS
As with many commodities in Uganda, producers’ prices of beef and live animal are very scarce. The validity of the analysis and indicators presented in this notes is contingent on the quality of the data used especially the results related to indicators at the farm gate. Moreover, the analysis is limited to the last four years. A longer period may give a better insight on the persistent of the market development gap.
FURTHER INVESTIGATION AND RESEARCH
This research may benefit substantially from a comparison of the indicators for beef and live cattle which constitutes a major and non-traditional export for Uganda.
26

6. BIBLIOGRAPHY Bank of Uganda (BoU). (2011). Report on the Domestic Resource Cost ratios for Selected Export Commodities 2009/10. Bank of Uganda, Kampala, Uganda.
Greenbelt Consult Limited. 2006. An Analysis of the Implications of Uganda’s Livestock Policies for the Competitiveness of its Livestock and Livestock products in the Local and International markets. Final Report submitted to Uganda program for trade Opportunities and Policy, Ministry of Tourism, Trade and Industry, Kampala, Uganda.
Infotrade Uganda. 2011. Market Analysis Report 2011. Kampala, Uganda.
Infotrade Uganda. 2012. Wholesale and Retail Price of Selected Commodities in Uganda. Infotrade. FIT Uganda Ltd. Kampala, Uganda.
Landell Mills. 2011. Study on promoting a commercial beef industry in Uganda. Final Report. March 2011. A report prepared for Ministry of Agriculture, Animal industry and Fisheries (MAAIF), Entebbe, Uganda. Pg. 91.
Ministry of Agriculture, Animal industry and Fisheries (MAAIF). 1998. Meat Production Master Plan, Ministry of Agriculture, Animal Industry and Fisheries (MAAIF) Entebbe Uganda
Ministry of Agriculture, Animal Industry and Fisheries (MAAIF). 2010. Statistical Abstract. Ministry of Agriculture, Animal Industry and Fisheries, Entebbe, Uganda.
Ministry of Agriculture, Animal Industry and Fisheries (MAAIF). 2011. Statistical Abstract. Ministry of Agriculture, Animal Industry and Fisheries, Entebbe, Uganda.
OECD (2006) OECD’S PRODUCER SUPPORT ESTIMATE AND RELATED INDICATORS OF AGRICULTURAL SUPPORT Concepts, Calculations, Interpretation and Use (The PSE Manual). TRADE AND AGRICULTURE DIRECTORATE. OECD. Paris, France.
Uganda Bureau of Statistics (UBoS). 2012. Trade data. http://www.ubos.org/index.php?st=pagerelations&id=15&p=related%20pages:Macro-economic. Accessed January 2012.
Uganda Investment Authority (UIA). 2009. Uganda: Livestock Sector Brief. Uganda Investment Authority, Kampala. Uganda. www.ugandainvest.com
27
ANNEX I: METHODOLOGY USED
A guide to the methodology used by MAFAP can be downloaded from the MAFAP website or by clicking here.
28

ANNEX II: DATA AND CALCULATIONS USED IN THE BEEF ANALYSIS Year 2005 2006 2007 2008 2009 2010 2011
DATA Unit Symbol trade status x x x x x x xBenchmark Price
Observed US $/TON Pb(int$) 2,470.95 2,862.51 2,693.66 2,897.00 3,173.62 3,324.18 4,352.00 Adjusted US $/TON Pba
Exchange RateObserved USh/US $ ERo 1,781.00 1,831.00 1,723.00 1,720.00 2,030.00 2,178.00 2,450.00
Adjusted USh/US $ ERa
Access costs border - point of competitionObserved USh/TON ACowh 91,562.8 95,161.2 38,985.15 53,000.00 69,565.19 263,303.39 132,921.65
Adjusted USh/TON ACawh 91,562.75 95,161.17 38,985.15 53,000.00 69,565.19 263,303.39 132,921.65 Domestic price at point of competition USh/TON Pdwh 4,309,203.29 5,146,089.26 4,602,198.75 4,929,840.00 6,372,873.56 6,976,759.79 10,529,478.35 Access costs point of competition - farm gate
Observed USh/TON ACof g 2,378,820.23 2,472,307.87 2,622,411.42 2,938,318.75 3,320,833.04 3,453,333.33 4,097,993.61 Adjusted USh/TON ACaf g 1,115,855.20 1,159,708.31 1,230,118.78 1,378,304.35 1,603,129.61 2,212,800.33 1,922,283.76
Farm gate price USh/TON Pdf g - - - 3,018,174.64 3,442,003.29 3,465,337.50 4,442,096.67 Externalities associated with production USh/TON EBudget and other product related transfers USh/TON BOTQuantity conversion factor (border - point of competition) Fraction QTwh
Quality conversion factor (border - point of competition) Fraction QLwh
Quantity conversion factor (point of competition - farm gate) Fraction QTf g
Quality conversion factor (point of competition - farm gate) Fraction QLf g
CALCULATED PRICES Unit Symbol 2005 2006 2007 2008 2009 2010 2011Benchmark price in local currency
Observed USh/TON Pb(loc$) 4,400,766.05 5,241,250.43 4,641,183.90 4,982,840.00 6,442,438.75 7,240,063.18 10,662,400.00 Adjusted USh/TON Pb(loc$)a 4,400,766.05 5,241,250.43 4,641,183.90 4,982,840.00 6,442,438.75 7,240,063.18 10,662,400.00
Reference Price at point of competitionObserved USh/TON RPowh 4,309,203.29 5,146,089.26 4,602,198.75 4,929,840.00 6,372,873.56 6,976,759.79 10,529,478.35 Adjusted USh/TON RPawh 4,309,203.29 5,146,089.26 4,602,198.75 4,929,840.00 6,372,873.56 6,976,759.79 10,529,478.35
Reference Price at Farm Gate Observed USh/TON RPof g 1,930,383.06 2,673,781.39 1,979,787.33 1,991,521.25 3,052,040.51 3,523,426.46 6,431,484.74 Adjusted USh/TON RPaf g 3,193,348.09 3,986,380.95 3,372,079.98 3,551,535.65 4,769,743.95 4,763,959.46 8,607,194.59
INDICATORS Unit Symbol 2005 2006 2007 2008 2009 2010 2011Price gap at point of competition
Observed USh/TON PGowh - - - - - - - Adjusted USh/TON PGawh - - - - - - -
Price gap at farm gateObserved USh/TON PGof g (1,930,383) (2,673,781) (1,979,787) 1,026,653 389,963 (58,089) (1,989,388) Adjusted USh/TON PGaf g (3,193,348) (3,986,381) (3,372,080) (533,361) (1,327,741) (1,298,622) (4,165,098)
Nominal rate of protection at point of competitionObserved % NRPowh 0.00% 0.00% 0.00% 0.00% 0.00% 0.00% 0.00%Adjusted % NRPawh 0.00% 0.00% 0.00% 0.00% 0.00% 0.00% 0.00%
Nominal rate of protection at farm gateObserved % NRPof g -100.00% -100.00% -100.00% 51.55% 12.78% -1.65% -30.93%Adjusted % NRPaf g -100.00% -100.00% -100.00% -15.02% -27.84% -27.26% -48.39%
Nominal rate of assistanceObserved % NRAo -100.00% -100.00% -100.00% 51.55% 12.78% -1.65% -30.93%Adjusted % NRAa -100.00% -100.00% -100.00% -15.02% -27.84% -27.26% -48.39%
Decomposition of PWAfg Unit Symbol 2005 2006 2007 2008 2009 2010 2011International markets gap USh/TON IRG - - - - - - - Exchange policy gap USh/TON ERPG - - - - - - - Access costs gap to point of competition USh/TON ACGwh - - - - - Access costs gap to farm gate USh/TON ACGf g (1,262,965) (1,312,600) (1,392,293) (1,560,014) (1,717,703) (1,240,533) (2,175,710) Externality gap USh/TON EG - - - - - - - Market Development Gap USh/TON MDG (1,262,965) (1,312,600) (1,392,293) (1,560,014) (1,717,703) (1,240,533) (2,175,710) Market Development Gap % MDG -39.55% -32.93% -41.29% -43.93% -36.01% -26.04% -25.28%
29