Analysis of In-Depth Crash Data on Indian National ...
14
Analysis of In-Depth Crash Data on Indian National Highways and Impact of Road Design on Crashes and Injury Severity Jeya Padmanaban*, Ravishankar Rajaraman**, Greg Stadter*, Swastik Narayan**, Bharat Ramesh** *JP Research, Inc., 2570 West El Camino Real, Suite 200, Mountain View, CA – 94040, USA **JP Research India Pvt. Ltd., RR Tower IV, Ground Floor, Thiru-Vi-Ka Industrial Estate, Guindy, Chennai – 600032, Tamil Nadu, India. Abstract – The National Highways Development Project in India is aimed at upgrading over 12,000 km of national highways from 2-lane undivided roads to 4-lane divided roads. With nearly 40% of fatal crashes being reported on national highways, the effect of this project on road safety needs to be assessed. Researchers carried out on-site crash investigations and in-depth crash data collection for a period of 45 to 60 days on four 2-lane undivided highways and a 4-lane divided highway. Based on 76 crashes examined, researchers found a shift of crash pattern from head-on collisions on undivided 2- lane highways to front-rear collisions on divided 4-lane highways. This paper presents the methodology, analysis of crashes examined, and the critical safety problems identified for greater consideration in future highway development projects. This paper also highlights the need and significance of in-depth crash investigations to understand local traffic conditions and problems in India. INTRODUCTION Indian road network and the National Highways Development Project (NHDP) The road network in India is the second largest in the world and spans over 3,300,000 km. These roads are categorized in Table 1. The most important roadways connecting states across the country are the national highways that are developed and maintained by the Government of India. Although national highways constitute a little over 2% of the road network, it is estimated that they carry around 40% of the road traffic in the country [1]. Table 1. Indian Road Network [1]. As per the Society of Indian Automobile Manufacturers (SIAM), the domestic sales of vehicles in India rose from 6,810,537 in 2003-04 to 12,292,770 in 2009-10 [2]. This increase of 80% in domestic sales in just 6 years raises many concerns about the shortage of road networks to support this rapid growth in vehicles. To address this issue, the Government of India launched a major initiative to upgrade the road networks, especially the national highways, through various phases of the National Highways Development Project (NHDP). In phase 3 of this development project, existing 2-lane undivided national highways (12,109 km) are being widened and converted to 4-lane divided highways. As of 30 th April 2010, about 1,649 km of the 12,109 km have been widened to 4-lanes while the balance is either under implementation or waiting award of contracts [1]. Road accidents on national highways: A major concern The second largest road network in the world also has the distinction of being known for the highest number of road accidents and fatalities in the world. Data published by the National Crime Records Bureau (NCRB), Ministry of Home Affairs, Government of India, shows that road accident fatalities Road Type Length (in km) Expressways 200 National Highways 70,548 State Highways 131,899 Major District Roads 467,763 Rural and Other Roads 2,650,000
Transcript of Analysis of In-Depth Crash Data on Indian National ...
Analysis of In-Depth Crash Data on Indian National Highways and
Impact of Road Design on Crashes and Injury Severity
Jeya Padmanaban*, Ravishankar Rajaraman**, Greg Stadter*,
Swastik Narayan**, Bharat Ramesh**
*JP Research, Inc., 2570 West El Camino Real, Suite 200, Mountain View, CA – 94040, USA
**JP Research India Pvt. Ltd., RR Tower IV, Ground Floor, Thiru-Vi-Ka Industrial Estate, Guindy, Chennai – 600032,
Tamil Nadu, India.
Abstract – The National Highways Development Project in India is aimed at upgrading over 12,000 km of national
highways from 2-lane undivided roads to 4-lane divided roads. With nearly 40% of fatal crashes being reported on national
highways, the effect of this project on road safety needs to be assessed. Researchers carried out on-site crash investigations
and in-depth crash data collection for a period of 45 to 60 days on four 2-lane undivided highways and a 4-lane divided
highway. Based on 76 crashes examined, researchers found a shift of crash pattern from head-on collisions on undivided 2-
lane highways to front-rear collisions on divided 4-lane highways. This paper presents the methodology, analysis of crashes
examined, and the critical safety problems identified for greater consideration in future highway development projects. This
paper also highlights the need and significance of in-depth crash investigations to understand local traffic conditions and
problems in India.
INTRODUCTION
Indian road network and the National Highways Development Project (NHDP)
The road network in India is the second largest in the world and spans over 3,300,000 km. These roads
are categorized in Table 1. The most important roadways connecting states across the country are the
national highways that are developed and maintained by the Government of India. Although national
highways constitute a little over 2% of the road network, it is estimated that they carry around 40% of
the road traffic in the country [1].
Table 1. Indian Road Network [1].
As per the Society of Indian Automobile Manufacturers (SIAM), the domestic sales of vehicles in
India rose from 6,810,537 in 2003-04 to 12,292,770 in 2009-10 [2]. This increase of 80% in domestic
sales in just 6 years raises many concerns about the shortage of road networks to support this rapid
growth in vehicles. To address this issue, the Government of India launched a major initiative to
upgrade the road networks, especially the national highways, through various phases of the National
Highways Development Project (NHDP). In phase 3 of this development project, existing 2-lane
undivided national highways (12,109 km) are being widened and converted to 4-lane divided
highways. As of 30th April 2010, about 1,649 km of the 12,109 km have been widened to 4-lanes
while the balance is either under implementation or waiting award of contracts [1].
Road accidents on national highways: A major concern The second largest road network in the world also has the distinction of being known for the highest
number of road accidents and fatalities in the world. Data published by the National Crime Records
Bureau (NCRB), Ministry of Home Affairs, Government of India, shows that road accident fatalities
Road Type Length (in km)
Expressways 200
National Highways 70,548
State Highways 131,899
Major District Roads 467,763
Rural and Other Roads 2,650,000

have been steadily rising each year and in year 2008, there were 118,239 fatalities due to road
accidents [3], as shown in figure 1.
������ ���� ����� ����� �������
�
�����
������
�������
�������
��� ��� ���� ���� ����
� ���� ���� �
�������� � ������
Figure 1. Distribution of Fatalities by Calendar Year [3].
It is estimated that over 40% of the road traffic fatalities in India occur on national highways. As
national data on accidents and fatalities by road type was not available, researchers obtained data for
the state of Tamil Nadu, which has the highest number of road accidents among all states of India.
Table 2 shows data for year 2008 indicating that the national highways in Tamil Nadu constitute 2.5%
of the entire state road network. Road accident deaths on national highways account for 35% of the
total road accident deaths in Tamil Nadu.
Tamil Nadu
(For year 2008)
Length
(in km)
No. of
Accidents
Accidents
per km
No. of
Fatalities
Fatalities
per km
National Highways 4,832 20,054 4.15 4,509 0.93
All Roads 192,319 60,409 0.31 12,784 0.06
% on National Highways 2.51 33.19 - 35.37 -
Table 2. Data on National Highways and All Roads of Tamil Nadu for the Year 2008 [4].
With nearly 1 fatality occurring per km, road accidents on national highways need to be studied in
more detail to understand the types of crashes and examine injury mechanisms causing these fatalities.
More importantly, the effects of the NHDP also need to be analyzed to determine and assess its
influence on accidents in future.
To address these concerns, researchers initiated on-site crash investigation studies on 5 national
highways in Tamil Nadu with the co-operation of the state police. These pioneering studies, conducted
over a period of 45 to 60 days, are initial efforts to obtain in-depth traffic crash data, the absence of
which is impeding scientific research and analysis of road traffic accidents in India. This paper
presents the findings of the crash data collected during these sample studies to:
1. Determine the types of crashes and resulting injury severities on the five national highways.
2. Determine the differences in crash patterns and injury severity between existing 2-lane undivided
highways and 4-lane divided highways, and estimate the effect of NHDP on road safety.
3. Identify critical infrastructure problems, especially relating to 4-lane divided highways being built
as part of the NHDP.
4. Highlight the need for crash investigations and in-depth crash data for a better understanding of
local crash conditions, before implementing measures adopted from developed countries.
HIGHWAYS STUDIED
Researchers obtained information from the Tamil Nadu police about accident-prone highway stretches
in the state. Based on information provided, a stretch of the 4-lane divided NH45 in Kanchipuram,

which was recently developed as part of the NHDP, was selected. In addition, four highways in
Coimbatore district, viz. NH47, NH47 Bypass, NH209 and NH67, were also selected. The selection of
the study area limits was not only based on crash numbers in that stretch, but also on the possibility of
researchers arriving at any accident spot on the highway within 30 minutes from the time of
notification from the police. Table 3 lists the highway stretches studied. These highways have been
classified under three types of road structures.
Road Structure Highway Length (in km)
Undivided 2-lane without paved shoulder NH47 18
NH209 16
Undivided 2-lane with paved shoulder NH47 Bypass 20
NH67 20
Divided 4-lane with paved shoulder NH45 75
Table 3. Description of Each of the Highway Stretches Studied.
A brief description of each highway is provided below to understand the road structure and traffic
conditions.
Undivided 2-lane highway without paved shoulders: NH47 and NH209
Figure 2. Typical Sections of NH47 (left) and NH209 (right).
The NH47 has a high volume of traffic during the day as the highway connects major industrial areas
with Coimbatore city. NH209 is relatively less busy as compared with NH47. Both the highways are
narrow and, as can be seen in Figure 2, have no paved shoulders. The most prominent difference
between the NH47 and NH209 is the presence of trees alongside the entire stretch of NH209. Also
unlike the NH47, which has many straight stretches, the NH209 highway has many curves and fewer
straight stretches. There are also a number of junctions where narrow village roads join the NH209.
Most of the highway stretch is not lit at night. Lighting is provided only at junctions.
Undivided 2-lane highway with paved shoulders: NH67 and NH47 Bypass
Both, the NH67 and NH47 Bypass, are undivided highways, but are wider than the NH47 and NH209
due to the provision of a paved shoulder of 1.5 metres along the entire stretch of both highways. The
most prominent difference between the two is the presence of concrete poles all along the NH47
Bypass, as can be seen in Figure 3. These poles, placed at regular intervals of 3 metres, are provided
for delineation. The NH47 Bypass also has a number of intersections with narrow village roads, while
the NH67 passes through a town and has many places of interest (temples, schools, shops) adjacent to
the road. While lighting is provided at many sections of the NH67, the NH47 Bypass is completely

unlit. An important observation was that motorized two-wheeler riders, especially on the NH47
Bypass, used the shoulder as their lane.
Figure 3. Typical Sections of NH67 (left) and NH47 Bypass (right).
Divided 4-lane highway with paved shoulders: NH45
The NH45 was developed from a 2-lane highway to a 4-lane highway under the NHDP, as shown in
Figure 4. The median is about 5 metres in width and is usually planted with large bushes and plants. A
paved shoulder of 1.5 metres is provided along the entire length of the highway. Speed limit at some
sections is specified as 60 kmph and at others is 80 kmph. However, actual travel speeds are observed
to be much higher. Lighting is provided only at intersections/junctions and some areas such as truck
lay-bys. Otherwise, a good part of the highway is not lit.
Figure 4. Typical Section of NH45 with Wide Median and Paved Shoulders.
METHODOLOGY
Researchers in India have applied internationally accepted crash investigation methodologies and
tailored it to Indian conditions. The following is a description of how the real-time on-site crash
investigation was conducted.
Crash notification and researcher response A crash notification network was established between researchers and all the police stations and
highway patrols located in the study areas. On occurrence of a crash, the police called a dedicated
contact number that was manned 24 hours a day by one of the researchers during the entire project
period. As soon as a call was received and details of the crash were noted down, researchers
immediately travelled to the crash scene from their base camp.

On-site crash investigation process
Over the past two years, researchers have developed a reliable, efficient and comprehensive method of
extracting in-depth crash information from the crash scene, crashed vehicles and medical records of
crash victims. These processes are based on internationally acknowledged and well established
practices such as the National Automotive Sampling System (NASS) in the US and the Co-operative
Crash Injury Study (CCIS) in the UK. These processes have been detailed in earlier papers [5], [6]. A
brief explanation of the crash investigation activities is provided below.
Crash scene examination On arrival at the crash scene, researchers photograph the point of impact (POI), vehicles, and
surroundings from all angles, especially covering the direction of vehicle approach and travel. The
notion is to document the accident and all available evidence in photographs for future references and
analyses. Scene measurements are taken to help identify the final positions of the crashed vehicles,
objects that may have been struck, volatile evidence (such as skid marks, broken parts, etc.) and point
of impact with respect to the road infrastructure and surrounding environment. The road and
surrounding infrastructure is assessed and details such as road type, surface condition, flow of traffic,
roadway structure, weather, lighting, etc. are recorded. On completion of the above activities and after
developing an understanding of the accident events, the entire accident scene is diagrammatically
represented to-scale in order to give a simple and clear picture of the accident for future reference.
Crash vehicle examination
Crash vehicles are examined on-scene and/or at the police station. This examination involves:
• Recording direct and indirect damages.
• Determination of Collision Deformation Classification (CDC) [7] for cars and SUVs or Truck
Deformation Classification (TDC) [8] for trucks.
• Measurement of interior intrusions.
• Occupant/pedestrian contact points within or outside the vehicle.
• Determination of safety system use (seatbelts, airbags, pretensioners, helmets).
Injury coding and correlation
Researchers later obtain medical records of the crash victims from the hospitals. The injuries are then
coded using the Abbreviated Injury Scale (AIS) developed by the Association for the Advancement of
Automotive Medicine (AAAM) [9]. These are then correlated to the possible injury sources recorded
during crash scene and vehicle examination (interior intrusions and contacts).
Creation of analytical database
The in-depth crash data collected by researchers was stored in an analytical database. The analytical
database does not contain any personal identification or proprietary information. This database is used
for scientific analysis of road traffic accidents.
RESULTS Using the above methodology, 76 crashes were examined in the 5 highways involving 119 vehicles,
14 pedestrians and 2 bicyclists. These crashes resulted in 34 fatalities and 60 persons being
hospitalized. Tables 4 and 5 give details of the crashes by highway structure, vehicles involved and the
highest injury severity sustained. The top three vehicle types involved in the crashes are: trucks (44),
passenger cars (27) and motorized two-wheelers (24).

Road Structure No. of
Crashes
Distribution of Crashes by Injury Severity
Fatal Hospitalized Minor No Injury
Undivided 2-Lane
without paved shoulder 19 12 6 1 0
Undivided 2-Lane with
paved shoulder 25 7 10 5 3
Divided 4-Lane with
paved shoulder 32 9 5 9 9
Total 76 28 21 15 12
Table 4. Crashes by Highway and Injury Severity.
Highest Injury
Severity
Vehicles Involved
Truck Car/Jeep M2W Mini bus/
Mini truck Bus M3W
Fatal / Hospitalized 4 7 22 3 3 1
Minor / No Injury 40 20 2 9 8 0
Total 44 27 24 12 11 1
Table 5. Vehicle Types Involved and the Highest Injury Severity.
M2Ws (22) are the highest vehicle type involved in crashes in which at least one rider was fatally
injured or hospitalized. Of the 14 pedestrians and 2 bicyclists, 7 pedestrians and both the cyclists
sustained fatal injuries. This indicates that M2W riders, pedestrians and bicyclists are the top three
vulnerable road users.
In the following sections, the crashes have been analyzed based on the number of motorized vehicles
involved in each crash. Of the 76 crashes, 43 were multiple-vehicle crashes (front-rear collisions,
head-on collisions and front-side collisions) and 33 were single-vehicle crashes (pedestrian/bicyclist
impacts, object impacts and rollovers).
ANALYSIS OF MULTIPLE-VEHICLE CRASHES
All multiple-vehicle crashes examined in this study involved only two motorized vehicles. Three types
of multiple-vehicle crashes were observed: front-rear collisions (involves rear-ending), head-on
collisions and front-side collisions (involves side impacts). Front-rear collisions (67%) were the most
predominant multiple-vehicle crash type observed, as shown in Figure 4.
����������
���
� ��!�
���
������"� �
���
Figure 4. Distribution of the 43 Multiple-Vehicle Crashes by Crash Types.

Each crash type, their characteristic causes and the influence of road structure are described below.
Front-rear collisions These crashes involved two vehicles travelling in the same direction, one being rear-ended by the
other. Of the 29 front-rear collisions examined, 65% occurred on divided 4-lane highways, whereas
35% occurred on undivided 2-lane highways.
Reasons for front-rear collisions
Researchers determined that in 51% of the crashes, the vehicle in the front was moving slower than the
vehicle behind, and in 28% of the crashes, the vehicle in front was stationary/parked. Crashes due to
overtaking carelessly constituted 21% of front-rear collisions. Researchers analyzed the pre-accident
conditions of vehicles in the front to determine reasons for slowing down or being stationary. Figure 5
shows the reasons identified.
�
�� �� �
��
�
��
�
��
��
���
#$�%������&
' (�����)��� �
*%%�����+
)��������,+ �
�� �����
���� $� ��-
.� ���% /�� 0��1� $) �������
,����(��"����2��
��%-
!2��� 0��+
"� ���������������"� ������������
3��%��� +�
Figure 5. Distribution of Front-Rear Collisions by Reason for Collision.
It was observed that vehicles usually moved slowly while approaching or moving away from junctions
or gaps in the median (34%), or while entering or exiting the highway to access gas stations,
restaurants, etc. (10%), or due to traffic congestion (7%). Road design at junctions/gaps in median,
entry and exits of highway amenities, and the availability of clear signage and advance warning to
drivers needs to be looked into.
Vehicles were found to be stationary due to breakdown/repairs (14%) or due to drivers stopping to
take a break or relieve themselves (14%). In all the cases, the vehicles were parked either partially or
fully on the road due to insufficient shoulder widths.
In 21% of the cases involving overtaking, either the exact conditions could not be ascertained or they
resulted in front-rear collisions due to careless driving and over speeding.
Vehicles involved in front-rear collisions
Figure 6 shows the distribution of vehicles involved in front-rear collisions. Of the 58 vehicles
involved, trucks (46%) constitute the highest vehicle type, followed by M2Ws (21%).

�� �� �
�
��
�
��
�
��
��
���
.�$%0 4�5 � �&#��( 4���6$��&
4�����$%0
/$�
7�8�%���.9(�
3��%��� +�
Figure 6. Vehicles Involved in Front-Rear Collisions.
Figure 7 shows the percentage distribution of injury severity suffered by the vehicles involved in
front-rear collisions. Smaller vehicles have a higher rate of hospitalized and fatal injuries compared to
heavier vehicles. As shown in Figure 7, 67% of hospitalized and fatal injuries in these collisions
involved M2Ws, while most of the trucks had minor or no injury severity.
���
��
��
�
��
�
��
��
���
4�5 � �&#��( 4���6$��&�4�����$%0 .�$%0
7�8�%���.9(�
3��%��� +�
Figure 7. Vehicle types with Fatal or Hospitalized Injury Severity as a Result of Front-Rear Collisions.
Head-on collisions
All of the 9 head-on collisions were observed on undivided highways mainly due to overtaking
vehicles entering into the oncoming vehicle lane.
Influence of road structure
Undivided 2-lane highways without paved shoulders had the highest number of head-on
collisions (78%) due to the absence of dividers/medians. The presence of paved shoulders seems
to reduce the occurrence of head-on collisions, as the extra space allows vehicles to move out of
the way of overtaking vehicles. Hence, undivided 2-lane highways with paved shoulders had relatively
lower (22%) head-on collisions. No head-on collisions were observed on divided 4-lane
highways due to the presence of a wide median, indicating the effectiveness of medians/divided roads
in preventing head-on collisions.
Front-side collisions
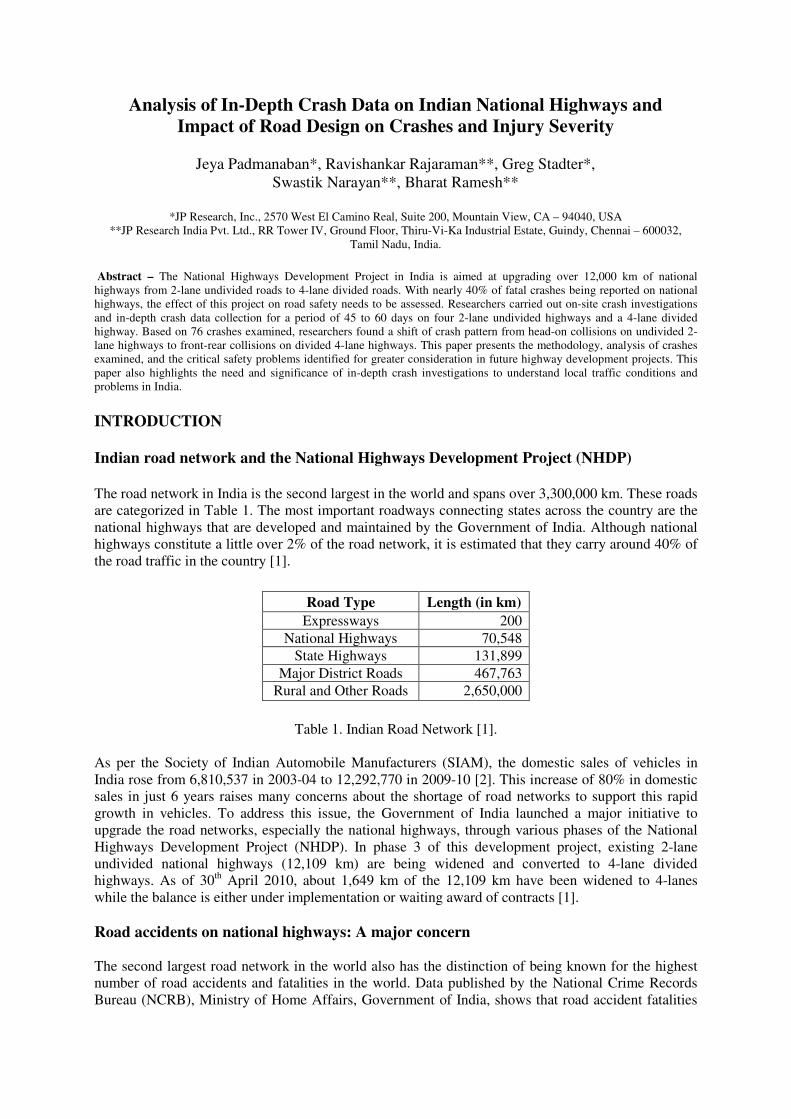
All the 5 front-side collisions took place at road intersections on undivided 2-lane highways. Three (3)
crashes occurred at non-signalized junctions and 2 crashes occurred at the same signalized junction.
Intersection problems
When the front-side collisions were analyzed for common problems, road alignment and design came
out to be the most predominant factor involved, as shown in Figure 8.
��
��
��
���
��
��
���
��
� �� � �� �� ���
:��2���6����9��6���$%���;
5 ������ �0;
:���� �� ��+�)����(��(��;
��+� ��<��;
:������%����;
:��� ���$%�$��&�=�2����)��� ��
� %����
3��%��� +���������������������������
���
��
Figure 8. Distribution of Infrastructure/Environmental Factors in Front-Side Collisions.
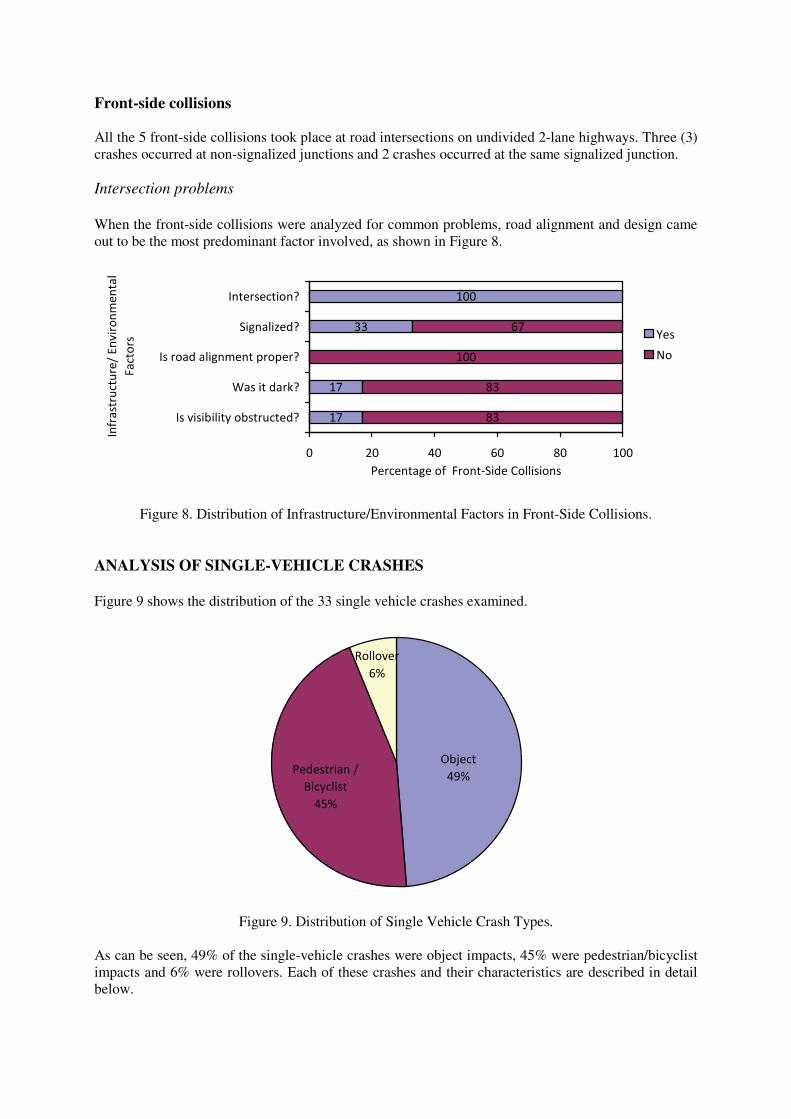
ANALYSIS OF SINGLE-VEHICLE CRASHES
Figure 9 shows the distribution of the 33 single vehicle crashes examined.
"����2��
��
3������� ��&�
/�%9%����
�
!6>�%�
��
Figure 9. Distribution of Single Vehicle Crash Types.
As can be seen, 49% of the single-vehicle crashes were object impacts, 45% were pedestrian/bicyclist
impacts and 6% were rollovers. Each of these crashes and their characteristics are described in detail
below.

Object Impacts
The presence of a road-side object was the main contributor to these crashes. Trees were the natural
objects involved in these crashes. However, 75% of object impacts involved man-made objects such as
concrete poles, concrete barriers and raised median. The severity of the crash depended on the
rigidness of the object to the vehicle striking it. As can be seen in Figure 10, 86% of object impacts
causing fatal/hospitalized injuries involved hitting a tree or concrete pole located alongside the road.
� �
���
�� ��
�
��
�
��
��
���
.��� ���%�����3���� ���%�����/ ����� 4��� �
!6>�%��.9(�
3��%��� +�
� � �& ��(�� ��<��
4����&���:�>$�9
Figure 10. Single Vehicle Crash Types and the Resulting Injury Severity.
Pedestrian/Bicyclist impact
These crashes involve motor vehicles impacting pedestrians and bicyclists. Thirteen (13) pedestrian
impacts and 2 bicyclist impacts were examined. The 15 crashes are equally divided among all the
three road structure types. These crashes usually occurred at junctions with bus stops (58%) or near
places of interest (38%) such as temples, shops, etc. Crossing was the pedestrian activity in 69% of the
crashes. The factors influencing these impacts are speeding vehicles, lack of speed control devices and
markings at pedestrian crossings, and lack of infrastructure to separate pedestrians and bicyclists from
motorized vehicles.
Vehicles involved
Figure 11 shows the vehicle types involved in pedestrian accidents. Apart from passenger cars
(39%), minibuses/minitrucks (23%) and trucks (15%), pedestrian impacts also involved
M2Ws (23%).
��
�� ���
�
��
�
��
��
���
� �&#��( 4�5 4���6$�&4�����$%0 .�$%0
7�8�%���.9(�
3��%��� +�
Figure 11. Distribution of Pedestrian Accidents by Vehicle Type Involved.

Rollovers
Rollovers were observed as the first event only on the 4-lane divided highway because of vehicles
going off road. None of the occupants suffered any injuries. Rollovers were also observed as a
subsequent event to an object impact (usually concrete poles).
DISCUSSIONS
Effect of road widening and 4-laning of highways (NHDP)
Figure 12 shows the percentage distribution of head-on collisions and front-rear collisions observed in
the three types of road structures examined.
��
���
��
�
�
��
�
��
��
���
?���2�������@ ���1��8�$�
( 2����8�$����
?���2�������@ ���1��8
( 2����8�$����
A�2������@ ���1��8
( 2����8�$����
"� �����$%�$��
3��%��� +�
� ��!�
������"� �
Figure 12. Distribution of Front-Rear and Head-On Collisions by Road Structure.
Undivided 2-lane highways without paved shoulders had 78% of head-on collisions, while the divided
4-lane highway had 65% of the front-rear collisions. It can be observed that there is a clear shift of
crash pattern from head-on collisions to front-rear collisions when the highway structure is changed
from undivided 2-lane to divided 4-lane.
Although the presence of paved shoulders seem to reduce head-on collisions in undivided 2-lane
highways, researchers observed that paved shoulders converted possible head-on collisions to object
impacts with road side objects. When vehicles, about to have a head-on collision, moved out of the
road way on to the shoulder, they would collide with concrete poles alongside the road. Hence, wide
medians are effective in reducing head-on collisions.
Critical infrastructure problems
Need for acceleration/deceleration lanes and wider shoulders to mitigate front-rear
collisions.
Locations such as gaps in median and road junctions were the reasons for vehicles slowing down and
causing 34% of the front-rear collisions. As can be seen in Figure 13, these areas need to be
redesigned for providing proper acceleration/deceleration and storage lanes, especially for heavy
vehicles, so that vehicles intending to take a turn, exiting or entering the highway can be separated
from faster moving traffic on the highway.
Insufficient shoulder width was the reason for vehicles stationary on the road and causing 28% of the
front-rear collisions. Heavy vehicles, particularly trucks, were observed to have been stopped/parked
on the road due to the shoulder width of 1.5 metres being less than the vehicle width.
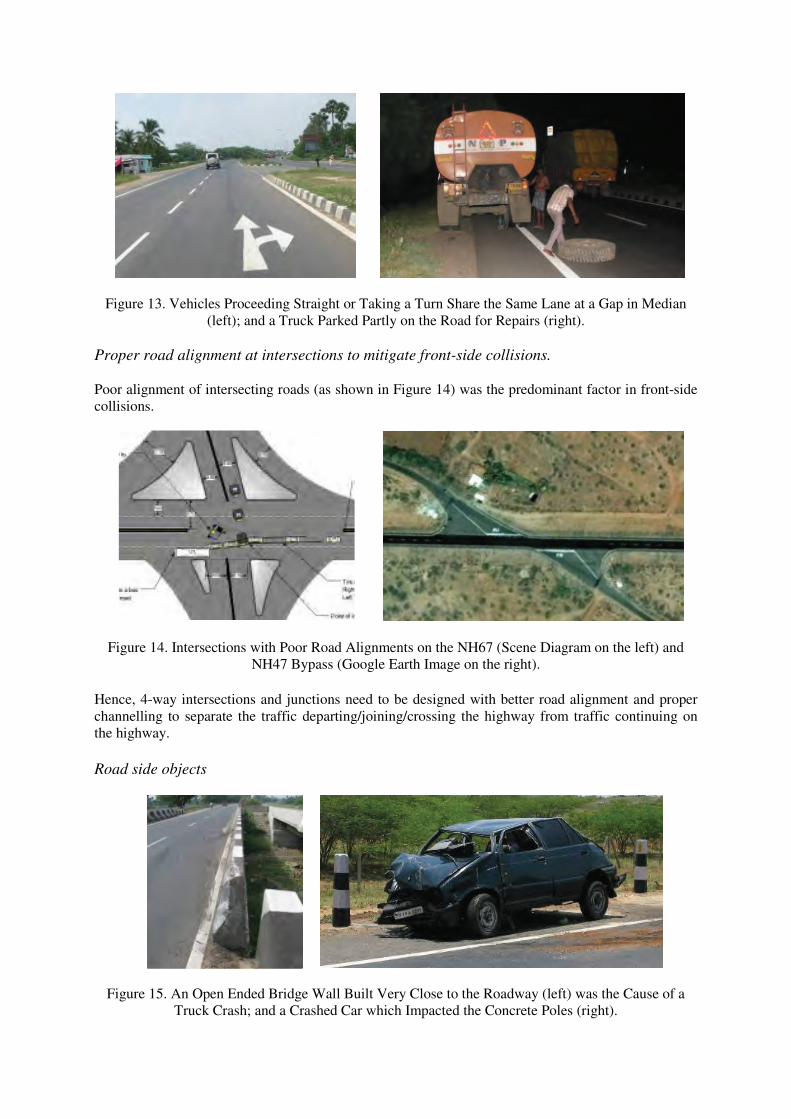
Figure 13. Vehicles Proceeding Straight or Taking a Turn Share the Same Lane at a Gap in Median
(left); and a Truck Parked Partly on the Road for Repairs (right).
Proper road alignment at intersections to mitigate front-side collisions.
Poor alignment of intersecting roads (as shown in Figure 14) was the predominant factor in front-side
collisions.
Figure 14. Intersections with Poor Road Alignments on the NH67 (Scene Diagram on the left) and
NH47 Bypass (Google Earth Image on the right).
Hence, 4-way intersections and junctions need to be designed with better road alignment and proper
channelling to separate the traffic departing/joining/crossing the highway from traffic continuing on
the highway.
Road side objects
Figure 15. An Open Ended Bridge Wall Built Very Close to the Roadway (left) was the Cause of a
Truck Crash; and a Crashed Car which Impacted the Concrete Poles (right).

Although trees along the road-side are significantly less in the new divided 4-lane highways, object
impacts with delineators (concrete poles) and bridge walls, as shown in Figure 15, remain a concern.
These objects need to be well away from the roadway and should also be crash protective in design.
Need for pedestrian/bicyclist infrastructure
Data suggests that pedestrian facilities have not improved with highway developments. Since 69% of
pedestrian impacts occurred when the pedestrians were crossing, attention needs to be given to
pedestrian crossings. Unlike congested urban areas, highways have pedestrian traffic in specific
locations only. Since 58% of pedestrian crashes occurred at junctions/intersections and bus stops,
these locations would be a good place to start.
Understanding road user profiles for effectively reducing injury severity
Traffic control measures to reduce injury severity on Indian roads are usually adopted from developed
countries focusing on passenger car safety. In India, M2Ws account for the highest number of vehicles
on road. Of the 119 motor vehicles examined in this study, 55% of fatal/hospitalized injuries were
associated with M2Ws and trucks had the highest rate of crash involvement (37%) even though they
constitute only 3% of all motor vehicles registered in Tamil Nadu [4]. Hence, researchers suggest that
highway design and engineering in India should focus on mitigating injuries to M2Ws and reducing
truck crash involvement.
CONCLUSIONS
In-depth crash investigation on five national highways in Tamil Nadu has been able to provide insights
into crash types by road structure and injury severity. Based on the above study, the following
conclusions are derived.
1. There are significant differences between crash characteristics, injury severity and vehicles
involved in crashes occurring in developed western countries and India. About 65% of multiple-
vehicle crashes in India are front-rear collisions, while only 23% of crashes are rear impacts in the
U.S.
2. Since 34% of front-rear collisions occurred at gaps in medians/junctions and 24% occurred due to
insufficient shoulder width, highway designs need to be looked into in these areas.
�
3. 49% of single-vehicle crashes examined involved fixed object impacts. 86% of these object
impacts resulting in fatal/hospitalized injuries involved collision with a tree or a concrete pole.
�
4. 45% of single vehicle crashes examined involved pedestrian/bicyclist impacts. 58% of pedestrian
crashes occurred at junctions/intersections and bus stops, while in 69% of pedestrian impacts, the
pedestrian was crossing the road.
�
5. About 55% of fatal/hospitalized injuries are associated with M2W riders, while trucks constitute
the highest vehicle type involved in crashes. Hence, these two road users need to be given more
consideration in highway safety design and engineering.
�
6. To reduce fatalities, highway development projects like NHDP need to take the following into
consideration:
a. Design of highways at gaps in median/junctions, entry/exit to gas stations and other
amenities alongside the highway and necessary shoulder width for parking of heavy vehicles.
b. Proper alignment of roadways at intersections.
c. Road side objects should be made crash protective by design.

d. Effective pedestrian infrastructure at bus stops, intersections and places of interest to
separate pedestrians from vehicular traffic and to reduce vehicle speeds.
e. Movement of M2Ws (due to higher injury severity) and heavy trucks (due to their higher
involvement) in the design and development of new divided 4-lane highways.
7. Finally, it is warranted to study highway crashes in greater detail through crash investigations and
in-depth accident data collection to develop traffic safety measures/safety standards for India.
REFERENCES
1 http://www.nhai.org/roadnetwork.htm, accessed on 3 June 2010.
2 Domestic Sales Trend, Society of Indian Automobile Manufacturers, http://www.siamindia.com/scripts/domestic-
sales-trend.aspx, accessed on 3 June 2010.
3 Accidental Deaths and Suicides in India - 2008, National Crime Records Bureau, Ministry of Home Affairs,
http://ncrb.nic.in/ADSI2008/home.htm
4 Government of Tamil Nadu, Department of Economics and Statistics, Statistical Handbook 2010
http://www.tn.gov.in/deptst/
5 ‘Accident Data Collection Methodology for Building a Traffic Accident Database for Tamil Nadu (India)’,
SAE2009-26-008, by Jeya Padmanaban, Ahamedali M. Hassan, Ravishankar Rajaraman, Mohammed Rehan.
6 ‘Analysis of Road Traffic Accidents on NH45 (Kanchipuram District), SAE2009-28-0056, by Ravishankar
Rajaraman, Ahmedali M. Hassan, Jeya Padmanaban.
7 Collision Deformation Classification, Society of Automotive Engineers, J224, 1980.
8 Truck Deformation Classification, Society of Automotive Engineers, J1301, 1994.
9 AIS. Arlington Heights. American Association for Automotive Medicine; ILL 1990. The Abbreviated Injury Scale.


![IGLAD - INTERNATIONAL HARMONIZED IN-DEPTH ACCIDENT …indexsmart.mirasmart.com/25esv/PDFfiles/25ESV-000248.pdf · crash phase in IGLAD [5]. The resulting pre-crash matrix contains](https://static.fdocuments.in/doc/165x107/5ec7dd660c03b81237121241/iglad-international-harmonized-in-depth-accident-crash-phase-in-iglad-5-the.jpg)