
Analysis of Hydrogen as a Transportation Fuel FY17 Report · Analysis of Hydrogen as a...
34
PNNL-26920 Analysis of Hydrogen as a Transportation Fuel FY17 Report September 2017 RM Pratt E Wilcox Freeburg F Luzi
Transcript of Analysis of Hydrogen as a Transportation Fuel FY17 Report · Analysis of Hydrogen as a...
PNNL-26920
Analysis of Hydrogen as a Transportation Fuel FY17 Report September 2017
RM Pratt E Wilcox Freeburg F Luzi

DISCLAIMER
This report was prepared as an account of work sponsored by an agency of the United States Government. Neither the United States Government nor any agency thereof, nor Battelle Memorial Institute, nor any of their employees, makes any warranty, express or implied, or assumes any legal liability or responsibility for the accuracy, completeness, or usefulness of any information, apparatus, product, or process disclosed, or represents that its use would not infringe privately owned rights. Reference herein to any specific commercial product, process, or service by trade name, trademark, manufacturer, or otherwise does not necessarily constitute or imply its endorsement, recommendation, or favoring by the United States Government or any agency thereof, or Battelle Memorial Institute. The views and opinions of authors expressed herein do not necessarily state or reflect those of the United States Government or any agency thereof.
PACIFIC NORTHWEST NATIONAL LABORATORY operated by BATTELLE
for the UNITED STATES DEPARTMENT OF ENERGY
under Contract DE-AC05-76RL01830
Printed in the United States of America
Available to DOE and DOE contractors from the Office of Scientific and Technical Information, P.O. Box 62, Oak Ridge, TN 37831-0062; ph: (865) 576-8401 fax: (865) 576-5728 email: [email protected]
Available to the public from the National Technical Information Service, U.S. Department of Commerce, 5285 Port Royal Rd., Springfield, VA 22161
ph: (800) 553-6847 fax: (703) 605-6900 email: [email protected] online ordering: http://www.ntis.gov/ordering.htm
PNNL-26920
Analysis of Hydrogen as a Transportation Fuel FY17 Report RM Pratt E Wilcox Freeburg F Luzi September 2017 Prepared for the U.S. Department of Energy under Contract DE-AC05-76RL01830 Pacific Northwest National Laboratory Richland, Washington 99352

iii
Executive Summary
This report summarizes the results of literature reviews, surveys and analyses performed to evaluate the potential of hydrogen-fueled vehicles to be an economically viable transportation alternative for shared, autonomous and alternative-fuel vehicles. Five existing and important alternative fuel drivers of expanding hydrogen-fueled transportation adoption are three automotive vendors unveiling Class 8 trucks, CALSTART viability analysis of hybrid-hydrogen drayage trucks in the shipyard cargo application, an analysis showing economic advantages of Fuel Cell Electric Vehicles (FCEV)s over Battery Electric Vehicles (BEV)s beginning at 150-mile ranges, the announcement of a commercial 5kg electrolyzer, and commercial plans or vehicle availability by nine vehicle manufacturers of FCEV passenger vehicles. But hydrogen infrastructure availability needed to support broad adoption of hydrogen-fueled vehicles is limited to less than 50 publicly-available refueling stations, primarily in California.
The demand side (consumer) economics associated with FCEV adoption showed strong economic sensitivity to a comparable vehicle’s fuel economy (mpg), distance traveled, and hydrogen (H2) generation costs. Seven use cases were used to evaluate the broad range of potential FCEV purchasers, including shared and autonomous vehicle applications. Each consumer use case analysis resulted in a different hydrogen fuel cost that can be used to compare to the current fuel cost being paid by the consumer.
The H2 generation costs (supply side) were sensitive to the volume of H2 supplied and H2 production costs needed to repay H2 supply facility capital costs. The Hydrogen Financial Analysis Scenario Tool (H2FAST) was used to more accurately incorporate capital, maintenance and production costs into a viable H2 supply cost to the consumer.
When the H2 generation and consumer economics were combined, several applications with positive economics became clear. The potential for higher miles traveled in autonomous and shared applications benefits the economics for hydrogen fueled vehicles. As an alternative fuel option, the availability of low-cost hydrogen pipeline connections, and therefore low-cost hydrogen, benefits the California drayage truck application with hybrid-hydrogen retrofits being repaid within seven years. Class 8 trucks could also take advantage of these low-cost, regional hydrogen supplies. In addition, the IVYS Energy Solutions electrolyzer-based hydrogen generation product showed the potential to deliver hydrogen economically in an urban or freeway off-ramp setting to a limited number of passenger vehicles in areas with low-cost electricity. These positive, manually developed results could be enhanced by more advanced tools to provide an expanded evaluation of the economics of hydrogen-based fuel applications.
The use cases evaluated showed significant potential for hydrogen-fueled vehicles to have a sustainable impact as a transportation fuel and to support the expansion of hydrogen-fueled autonomous and shared transportation options. The positive impact is not limited to transportation fuels, but also grid resilience and flexibility through the use of a controllable and variable electrolyzer output to rapidly adjust to changing grid conditions and enable greater integration of solar and wind generated power to produce hydrogen.
The use case analyses showed hydrogen’s economic potential as a transportation fuel. But when electrolyzers are used for hydrogen generation, additional economic value can be derived from grid services to further enable alternative fuel vehicles to reduce customer’s transportation energy costs, diversify transportation energy sources, and positively contribute to the economy at the regional and national levels.

v
Acknowledgments
This report and the work described were sponsored by the U.S. Department of Energy (DOE) Vehicle Technologies Office (VTO) under the Energy Efficient Mobility Systems (EEMS) Program Systems and Modeling for Accelerated Research in Transportation (SMART) Mobility Laboratory Consortium. The authors acknowledge Mr. John Smart of Idaho National Laboratory for leading the Advanced Fueling Infrastructure Pillar of the SMART Mobility Laboratory Consortium. The following U.S. Department of Energy Office of Energy Efficiency and Renewable Energy (EERE) officials and managers played important roles in establishing the project concept, advancing implementation, and providing ongoing guidance: Mr. David Anderson.

vii
Acronyms and Abbreviations
AFDC Alternative Fuel Data Center ANL Argonne National Laboratory BEV Battery Electric Vehicle CAFCP California Fuel Cell Partnership DOE Department of Energy EV Electric Vehicle EVSE Electric Vehicle Support Equipment (EV charging stations) FCV Fuel Cell Vehicle FCEV Fuel Cell Electric Vehicle GHG Green House Gas H2 Hydrogen H2FAST H2 Financial Analysis Scenario Tool, Web-based online calculator
(NREL) H2USA Reference Station Design with Detailed Station Designs and Cost
Estimates INL Idaho National Laboratory OEM Original Equipment Manufacturer PNNL Pacific Northwest National Laboratory PEM Polymer Electrolyte Membrane PEV Plug-in Electric Vehicle PHEV Plug-in Hybrid Electric Vehicle ROI Return On Investment SMART Systems and Modeling for Accelerated Research in Transportation TOU Time-Of-Use V2G Vehicle to Grid

ix
Contents
Executive Summary .......................................................................................................................... iii Acknowledgments ............................................................................................................................... v Acronyms and Abbreviations ...........................................................................................................vii 1.0 Introduction ................................................................................................................................ 1
1.1 Advanced Fueling Infrastructure Pillar .............................................................................. 1 1.2 Key Pillar Research Questions ........................................................................................... 2 1.3 Key Pillar Outcomes .......................................................................................................... 3 1.4 Pillar Research Process ...................................................................................................... 3
2.0 Existing Hydrogen Market and Resource Survey ...................................................................... 4 2.1 Background information .................................................................................................... 4 2.2 Market Highlights .............................................................................................................. 4
2.2.1 Class 8 Trucks ......................................................................................................... 4 2.2.2 Hydrogen Electrolyzer ............................................................................................ 5 2.2.3 FCEVs on the Road ................................................................................................. 5 2.2.4 Plug In Hybrid Electric Vehicles (PHEVs) on the Road ......................................... 5 2.2.5 International Events ................................................................................................. 5
2.3 Gap / Opportunity Analysis ................................................................................................ 6 2.3.1 Gaps ......................................................................................................................... 6 2.3.2 Opportunities ........................................................................................................... 6 2.3.3 Proposed analysis .................................................................................................... 7
3.0 Use Case Analysis ...................................................................................................................... 9 3.1 Use Cases Selected ............................................................................................................. 9 3.2 Customer-Focused Economic Use Case Analysis .............................................................. 9 3.3 Tube Trailer, Pipeline and Electrolyzer Supply Analysis ................................................ 10 3.4 Integrated Economic Analysis ......................................................................................... 11 3.5 Existing Commercial Hydrogen Applications ................................................................. 11 3.6 Electrolyzer Solution ........................................................................................................ 12 3.7 PEV / FCEV Market Adoption Estimates ........................................................................ 13
3.7.1 PEV Market Adoption Estimates .......................................................................... 13 3.7.2 FCEV Market Adoption Estimates........................................................................ 14
3.8 Integrated Electrolysis Systems into Built Infrastructure ................................................. 15 4.0 Additional Research Areas / Gaps ............................................................................................ 16
4.1 Tools development ........................................................................................................... 16 4.2 Systems Analysis.............................................................................................................. 16
5.0 Conclusions .............................................................................................................................. 17 6.0 References ................................................................................................................................ 18
x
Figures
Figure 1: Gasoline and Diesel Fuel Historical Prices ......................................................................... 8 Figure 2 - Vision Fuel Cell Hybrid Truck - www.calstart.org .......................................................... 12 Figure 3 - SimpleFuel Electrolyzer ................................................................................................... 12 Figure 4 - Current and Projected Combined BEV and PHEV Sales ................................................. 13 Figure 5 - Aggregated FCEV Sales................................................................................................... 14
Tables
Table 1 - Customer-Side Use Case Analysis ...................................................................................... 9 Table 2 - Integrated Economic Analysis ........................................................................................... 11 Table 3 - PHEV / BEV Sales Projections ......................................................................................... 13 Table 4 - FCEV Projected Hydrogen Consumption ......................................................................... 14
1
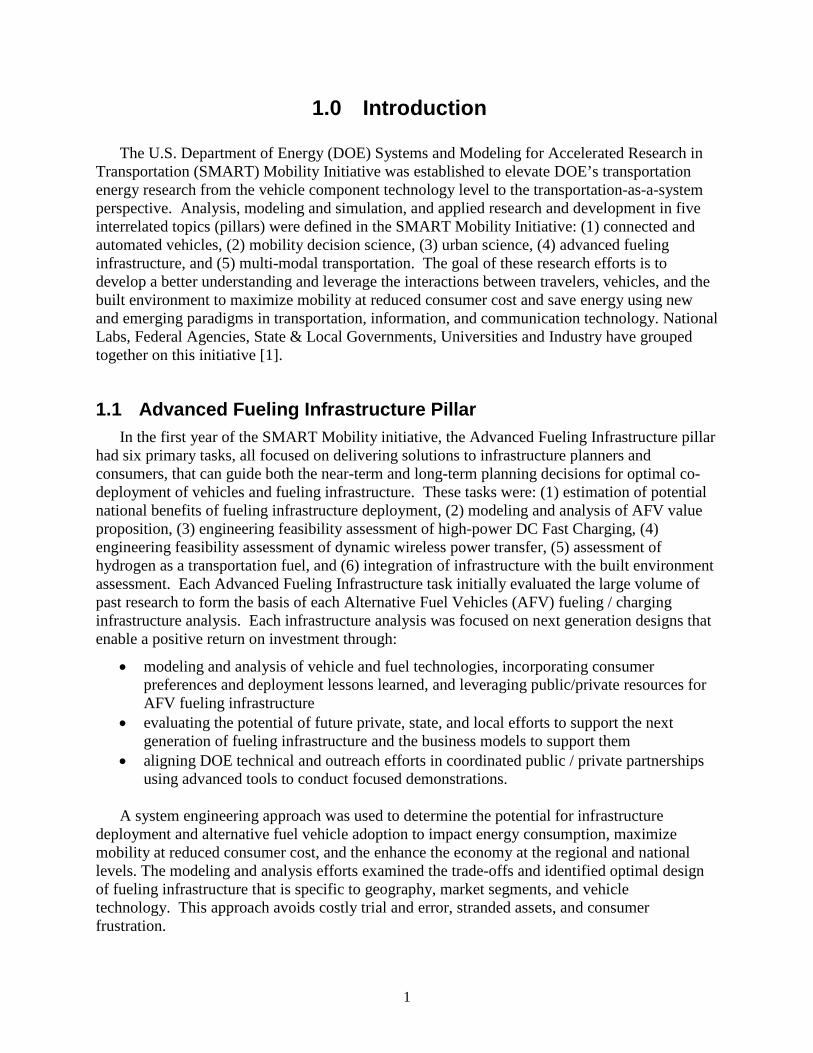
1.0 Introduction
The U.S. Department of Energy (DOE) Systems and Modeling for Accelerated Research in Transportation (SMART) Mobility Initiative was established to elevate DOE’s transportation energy research from the vehicle component technology level to the transportation-as-a-system perspective. Analysis, modeling and simulation, and applied research and development in five interrelated topics (pillars) were defined in the SMART Mobility Initiative: (1) connected and automated vehicles, (2) mobility decision science, (3) urban science, (4) advanced fueling infrastructure, and (5) multi-modal transportation. The goal of these research efforts is to develop a better understanding and leverage the interactions between travelers, vehicles, and the built environment to maximize mobility at reduced consumer cost and save energy using new and emerging paradigms in transportation, information, and communication technology. National Labs, Federal Agencies, State & Local Governments, Universities and Industry have grouped together on this initiative [1].
1.1 Advanced Fueling Infrastructure Pillar In the first year of the SMART Mobility initiative, the Advanced Fueling Infrastructure pillar
had six primary tasks, all focused on delivering solutions to infrastructure planners and consumers, that can guide both the near-term and long-term planning decisions for optimal co-deployment of vehicles and fueling infrastructure. These tasks were: (1) estimation of potential national benefits of fueling infrastructure deployment, (2) modeling and analysis of AFV value proposition, (3) engineering feasibility assessment of high-power DC Fast Charging, (4) engineering feasibility assessment of dynamic wireless power transfer, (5) assessment of hydrogen as a transportation fuel, and (6) integration of infrastructure with the built environment assessment. Each Advanced Fueling Infrastructure task initially evaluated the large volume of past research to form the basis of each Alternative Fuel Vehicles (AFV) fueling / charging infrastructure analysis. Each infrastructure analysis was focused on next generation designs that enable a positive return on investment through:
• modeling and analysis of vehicle and fuel technologies, incorporating consumer preferences and deployment lessons learned, and leveraging public/private resources for AFV fueling infrastructure
• evaluating the potential of future private, state, and local efforts to support the next generation of fueling infrastructure and the business models to support them
• aligning DOE technical and outreach efforts in coordinated public / private partnerships using advanced tools to conduct focused demonstrations.
A system engineering approach was used to determine the potential for infrastructure deployment and alternative fuel vehicle adoption to impact energy consumption, maximize mobility at reduced consumer cost, and the enhance the economy at the regional and national levels. The modeling and analysis efforts examined the trade-offs and identified optimal design of fueling infrastructure that is specific to geography, market segments, and vehicle technology. This approach avoids costly trial and error, stranded assets, and consumer frustration.
2
This analysis process can be applied to infrastructure design, emerging business models and mobility trends, such as connected/autonomous vehicles (CAVs) and mobility as a service (MaaS) to show the positive economic potential for alternative fuel vehicles coupled with other technologies. These studies include evaluating the potential for innovative business models and positive return on investment, as well as costs and opportunities of grid integration from the fueling infrastructure service provider’s perspective. The results of these analyses provide the basis for developing consumer-facing tools; utilizing modern information technology to communicate with consumers to identify additional infrastructure needed, both prior to and during their ownership experience; and decoupling the perception of infrastructure availability from vehicle adoption and vehicle miles traveled (VMT) in future projects.
A primary role of the Alternative Fuel Infrastructure analysis is to keep the following questions at the forefront of the effort:
• Are there enough energy benefits to continue research/modeling? • Are the right research questions/priorities being pursued? • Are partners leveraged successfully? • Is the relevance to DOE mission clear?
1.2 Key Pillar Research Questions
1. What is the potential for regionally optimizing alternative fuel infrastructure relative to energy infrastructure and resource mix? For example, what is the effectiveness of implementing advanced transportation corridors for movement of people and freight?
2. Can intelligent integration of vehicles and fueling/charging infrastructure with facilities and the electric grid provide benefits beyond transportation? a. For example, electrical load shifting and V2G (bi-directional PEV charging) and local
hydrogen production b. Integrate vehicle-fuel models to explore value propositions (consumer and
commercial supplier), business models and opportunities for increased sustainable transportation deployment.
3. How can infrastructure build-out shape future technology adoption and travel behavior? a. Will dynamic wireless charging become an enabler for autonomous vehicle ride-
sharing or MD/HD EVs? b. What is the degree to which the presence or lack of infrastructure affects travel mode
choices, especially for multi-unit dwellers (~40% of Americans)? c. Harmonize & synchronize the next generation of fueling infrastructure deployment by
integrating efforts of a broad range of stakeholders d. Implement a fuel-agnostic national approach
4. How can new tools, technologies, and evolving travel behavior enable positive return on investment (ROI)? a. Mobility-as-a-service and advanced demand forecasting enabling onsite hydrogen
production b. Apps that allow drivers to understand their fueling needs and maximize use of
minimal charging/fueling stations
3
1.3 Key Pillar Outcomes
1. Integrate modeling of vehicle and fuel technologies from consumer preferences and lessons learned from prior deployments;
2. Demonstrations leveraging public and private resources for AFV infrastructure; 3. Analyze infrastructure decision timelines; determine the decision points that take us one
direction or the other; and how to estimate when a given technology or option would become outdated;
4. Distill and report-out possible key research themes; 5. Motivate future work emphasizing expected benefits and alignment with relevant lab
capabilities; 6. Identify key stakeholders; and 7. Identify opportunities for focused technology demonstrations.
1.4 Pillar Research Process
The transportation-as-a-system studies and modeling effort began with a survey of existing resources, performing a complete gap analysis, proposing synthesis and expansion of state-of-the-art analysis, identifying sub-topical deep dives to inform technology integration efforts, delivering new cutting-edge transportation system models, and applying priority scenario illustrative examples to inform discrete conclusions. For example, the California Fuel Cell Partnership (CAFCP) has developed processes and strategies to reduce the time and cost to build the hydrogen stations through sharing lessons learned from each deployment, public outreach and education, identifying challenges and presenting solutions, and focusing on prioritized vehicle classes.
1. The AFV infrastructure analysis project uses a data-driven, multi-scale approach that incorporates data from testing, consumer outreach, and deployment efforts into modeling and analysis. The project leverages the vast array of modeling tools and data libraries currently available at the national laboratories, and also new data collected in partnership with other SMART Mobility Pillars and external partners. Focused, proof-of-concept hardware development and testing is conducted to understand the behavior of future technology to ensure the accuracy of modeling assumptions.
2. Each project’s task includes a review of past and current work to consolidate and build on knowledge gained from past investments. The project strives to determine solutions that balance the competing objectives of freedom and convenience for the consumer versus cost to and profitability of the commercial infrastructure supplier. Several tasks are conducted in coordination with other DOE SMART Mobility Pillars to magnify the impact of research funding.

4
2.0 Existing Hydrogen Market and Resource Survey
The assessment of hydrogen as a transportation fuel, included literature reviews; attending Hydrogen generation presentations made at the Annual Merit Review in Washington, D.C.; and identifying national laboratory leaders in the field. Economic analyses were then performed using National Laboratory-developed tools to evaluate the potential of hydrogen-fueled vehicles to be an economically viable transportation alternative. Positive economic value propositions both from the individual consumer and commercial supplier perspectives are needed to drive and sustain alternative fueled vehicle adoption and serve as stepping stones to develop business models and identify opportunities for increased sustainable transportation deployment to positively impact the overall “system”.
2.1 Background information Alternative fuel vehicles have the potential to reduce consumer’s fuel costs, diversify
transportation fuel sources, and reduce dependence on foreign oil. Fueling infrastructure availability has been identified as a major barrier to hydrogen-fueled vehicles becoming more broadly adopted as an alternative fuel vehicle. In preparation to starting a quantification of the hydrogen fuel economics, a literature review and survey were performed to identify hydrogen as a transportation fuel opportunities and gaps. Several important facts were identified during the literature review:
• ~40% of the trucked freight value travels less than 100 miles and weighs ~13 billion tons annually [2].
• The cargo capacity of large semi-trucks is ~26 tons at ~59 ton-miles/gallon [3]. • Alternative Fuels Data Center (AFDC) – Fuel Properties Comparison: 1 gallon of diesel
= 1.13 gallons of gasoline and 1 gallon of gasoline = 1 kg (2.198 lbs) of H2 [4]. • The total cost of ownership between FCEVs and BEVs in year 2040 favors FCEVs when
driving range is in excess of 150 miles [5].
2.2 Market Highlights
2.2.1 Class 8 Trucks Toyota unveiled in October 2017 a new hydrogen fuel cell vehicle transport truck. The
Toyota truck will initially serve seaport to distribution warehouse operations. Kenworth has also launched a Class 8 hydrogen fuel cell project. In December 2016, Nikola Motor Company unveiled the Nikola One, a hydrogen fuel-cell electric freight truck. The truck range was designed to be more than 800 miles, about twice that of an average diesel truck. The Nikola One is a hybrid using a 300-kilowatt fuel cell and a 320-kilowatt-hour battery bank. The battery helps propel the vehicle during high torque and hill climbs. The company also projects it will operate at half the cost of a comparable diesel truck. Vehicle delivery is planned to begin in 2020 [6].
The U.S. Department of Energy counts only 39 retail hydrogen fueling locations in 2017, with most in California and focused on passenger vehicles [7]. Nikola plans to solve the limited hydrogen fueling infrastructure problem in the United States through vertical integration, producing and distributing its own hydrogen. The company plans to install refueling stations in California, Texas, and New York beginning in 2018. By contrast, there are some 1,000 natural
5
gas stations located in corridors around the country, according to AFDC [8]. Tesla alone has nearly 1000 Supercharger stations set up nationwide to power its electric Model S and X cars [9].
2.2.2 Hydrogen Electrolyzer
2.2.2.1 IVYS Inc
IVYS and partners developed SimpleFuel, an on-site hydrogen generation and dispensing appliance, which uses water and electricity to produce high purity fuel cell-grade hydrogen. SimpleFuel can dispense fast "opportunity" fills or full fills to 700 bar automotive pressures. SimpleFuel won the $1 million H2 Refuel H-Prize competition in 2017 [10]. The prototype model is 82” (H) x 80” (L) x 42” (W), requires standard utility connections for electricity and water, and delivers 1kg H2 in 5 minutes at 700 bar.
2.2.2.2 Idaho National Laboratory (INL) Electrolyzer The INL research team has evaluated the potential for electrolyzers using simulation and
hardware-in-the-loop models for an electrolyzer-based fueling station business case analysis. This analysis determined that electrolyzers have the potential to participate in grid services (e.g., utility-controlled demand response events), electricity markets and ancillary services. These capabilities lead to additional grid-service based revenue streams which could reduce the total hydrogen production cost [11].
2.2.3 Fuel Cell Electric Vehicles (FCEVs) on the Road The Toyota Mirai, Hyundai Tucson, and Honda Clarity FCEV’s are currently on the road.
Concept and prototype FCEVs are being developed by GM, Ford, Chrysler, Daimler, Nissan, Kia, BMW, Audi, and VW [12]. Other FCEVs include Plug Power and the US Hybrid-AC Transit Fuel Cell Electric Bus. There have been a total of about 1200 domestic Fuel Cell Vehicles (FCVs) sold in the U.S., with each having a 300-400 mile range. The average FCV adoption rate (sales) is currently about 180 fuel cell vehicles per month [13].
2.2.4 Plug In Hybrid Electric Vehicles (PHEVs) on the Road PHEV's on the road - there have been a total of over 650K PHEVs and BEVs sold in the U.S.
to date. The current PHEV / BEV adoption rate (sales) is currently about 9,000 electric vehicles per month, with about one-half sold in California [13].
2.2.5 International Events Britain and France have announced bans on the sale of new petroleum and diesel-fueled
vehicles by 2040 to reduce air pollution. Scotland has announced a ban on the sale of new petroleum and diesel-fueled vehicles by 2032. The German government voted to ban new gasoline or diesel-powered vehicles from European Union roads by 2030. Netherlands is considering banning the sale of new petroleum and diesel-fueled vehicles by 2025. China has announced a ban on production and sale of petroleum and diesel cars in the near future.
6
UK vehicle manufacturers have announced limiting production of petroleum-fueled vehicles, which is in-line with what automotive companies have already been preparing for. But it warned that big changes must be made to electric vehicle pricing and practicality to make them a viable option for the nation's driver. Industry is working with government to ensure that the right consumer incentives, policies, and infrastructure are in place to drive growth in the very early market for the UK ULEVs (Ultra Low Emission Vehicles). In addition, Volvo has announced its cars will be all-electric by 2019 and Mercedes will offer electric versions of all of its models by 2022.
2.3 Gap / Opportunity Analysis
2.3.1 Gaps
(1) Refueling stations are expensive, up to $3 million each, and thousands of stations are needed to make FCEVs nationally feasible [12]
(2) There are 39 hydrogen stations in the U.S., and most are in California [7] (3) Shorter range battery electric vehicles are a more economical choice for reducing carbon
dioxide emissions and reducing transportation costs, primarily due to BEV lower cost and significantly higher energy efficiency
(4) The advantages of hydrogen’s faster fueling rates and longer range values are currently limited to commercial passenger vehicles (e.g., taxis) in urban environments due to limited hydrogen station availability
(5) H2 conversion efficiency is low relative to battery vehicles – only 25% reaches wheels, but only 20% of internal combustion engine energy turns the wheels.
(6) An advanced revenue/cost model framework for infrastructure deployment planning is needed that takes into account both H2 station installation costs and transportation needs.
(7) Targeted demonstrations leveraging public and private resources for AFV fueling infrastructure are needed to inform infrastructure investments that can help overcome consumer adoption barriers
(8) Very little intercity refueling station infrastructure currently exists
2.3.2 Opportunities The following opportunities were identified while reviewing hydrogen as a transportation
fuel options: (1) Hydrogen fuel cell vehicles have longer range and refuel faster than BEVs (2) Hydrogen-hybrid (e.g., Hyundai Tucson, Class 5 and Class 8 trucks are powered both as
FCEV and BEV) is the most common design which reduces battery energy requirements, Fuel Cell power requirements, enables battery weight reduction, and improves overall system efficiency (due to more efficient battery systems supplying short range travel).
(3) Collocating DCFC or extreme Fast Chargers with dynamically-controlled hydrogen electrolyzers could be an effective way of supplying fuel to alternative fuel vehicles and minimizing demand charges and total site peak power.
7
(4) Collocating battery storage and renewable generators (solar and wind) with DCFC and H2 electrolyzers could enable the electrical service to supply DCFC BEVs at a lower peak power and provide adequate power for electrolyzers.
(5) The electrolysis-based hydrogen generation demand can be supplied through a combination of solar, wind, and existing electrical infrastructure; local hydrogen storage can balance variable demand; and demand growth can be satisfied using multiple 5kW IVYS electrolyzers.
(6) The potential for the resiliency of power delivery systems (e.g., grid, inverters from battery backups or fuel cells, etc.) can add significant justification for hydrogen station installation.
2.3.3 Proposed analysis The analysis used a systems engineering approach with five steps to evaluate the potential
economic benefits: 1) Develop FCEV use cases for different usage profiles and vehicle types; 2) Perform FCEV customer-focused economic analysis for each use case; 3) Perform hydrogen supply economic analysis using H2FAST [33] for electrolyzer, pipeline
and tube trailer; 4) Integrate economic analyses from the customer and commercial supplier to develop the
sensitivity of each hydrogen production source and customer use case; and 5) Identify research areas to enhance economic analysis.
8
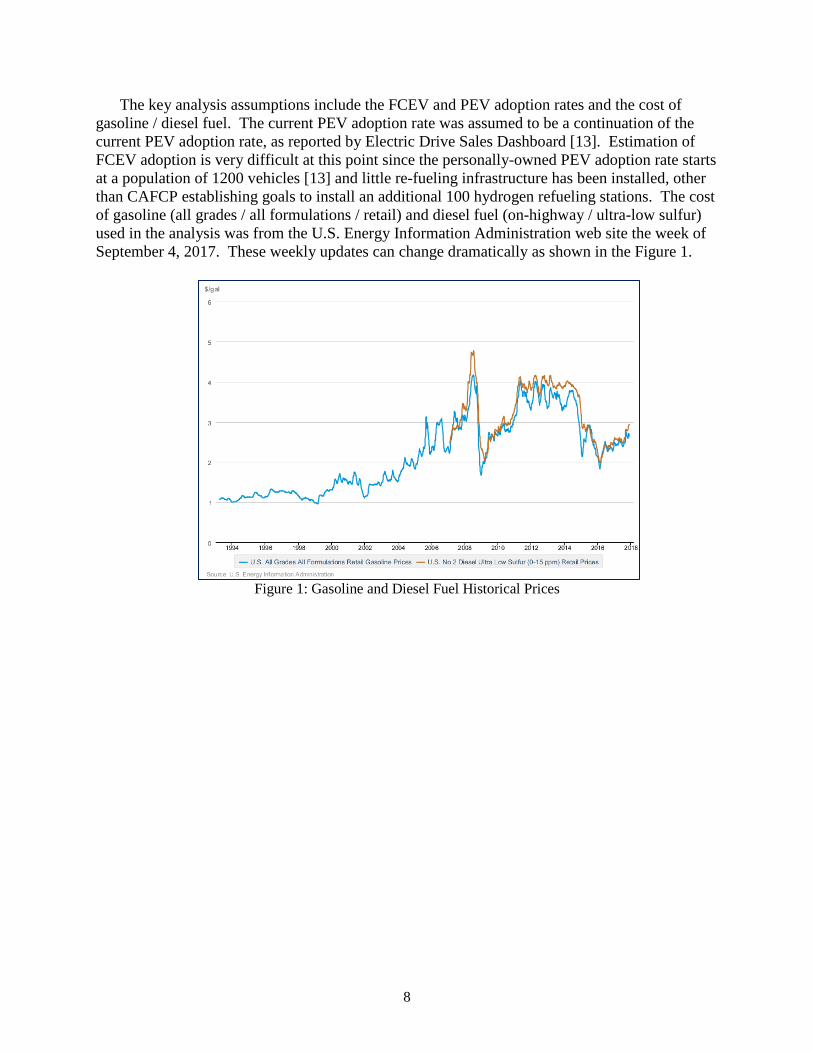
The key analysis assumptions include the FCEV and PEV adoption rates and the cost of gasoline / diesel fuel. The current PEV adoption rate was assumed to be a continuation of the current PEV adoption rate, as reported by Electric Drive Sales Dashboard [13]. Estimation of FCEV adoption is very difficult at this point since the personally-owned PEV adoption rate starts at a population of 1200 vehicles [13] and little re-fueling infrastructure has been installed, other than CAFCP establishing goals to install an additional 100 hydrogen refueling stations. The cost of gasoline (all grades / all formulations / retail) and diesel fuel (on-highway / ultra-low sulfur) used in the analysis was from the U.S. Energy Information Administration web site the week of September 4, 2017. These weekly updates can change dramatically as shown in the Figure 1.
Figure 1: Gasoline and Diesel Fuel Historical Prices
9
3.0 Use Case Analysis
3.1 Use Cases Selected The analysis of using hydrogen as a fuel spans a wide range of applications. These
applications can be grouped into use cases based on vehicle type (passenger vehicle, Class 5 truck, Class 8 truck, etc.), usage profile, fuel consumption rates, and miles traveled per day. The use cases selected were:
(1) Personally-owned autonomous vehicles and urban privately-owned vehicle available for personal transportation requirements
(2) Company-owned fleet vehicles (3) Shared autonomous vehicles and centrally-controlled and corporately-owned vehicle
hailed to meet public transportation requirements (e.g., taxi, Car2Go, Uber, Lyft, etc.) (4) Long distance family transportation using privately-owned vehicle (5) Corporately-owned Class 5 delivery vehicle (UPS, FedEx, etc.) (6) Short-haul Class 8 truck (e.g., sub-200 mile, freight shipping from wharf to distribution
center) (7) Long-haul Class 8 trucks.
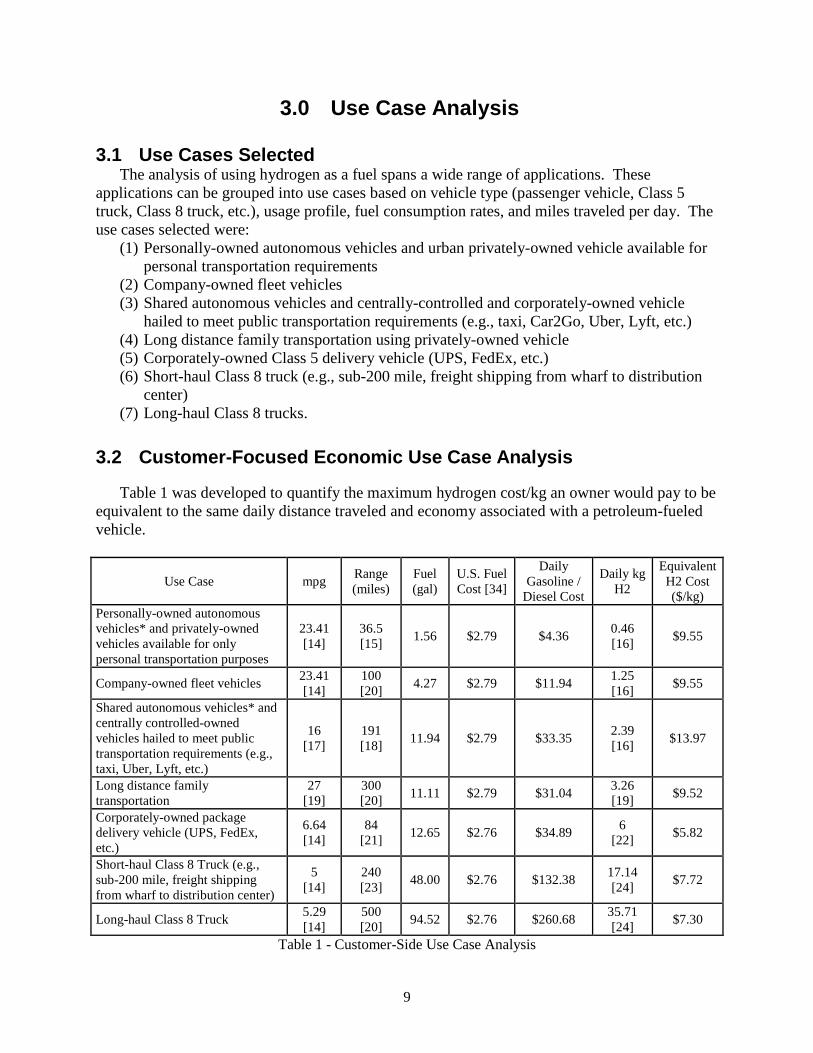
3.2 Customer-Focused Economic Use Case Analysis
Table 1 was developed to quantify the maximum hydrogen cost/kg an owner would pay to be equivalent to the same daily distance traveled and economy associated with a petroleum-fueled vehicle.
Use Case mpg Range (miles)
Fuel (gal)
U.S. Fuel Cost [34]
Daily Gasoline /
Diesel Cost
Daily kg H2
Equivalent H2 Cost ($/kg)
Personally-owned autonomous vehicles* and privately-owned vehicles available for only personal transportation purposes
23.41 [14]
36.5 [15] 1.56 $2.79 $4.36 0.46
[16] $9.55
Company-owned fleet vehicles 23.41 [14]
100 [20] 4.27 $2.79 $11.94 1.25
[16] $9.55
Shared autonomous vehicles* and centrally controlled-owned vehicles hailed to meet public transportation requirements (e.g., taxi, Uber, Lyft, etc.)
16 [17]
191 [18] 11.94 $2.79 $33.35 2.39
[16] $13.97
Long distance family transportation
27 [19]
300 [20] 11.11 $2.79 $31.04 3.26
[19] $9.52
Corporately-owned package delivery vehicle (UPS, FedEx, etc.)
6.64 [14]
84 [21] 12.65 $2.76 $34.89 6
[22] $5.82
Short-haul Class 8 Truck (e.g., sub-200 mile, freight shipping from wharf to distribution center)
5 [14]
240 [23] 48.00 $2.76 $132.38 17.14
[24] $7.72
Long-haul Class 8 Truck 5.29 [14]
500 [20] 94.52 $2.76 $260.68 35.71
[24] $7.30
Table 1 - Customer-Side Use Case Analysis
10
*Autonomous vehicle impact on vehicle miles traveled per day is being evaluated by Alternative Fuel Vehicle and Infrastructure Task 1 and CAVs pillar.
Table 1 values were obtained from a literature review using the reference indicated by [] in each cell or column. The calculated values are described below:
• The daily fuel usage was obtained by dividing range by the mpg value. • The U.S. Fuel cost from https://www.eia.gov/dnav/pet/pet_pri_gnd_dcus_nus_w.htm
on September 4, 2017 • The daily fuel cost is calculated using the type of fuel used and fuel cost. • Daily kg was determined using the referenced value [miles/kg] and distance traveled
(range). • Equivalent H2 cost was determined by dividing the petroleum fuel cost by daily kg
There are several key characteristics apparent from the Table 1 data including:
(1) A 10% increase in gas / diesel fuel cost will cause a 10% increase in equivalent H2 cost ($/kg) which provides a greater profit margin for the hydrogen refueling station. The average U.S. gasoline / diesel prices were used in the Table 1 calculations, but at the state level the gasoline costs vary by 5-10% which adds a regional aspect to the analysis.
(2) Most vehicle platforms were hybrid hydrogen fuel cell with a battery sized to handle a combination of range and power requirements.
(3) There are wide ranges of reported mileage for FCEVs – from 60 miles/kg to 80 miles/kg.
3.3 Tube Trailer, Pipeline and Electrolyzer Supply Analysis
An estimate of the pipeline cost hydrogen supply cost was determined using the methods described in [25] to obtain the following characteristic values needed for H2FAST (all other H2FAST values were left as the default values):
• 10 km of new pipeline @ $700K/km - $7M capital cost • Station cost - $2.5M capital cost • 1000 kg hydrogen @ $4.50/kg [26] - $4,500 • Electricity cost for pumps and controls - $0.07/kWh, 1 kWh/kg, 1000kg = $70 • Total hydrogen and electricity cost = ($4,500 + $70) / 1000kg = $4.57/kg • Maintenance cost – 5% of capital cost - $475K • H2FAST calculated the 15-year investor payback to be $9/kg An estimate of the tube trailer hydrogen supply cost was obtained using the methods
described in [27] to obtain the following characteristic values needed for H2FAST: • Station cost - $2.5M capital cost • 1000 kg hydrogen @ $4.50/kg [26] - $4,500 • Total hydrogen and electricity cost = $7,500 / 1000kg = $7.50/kg • Delivery cost: $3/kg -$3,000 for 1000kg • Maintenance cost – 10% of capital cost - $250K • H2FAST calculated the 15-year investor payback to be $9.59/kg
11
An estimate of the electrolyzer hydrogen generation cost was obtained using the methods described in [28] to obtain the following characteristic values needed for H2FAST:
• Station cost - $2.5M capital cost • Two 500 kg/day electrolyzer cost: 3413kW * $940/kW * 2 = $7.186M • Electricity cost = $0.07/kWh * 54.6kWh/kg * 1000kg = $3,822 / day • Maintenance cost – 3.2% of capital cost - $310K • H2FAST calculated the 15-year investor payback to be $7.50/kg
3.4 Integrated Economic Analysis
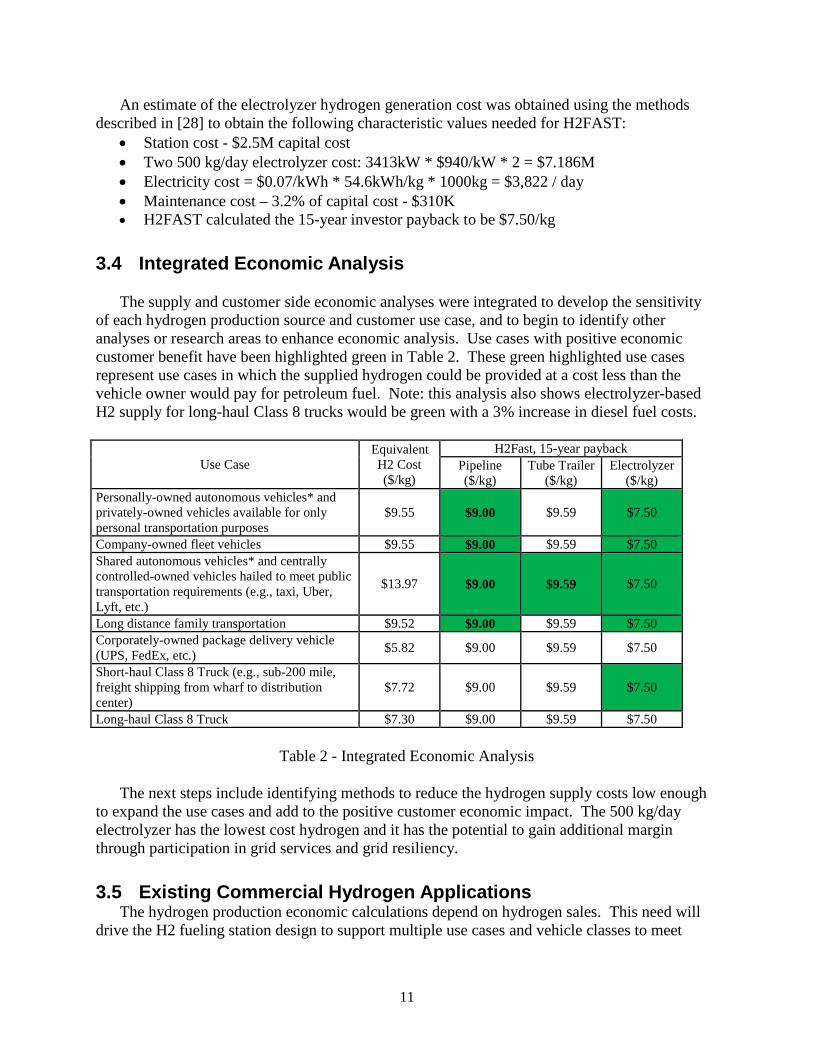
The supply and customer side economic analyses were integrated to develop the sensitivity of each hydrogen production source and customer use case, and to begin to identify other analyses or research areas to enhance economic analysis. Use cases with positive economic customer benefit have been highlighted green in Table 2. These green highlighted use cases represent use cases in which the supplied hydrogen could be provided at a cost less than the vehicle owner would pay for petroleum fuel. Note: this analysis also shows electrolyzer-based H2 supply for long-haul Class 8 trucks would be green with a 3% increase in diesel fuel costs.
Use Case Equivalent H2 Cost ($/kg)
H2Fast, 15-year payback Pipeline ($/kg)
Tube Trailer ($/kg)
Electrolyzer ($/kg)
Personally-owned autonomous vehicles* and privately-owned vehicles available for only personal transportation purposes
$9.55 $9.00 $9.59 $7.50
Company-owned fleet vehicles $9.55 $9.00 $9.59 $7.50 Shared autonomous vehicles* and centrally controlled-owned vehicles hailed to meet public transportation requirements (e.g., taxi, Uber, Lyft, etc.)
$13.97 $9.00 $9.59 $7.50
Long distance family transportation $9.52 $9.00 $9.59 $7.50 Corporately-owned package delivery vehicle (UPS, FedEx, etc.) $5.82 $9.00 $9.59 $7.50
Short-haul Class 8 Truck (e.g., sub-200 mile, freight shipping from wharf to distribution center)
$7.72 $9.00 $9.59 $7.50
Long-haul Class 8 Truck $7.30 $9.00 $9.59 $7.50
Table 2 - Integrated Economic Analysis
The next steps include identifying methods to reduce the hydrogen supply costs low enough to expand the use cases and add to the positive customer economic impact. The 500 kg/day electrolyzer has the lowest cost hydrogen and it has the potential to gain additional margin through participation in grid services and grid resiliency.
3.5 Existing Commercial Hydrogen Applications The hydrogen production economic calculations depend on hydrogen sales. This need will
drive the H2 fueling station design to support multiple use cases and vehicle classes to meet
12
fueling station net income goals. Table 1 also indicates that fueling a relatively small number of long-haul Class 8 trucks could be the driving force behind the geographic expansion of locations for non-urban H2 refueling stations.
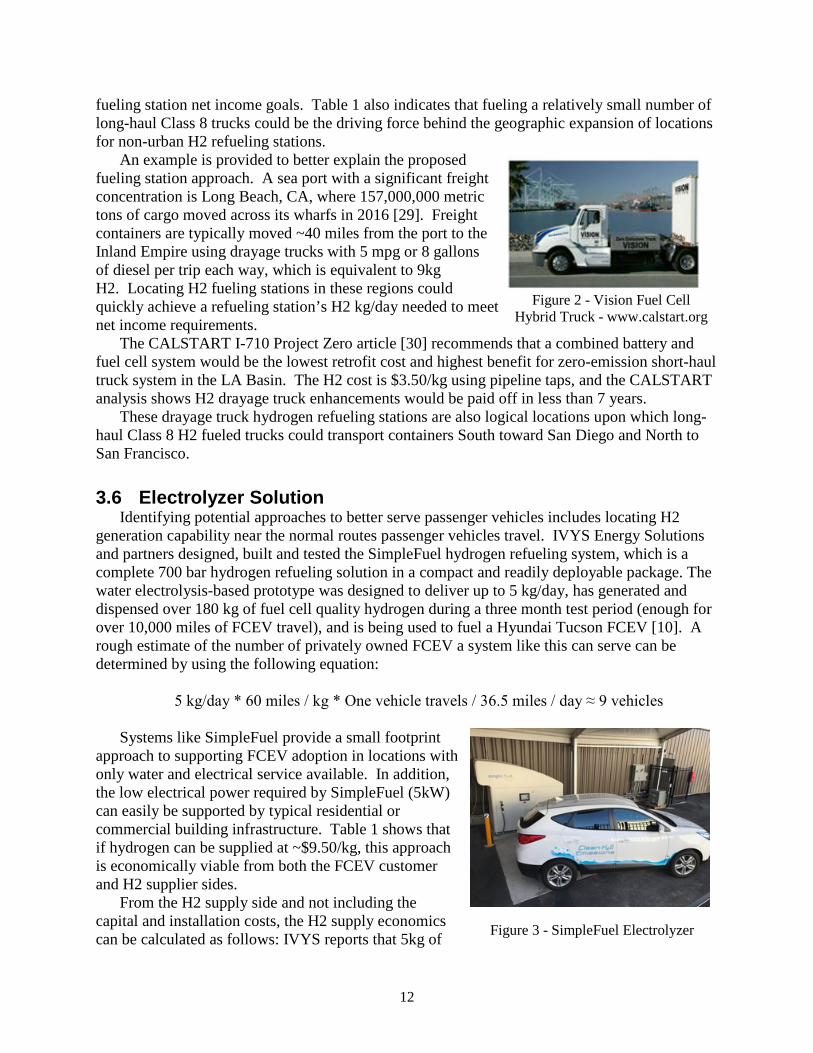
An example is provided to better explain the proposed fueling station approach. A sea port with a significant freight concentration is Long Beach, CA, where 157,000,000 metric tons of cargo moved across its wharfs in 2016 [29]. Freight containers are typically moved ~40 miles from the port to the Inland Empire using drayage trucks with 5 mpg or 8 gallons of diesel per trip each way, which is equivalent to 9kg H2. Locating H2 fueling stations in these regions could quickly achieve a refueling station’s H2 kg/day needed to meet net income requirements.
The CALSTART I-710 Project Zero article [30] recommends that a combined battery and fuel cell system would be the lowest retrofit cost and highest benefit for zero-emission short-haul truck system in the LA Basin. The H2 cost is $3.50/kg using pipeline taps, and the CALSTART analysis shows H2 drayage truck enhancements would be paid off in less than 7 years.
These drayage truck hydrogen refueling stations are also logical locations upon which long-haul Class 8 H2 fueled trucks could transport containers South toward San Diego and North to San Francisco.
3.6 Electrolyzer Solution Identifying potential approaches to better serve passenger vehicles includes locating H2
generation capability near the normal routes passenger vehicles travel. IVYS Energy Solutions and partners designed, built and tested the SimpleFuel hydrogen refueling system, which is a complete 700 bar hydrogen refueling solution in a compact and readily deployable package. The water electrolysis-based prototype was designed to deliver up to 5 kg/day, has generated and dispensed over 180 kg of fuel cell quality hydrogen during a three month test period (enough for over 10,000 miles of FCEV travel), and is being used to fuel a Hyundai Tucson FCEV [10]. A rough estimate of the number of privately owned FCEV a system like this can serve can be determined by using the following equation:
5 kg/day * 60 miles / kg * One vehicle travels / 36.5 miles / day ≈ 9 vehicles
Systems like SimpleFuel provide a small footprint
approach to supporting FCEV adoption in locations with only water and electrical service available. In addition, the low electrical power required by SimpleFuel (5kW) can easily be supported by typical residential or commercial building infrastructure. Table 1 shows that if hydrogen can be supplied at ~$9.50/kg, this approach is economically viable from both the FCEV customer and H2 supplier sides.
From the H2 supply side and not including the capital and installation costs, the H2 supply economics can be calculated as follows: IVYS reports that 5kg of
Figure 2 - Vision Fuel Cell Hybrid Truck - www.calstart.org
Figure 3 - SimpleFuel Electrolyzer
13
H2 can be produced by 5kW in a day, which is equivalent to 120kWh. If 120kWh is needed to produce one kg of H2 for $9.50, the cost of electricity must be less than 7.9¢/kWh to break even. Electrical power at or below this using commercial rates is available in large portions of the U.S. [26], but rates lower than 7.9¢/kWh would be needed to support periodic maintenance costs. Subsidizes would be needed to pay installation and capital costs.
An H2FAST economic analysis of the SimpleFuel electrolyzer used $350K capital cost, $3.5K annual maintenance cost, and a national average electricity price of 11¢/kWh. These factors resulted in a payback period of 20 years.
3.7 PEV / FCEV Market Adoption Estimates
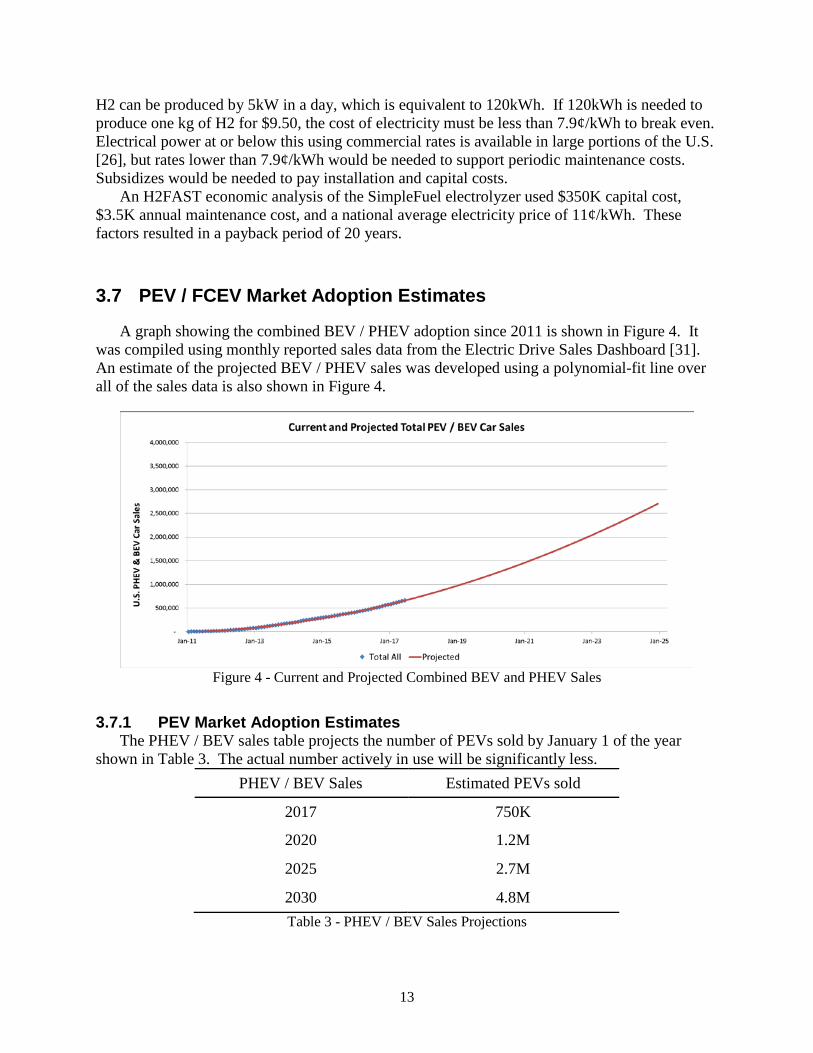
A graph showing the combined BEV / PHEV adoption since 2011 is shown in Figure 4. It was compiled using monthly reported sales data from the Electric Drive Sales Dashboard [31]. An estimate of the projected BEV / PHEV sales was developed using a polynomial-fit line over all of the sales data is also shown in Figure 4.
Figure 4 - Current and Projected Combined BEV and PHEV Sales
3.7.1 PEV Market Adoption Estimates
The PHEV / BEV sales table projects the number of PEVs sold by January 1 of the year shown in Table 3. The actual number actively in use will be significantly less.
PHEV / BEV Sales Estimated PEVs sold
2017 750K
2020 1.2M
2025 2.7M
2030 4.8M Table 3 - PHEV / BEV Sales Projections
14
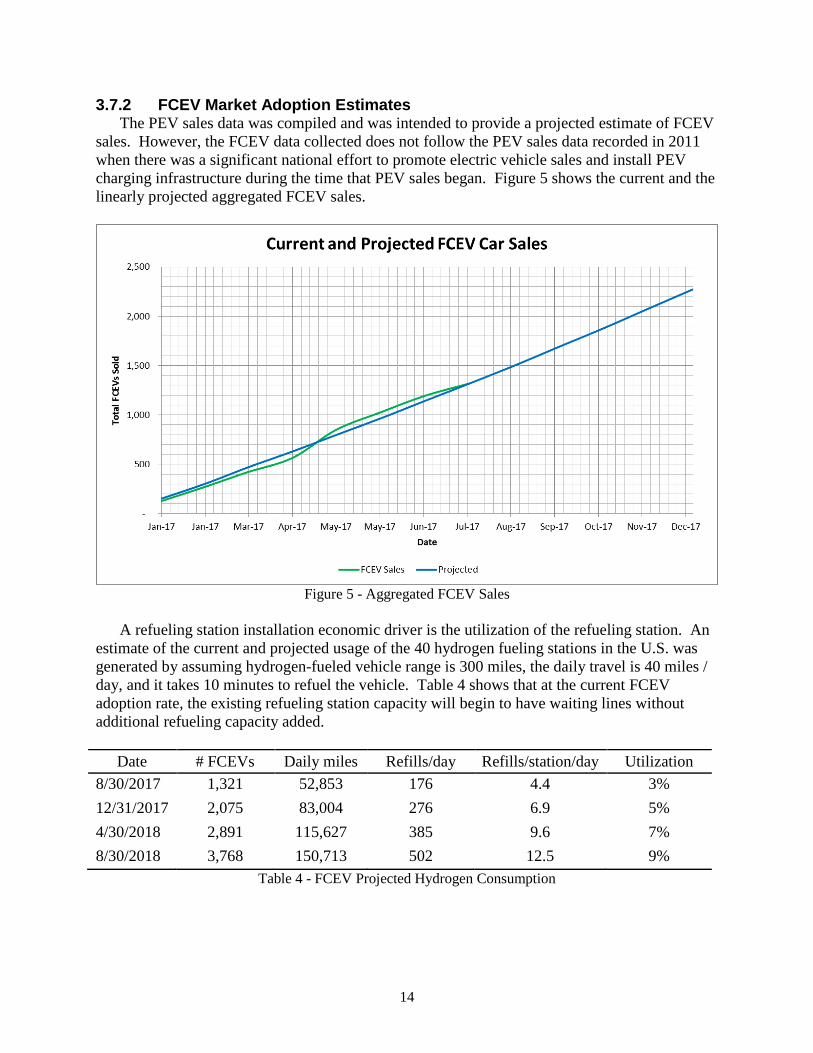
3.7.2 FCEV Market Adoption Estimates The PEV sales data was compiled and was intended to provide a projected estimate of FCEV
sales. However, the FCEV data collected does not follow the PEV sales data recorded in 2011 when there was a significant national effort to promote electric vehicle sales and install PEV charging infrastructure during the time that PEV sales began. Figure 5 shows the current and the linearly projected aggregated FCEV sales.
Figure 5 - Aggregated FCEV Sales
A refueling station installation economic driver is the utilization of the refueling station. An
estimate of the current and projected usage of the 40 hydrogen fueling stations in the U.S. was generated by assuming hydrogen-fueled vehicle range is 300 miles, the daily travel is 40 miles / day, and it takes 10 minutes to refuel the vehicle. Table 4 shows that at the current FCEV adoption rate, the existing refueling station capacity will begin to have waiting lines without additional refueling capacity added.
Date # FCEVs Daily miles Refills/day Refills/station/day Utilization
8/30/2017 1,321 52,853 176 4.4 3% 12/31/2017 2,075 83,004 276 6.9 5% 4/30/2018 2,891 115,627 385 9.6 7% 8/30/2018 3,768 150,713 502 12.5 9%
Table 4 - FCEV Projected Hydrogen Consumption
15
3.8 Integrated Electrolysis Systems into Built Infrastructure Electrification of transportation using electrolysis to generate hydrogen has other potential
benefits including: 1. A distributed network of controllable hydrogen generation loads on the grid could enable
utilities to use demand response load control 2. Low-loss energy storage system for transportation or grid support once hydrogen is
stored in cylinders is possible. Competitive Hydrogen Energy Storage (HES) systems cannot rely upon the simple service of storing grid electricity for later conversion back to grid electricity. Instead, competitive HES systems will receive multiple revenue streams by providing more than one energy service or industrial feedstock. Providing multiple services and feedstocks distinguishes HES systems from other types of energy storage, such as batteries or compressed air energy storage systems. HES systems have unique flexibility that can assist energy planners, facility owners, and grid operators with system reliability and the integration of renewable energy into multiple energy end-uses within the power, heating, and transportation infrastructure [32].
3. Electrolyzer systems can incorporate variable hydrogen generation based on grid conditions and renewable generation can enhance the grid flexibility. A 40kW Polymer Electrolyte Membrane (PEM) electrolyzer was reported to ramp-up or ramp-down in power from 100% to 25% in less than one second [15]. This dynamic characteristic enables a PEM electrolyzer to contribute to the following grid services: a. Peak capacity management by controlling multiple electrolyzers to consistently and
reliably reduce critical peak loads within a defined region or location on the grid b. Energy market price response by controlling electrolyzers consume energy when
prices are low and defer consumption when prices are high c. Regulation - electrolyzer power operating point adjustment counteracts short-term
changes in grid electricity use that might affect the stability of the power system d. Spinning reserve - by reducing its power consumption, electrolyzers can support the
event when loss of generation unit in the grid occurs e. Ramping - electrolyzers can be commanded to start and stop on command, while the
“ramp rate” is the rate at which they can increase or decrease consumption f. Artificial inertia - controlling electrolyzers to regulate active power consumption in
response rate of change of frequency g. Distribution voltage management - upon detecting the voltage deviations (self-
sensing and/or receipt of external measurement signals), electrolyzers adjust the net load in the form of their reactive and/or real power components
h. Autonomous grid service responses - additional (high-level) controller enables grid services in “stand-alone” mode.
4. The capability to integrate fuel cells and inverters into the HES system to supply power to the grid when needed for resiliency or fault-tolerant system requirements
5. Electrolyzers collocated with one or more DCFC or extreme DC Fast Charger could be operated such that the total power consumed by all is managed to be a relatively constant power level. This can have a direct impact on the rates both the EVSE owner and the electrolyzer owner pay for electricity. INL reported [11] that better integration with the grid can reduce electrolyzer operation costs by up to 20% using current markets and rate structures within California.
16
4.0 Additional Research Areas / Gaps
4.1 Tools development The economic analysis tool, H2FAST uses manually-entered values to provide an in-
depth financial analysis for hydrogen fueling stations based on financial inputs such as station capital cost, operating cost, and financing mechanisms. But for assessing hydrogen as a transportation fuel, a missing H2FAST capability was having the ability to link the H2FAST tool’s inputs and outputs to vehicle transportation characteristics for selected regions or use cases (e.g., metro area, depot and bus stop, inter-city corridor for passenger vehicles, intra-city medium duty transit, intra-city connected/autonomous ride-sharing fleets, etc.), as well as providing a more detailed accounting for integrating hydrogen storage, electric grid services, and wind / solar / battery storage integration.
4.2 Systems Analysis The current low price of oil makes the value proposition difficult for the mainstream
consumer market and fueling infrastructure service providers. The current research gaps include: • Develop a flexible approach to optimally co-deploy hydrogen production, storage, and
fueling options with alternative transportation system fuels (DCFC, biofuels) over 5-year, 10-year and 20-year transportation system horizons. These studies could consider cost, functional requirements, safety, and other factors. Additionally, case studies could be performed to analyze the potential to integrate these technologies with the built environment to improve business cases for fueling station owners.
• Refueling station owners lack the integrated models needed to project the economic trade-offs between refueling station capital cost, transportation energy usage, electrical system costs, grid services, hydrogen production location, and other regional factors that would affect their business. Collaboration with other Alternative Fuel Infrastructure tasks would enable identification of key metrics needed to develop the models for co-deployment of alternative fuels and to determine the adequacy of electrical grid support required to sustain hydrogen infrastructure growth.
17
5.0 Conclusions The use cases evaluated and value propositions developed consistently show that reducing
hydrogen production capital and maintenance costs has a significant and direct impact on the FCEV owner’s value proposition. The hydrogen generating system design must be modular to enable expanding production to supply an evolving variety of hydrogen markets (e.g., shared mobility, autonomous transportation, urban FCEV refueling, rural or freeway off-ramp FCEV refueling, hydrogen energy storage, electric grid services, industrial process feedstocks, etc.) as these markets grow. The hydrogen system design would benefit from a variety of process feedstock options (e.g., electricity, methane, natural gas, tube trailer, etc.) to maximize the long-term flexibility to adapt to regional market, application, and technology changes. Finally, electrolysis-based hydrogen system designs should have implemented control system capability necessary to be collocated with electric vehicle DC Fast Charger or Extreme Fast Chargers to enable demand charges to be minimized and meet other local electrical supply constraints.
Hybrid hydrogen (combined fuel cell and battery) transportation system designs are a common vehicle implementation, from Class 8 trucks to passenger vehicles. This design approach helps minimize the cost associated with sizing both the fuel cell and battery capacities needed to support both transient power requirements and longer range energy needs. The shipping port drayage truck application demonstrated that installing hybrid hydrogen conversion kits was cost effective, and had a short payback period using pipeline-supplied hydrogen when compared to diesel-fuel drayage truck operations.
The fuel cost and travel range also affects the customer value proposition between passenger BEVs and FCEVs. Above a 150-mile travel range, the FCEV is more economical than BEVs. This FCEV advantage is also strengthened by the significantly faster refueling times and longer range capability for FCEVs. Longer FCEV travel ranges also eases the location requirements for refueling in that a large portion of the travel range does not need to be reserved to travel to refueling stations. These characteristics would enable FCEVs to have advantages in the autonomous and shared vehicle applications that require faster refueling and longer ranges.
Two key drivers for FCEV adoption are the fuel cost and proximity of fueling stations relative to the customers’ travel patterns. Fueling station availability impact is reduced in FCEV applications due to the longer range capability of FCEVs. Fuel cost is a function of distance traveled, fuel economy (e.g., mpg or miles/kg), and the local price of fuel (e.g., $/gal or $/kg). The price of fuel is the critical value proposition driver with hydrogen refueling station capital and construction costs being the major contributors to the hydrogen fuel price. An analysis showed that several use cases currently had positive value propositions for both the hydrogen supplier and the vehicle owner. In addition, shared and autonomous transportation use cases are anticipated to have increased daily travel ranges and therefore benefit from hydrogen-based transportation. Additional profit margin sources are also available, but require refueling station owners to make additional investments and participate in grid services, hydrogen storage, or other non-transportation businesses.
18
6.0 References [1] Sarkar, R, Ward J, "DOE SMART Mobility: Systems and Modeling for Accelerated Research in Transportation", downloaded from https://link.springer.com/content/pdf/10.1007%2F978-3-319-40503-2_4.pdf on 8/30/2017.
[2]https://ops.fhwa.dot.gov/freight/freight_analysis/nat_freight_stats/docs/13factsfigures/pdfs/fff2013_highres.pdf
[3] http://business.tenntom.org/why-use-the-waterway/shipping-comparisons/
[4] http://www.afdc.energy.gov/fuels/fuel_comparison_chart.pdf
[5] Joseck, F, “Systems Analysis Program Area – Plenary Presentation”, June 2017.
[6] https://nikolamotor.com/pdfs/Nikola_Pre-Sale_June13_FINAL.pdf
[7] https://www.afdc.energy.gov/fuels/hydrogen_locations.html
[8] https://www.afdc.energy.gov/fuels/natural_gas_locations.html
[9] https://www.tesla.com/supercharger
[10] http://www.ivysinc.com/news/2017/1/24/ivys-and-simplefuel-win-1m-doe-h-prize
[11] https://www.hydrogen.energy.gov/pdfs/htac_may17_08_hovsapian.pdf
[12] https://www.carfax.com/blog/fuel-cell-forecast-shows-slow-growth/
[13] http://electricdrive.org/index.php?ht=d/sp/i/20952/pid/20952
[14] https://www.afdc.energy.gov/data/10310 - Average Fuel Economy of Major Vehicle Categories
[15] https://energy.gov/sites/prod/files/2017/06/f34/fcto_may_2017_h2_scale_wkshp_hovsapian.pdf
[16] Hill, P, Penev, M., "Hydrogen Fueling Station in Honolulu, Hawaii Feasibility Analysis", INL/EXT-14-21624, August 2014, downloaded from https://energy.gov/eere/fuelcells/downloads/hydrogen-fueling-station-honolulu-hawaii-feasibility-analysis on 9/6/2017.
[17] https://www.afdc.energy.gov/pdfs/45148.pdf
[18] http://www.nyc.gov/html/tlc/downloads/pdf/2014_taxicab_fact_book.pdf
[19] https://www.fueleconomy.gov/feg/pdfs/guides/FEG2016.pdf - highway mpg is roughly 20-25% greater than combined city / highway mileage
[20] Estimated distance traveled
[21] https://www.nrel.gov/docs/fy10osti/44134.pdf
[22] https://www.pressroom.ups.com/pressroom/ContentDetailsViewer.page?ConceptType=PressReleases&id=1493730807330-217
[23] http://www.calstart.org/Libraries/I-710_Project/Key_Performance_Parameters_for_Drayage_Trucks_Operating_at_the_Ports_of_Los_Angeles_and_Long_Beach.sflb.ashx

19
[24] https://nikolamotor.com/one#power
[25] C. Yang, J. Ogden, “Determining the lowest-cost hydrogen delivery mode”, ScienceDirect, July 2006. Downloaded from http://www.sciencedirect.com/science/article/pii/S0360319906001765?via%3Dihub#tbl1.
[26] https://maps.nrel.gov/hydra - commercial forecourt electrolysis
[27] O. Sozinova, “H2A Delivery Analysis and H2A Delivery Components Model”, NREL, June 2010. Downloaded from https://www.nrel.gov/docs/fy10osti/49745.pdf.
[28] Whitney G. Colella, Brian D. James, Jennie M. Moton, Genevieve Saur, Todd Ramsden, “Techno-economic Analysis of PEM Electrolysis for Hydrogen” Strategic Analysis Inc., NREL, February 2014. Downloaded from Productionhttps://energy.gov/sites/prod/files/2014/08/f18/fcto_2014_electrolytic_h2_wkshp_colella1.pdf
[29] http://www.polb.com/civica/filebank/blobdload.asp?BlobID=13720
[30] http://www.calstart.org/Libraries/I-710_Project/I-710_Project_Zero-Emission_Truck_Commercialization_Study_Final_Report.sflb.ashx
[31] http://electricdrive.org/index.php?ht=d/sp/i/20952/pid/20952
[32] M. Melaina and J. Eichman, “Hydrogen Energy Storage: Grid and Transportation Services”, NREL, February 2015. Downloaded from https://www.nrel.gov/docs/fy15osti/62518.pdf.
[33] htp://h2usa.org/H2FAST - The Hydrogen Financial Analysis Scenario Tool (H2FAST) was developed by the National Renewable Energy Laboratory through H2USA to support hydrogen fueling infrastructure deployment. H2FAST provides in-depth financial analysis including cash flow and return on investment for hydrogen fueling stations based on key financial inputs such as station capital cost, operating cost, and financing mechanisms.
[34] https://www.eia.gov/dnav/pet/pet_pri_gnd_dcus_nus_w.htm

PNNL-26920
Distribution
No. of Copies
Distr.1
# David Anderson United States Department of Energy,
Office of Vehicle Technologies 1000 Independence Ave, SW Washington, DC 20585