
Analysis of Hostile Network Reconnaissance to Anticipate and
318
Analysis of Hostile Network Reconnaissance to Anticipate and Mitigate Network Attacks by Luis Angel Rivera A thesis submitted to the College of Engineering at Florida Institute of Technology in partial fulfillment of the requirements for the degree of Master of Science in Computer Science Melbourne, Florida December, 2004 Technical Report CS-2005-06
Transcript of Analysis of Hostile Network Reconnaissance to Anticipate and

Analysis of Hostile Network Reconnaissance to
Anticipate and Mitigate Network Attacks
by
Luis Angel Rivera
A thesis submitted to the College of Engineering at Florida Institute of Technology
in partial fulfillment of the requirements for the degree of
Master of Science
in
Computer Science
Melbourne, Florida
December, 2004
Technical Report
CS-2005-06

©Copyright 2004 Luis Angel Rivera All Rights Reserved
The author grants permission to make single copies__________________________

The undersigned committee, having examined the attached thesis,
”Analysis of Hostile Network Reconnaissance to Anticipate and Mitigate Network Attacks”, by
Luis Angel Rivera hereby indicates its unanimous approval.
_____________________________ Gerald A. Marin, Ph.D Professor, Computer Sciences Major Advisor
_____________________________ William H. Allen, Ph.D Assistant Professor, Computer Sciences Thesis Advisor
_____________________________ Mohammad Shahsavari, Ph.D Associate Professor, Computer Sciences Thesis Advisor
_____________________________ William Shoaff, Ph.D Associate Professor and Department Head, Computer Sciences Department Head
ii

Abstract
Title:
Analysis of Hostile Network Reconnaissance to Anticipate and Mitigate Network Attacks
Author:
Luis Angel Rivera
Principal Advisor:
Gerald Marin, Ph.D.
Network security systems today such as current intrusion detection systems,
intrusion prevention systems and firewalls are good at reacting to attacks as they
occur or shortly after they occur. Current security systems lack the ability to
identify and detect the activity that usually precedes an attack. This activity is
known as network reconnaissance. In this thesis we have developed a technique
that can assist current security systems to detect hostile network reconnaissance to
anticipate and mitigate network attacks.
iii

Acknowledgement First and foremost I would like to thank Dr. Gerald Marin and Dr. William Allen.
Without your advice, guidance and encouragement I could have not been able to
complete this thesis. I would also like to thank, Nicole Hoier for taking the time to
proof read my work and for advising me; Eric Kledzik for reviewing the technical
accuracy of my work; Christopher Nucci for his assistance with the programming,
thank you Chris, I could not have completed Oinker on time without your
assistance; Dr. Herbert Thompson for taking the time to read my work and for
providing valuable input; Daniel Simpson for his encouragement and advice; Chin
Dou for being my thesis mate and providing me with encouragement, I wish you
the best with your thesis and defense and Stevan Thomas and Jeff Tabatabai for
their technical input.
iv

Dedication
I would like to dedicate this thesis to my better half, my soul mate and
friend, Magdalena Indira Fernandez, my wife. Thank you for your tender loving
care, encouragement and support.
v
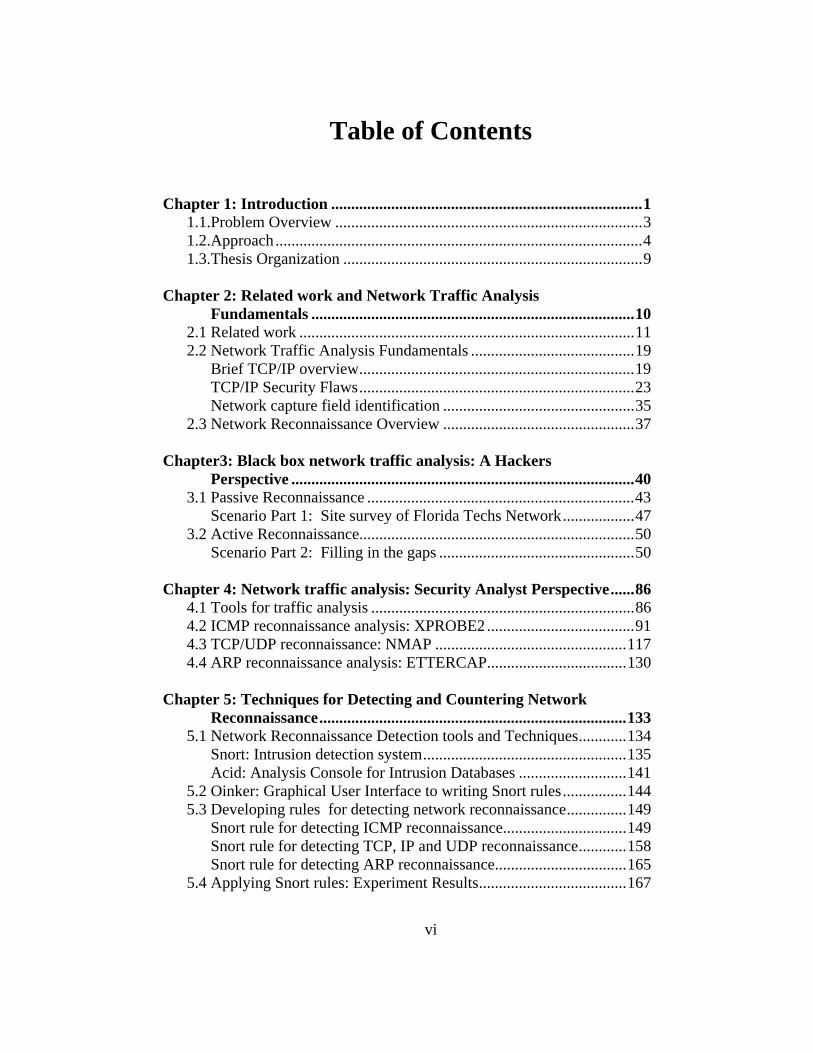
Table of Contents
Chapter 1: Introduction ..............................................................................1
1.1.Problem Overview .............................................................................3 1.2.Approach............................................................................................4 1.3.Thesis Organization ...........................................................................9
Chapter 2: Related work and Network Traffic Analysis Fundamentals .................................................................................10
2.1 Related work ....................................................................................11 2.2 Network Traffic Analysis Fundamentals .........................................19
Brief TCP/IP overview.....................................................................19 TCP/IP Security Flaws.....................................................................23 Network capture field identification ................................................35
2.3 Network Reconnaissance Overview ................................................37
Chapter3: Black box network traffic analysis: A Hackers Perspective ......................................................................................40
3.1 Passive Reconnaissance ...................................................................43 Scenario Part 1: Site survey of Florida Techs Network..................47
3.2 Active Reconnaissance.....................................................................50 Scenario Part 2: Filling in the gaps .................................................50
Chapter 4: Network traffic analysis: Security Analyst Perspective......86
4.1 Tools for traffic analysis ..................................................................86 4.2 ICMP reconnaissance analysis: XPROBE2.....................................91 4.3 TCP/UDP reconnaissance: NMAP ................................................117 4.4 ARP reconnaissance analysis: ETTERCAP...................................130
Chapter 5: Techniques for Detecting and Countering Network Reconnaissance.............................................................................133
5.1 Network Reconnaissance Detection tools and Techniques............134 Snort: Intrusion detection system...................................................135 Acid: Analysis Console for Intrusion Databases ...........................141
5.2 Oinker: Graphical User Interface to writing Snort rules................144 5.3 Developing rules for detecting network reconnaissance...............149
Snort rule for detecting ICMP reconnaissance...............................149 Snort rule for detecting TCP, IP and UDP reconnaissance............158 Snort rule for detecting ARP reconnaissance.................................165
5.4 Applying Snort rules: Experiment Results.....................................167
vi

Conclusions ............................................................................................183 References ............................................................................................195 Appendix A ............................................................................................209 Appendix B ............................................................................................282 Appendix C ............................................................................................311
vii

Chapter 1
Introduction
The Internet came into existence in the 1970’s through what was known as
ARPANET, the Advanced Research Project Agency Network [1]. According to the
Internet Software Consortium, the Internet has grown from a mere 1.3 million hosts
in 1993 to over 285 million in 2004, [2]. This rapid growth has brought about giant
world-wide interwoven complex networks. Requirements have encouraged the
development of new network protocols, which has made communication possible
between software and hardware introduced into the market. This advancement in
technology has given birth to endless information security issues. The risk of cyber
attacks continues to grow year after year [3]. Even organizations that have
deployed a wide range of security technologies can fall victim to significant losses
[4].
Computer Security and Network Security are both areas that deal with
information security, but are quit different. This paper discusses methods, ideas and
concepts that can be applied to computer security, but are intended for networked
systems. A computer that is not networked is not vulnerable to attacks that require
the use of protocols such as TCP/IP. Such a computer can only be compromised if
an attacker has physical access to the system.
1

It must be understood that information security is more than just deploying
the latest and greatest technology or having unlimited network monitoring.
Information security is a process. Effective information security requires
management support, enforcing information security
policies/procedures/guidelines, and educating employees (making them aware of
social engineering and how it can be used against the organization) so they
understand and support the information security program being implemented. An
understanding of the technology is imperative in order to effectively apply it to the
organization. In addition, a well-educated and managed technical staff is a must.
This is merely a foundation to start from; every organization has unique
information security requirements. Peiter Zatko said it best during an interview
with Information Security magazine, “No matter what security tool is put on the
market, security still must be specifically modeled and personalized to individual
environments” [5].
By no means is the information presented in this paper a total solution to
information security. Rather, it presents ways to help detect network anomalies and
identify when certain tools are being used against a network by understanding how
to analyze and effectively interpret network traffic. It must be noted that network
vulnerabilities can be the result of misconfiguration of a network device, or a flaw
in hardware or software.
2

1.1 Problem Overview
The concept of information/computer security was present for many years
before creation of the Internet, but those concepts were not applied during
development of the Internet. Convenient collaboration between universities and
government agencies was the driving force behind development of the Internet.
Today, this design flaw has become a nightmare for universities, government
agencies and private organizations alike. Flaws in the key protocol used, TCP/IP,
can now be easily exploited by tools readily available on the Internet. Tools
currently exist that allow attackers to exploit protocol weaknesses remotely and at
great speeds and efficiency with very little knowledge of how it all works. Denial
of service attacks, defacing of web sites, and even scanning a network for known
vulnerabilities can now be done by anyone with access to the Internet. These types
of attackers, known as script kiddies, are novice to mid-level users who know just
enough to be dangerous. Script kiddies typically attack private and public systems
to make their Internet name known among other hackers. However, there exists a
more skillful group of attackers, the most dangerous kind, that attack and break into
systems for profit, revenge or for political reasons. These attackers know how to
cover their tracks and are very difficult to detect and hunt down.
Vulnerabilities of the Internet were demonstrated by Robert Morris’s worm
in 1988 [6], and many more were identified by Steven M. Bellovin in 1989 [7].
Rapid advancements in technology, growth of systems using the TCP/IP protocol,
3

and poorly trained system administrators have made it very difficult to detect
security holes before they are exploited. There are many other contributors to the
endless security issues we now face with networks, such as poorly written
applications, inherit problems in key programming languages (like C and C++ [8]),
and poor application security maintenance schedules.
How do we defend against these adversaries? The key word here is defend
against. No system is safe once it is connected to the Internet. Once a system is
configured to access the outside world via a Local Area Network (LAN), Wide
Area Network (WAN), Metropolitan Area Network (MAN), Broadband (etc: Cable
Modem, Digital Subscriber Line (DSL), Wireless, or a dial-up connection, it is
vulnerable to weaknesses found in operating systems in addition to network
hardware and software flaws. No matter what defenses are put in place, the system
will always be open to some exploit, whether it is caused by a hardware/software
flaw, misconfiguration or poor maintenance. A key defense to this is identifying
anomalies in network traffic, such as network scans and denial of service attacks
which cause abnormal increases in bandwidth usage, and taking appropriate action
to prevent compromise [9].
1.2 Approach
With so many different protocols and networking devices being developed
today, the analysis of network traffic has become exponentially difficult. Because
of this complexity, network attacks have also become difficult to detect and in
4

some cases prevent. Current network security solutions, such as network intrusion
detection systems and firewalls, have done a reasonable job at assisting in the
detection and mitigation of attacks. However, whether it is matching signatures,
detecting anomalies based on some statistical profile or regulating access based on
some predefined policies, current network security solutions rely on some event to
trigger a defined threshold in order to take action and hopefully assist in preserving
network confidentiality, integrity and availability.
Our approach in this thesis does not concentrate on detecting attacks,
but rather the activity which precedes most attacks. This activity is referred to
as network reconnaissance; reconnaissance in the literal meaning is an
exploratory survey or examination of an area. In this case the “area” being
surveyed would be a network or a computer system. In order to detect network
reconnaissance, an analysis of inbound network traffic is required. However, in
order to perform an analysis on inbound network traffic to identify network
reconnaissance, an understanding of what network reconnaissance traffic looks
like is important.
To generate network reconnaissance traffic for analysis, we built an
environment, Figure 1, where we were not bound to any rules and would not
interfere with production systems. This laboratory was designed to be dynamic so
that it could be easily reconfigured to meet experimental needs. Tables 1, 2 and 3
5

provide an explanation of system roles and descriptions for the base configuration
used for this thesis.
6
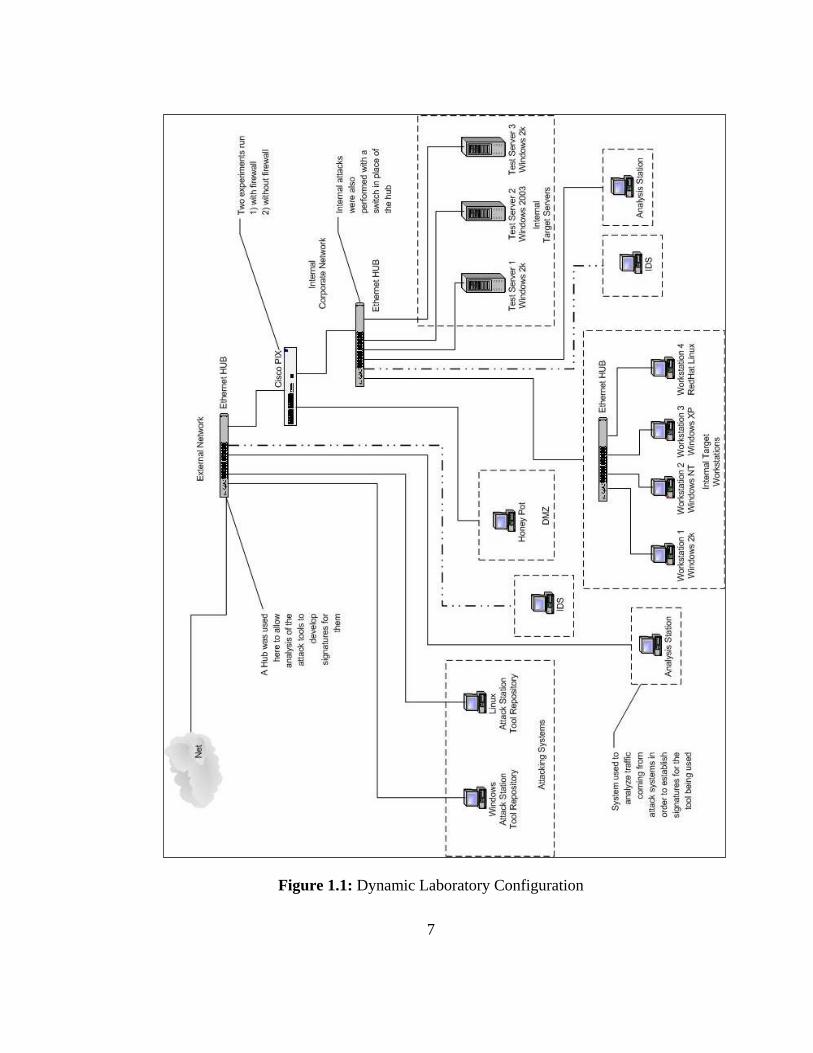
Figure 1.1: Dynamic Laboratory Configuration
7
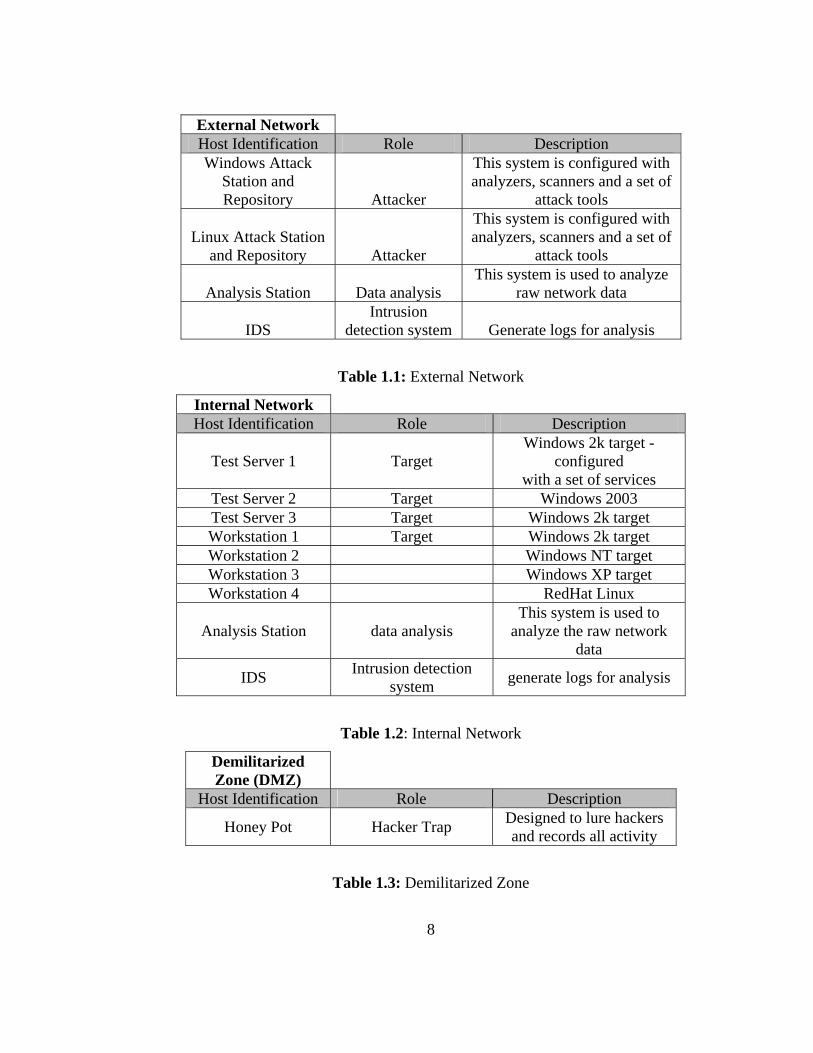
External Network Host Identification Role Description Windows Attack
Station and Repository Attacker
This system is configured with analyzers, scanners and a set of
attack tools
Linux Attack Station and Repository Attacker
This system is configured with analyzers, scanners and a set of
attack tools
Analysis Station Data analysis This system is used to analyze
raw network data
IDS Intrusion
detection system Generate logs for analysis
Table 1.1: External Network
Internal Network Host Identification Role Description
Test Server 1 Target Windows 2k target -
configured with a set of services
Test Server 2 Target Windows 2003 Test Server 3 Target Windows 2k target Workstation 1 Target Windows 2k target Workstation 2 Windows NT target Workstation 3 Windows XP target Workstation 4 RedHat Linux
Analysis Station data analysis This system is used to
analyze the raw network data
IDS Intrusion detection system generate logs for analysis
Table 1.2: Internal Network
Demilitarized Zone (DMZ)
Host Identification Role Description
Honey Pot Hacker Trap Designed to lure hackers and records all activity
Table 1.3: Demilitarized Zone
8

1.3 Thesis Organization
The remainder of this thesis is organized as follows. Chapter 2 discusses
fundamentals necessary to perform the types of analysis discussed in later chapters
and related works in network traffic analysis. Chapter 3 presents the black box
hackers’ perspective in analyzing a network, what a hacker does to gain
information on a network, how to analyze the raw data collected, some of the tools
used to collect this information, and finally an analysis and comparison of the tools.
Chapter 4 discusses a security analyst perspective to analyzing network traffic,
some of the traffic analysis tools available, reconnaissance detection and analysis,
and building a stealth network analysis station. Chapter 5 presents experimental
traffic analysis results and discusses how to identify the hacker tools presented in
Chapter 3. Chapter 6 presents conclusions and limitations to the methods discussed
in previous chapters. Cited works and appendices are featured next. Appendix A
covers detail information on various tools used throughout the thesis, Appendix B
contains detailed information with regard to the protocols discussed.
9
Chapter 2
Related work and Network Traffic Analysis Fundamentals
Computer systems today are under an unprecedented threat from Internet
attacks initiated by “hackers.”1 The poor state of Internet security calls for more
effective ways to protect networked systems. Attacks can be launched from
practically anywhere in the world and the economic losses from attacks have
become extensive [10]. Over the past several years, networked systems have grown
considerably in size, complexity, and the tools and techniques available to attackers
have grown proportionally. Current security technologies are reaching their
limitations, and more innovative solutions are required to deal with current and
future threats [11].
In this chapter, we discuss related work and network traffic analysis
fundamentals. Our goal is to learn to distinguish malicious network traffic from
normal traffic, through detailed analysis of reconnaissance tools used by hackers
and the traffic generated by these tools. While there are times when a network
attack pattern is obvious, one must often search for events of interest. Whenever
attackers write software for denial of service, software exploits, or scanning
1 It is only fair to acknowledge the distinction between the original term hacking to referring to someone who is a clever programmer and the term “cracker” referring to someone who breaks into systems, bypassing any security measures put in place. Due to media treatment today there is no difference between the two. In this paper we use the term hacker or hackers as in common usage which is unfortunately the definition used for a cracker [94].
10

networks, the software tends to leave a signature that is the result of a crafted
packet. This signature is an example of a network traffic property that makes
traffic analysis feasible. In some respects this is similar to the way a bullet is
marked by the barrel of the gun that fired it. These marks make it possible for
experts to identify the gun that fired the bullet [12].
The analysis of network traffic requires an understanding of network
protocols and reconnaissance techniques, as well as the ability to read and interpret
traffic captures using protocol analyzers [29] [31]. It also requires the ability to
identify “normal” network traffic, which depends on protocols being used by the
organization. In this thesis, normal network traffic is defined as network traffic
which does not exceed the bandwidth and protocol thresholds identified as normal
for a particular network infrastructure.
2.1 Related work Currently, two widely-used tools for blocking or detecting attacks as they
occur are firewalls and network intrusion detection systems (NIDS). A firewall is a
device with a set of rules specifying what traffic it will allow or deny [83] [110].
Conceptually, there are two types of firewalls: Network Layer and Application
Layer firewalls. Network layer firewalls make decisions based on the source,
destination IP addresses, and port numbers in individual IP packets. A simple
router is the ``traditional'' network layer firewall, since it is not able to make
particularly sophisticated decisions about what a packet is actually communicating
11
or where it originated. Modern network layer firewalls have become increasingly
sophisticated, and now maintain internal information about the state of connections
passing through them, the contents of some of the data streams, etc. Application
layer firewalls are hosts running proxy servers that permit no direct traffic to the
systems being protected and perform elaborate logging and auditing of traffic
passing through them.
A NIDS is like a burglar system for a network, which is used to detect and
alert on suspicious events [37]. The concept of intrusion detection is often credited
to James P. Anderson, who published a paper “Computer Security Threat Modeling
and Surveillance” in 1980, which outlined ways to improve computer security
auditing and surveillance [103]. However, Dorothy Denning first proposed
anomaly detection as an approach for IDS in 1987 [107]. Denning helped to
develop the first model for intrusion detection, the Intrusion Detection Expert
System (IDES), which provided the foundation for IDS technology techniques,
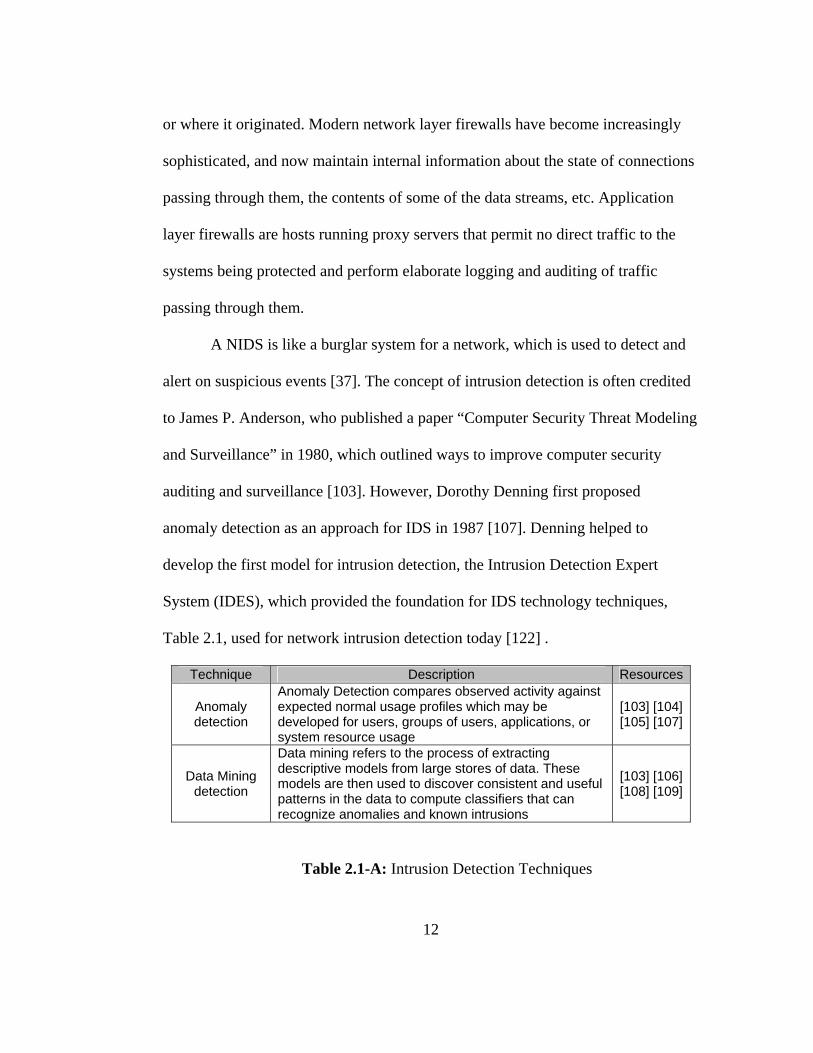
Table 2.1, used for network intrusion detection today [122] .
Technique Description Resources
Anomaly detection
Anomaly Detection compares observed activity against expected normal usage profiles which may be developed for users, groups of users, applications, or system resource usage
[103] [104] [105] [107]
Data Mining detection
Data mining refers to the process of extracting descriptive models from large stores of data. These models are then used to discover consistent and useful patterns in the data to compute classifiers that can recognize anomalies and known intrusions
[103] [106] [108] [109]
Table 2.1-A: Intrusion Detection Techniques
12

Signature detection
Signature-based ID systems detect intrusions by observing events and identifying patterns which match the signatures of known attacks. These attack signatures are stored in some form of database and need to be updated frequently. If a match is found an alert is triggered
[103] [104] [111] [112]
Table 2.1-B: Intrusion Detection Techniques
These three techniques have laid the foundation for the development of other
ID techniques such as policy base detection [114] [115], adaptive model generation
[113], user intent identification [112], and specification-based anomaly detection
[116]. In many cases existing research tools have been applied to intrusion
detection, including expert systems, neural nets and colored Petri nets [112]. For
the most part, however, intrusion detection systems are based on one, if not all, of
the techniques in Table 2.1-A and 2.1-B.
Three of the more popular open source intrusion detection systems are listed
in Table 2.2.
IDS Detection technique Resource Snort signature [37] [39] [119]
Bro packet filtering and policies [117]
Shadow policy and signature [38] [118]
Table 2.2: Popular Intrusion Detection Systems
There are also a number of commercial NIDS systems such as Dragon IDS,
Network Flight recorder, and Cisco IDS (there are many more commercial ID
13

systems, but their discussion goes beyond the scope of this paper). In addition to
NIDS, there are also host-based and Hybrid IDS systems [121] [120].
Subsequently, a “new system” has been developed which is intended to make
intrusion detection systems obsolete. This new system is called an IPS, or Intrusion
Prevention System [123]. Interestingly enough, IDS techniques all have the same
thing in common; they rely on some event to trigger some predefined threshold
before any action is taken. As we will discuss in the rest of this chapter, this
limitation is not unique to intrusion detection systems.
Although firewalls and IDSs have important roles to play in defending
networks, their limitations are many, including the following:
• Firewalls actively block certain traffic in or out of a network, but only if
rules have been defined that anticipate characteristics of a particular attack.
Normal traffic may also match those rules.
• IDSs simply raise alerts that network operators must evaluate to determine
whether an attack is truly present, and if so, how it can it be mitigated.
Limitations of these tools have given birth to advanced tools and techniques
that network security professionals can use to complement firewalls and IDSs. One
such tool is called a Honeypot, also referred to as a deception technology because it
is designed to fool the attacker by providing false information [11] [32] [33] [34].
Lance Spitzner [13] states that a Honeypot is a resource whose value lies in being
probed, attacked or compromised. While an attacker is hacking away at a
14
Honeypot, the security professional is able to log all events. This distracts the
hacker from attacking production systems and develops a log that can be used to
identify the attack’s characteristics (perhaps including its source).
Another set of tools has been developed to help minimize and eventually
eliminate what are known as denial of service (DoS) attacks [78]. For example,
RSA laboratories are developing a technique that uses client puzzles as a
countermeasure against connection depletion attacks [14] [35]. In order to receive
the requested service, the client must submit (to the server) a correct solution to the
puzzle within a time-out period [10]. As a second example, Muza Networks
(Boston) has developed auto detection software that stops DoS at the Internet
Service Provider (ISP) [15] [16]. This approach detects and contains a DoS attack
before it leaves the ISP and impacts a destination victim [17].
The University of Massachusetts at Amherst has developed a set of
algorithms for monitoring and warning of Internet worms. These algorithms could
help with the detection of scanning worms, one of the reconnaissance techniques
hackers use today. Scanning worms can act like automated hackers and gather
information on networked systems [22]. There are several options that can be
included in scanning worms. For example, a worm can be modified to scan the
entire local network and send the information back to its creator after exploiting
some vulnerability in the firewall [23].
15

At the University of Wisconsin, a technique is being developed to
characterize important classes of anomalies rapidly and accurately. [24]. A similar
technique is being developed by the AT&T Center for Internet Research at ICSI.
This technique provides intrusion detection systems with the ability to detect a
skilled hacker attempting to exploit ambiguities in the traffic stream to evade
detection. Hacker detection is accomplished by placing an appliance called a
normalizer directly in the path of traffic going into a network. As traffic flows
through the appliance, it removes evasion opportunities by modifying the packet
stream to eliminate potential ambiguities before the traffic is seen by the intrusion
detection system [25].
There are a number of tools and techniques available to security analysts
today that have solved problems which go beyond the capabilities of firewalls and
network intrusion detection systems. Nevertheless, these new techniques, referred
to as countermeasures, all have one thing in common; they are reactive and not
proactive. A reactive countermeasure is one that does not take any action until after
an attack is in progress, for example, an intrusion detection system. A proactive
countermeasure is one that takes steps to prevent the attack from occurring in the
first place. A successful countermeasure would substantially delay the attacker
while giving the defender enough information about his enemy to prevent the
attack from causing damage [11] [19].Alternatively, detecting attack precursors can
lead to preventative measures that may be much more effective.
16

Forescout Technologies has developed a relatively new type of network
defense that augments existing countermeasures by attempting to determine (and
react to) malicious intent [18]. Their tool, Active Scout, leverages the fact that
nearly every attack is preceded by network reconnaissance [20] [29]. The tool
identifies apparent network reconnaissance activity, and supplies a suspected
attacker with false information. If the attacker attempts to use the supplied
information, Active Scout concludes that the intent is malicious. Further traffic
from that particular source (or perhaps subnet) can be blocked, and an attack may
thus be preempted making this tool an effective proactive countermeasure. Instead
of reacting after an attack occurs, Active Scout takes the necessary steps to stop an
attack before it affects the network.
Hackers who want to target a particular network follow a consistent pattern.
To launch a directed attack they need knowledge about a network’s resources [20].
Thus, network reconnaissance is an integral and essential part of any directed
attack. Launching a successful attack requires information about the target’s
network topology, accessible network services, software versions, valid
user/password credentials and any other exploitable information. The tools and
methods hackers use increase in sophistication almost everyday. In addition to an
increase in sophistication, tools have become easier to use and increasingly
available through the Internet.
17

Although solutions such as ActiveScout have been developed and many
more are on their way, exploits and attack methods are emerging at a much faster
pace, rendering these solutions obsolete almost immediately. Therefore, not only is
it imperative that the development and maintenance of countermeasures continue to
evolve, it is equally important for security professionals to understand how to use
available tools such as protocol analyzers to interpret network traffic and be able to
identify possible anomalies that can lead to an attack [26] [27] [28] [29]. In
Chapters 3 and 4 we cover various tools and techniques hackers use to gather
intelligence on networks, and tools and techniques security analysts can use to
counter them.
18

2.2 Network Traffic Analysis Fundamentals
The ability to accurately read and interpret network traffic demands an
understanding of how network protocols work (especially the TCP/IP protocol) and
how to read network traffic using available analysis tools [Appendix B] [80]. We
summarize the necessary background information in this section, which is
organized as follows,
- Brief TCP/IP Overview
- TCP/IP Security Flaws
- Network Capture Field Identification
Brief TCP/IP overview
The acronym TCP/IP is commonly used to describe an entire suite of
protocols, including the Internet Protocol (IP); Transmission Control Protocol
(TCP); User Datagram Protocol (UDP); Internet Control Message Protocol
(ICMP); Address Resolution Protocol (ARP) and Reverse ARP. For the purpose of
this paper, only the TCP and IP protocols are covered. For an in-depth explanation
of these two protocols and their header fields refer to Appendix B and [54].
TCP and IP were developed by a Department of Defense (DOD) research
project in the early 1980’s to connect a number of different networks designed by
different vendors into a network of networks, known today as the “Internet” [41]
[42]. These protocols have succeeded because they deliver a few basic services that
everyone needs across a very large number of client and server systems. Several
19

systems in a small organization can use TCP/IP on a single LAN. The IP
component provides routing from the department to the enterprise network, then to
regional networks, and finally to the global Internet.
Under TCP/IP, data transmission is accomplished by packaging the data in
what is referred to as a packet [42]. One can think of a packet as consisting of
nested envelopes – each with its own header and contents. An envelope contains
the sender’s (source) address, destination address, and payload (the letter) to be
delivered. The payload may include additional nested envelopes. A packet contains
a payload (letter contents), source IP (sender’s) address, and destination IP
address., The following diagrams show the delivery process of a letter compared to
that of a data packet;
Figure 2.1: Delivery of Package/Letter
1. Letter is created by sender.
20

2. Post office determines the route of the letter.
3. The letter is transported to the next post office station.
4. Post office determines the route of the letter.
5. Letter is delivered.
A packet gets delivered as follows,
Figure 2.2: Delivery of a Data Packet
1. Packet gets created goes though the encapsulation process and gets
created
2. The router determines route of packet based on destination address
21
3. The packet gets transported through the Internet
4. The router determines route of packet based on destination address
5. Packet gets delivered
For further information please refer to [41].
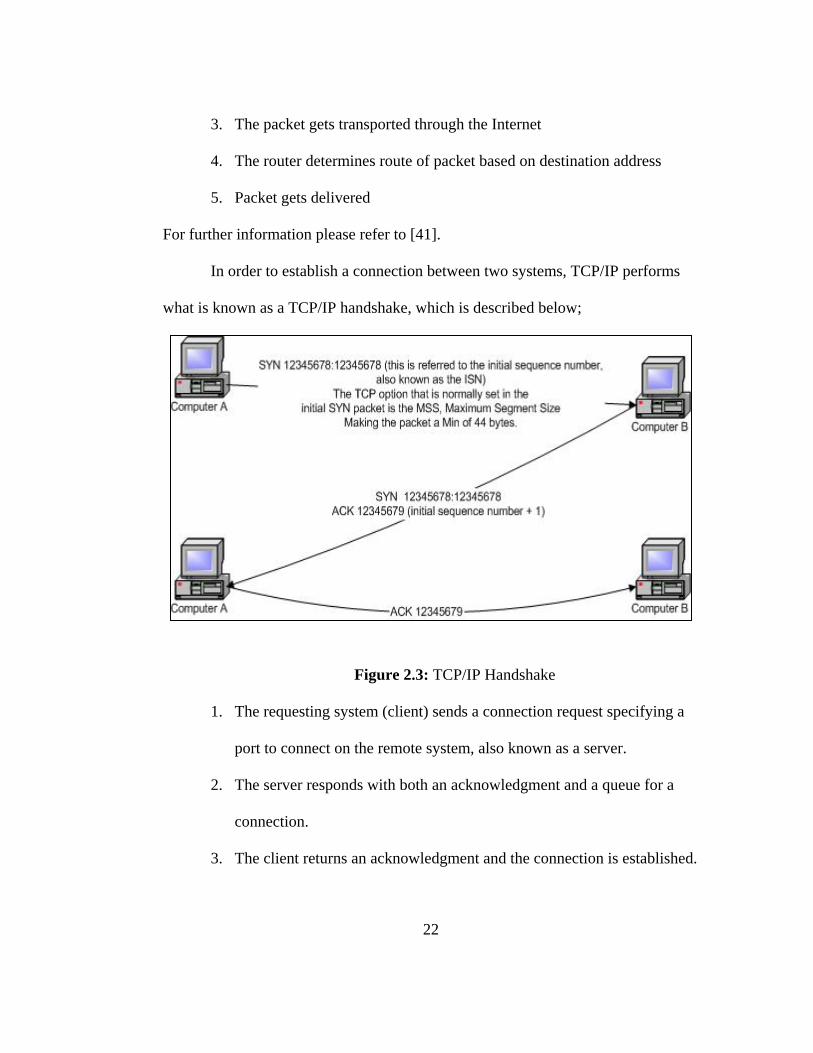
In order to establish a connection between two systems, TCP/IP performs
what is known as a TCP/IP handshake, which is described below;
Figure 2.3: TCP/IP Handshake
1. The requesting system (client) sends a connection request specifying a
port to connect on the remote system, also known as a server.
2. The server responds with both an acknowledgment and a queue for a
connection.
3. The client returns an acknowledgment and the connection is established.
22

Security was not part of the design process for the TCP/IP communication
mechanism. As mentioned earlier, TCP/IP was designed to facilitate
communication between institutions collaborating in research, not to prevent
misuse. In the following section we take a look at some of the outcomes due to this
lack of security.
TCP/IP Security Flaws
Although the envelope analogy used earlier to describe TCP/IP is rather
elementary, TCP/IP protocols are complex. This complexity introduces
vulnerabilities that can be (and are) exploited. To detect and defend against attacks
that exploit protocol vulnerabilities, we must have a detailed understanding of how
the protocols work. Only then are we able to identify network traffic with malicious
intent, and reduce the probability of attacks.
In 1989, Steven M. Bellovin, an AT & T Bell Laboratories researcher
pointed out several security holes in the TCP/IP protocol suite [43]. This lack of
security in the TCP/IP protocol suite has become a serious problem. The
widespread use and availability of the TCP/IP protocol suite has exposed its
weaknesses. To provide an idea of what we are up against, a number of well-known
vulnerabilities are presented for TCP/IP and some protocols commonly used along
with TCP/IP (such as DNS) [43] [44] [45] [46] [47].
23
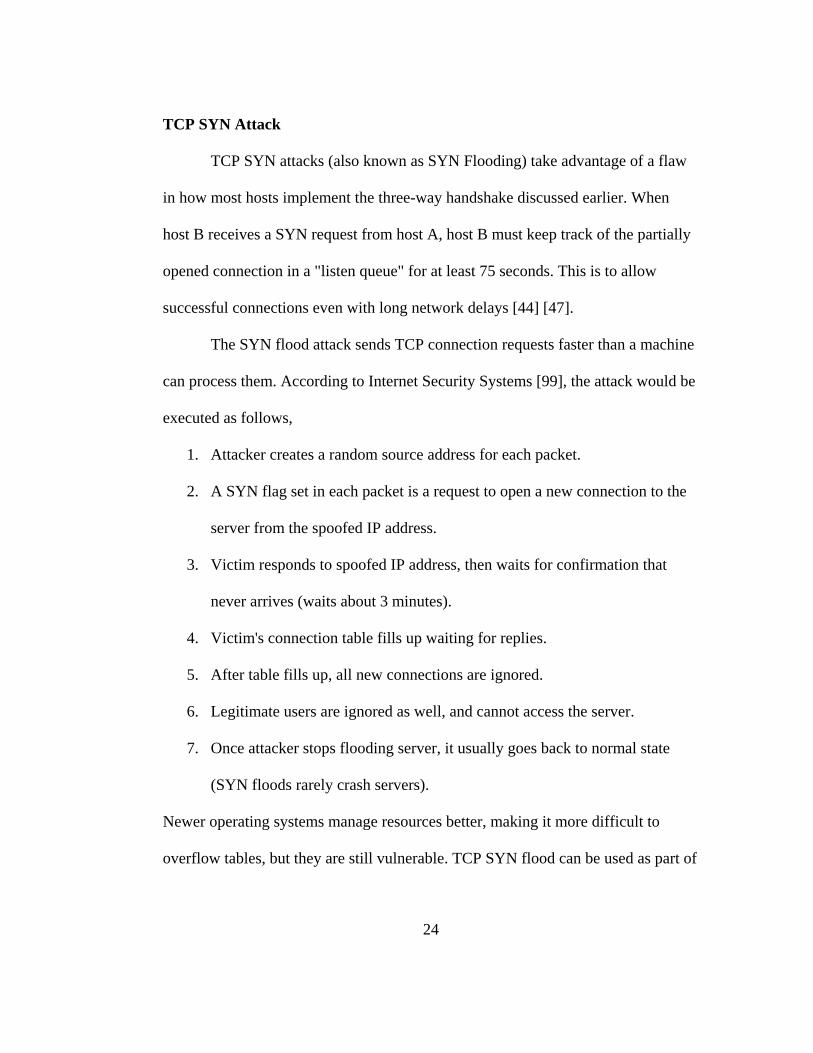
TCP SYN Attack
TCP SYN attacks (also known as SYN Flooding) take advantage of a flaw
in how most hosts implement the three-way handshake discussed earlier. When
host B receives a SYN request from host A, host B must keep track of the partially
opened connection in a "listen queue" for at least 75 seconds. This is to allow
successful connections even with long network delays [44] [47].
The SYN flood attack sends TCP connection requests faster than a machine
can process them. According to Internet Security Systems [99], the attack would be
executed as follows,
1. Attacker creates a random source address for each packet.
2. A SYN flag set in each packet is a request to open a new connection to the
server from the spoofed IP address.
3. Victim responds to spoofed IP address, then waits for confirmation that
never arrives (waits about 3 minutes).
4. Victim's connection table fills up waiting for replies.
5. After table fills up, all new connections are ignored.
6. Legitimate users are ignored as well, and cannot access the server.
7. Once attacker stops flooding server, it usually goes back to normal state
(SYN floods rarely crash servers).
Newer operating systems manage resources better, making it more difficult to
overflow tables, but they are still vulnerable. TCP SYN flood can be used as part of
24

other attacks, such as disabling one side of a connection in TCP hijacking, or by
preventing authentication or logging between servers.
The RSA technique mentioned earlier, Client Puzzles, is supposed to resolve
the TCP SYN flood DoS attack problem. This technique can be classified as both
defensive and offensive in response to this well-known class of DoS attack [14]
[35]. The server sends each client that requests a connection a unique client puzzle
based upon time, server secret, and client request information. In order to receive
the requested service, a client must submit a correct solution to the puzzle to the
server within a time-out period [10].
IP Spoofing Attack
In IP Spoofing, an attacker uses a forged IP address and the victim accepts
this address without verification [44] [47] [49]. There are two types of IP Spoofing,
Blind IP Spoofing and Non-Blind IP Spoofing. Blind IP Spoofing is when the
sequence numbers of a TCP connection are predicted and sent to an unsuspecting
host in order to establish a connection which appears as if it came from the
originating host. Prediction of the sequence numbers is necessary because the
attacker is unable to sniff the traffic. Robert T. Morris was first to notice that
security of a TCP/IP connection rested in the sequence numbers and that it was
possible to predict them. Non-Blind IP Spoofing has the same effect as Blind IP
Spoofing; however, instead of predicting the sequence numbers an attacker has
25

access to the network and is able to sniff traffic between the two systems [43] [46]
[49] [52] [53] [58] [62].
IP Spoofing allows hackers to perform what is known as a man-in-the-
middle attack. For example, as illustrated in Figure 2.4, suppose that John is a
hacker, and Warren and Tom are valid users, as shown in [95]. To spoof, John
takes the following steps:
1. John connects to Warren's computer over an open port to view the Initial
Sequence Numbers (ISNs) on Warren's computer and to analyze how they
are changing.
2. With the ISN information, John performs a DoS attack against Warren to
shut down Warren's session.
3. John then sends a message to Tom using Warren's address.
4. Tom responds to Warren with the second part of the three-way handshake.
5. John simulates Warren by sending the last part of the three-way handshake
with the acknowledgement (ACK) and the incremented ISNs discovered
earlier.
6. IP spoof is completed.
26
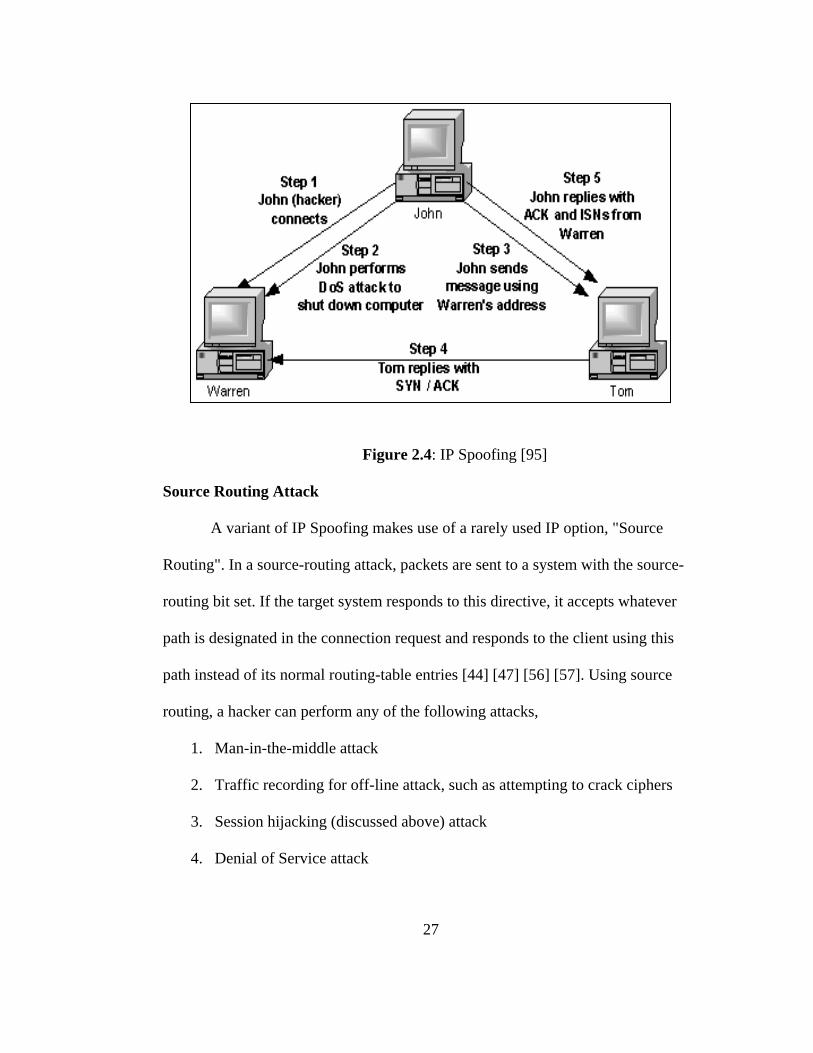
Figure 2.4: IP Spoofing [95]
Source Routing Attack
A variant of IP Spoofing makes use of a rarely used IP option, "Source
Routing". In a source-routing attack, packets are sent to a system with the source-
routing bit set. If the target system responds to this directive, it accepts whatever
path is designated in the connection request and responds to the client using this
path instead of its normal routing-table entries [44] [47] [56] [57]. Using source
routing, a hacker can perform any of the following attacks,
1. Man-in-the-middle attack
2. Traffic recording for off-line attack, such as attempting to crack ciphers
3. Session hijacking (discussed above) attack
4. Denial of Service attack
27
RIP Attack
Initially built to distribute routing information that facilitates flexible and
efficient routing, Routing Information Protocol (RIP) is easily abused. RIP attacks
provide the foundation for a form of connection hijacking or denial of service. RIP
is probably the most widely used of all the Internet interior routing protocols. It was
added to the Internet suite of protocols when LANs first appeared in the early
1980s [59] [60].
There are currently two versions of RIP,
1. RIPv1 –has no authentication as to whether the route information that it
provides is correct or from a reputable source.
2. RIPv2 – has a rudimentary form of authentication allowing a clear text
password that can be sniffed.
By using RIP to redirect a route, a hacker can "steal" any number of connections or
cause a denial-of-service attack. A hacker would execute a RIP attack as follows:
1. Identify the RIP router by scanning UDP port 520.
2. Determine the routing table:
a. If hacker has local access to the same physical segment that the
router is on, he/she will sniff the traffic for RIP broadcasts that
advertise route entries in the case of an active RIP router. If the
router is inactive, an attacker requests the routes to be sent out.
28
b. If the hacker doesn’t have local access to the same physical
segment that the router is on, he/she can use programs such as
RPROBE [161] to extract the routes from the remote router.
3. Determine the best course of attack. For example, if a hacker wanted to
redirect traffic to a particular system so it can be analyzed to gather
some sensitive information (like passwords) the attack would proceed as
follows [96] [97] [98] [100],
a. Add a route to the RIP router that would initiate a redirect of
routes to a system owned by the attacker, which is done by
Spoofing a RIPv1 or RIPv2 packet using a tool called SRIP.
b. At this point all traffic destined to the RIP router will now be
redirected for further forwarding through the attacker’s system.
Before any forwarding can take place, however, the attacker will
use either a tool called FRAGROUTER or kernel-level IP
forwarding to send traffic off normally.
c. Sniff traffic for usernames and passwords.
TCP Session hijacking attack
TCP hijacking is the spoofing of TCP packets in order to disconnect a
system from a TCP connection. This can be done easily in a couple of ways due to
the inherent flaws of TCP protocol. TCP hijacking takes advantage of the way
29
packets are sequenced. By closing a connection that is not fully established and
then starting another or by inserting innocuous packets into the communications
and pushing the sequence numbers beyond the acceptable range, the attacker leaves
the target and the third system unable to communicate, while retaining proper
communications with the target [52] [53] [61] [62].
In order for a TCP/IP session hijack to be successful, the victim must be
using a non-encrypted TCP/IP utility such as telnet, rlogin or ftp. The use of a
SecurID card, for example, or other token-based second factor authentication is
useless for protection against hijacking [98]. All the attacker has to do is simply
wait until after the user authenticates, then hijack the session. A TCP session hijack
involves 3 systems [98],
1. Attacker - the system used by the attacker for the hijack
2. Victim - the system used to make a connection to the target system
3. The target - the system the attacker wants to compromise
30
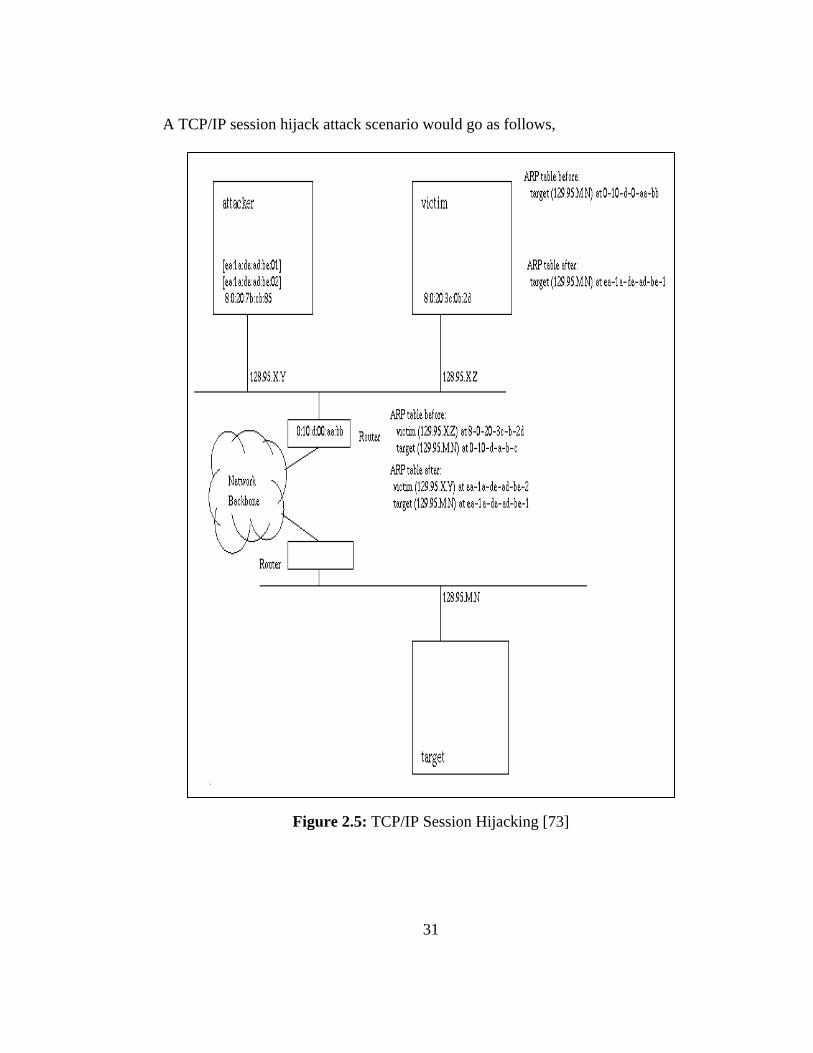
A TCP/IP session hijack attack scenario would go as follows,
Figure 2.5: TCP/IP Session Hijacking [73]
31

1. The attacker spends some time determining IP addresses of target and
victim systems.
2. Attacker runs a program called HUNT as root on attacking host [63] and
waits for it to indicate a session has been detected.
3. Victim logs in to target using telnet.
4. Attacker sees new connection; lists active connections to see if this one
is potentially "interesting.", decides to hijack.
5. Victim no longer has access to the target system.
6. Attacker starts a new session with target host and installs a backdoor.
7. Attacker now has complete control over the target even after the victim
reboots the target system.
TCP Connection Reset Attack
The primary idea behind a TCP reset attack is to terminate an established
TCP connection maliciously. Applications and protocols that require lengthy
sustained connections are most vulnerable to this attack [51] [56] [64] [65].
According to Tim Newsham [62], if a sequence number within the receive
window is known, an attacker can inject data into the session stream or terminate
the connection. If the ISN value is known and number of bytes already sent is
known, an attacker can send a simple packet to inject data or kill the session. If
these values are not known exactly, but an attacker can guess a suitable range of
32

values, he can send out a number of packets with different sequence numbers in the
range until one is accepted. The attacker doesn’t need to send a packet for every
sequence number, but can send packets with the sequence numbers separated by no
more than a window size. If the appropriate range of sequence numbers is covered,
one of these packets will be accepted. The total number of packets that needs to be
sent is then given by the range to be covered divided by the fraction of the window
size that is used as an increment.
ICMP Attack
Internet Control Message Protocol (ICMP), is an integral part of any IP
implementation. Goals and features as outlined in RFC 792 are to provide a means
to send error messages for non-transient error conditions, and to provide a way to
probe the network in order to determine general characteristics about the network.
These same features are currently being used by attackers to perform network
reconnaissance for determining which exploits can be used against it. Xprobe2 ,
developed by Ofir Arkin, is one of the most complete ICMP scanners available [68]
[69] [70] [71] [72]. This comprehensive tool is discussed in Chapters 3 and 4.
In addition to its network reconnaissance properties, ICMP has also been
used to develop several DoS attacks. Two well-known ICMP type DoS attacks are
Smurf and Fraggle. In a Smurf attack, the hacker sends a large number of ICMP
echo request packets to the broadcast address of a particular network. The IP
33

packets have spoofed source addresses - the address of the targeted machine. In
this way, hundreds of echo replies may be sent to the target. This attack involves
three systems; an attacker, an amplifying network and a victim. The attack is
executed by an attacker sending a spoofed ICMP echo request to the broadcast
address of the amplifying network. The source address of the packet is forged to
make it appear as if the victim initiated the request. Because this request was sent
to the network’s broadcast address, all systems on the amplifying network respond
to the victim. This amplified response renders the victim connectionless for the
duration of the attack. The effectiveness of this attack depends on the number of
systems on the network. The Fraggle attack does the same thing as a Smurf attack,
except that it uses UDP packets [67].
DNS Attack
Domain Name System (DNS), is the application that locates Internet
domain names and translates them into IP addresses. A domain name is a
meaningful and easy-to-remember "handle" for an Internet address. Clients and
servers are configured to trust the information provided by a DNS server. DNS can
normally be trusted; however, on some implementations it is possible to load the
DNS cache with misleading or invalid entries. These entries are then used instead
of valid entries provided by the server. Of course the DNS server should ignore any
information that it hasn’t specifically requested, but the DNS protocol doesn’t have
34

any security to prevent this. This is why intruders have been able to use naming
servers to execute packet flooding denial of service attacks. There are many other
attacks which use DNS, but they go beyond the scope of this paper. For further
information see [74] [75] [76] [77] [78].
Network capture field identification
In this thesis we use the most common traffic analysis tool used today;
Tcpdump. A number of tools have been developed using Tcpdump as their
foundation, such as ETHEREAL [36], SNORT (which doubles as an intrusion
detection system and a sniffer) [37] and SHADOW, an intrusion detection system
developed by the Naval Surface Warfare Center [38].
Tcpdump was created by the Network Research Group at Lawrence
Berkeley National Lab [12]. It offers various options that enable the user to display
or save network traffic with various levels of verbosity. The following Tcpdump
capture represents an http packet;
00:49:55.884455 10.0.0.100.80 > 10.0.0.200.4156: S [tcp sum ok] 584753221:584753221(0) ack 3121073003 win 1460 <mss 1460,nop,nop,sackOK> (DF) (ttl 108, id 32064, len 48)
Figure 2.6: Tcpdump capture of http packet
Each field represents the following;
35

00:49:55.884455 Time of capture
10.0.0.100.80 Source IP.[Source port]
> Traffic direction
10.0.0.200.4156 Destination IP.[Destination Port ]
S SYN Flag set
[tcp sum ok] Checksum validility
584753221:584753221(0) Sequence Number (Bytes in packet)
Ack 3121073003 ACK number
win 1460 Window size
<mss 1460,nop,nop,sackOK> Options
(DF) Don’t Fragment
(ttl 108, id 32064, len 48) Time to Live, Packet ID, Packet length
Table 2.3 Traffic Dump field descriptions
Tcpdump is covered further in chapter 4. More information on field definitions
please refer to Appendix B.
36
2.3 Network reconnaissance Overview
Detecting network reconnaissance accurately and promptly is a delicate and
daunting task. Trying to identify packets that do not follow the rules set forth by
protocols corresponding to Request for Comments (RFC) is very difficult. An even
greater task is identifying properly formatted packets with malicious intent. For the
rest of this section we provide some of the basic fundamentals needed to
understand network reconnaissance and be able to identify the anomalies that can
lead to detection of such activity.
An RFC is a set of specifications which developers must use when
implementing a network protocol (e.g. The specification for TCP is RFC793).
Some RFCs have design flaws that allow hackers to develop tools without breaking
any of the rules defined in the protocol’s RFC. The design flaws provide a
camouflage that allows hackers to perform network reconnaissance without being
detected. Furthermore, many of the flaws are with required functions that a protocol
must execute in order to establish communication. For example, tools called
scanners have been developed to take advantage of the TCP/IP handshake. Notice
that in the description of TCP/IP handshake mentioned in Section 2.2, there is no
authentication mechanism in place to verify that the requesting client is allowed to
connect to the server. Scanners are designed to scan target systems for open ports,
available services and even vulnerabilities.
37

As mentioned earlier, ICMP contains some inherit implementation
problems [72]. There are tools, which will be discussed in Chapter3, that use the
ICMP protocol to fingerprint almost any device on a network. Some tools can
produce fingerprints by sending different types of ICMP packets to the target and
matching the responses to a pre-determined set of signatures. Because the TCP/IP
protocol stack has been implemented in many different ways, every operating
system has a unique fingerprint. This unique fingerprint provides an attacker with
the information needed to execute other attacks.
There are protocols, such as address resolution protocol (ARP) that allow
information to be given to whoever requests it and allow dynamic modification of
critical data. The operating system maintains a local table that provides a mapping
of MAC addresses to their corresponding IP addresses for communicating with
systems within a local net. Three tools developed to scan and/or modify ARP tables
are Arpscanner, Ettercap and Dsniff [Appendix A]. Arpscanner generates a
significant amount of traffic when scanning a subnet to build a list of MAC and IP
addresses. The output from Arpscanner appears as follows:
10.0.0.100 is at 00:0d:61:02:b5:3a 10.0.0.253 is at 00:01:02:9a:be:6b 10.0.1.20 is at 00:01:80:2b:71:2d 10.0.1.22 is at 00:01:02:9a:be:70
Figure 2.7: Arpscanner output
38
Armed with this information, the hacker now knows the organization’s IP structure
and which IP addresses are in use (or at least should be in use). Ettercap and Dsniff
take the capabilities of Arpscanner to a higher level. In addition to scanning ARP
tables, they also have sniffing capabilities and use a technique called ARP
poisoning. ARP poisoning is when an attacker replaces all the MAC address entries
on a target machine’s ARP table with addresses of his/her systems - essentially
executing a man-in-the-middle attack.
The number of security flaws found within protocols is astounding, not to
mention flaws found in software and hardware that use these protocols to
communicate with other devices [56] [62] [64] [65] [66] [75]. However, there is
light at the end of the tunnel. Since the hackers need the gathered information, the
source address can not be faked when performing a reconnaissance; therefore, the
traffic is traceable. There are a number of things a hacker can do to cover his tracks,
like performing scans from multiple hops (aka: nodes), but nonetheless it is still
traceable, as we will demonstrate in Chapter 5.
39
Chapter 3
Black Box Network Traffic Analysis: the Hacker’s Perspective
Black box is a term used in software development that refers to a testing
method in which the tester has no knowledge of the inner workings of the program
being tested. Keeping that basic concept in mind, when a hacker performs a
reconnaissance on a network, he or she knows nothing about the network. For all
practical purposes, we consider network reconnaissance a sort of black box
approach to network analysis, hence the hacker’s perspective.
Network Reconnaissance
Reconnaissance, according to Merriam-Webster, is a preliminary survey to
gain information or an exploratory military survey of enemy territory. Network
reconnaissance however, is the inspection and exploratory survey of a series of
nodes interconnected by communication paths, also referred to as a Network. Like
a soldier, before an attack is carried out, a hacker studies his target to learn as much
as he can about the defenses and weaknesses [27] [28] [29] [30] [31] [33]. In
addition to using specific tools to obtain the information they need to complete a
reconnaissance, hackers also use what is known as social engineering. Although
social engineering is beyond the scope of this thesis, it is certainly a topic worth
mentioning. Social engineering is to people what hacking is to computer systems
40
and networks; it is the art of getting people to do things they wouldn’t ordinarily do
for a stranger [79].
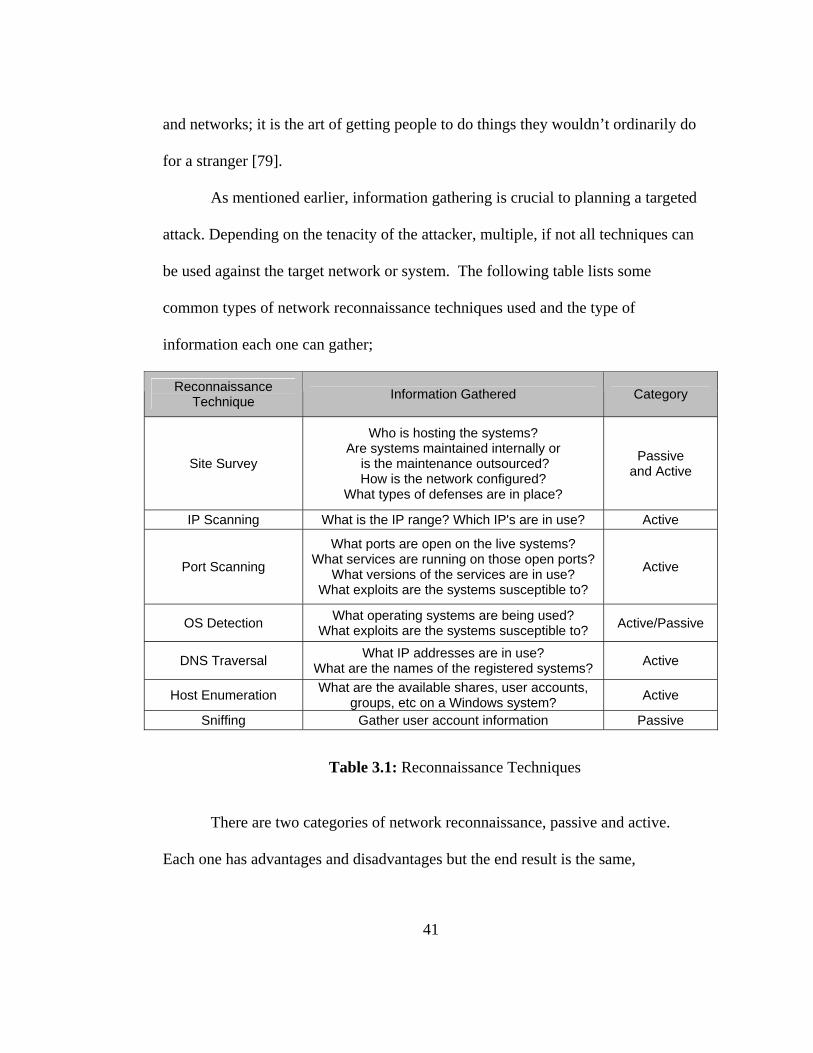
As mentioned earlier, information gathering is crucial to planning a targeted
attack. Depending on the tenacity of the attacker, multiple, if not all techniques can
be used against the target network or system. The following table lists some
common types of network reconnaissance techniques used and the type of
information each one can gather;
Reconnaissance Technique Information Gathered Category
Site Survey
Who is hosting the systems? Are systems maintained internally or
is the maintenance outsourced? How is the network configured?
What types of defenses are in place?
Passive and Active
IP Scanning What is the IP range? Which IP's are in use? Active
Port Scanning
What ports are open on the live systems? What services are running on those open ports?
What versions of the services are in use? What exploits are the systems susceptible to?
Active
OS Detection What operating systems are being used? What exploits are the systems susceptible to? Active/Passive
DNS Traversal What IP addresses are in use? What are the names of the registered systems? Active
Host Enumeration What are the available shares, user accounts, groups, etc on a Windows system? Active
Sniffing Gather user account information Passive
Table 3.1: Reconnaissance Techniques
There are two categories of network reconnaissance, passive and active.
Each one has advantages and disadvantages but the end result is the same,
41

information gathering. The numbers of tools readily available on the Internet that
allow hackers to perform these reconnaissance techniques with very little effort are
astounding. Some of the tools do not even need to be installed to a local system in
order to be used. Also, much of the initial information on a company’s
infrastructure can be obtained by searching publicly available databases and
websites. Most of the tools and methods used by hackers can also be used by
security analysts to harden their network security.
In this chapter we analyze each reconnaissance technique listed in Table
3.1, the tools used, and the information each tool generates. This chapter is
organized as follows;
• Passive Reconnaissance
o Definition
o Scenario Part 1: Site Survey
1. Tools and Techniques
• Active Reconnaissance
o Definition
o Scenario Part 2: Filling in the Gaps
1. DNS Traversal
2. IP Scanning/Host Enumeration
3. Port Scanning
4. OS Detection
42

5. Sniffing
• Summary
3.1 Passive Network Reconnaissance
Passive Network Reconnaissance is the method by which an attacker
obtains information on a network without generating suspicious traffic [81]. There
are two ways to accomplish this; the first is by using public databases, services and
tools readily available on the Internet. The second is using a program, called a
sniffer which displays network traffic in real time. Sniffing, however, requires
administrative access to the network, which means that a hacker would have to
compromise a system within the network and gain administrative access to the
main switch or router for this technique to be of any use. Sniffing traffic, however,
is usually more of an insider threat than an external one.
Publicly available databases, or database like systems (such as DNS
servers), provide a lot of the fundamental information about an organization and its
network. Acquiring this information is as simple as querying these public systems
with tools such as WHOIS, NSLOOKUP, HOST or DIG, which are available
throughout the Internet and are packaged with many of today’s operating systems.
Table 3.2 lists some of the information that can be obtained using passive
reconnaissance. Tables 3.3 and 3.4 show some of the organizations and
independent websites that provide information and tools needed for performing a
passive reconnaissance. The independent websites do come and go, those listed in
43

Table 3.3 were still active as of June 16, 2004 [83] [84] [85] [86] [87] [88] [89]
[90] [91] [92] [93]. The sites listed in Table 3.3 represent a small sample of what is
readily available on the Internet. This list illustrates how easy it is to gain access to
reconnaissance tools without having to download and install any programs to a
local system. Some of the tools listed fall under active reconnaissance and will be
discussed later in this chapter.
In addition to the information that can be obtained using public databases,
an Internet search engine, such as Google, can prove to be a priceless tool. Some
companies have poor data management and network configuration practices,
resulting in the advertisement of proprietary company information. Many
companies have adverted financial documents, secret information, personal
information such as social security numbers and much more [124].
To illustrate the simplicity of passive reconnaissance we perform a
complete site survey on organization. Since this experiment requires a live
registered network, we decided to use Florida Tech as the target. However, for the
experiments in this chapter we use the isolated network mentioned in Chapter 1.
44

Information obtainable using Public sources
Does the company have a web presence?
What is the assigned IP range?
Who owns the IP range?
Who is hosting the company’s website?
Does the company run a mail server?
What are the DNS servers used?
Are the DNS servers managed in-house or outsourced?
Administrative and technical contact information?
Company Address?
Table 3.2: Information which can be obtained using passive reconnaissance
Site Source Tools Provided
Central Ops [90] Various DNS tools, graphical trace routes,
much more
BlackCode [91] Host Information and Host Connectivity tools adHOC Tools [92] Multiple IP, DNS, and lookup tools
Analog [93] DNS lookup tool
Table 3.3: Websites containing Reconnaissance tools
45
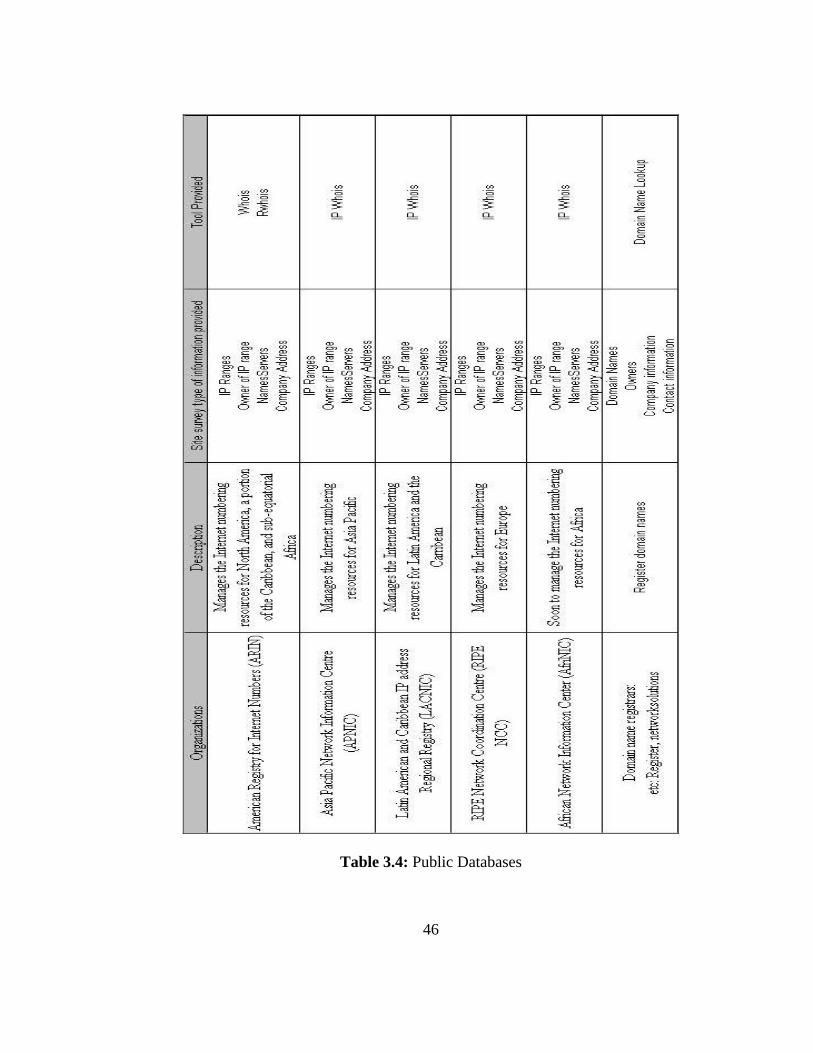
Table 3.4: Public Databases
46
Scenario Part 1: Site survey of Florida Tech’s Network
Now that the methods and tools have been identified, we demonstrate how
simple it is for a hacker to obtain information on an organization’s network using
public databases and web-based tools. The first step that a hacker could take is to
determine if the target has a web presence. This can easily be done by using
NSLOOKUP, HOST or DIG to perform a DNS query on the target, which in this
case is www.fit.edu. If this technique fails, the hacker can use two other techniques,
1. Perform a WHOIS query using one of the domain registrars or one of
the websites which provide the WHOIS service, see Table 3.4.
2. Use Google to search for the company name. This could result in
multiple hits, so it is usually the most time consuming. However, as
mentioned earlier, it can also provide a gold mine of information.
NSLOOKUP is the most common tool used to query DNS servers for
forward and reverse look-ups, and it is native to the Windows, UNIX and Linux
operating systems. DIG and HOST are tools more commonly found in Linux
operating systems. However, as mentioned earlier, web-based versions of these
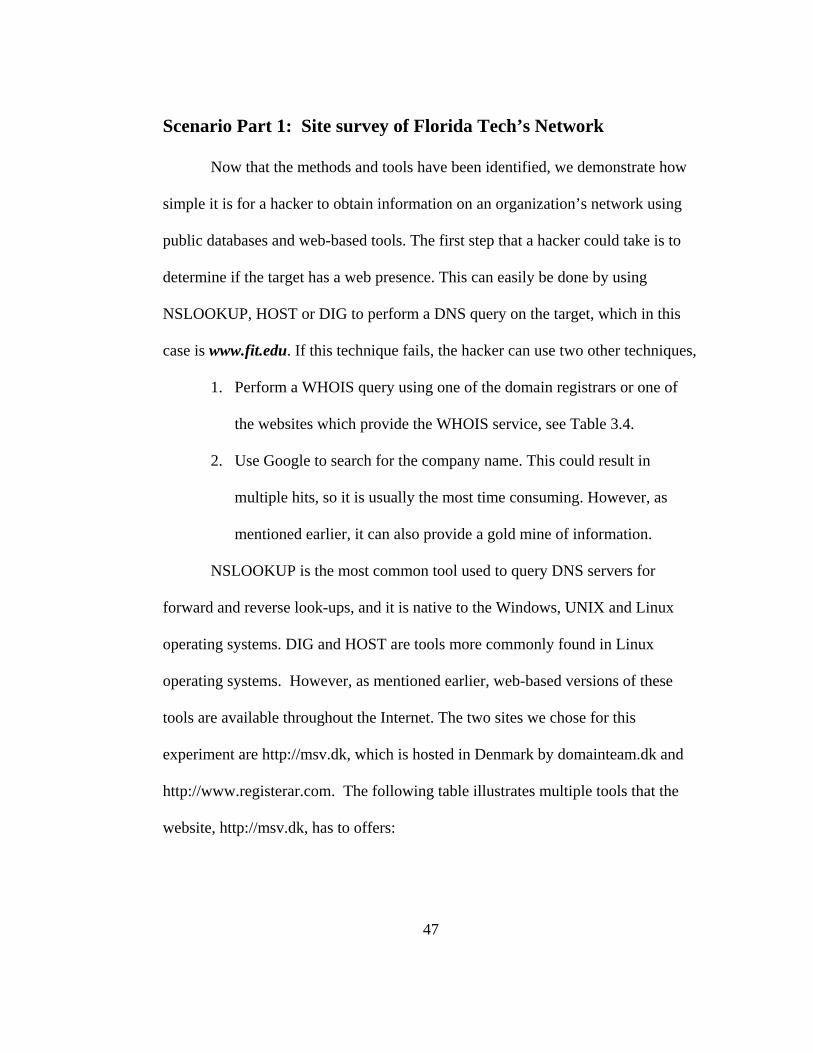
tools are available throughout the Internet. The two sites we chose for this
experiment are http://msv.dk, which is hosted in Denmark by domainteam.dk and
http://www.registerar.com. The following table illustrates multiple tools that the
website, http://msv.dk, has to offers:
47
MSV.DK IP Tools Whois .dk
Whois .com Whois IP
IP <-> Hostname DNS Investigate Visual Tracert
Ping Port Scanner
Http Header Reveal E-mail Validate
Connection Speed Type of Browser
Send E-mail Open Mail Relay
Check
Table 3.5: Tools available at http://msv.dk
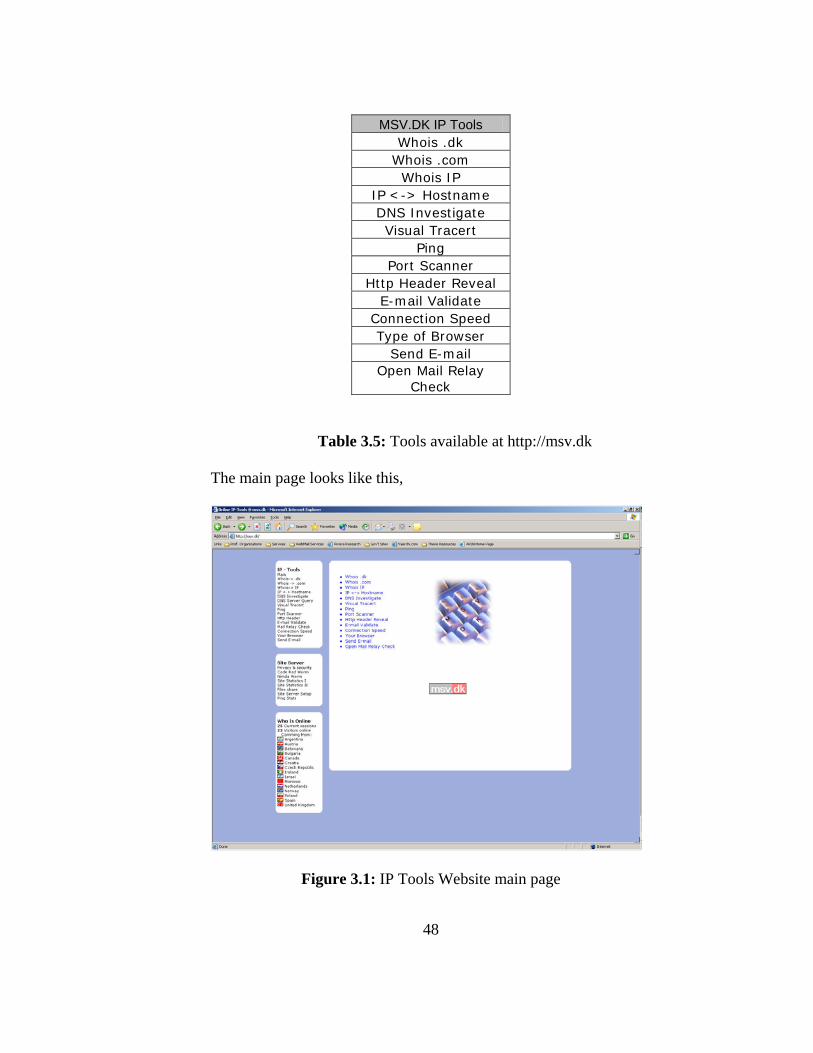
The main page looks like this,
Figure 3.1: IP Tools Website main page
48

After just a few searches we were able to find answers to all the questions in
Table 3.2 as follows:
Information obtained by Public sources Answer Info Tool Used
Does the company have web presence? Yes www.fit.edu nslookup
Does the company operate their own webserver? If so
what kind? Yes
Server: Apache
IP appears to be in designated IP range
Http Header Reveal
IP range 63.18.0.0 to 63.18.255.255 whois
Does the company own the IP range Yes Florida Tech whois
Is the company hosting their own website? Yes Florida Tech whois
Does the company operate their own mail server Yes
mail exchanger = www.fit.edu
www.fit.edu MX preference = 20, mail exchanger =
fit.edu
nslookup
What DNS servers are used Yes ns1.fit.edu/ns2.fit.edu 63.18.1.7/63.18.1.8 Whois/nslookup
Are the DNS servers managed in-house or outsourced Yes Appears to be in-house nslookup/whois
Administrative and technical contact information
Eric T. Kledzik Network Manager
(407) xxx-xxxx
whois
Company Address
Florida Tech 150 West University
Blvd. Melbourne, FL
32901
whois
Table 3.6: Information gathered using Passive Reconnaissance techniques
49

With this information a hacker can take the planned attack a step further and
perform targeted active reconnaissance.
3.2 Active Network Reconnaissance
Active network reconnaissance is the process of collecting information
about an intended target by probing the target network or system [124]. Active
reconnaissance typically involves some, if not all the reconnaissance techniques
mentioned in Table 3.1, i.e.: port scanning, IP scanning, OS fingerprinting etc.
Once the necessary information has been gathered, the main process of exploiting
the system can then be carried out, once a way to access the network or system has
been found. It is imperative to understand these how these techniques are used by
hackers and the information each technique generates, in order to be able to detect
and prevent the reconnaissance from becoming an attack.
Scenario Part 2: Filling in the gaps
We completed a general site survey of the intended target which gave us a
vague idea of the organizations overall infrastructure. We now know the targets
website, IP range, DNS, web server type and mail exchanger. However, there are is
still a lot of unanswered questions, such as;
1 Which IPs are in use? 2 What ports are open on the live systems? 3 What services are running on those open ports? 4 Which operating systems are being used and what versions? 5 What are the names of the registered systems?
Table 3.7: Remaining questions to answer
50

In order to fill in these gaps in our experiment we need to run several tools which
will end up generating traffic that might be detectable. The web-based tools used
earlier generate traffic that looks “normal”. We define normal network traffic as
traffic that does not disturb bandwidth/use thresholds, and does not contain traffic
that misuses network protocols. Bandwidth and use thresholds are highly dependant
on protocols used and network configuration, etc: number of nodes connected to
the network.
There are a number of commercial tools available that can provide the
answers to the questions in Table 3.7. These tools use a technique called auto-
discovery to detect nodes in a network. This technique uses various protocols, such
as the Simple Network Management Protocol (SNMP), TCP, ICMP and generally
are accompanied by a pretty sophisticated graphical user interfaces (GUI).
Although these are commercial tools and generally expensive, it does not mean that
a potential attacker can not obtain them. Some of these tools are shown below in
Table 3.8,
Product Description
3Com Network SupervisorDiscovers and manages up to 1,500 IP
devices AdRem NetCrunch 2.1 Network discovery and mapping
HP Toptools
HP Toptools is a hardware management tool that provides inventory, fault, asset,
performance, and security management of HP devices from anywhere in the network using a
Web browser
Table 3.8: Commercial Auto discovery tools
51

Product Description
Ipswitch WhatsUp Gold
It provides an intelligent network mapping feature while providing a robust monitoring
system for network service levels and applications
NetViz NetViz uses Microsoft LanManager APIs fornetwork discovery
NetworkView
this utility will discover TCP/IP nodes and routes using DNS, SNMP, and ports; get MAC
addresses and NIC manufacturer names; monitor nodes and receive alerts; and
document with printed maps and reports
OptiView Inspector Console
OptiView Inspector Console gives a visibility into the networks by showing the devices and
local sub networks on the network
.
Table 3.8: Commercial Auto discovery tools cont …
Attackers generally choose to either write their own tools or use tools available on
the Internet. Most tools available on the Internet can perform as well, if not better,
than the commercial tools.
To complete the reconnaissance we demonstrate the rest of the
reconnaissance techniques in Table 3.1. Since these tools generate traffic which
will fire up Florida Techs defenses and can cause undesired results in a production
environment, we finish our illustration of these tools and techniques using a portion
of the isolated network mentioned in Chapter 1,
52

Figure 3.2: Isolated Network
Nevertheless, if these techniques were used against the Florida Tech network the
end result would be somewhat the same. The only difference would be the targeted
ip addresses.
DNS Traversal
For simplicity we used a tool we wrote to perform DNS traversal, which is
similar to a zone transfer but without the configuration details required by DNS
servers. A zone transfer is a method used to transfer DNS records from one system
to another. Zone transfers have been known to be used by attackers to gather ip and
53

system information. Network administrators now restrict zone transfers to specific
systems in order to mitigate such reconnaissance tactics. Nevertheless, small “zone
transfers”, called forward and reverse lookups, are performed every day by nodes
accessing websites throughout the Internet. This loop hole in usability is
exploitable by using a recursive lookups; therefore traversing the DNS.
Our tool, called DNS-slurp, is a simple UNIX type shell script which
recursively queries a DNS server for forward and reverse lookups using a
command available with the Linux operation system, called host. In addition, the
number of subnets and hosts to be queried can be specified and the output is
organized in directories by subnet. For example, in our site survey we discovered
that Florida Tech has been allocated an ip range (for reasons mentioned earlier we
will substitute the IP range with that of our isolated network). With DNS-slurp, all
we will need to do is the following,
Figure 3.3: DNS-slurp interface
1) execute the script
2) Enter the 1st octet
3) Enter the 2st octet
54

4) Enter the start of the subnets to slurp. This value would be 0 – 255
5) Enter the end of the subnets to slurp. This value would be 0 - 255
6) Enter the start of the hosts to slurp. This value would be 0 – 255
7) Enter the end of the hosts to slurp. This value would be 0 - 255
The end result is a set of directories with subnets as the names with 2 files in each
directory. One file contains all DNS entries for that subnet and the second contains
all the registered IP addresses for that subnet. For example,
192.168.2.xxx directory name
<subnet>.dnsnames file with DNS names
<subnet>.hostips file with registered IP addresses.
The <subnet>.hostips file can be fed into a program called NMAP, which will be
discussed later. DNS-Slurp accomplishes the following;
1) Obtains all DNS names. Sometimes it is possible to figure out the
purpose of a particular system by their name. Etc: NS1.fit.edu = most
likely is a DNS server.
2) All registered IP addresses are revealed, therefore no IP scanning is
necessary
3) All active subnets are revealed
55
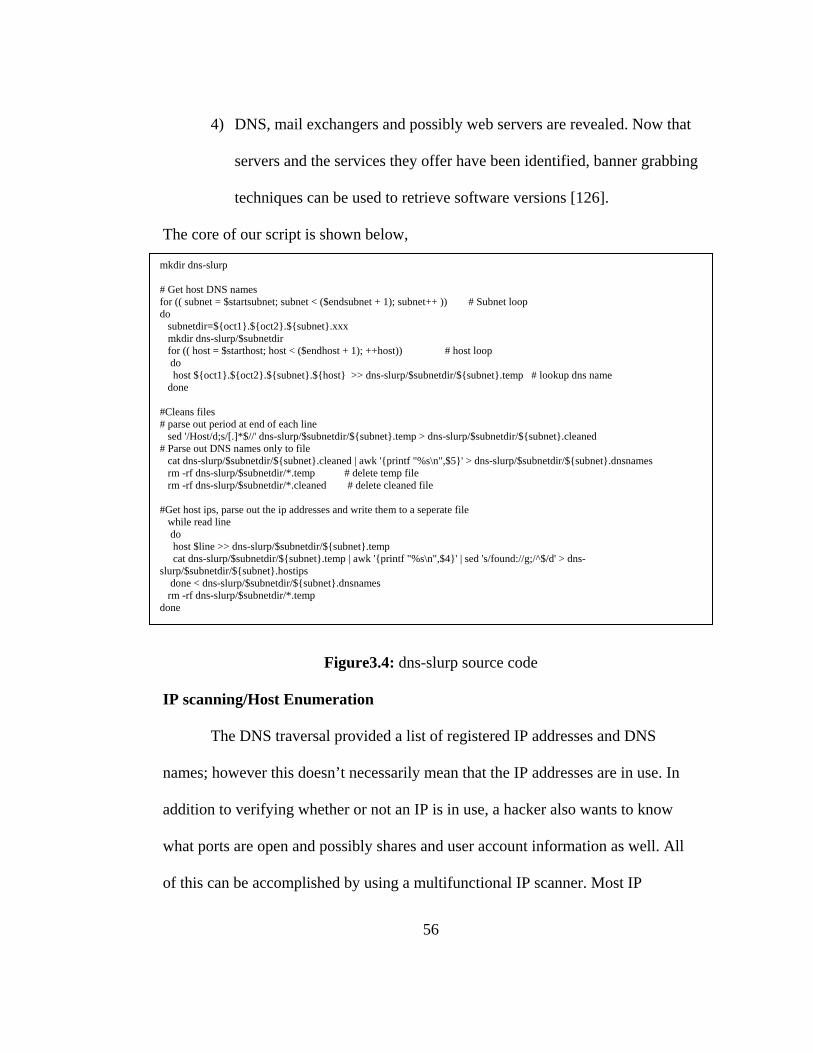
4) DNS, mail exchangers and possibly web servers are revealed. Now that
servers and the services they offer have been identified, banner grabbing
techniques can be used to retrieve software versions [126].
The core of our script is shown below,
mkdir dns-slurp # Get host DNS names for (( subnet = $startsubnet; subnet < ($endsubnet + 1); subnet++ )) # Subnet loop do subnetdir=${oct1}.${oct2}.${subnet}.xxx mkdir dns-slurp/$subnetdir for (( host = $starthost; host < ($endhost + 1); ++host)) # host loop do host ${oct1}.${oct2}.${subnet}.${host} >> dns-slurp/$subnetdir/${subnet}.temp # lookup dns name done #Cleans files # parse out period at end of each line sed '/Host/d;s/[.]*$//' dns-slurp/$subnetdir/${subnet}.temp > dns-slurp/$subnetdir/${subnet}.cleaned # Parse out DNS names only to file cat dns-slurp/$subnetdir/${subnet}.cleaned | awk '{printf "%s\n",$5}' > dns-slurp/$subnetdir/${subnet}.dnsnames rm -rf dns-slurp/$subnetdir/*.temp # delete temp file rm -rf dns-slurp/$subnetdir/*.cleaned # delete cleaned file #Get host ips, parse out the ip addresses and write them to a seperate file while read line do host $line >> dns-slurp/$subnetdir/${subnet}.temp cat dns-slurp/$subnetdir/${subnet}.temp | awk '{printf "%s\n",$4}' | sed 's/found://g;/^$/d' > dns-slurp/$subnetdir/${subnet}.hostips done < dns-slurp/$subnetdir/${subnet}.dnsnames rm -rf dns-slurp/$subnetdir/*.temp done
Figure3.4: dns-slurp source code
IP scanning/Host Enumeration
The DNS traversal provided a list of registered IP addresses and DNS
names; however this doesn’t necessarily mean that the IP addresses are in use. In
addition to verifying whether or not an IP is in use, a hacker also wants to know
what ports are open and possibly shares and user account information as well. All
of this can be accomplished by using a multifunctional IP scanner. Most IP
56
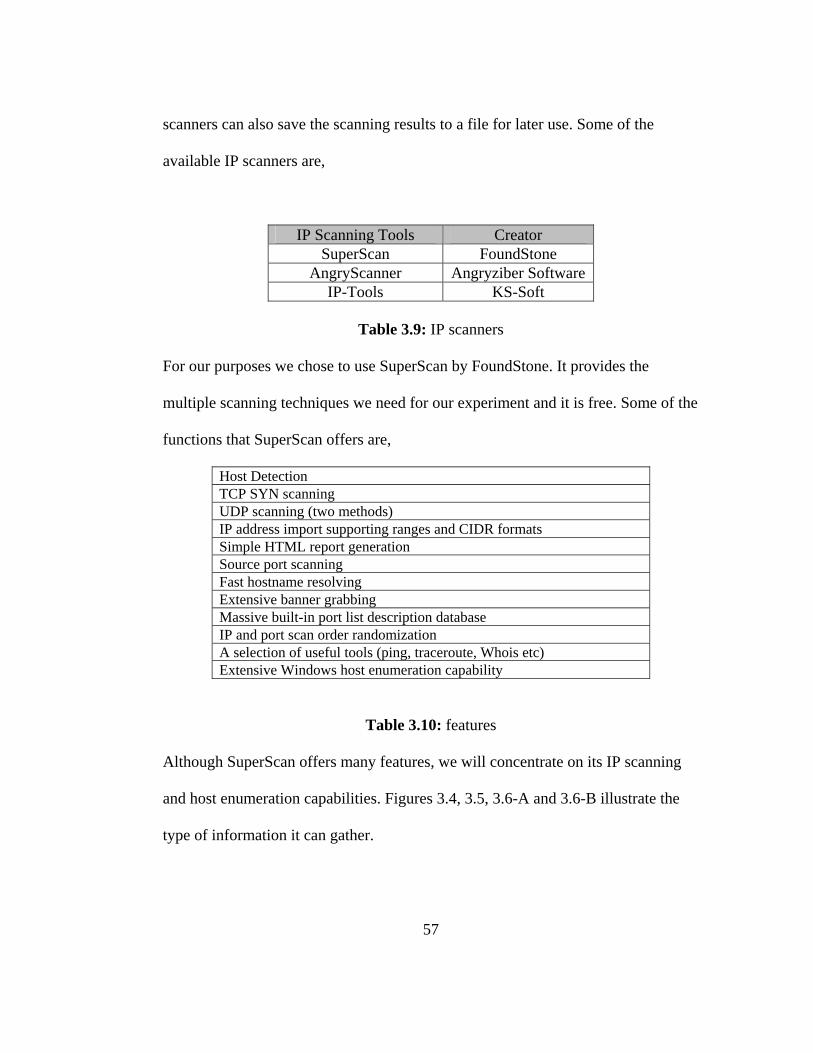
scanners can also save the scanning results to a file for later use. Some of the
available IP scanners are,
IP Scanning Tools Creator SuperScan FoundStone
AngryScanner Angryziber Software IP-Tools KS-Soft
Table 3.9: IP scanners
For our purposes we chose to use SuperScan by FoundStone. It provides the
multiple scanning techniques we need for our experiment and it is free. Some of the
functions that SuperScan offers are,
Host Detection TCP SYN scanning UDP scanning (two methods) IP address import supporting ranges and CIDR formats Simple HTML report generation Source port scanning Fast hostname resolving Extensive banner grabbing Massive built-in port list description database IP and port scan order randomization A selection of useful tools (ping, traceroute, Whois etc) Extensive Windows host enumeration capability
Table 3.10: features
Although SuperScan offers many features, we will concentrate on its IP scanning
and host enumeration capabilities. Figures 3.4, 3.5, 3.6-A and 3.6-B illustrate the
type of information it can gather.
57

Figure 3.4: SuperScan results
58

IP scanning output look like this,
Host
Live hosts this batch: 8 192.168.2.1 Hostname: [Unknown] TCP ports (1) 80 UDP ports (1) 53 192.168.2.2 Hostname: [Unknown] TCP ports (1) 80 UDP ports (1) 69 192.168.2.100 Hostname: [Unknown] TCP ports (11) 25,80,135,139,443,445,1025,1026,3389,5000,8000 UDP ports (2) 123,137 192.168.2.104 Hostname: [Unknown] TCP ports (4) 22,80,111,3306 ______________________________________________ Total live hosts discovered 8 Total open TCP ports 19 Total open UDP ports 2
Figure 3.5: Superscan IP scan and host detection results
enumeration output look like this,
NetBIOS information on 192.168.2.100 6 names in table MINI-SURGE 00 UNIQUE Workstation service name MINI-SURGE 20 UNIQUE Server services name HOMEIP 00 GROUP Workstation service name HOMEIP 1E GROUP Group name HOMEIP 1D UNIQUE Master browser name ____MSBROWSE__ 01 GROUP MAC address 1: 00:02:2D:24:D4:D5 Attempting a NULL session connection on 192.168.2.100 NULL session successful to \\192.168.2.100\IPC$ MAC addresses on 192.168.2.100
Figure 3.6-A: SuperScan Enumeration Results
59

me
the
tha
we
sc
the
loo
11
MAC address 0: 00:00:00:00:00:00 \Device\NetbiosSmb MAC address 1: 00:60:73:EA:DF:48 \Device\NetBT_Tcpip_{1F26F1AB-4A2F-48B7-8264-503D48C03728}MAC address 2: 00:02:2D:24:D4:D5 \Device\NetBT_Tcpip_{2A9F3EF9-F241-4CE5-A251-24910149D708} Workstation/server type on 192.168.2.100 Users on 192.168.2.100 Groups on 192.168.2.100 RPC endpoints on 192.168.2.100 Entry 0 Interface: "906b0ce0-c70b-1067-b317-00dd010662da" ver 1.0 Binding: "ncacn_ip_tcp:192.168.2.100[3105]" Object Id: "b09bd3d8-4fc3-4eee-9b71-02d2b6c431be" Annotation: "" Entry 1 Interface: "1ff70682-0a51-30e8-076d-740be8cee98b" ver 1.0 Binding: "ncalrpc:[Infrared Transfer Send]" Object Id: "00000000-0000-0000-0000-000000000000" Annotation: "" Entry 2 Interface: "1ff70682-0a51-30e8-076d-740be8cee98b" ver 1.0 Binding: "ncalrpc:[Wireless Link Notification]" Object Id: "00000000-0000-0000-0000-000000000000" Annotation: ""
Figure 3.6-B: SuperScan Enumeration Results cont...
An interesting characteristic about IP scanners like Superscan is that the
thods used to obtain the results presented in Figures 3.5 and 3.6 are practically
same, therefore generating similar traffic. Some scanners generate more traffic
n others in order to accomplish the same result. To demonstrate this similarity
scanned a single host with Superscan and another scanner called Angry IP
anner. Both of these scanners have multiple options; however we only enabled
IP/Host detection features in each one. The traffic that Superscan generates
ks like this,
3:14:22.380668 192.168.2.210 > 192.168.2.2: icmp: echo request 3:14:22.380788 192.168.2.2 > 192.168.2.210: icmp: echo reply
60
It only sends out one ICMP request. However, the results from Angry IP scanner
are slightly different,
13:20:50.920717 192.168.2.210 > 192.168.2.2: icmp: echo request13:20:50.920948 192.168.2.2 > 192.168.2.210: icmp: echo reply 13:20:50.921536 192.168.2.210 > 192.168.2.2: icmp: echo request13:20:50.921713 192.168.2.2 > 192.168.2.210: icmp: echo reply 13:20:50.922276 192.168.2.210 > 192.168.2.2: icmp: echo request13:20:50.922401 192.168.2.2 > 192.168.2.210: icmp: echo reply
Angry IP scanner uses 3 ICMP echo requests to determine whether or not the target
is online. Although the packet count is slightly different the scanning method is the
same. There for a fingerprint can be developed to detect this kind of activity.
Port Scanning
Although SuperScan displayed the open ports in its final scanning results,
we did not discuss this technique because there is another tool favored by hackers
for port scanning. The tool is called NMAP, and it is considered to be the Swiss
Army Knife of all scanners. It supports dozens of advanced techniques for mapping
out networks filled with IP filters, firewalls, routers, and other obstacles. This
includes many port scanning mechanisms (both TCP & UDP), OS detection,
version detection, ping sweeps, and more. We will only take a look at its port
scanning capability in this section.
NMAP supports all forms of port scanning techniques in existence today.
These techniques include Vanilla TCP connect() scanning, TCP SYN (half open)
scanning, TCP FIN (stealth) scanning, TCP ftp proxy (bounce attack) scanning,
61

SYN/FIN scanning using IP fragments (bypasses packet filters), UDP recvfrom()
scanning, UDP raw ICMP port unreachable scanning, ICMP scanning (ping-
sweep), and Reverse-ident scanning [127] [128]. Most operating systems are
supported, including Linux, Microsoft Windows, FreeBSD, OpenBSD, Solaris,
IRIX, Mac OS X, HP-UX, NetBSD, Sun OS, Amiga, and more. [127]. It is
available in GUI version and in command line version, which makes it even more
powerful because it can be scripted.
To illustrate ease of use, we scanned two of the systems in our isolated
network with the command, nmap -sS -P0 -T 3 192.168.2.100 192.168.2.102.
The output is shown in Figure 3.7 .
Starting nmap 3.50 ( http://www.insecure.org/nmap/ ) at 2004-10-06 21:41 EDT Interesting ports on 192.168.2.100: (The 1647 ports scanned but not shown below are in state: closed) PORT STATE SERVICE 25/tcp open smtp 80/tcp open http 135/tcp open msrpc 139/tcp open netbios-ssn 443/tcp open https 445/tcp open microsoft-ds 1025/tcp open NFS-or-IIS 1026/tcp open LSA-or-nterm 3389/tcp open ms-term-serv 5000/tcp open UPnP 8000/tcp open http-alt 8443/tcp open https-alt Interesting ports on 192.168.2.102: (The 1655 ports scanned but not shown below are in state: closed) PORT STATE SERVICE 22/tcp open ssh 80/tcp open http 3306/tcp open mysql 6000/tcp open X11
Figure 3.7: NMAP output
62

In less than a minute we were able to determine that the two hosts are up, what
ports are open and what services are running on each port. Nmap, like many of the
tools we cover in this thesis, is scriptable. This gives the hacker the ability to fully
automate the process and collect the information later. A good example of this
would be passing a file with a list of IP address, very much like the one DNS-slurp
generates, as an argument to nmap then piping the results to a file.
63

OS Detection
So far we have been able to answer four questions from Table 3.7,
1) Which IP's are in use?
2) What are the names of the registered systems?
3) What ports are open on the live systems?
4) What services are running on those open ports?
The answers to the remaining question can be obtained using a technique known as
operating system detection or OS detection.
There are several techniques that can be used to detect operating systems on
remote systems. A classic technique is to telnet into a system (if the system has the
service enabled) which might return a login prompt with a banner revealing all
sorts of information about the system. Or telnet into a specific port on a machine
which typically would reveal the version of the service that is running on that port,
and then from this information an educated guess can be made at determining the
OS type. Another classic technique is using DNS information records to determine
what type of service the system provides via the DNS name of the system.
However, some system and network administrators have caught on and have started
to disable banners and started using naming conventions which eliminates
OS/Service guessing through DNS records. Due to the proactive efforts of system
and network administrators, OS detecting techniques have become more
sophisticated through the use of protocols such as the Simple Network
64
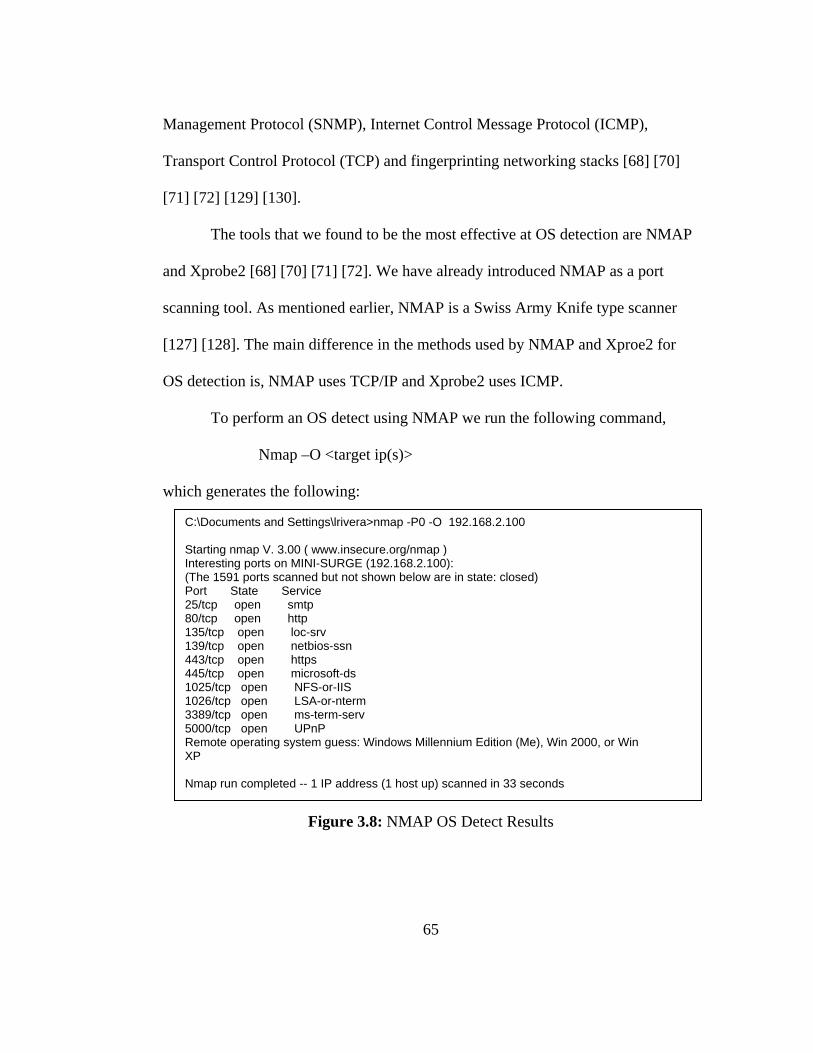
Management Protocol (SNMP), Internet Control Message Protocol (ICMP),
Transport Control Protocol (TCP) and fingerprinting networking stacks [68] [70]
[71] [72] [129] [130].
The tools that we found to be the most effective at OS detection are NMAP
and Xprobe2 [68] [70] [71] [72]. We have already introduced NMAP as a port
scanning tool. As mentioned earlier, NMAP is a Swiss Army Knife type scanner
[127] [128]. The main difference in the methods used by NMAP and Xproe2 for
OS detection is, NMAP uses TCP/IP and Xprobe2 uses ICMP.
To perform an OS detect using NMAP we run the following command,
Nmap –O <target ip(s)>
which generates the following:
C:\Documents and Settings\lrivera>nmap -P0 -O 192.168.2.100 Starting nmap V. 3.00 ( www.insecure.org/nmap ) Interesting ports on MINI-SURGE (192.168.2.100): (The 1591 ports scanned but not shown below are in state: closed) Port State Service 25/tcp open smtp 80/tcp open http 135/tcp open loc-srv 139/tcp open netbios-ssn 443/tcp open https 445/tcp open microsoft-ds 1025/tcp open NFS-or-IIS 1026/tcp open LSA-or-nterm 3389/tcp open ms-term-serv 5000/tcp open UPnP Remote operating system guess: Windows Millennium Edition (Me), Win 2000, or Win XP Nmap run completed -- 1 IP address (1 host up) scanned in 33 seconds
Figure 3.8: NMAP OS Detect Results
65

In addition to the OS detection, NMAP also returns the status of the scanned host,
its open ports, services running on each port and time it took to complete the scan.
Running an Xprobe2 scan on the same system would yield the following,
[+] Target is 192.168.2.100 [+] Loading modules. [+] Following modules are loaded: [x] [1] ping:icmp_ping - ICMP echo discovery module [x] [2] ping:tcp_ping - TCP-based ping discovery module [x] [3] ping:udp_ping - UDP-based ping discovery module [x] [4] infogather:ttl_calc - TCP and UDP based TTL distance calculation [x] [5] infogather:portscan - TCP and UDP PortScanner [x] [6] fingerprint:icmp_echo - ICMP Echo request fingerprinting module [x] [7] fingerprint:icmp_tstamp - ICMP Timestamp request fingerprinting module [x] [8] fingerprint:icmp_amask - ICMP Address mask request fingerprinting module [x] [9] fingerprint:icmp_info - ICMP Information request fingerprinting module [x] [10] fingerprint:icmp_port_unreach - ICMP port unreachable fingerprinting module [x] [11] fingerprint:tcp_hshake - TCP Handshake fingerprinting module [+] 11 modules registered [+] Initializing scan engine [+] Running scan engine [-] ping:tcp_ping module: no closed/open TCP ports known on 192.168.2.100. Module test failed [-] ping:udp_ping module: no closed/open UDP ports known on 192.168.2.100. Module test failed [+] No distance calculation. 192.168.2.100 appears to be dead or no ports known [+] Host: 192.168.2.100 is up (Guess probability: 25%) [+] Target: 192.168.2.100 is alive. Round-Trip Time: 0.01753 sec [+] Selected safe Round-Trip Time value is: 0.03507 sec [+] Primary guess: [+] Host 192.168.2.100 Running OS: "Microsoft Windows 2000 Server" (Guess probability: 52%) [+] Other guesses: [+] Host 192.168.2.100 Running OS: "Microsoft Windows 2000 Workstation SP4" (Guess probability: 52%) [+] Host 192.168.2.100 Running OS: "Microsoft Windows 2000 Workstation SP3" (Guess probability: 52%) [+] Host 192.168.2.100 Running OS: "Microsoft Windows 2000 Server Service Pack 1" (Guess probability: 52%) [+] Host 192.168.2.100 Running OS: "Microsoft Windows 2000 Server Service Pack 2" (Guess probability: 52%) [+] Host 192.168.2.100 Running OS: "Microsoft Windows 2000 Server Service Pack 3" (Guess probability: 52%) [+] Host 192.168.2.100 Running OS: "Microsoft Windows 2000 Server Service Pack 4" (Guess probability: 52%) [+] Host 192.168.2.100 Running OS: "Microsoft Windows XP" (Guess probability: 52%) [+] Cleaning up scan engine [+] Modules deinitialized [+] Execution completed.
Figure 3.9: Xprobe2 OS Detect Results
66
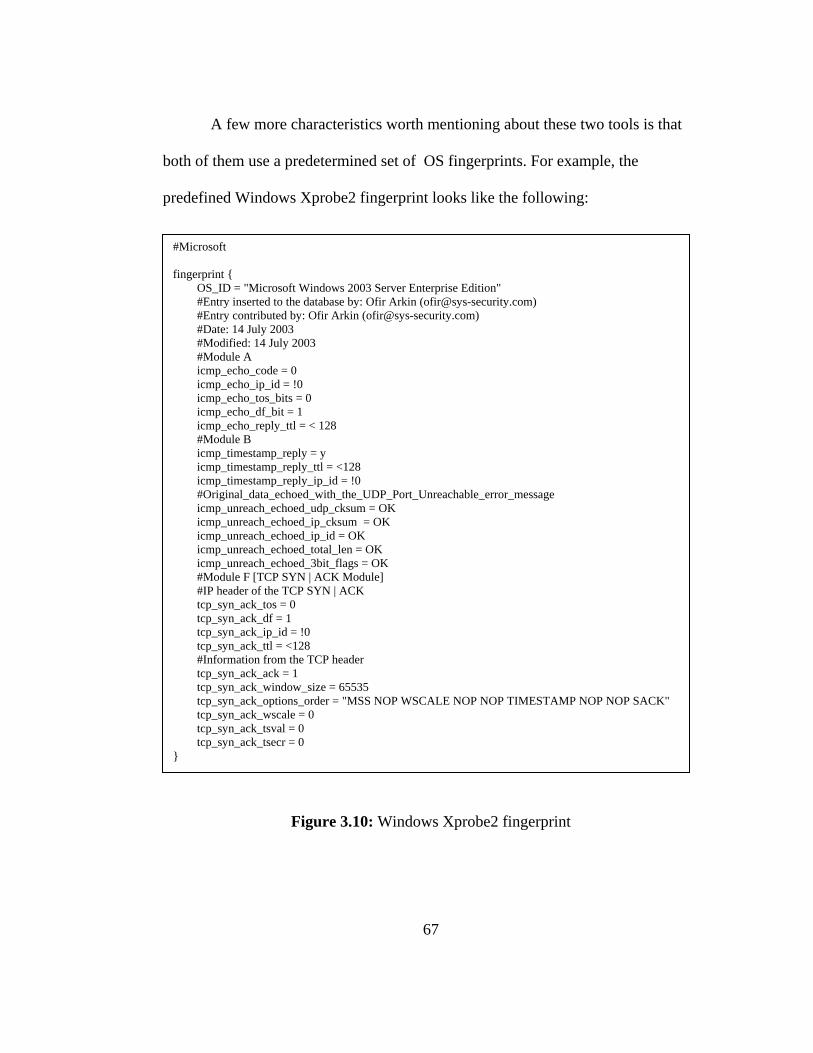
A few more characteristics worth mentioning about these two tools is that
both of them use a predetermined set of OS fingerprints. For example, the
predefined Windows Xprobe2 fingerprint looks like the following:
#Microsoft fingerprint { OS_ID = "Microsoft Windows 2003 Server Enterprise Edition" #Entry inserted to the database by: Ofir Arkin ([email protected]) #Entry contributed by: Ofir Arkin ([email protected]) #Date: 14 July 2003 #Modified: 14 July 2003 #Module A icmp_echo_code = 0 icmp_echo_ip_id = !0 icmp_echo_tos_bits = 0 icmp_echo_df_bit = 1 icmp_echo_reply_ttl = < 128 #Module B icmp_timestamp_reply = y icmp_timestamp_reply_ttl = <128 icmp_timestamp_reply_ip_id = !0 #Original_data_echoed_with_the_UDP_Port_Unreachable_error_message icmp_unreach_echoed_udp_cksum = OK icmp_unreach_echoed_ip_cksum = OK icmp_unreach_echoed_ip_id = OK icmp_unreach_echoed_total_len = OK icmp_unreach_echoed_3bit_flags = OK #Module F [TCP SYN | ACK Module] #IP header of the TCP SYN | ACK tcp_syn_ack_tos = 0 tcp_syn_ack_df = 1 tcp_syn_ack_ip_id = !0 tcp_syn_ack_ttl = <128 #Information from the TCP header tcp_syn_ack_ack = 1 tcp_syn_ack_window_size = 65535 tcp_syn_ack_options_order = "MSS NOP WSCALE NOP NOP TIMESTAMP NOP NOP SACK" tcp_syn_ack_wscale = 0 tcp_syn_ack_tsval = 0 tcp_syn_ack_tsecr = 0 }
Figure 3.10: Windows Xprobe2 fingerprint
67

The predefined NMAP Windows fingerprint looks like this,
Fingerprint Axent Raptor Firewall running on Windows NT Class Axent | Windows | NT/2K/XP | firewall TSeq(Class=TR) T1(Resp=Y%DF=Y%W=2017%ACK=S++%Flags=AS%Ops=M) T2(Resp=N) T3(Resp=Y%DF=Y%W=2017%ACK=S++%Flags=AS%Ops=M) T4(Resp=Y%DF=N%W=0%ACK=S++%Flags=AR%Ops=) T5(Resp=Y%DF=N%W=0%ACK=S++%Flags=AR%Ops=) T6(Resp=Y%DF=N%W=0%ACK=S++%Flags=AR%Ops=) T7(Resp=N) PU(Resp=N)
Figure 3.11: NMAP Windows fingerprint
These two scans illustrate how simple it is for a hacker to gather OS type
information. Chapter 4 provides more information on the functions available in
these two tools along with analysis of the traffic that the tools generate. We also
take a closer look at the predefined fingerprints Xprobe2 uses and the fingerprint
generation feature.
68

Sniffing
Sniffing is the act of intercepting and inspecting data packets using a
software program called a sniffer, which places the network card in what is known
as promiscuous mode. There are two forms of sniffing, one that works only on non-
switched networks and another that works on both switched and non-switched
networks. The first functions directly without any modification to the network
(such as enabling a mirrored port). Port mirroring, also known as a roving analysis
port, is a method of monitoring network traffic that forwards a copy of each
incoming and outgoing packet from one port of a network switch to another port,
where the packet can be studied [134]. This form of sniffing is typically used by
network administrators for troubleshooting network problems. The second form of
sniffing exploits a protocol called ARP, which is the only way to sniff a switched
network without needing access to a mirrored port. This form of sniffing is
discussed in detail later in this section.
The concept of a sniffer has evolved throughout the years. There are
software and hardware devices today that can do much more, than just put a
network card in promiscuous mode and display raw network traffic. This kind of
sniffer can display packets in great detail (such as the values in each field of each
packet) and provide statistical data in addition to logging for future analysis. These
types of sniffers are also referred to as protocol analyzers, and are generally used
69

by network and network security analysts. Some of the commercial and open
source software protocol analyzers available are listed in tables 3.11 and 3.12.
Commercial Protocol Analyzers Company/Developer(s) Type
Sniffer PRO Network General Software McAfee Security Forensics Network Assocaites Software
NetAsyst Network Analyzer Network Assocaites
Iris Network Traffic Analyzer eEye Digital Security Software
EtherPeek NX WildPackets Software OptiView Protocol Expert Fluke Hardware
Observer Network Instruments Software LanHound Sunbelt Software Software
Table 3.11: Commercial protocol analyzers
OpenSource Protocol Analyzers Tcpdump tcpdump.org Software Ethereal ethereal.com Software
Analyzer Paolo Politano, Loris Degioanni,
et al http://analyzer.polito.it/
Software
Snort Martin Roesch Software Aldebaran sniffer Rogala Software Software
Table 3.12: Open Source protocol analyzers
Hackers use sniffers for a totally different purpose. They are typically interested in
capturing traffic and instantly extracting certain information, such as user account
(passwords/usernames), personal information or anything they can use to either
break into a system or profit from stolen information. Therefore, hackers usually
70

use sniffers designed specifically for extracting targeted information from network
packets. Some of these specialized sniffer tools are listed in Table 3.13.
Specialized sniffers Sniffit [135] Dsniff [137]
Ettercap [138] Hunt [139]
Table 3.13: Specialized Sniffers
The specialized sniffers listed in Table 3.13 are discussed in this chapter. Those
listed in Tables 3.11 and 3.12 are covered in Chapters 4 and 5.
Before we continue, we would like to point out that sniffers/protocol
analyzers are also known as Packet sniffers, Network Analyzers or Ethernet
Sniffers.
Sniffit
Sniffit, created by Brecht Claerhout [135], is one of the first sniffers used by
hackers in the late 1990’s. Sniffit can listen in on any tcp stream without
interrupting the connection in a non-switched network. For example, a hacker can
selectively tap into a telnet or ftp session, as shown in figure 3.12, and capture the
user name and password in plain text. Some of the sniffers hackers use are passive
(do not generate traffic) and others are semi-active (generates some initial traffic).
Sniffit is a passive sniffing tool. Although we mentioned earlier that Sniffit can
only work on a non-switched network, it can however, work on a mirrored port on
a switched network.
71

Figure 3.12: Sniffit capturing password
72
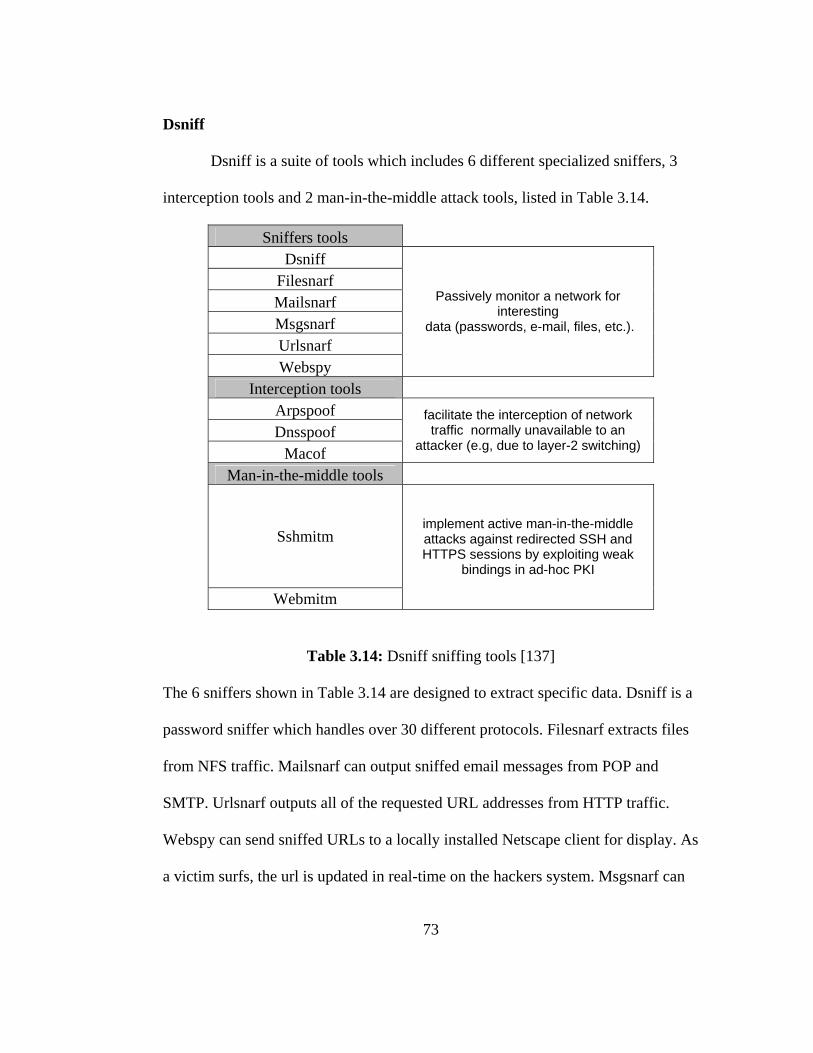
Dsniff
Dsniff is a suite of tools which includes 6 different specialized sniffers, 3
interception tools and 2 man-in-the-middle attack tools, listed in Table 3.14.
Sniffers tools Dsniff
Filesnarf Mailsnarf Msgsnarf Urlsnarf Webspy
Passively monitor a network for interesting
data (passwords, e-mail, files, etc.).
Interception tools Arpspoof Dnsspoof
Macof
facilitate the interception of network traffic normally unavailable to an
attacker (e.g, due to layer-2 switching)
Man-in-the-middle tools
Sshmitm
Webmitm
implement active man-in-the-middle attacks against redirected SSH and HTTPS sessions by exploiting weak
bindings in ad-hoc PKI
Table 3.14: Dsniff sniffing tools [137]
The 6 sniffers shown in Table 3.14 are designed to extract specific data. Dsniff is a
password sniffer which handles over 30 different protocols. Filesnarf extracts files
from NFS traffic. Mailsnarf can output sniffed email messages from POP and
SMTP. Urlsnarf outputs all of the requested URL addresses from HTTP traffic.
Webspy can send sniffed URLs to a locally installed Netscape client for display. As
a victim surfs, the url is updated in real-time on the hackers system. Msgsnarf can
73
extract selected messages from most instant messaging clients available today,
including AOL, ICQ, MSN, and Yahoo messengers. Before we continue, it is
important to point out that msgsnarf is especially dangerous in environments such
as Florida Tech. Users have the tendency of sharing student information such as
social security numbers, financial information, or reminding each other how to use
commands for internal database systems using instant, messenger services..
Revisiting the scenario introduced at the beginning of this chapter, if a
hacker wanted to steal sensitive information such as passwords, confidential emails
or account information, it would be very easy to do so with the sniffers just
described. Figure 3.13 illustrates how dangerous the Dsniff suite can be. In this
research, we sniffed the MSN conversation between two users in our mock FIT
network, using Msgsnarf. Here we were able to capture what seemed to be two
secretaries exchanging commands to some internal system called CANNER and
sending the SSN number for a student named Jennifer Brown.
74

Figure 3.13: Msgsnarf capture of an MSN conversation
As mentioned earlier, Msgsnarf and the other 5 sniffers are passive tools; therefore
they are not effective on a switched network by themselves. However, with the
assistance of the three interception tools, Arpspoof, Dnsspoof and Macof, the 6
sniffers are lethal.
Interception tools modify data on the target nodes. Arpspoof, for example,
redirects packets on a LAN to overcome the host-isolating behavior of switched
networks by poisoning its victims ARP tables [137]. It is important to point out that
75

Arpspoof by itself would cause a denial of service attack if the packets are not
rerouted by using either IP forwarding or using fragroute [140]. To illustrate the
capabilities of Dsniff we ran two experiments using Arpspoof and Dsniff. In the
first experiment, our objective was to capture the user name and account of a user
logging into their mail account and in the second we want to capture the username
and password of a user logging into a password protected website. Figure 3.14
illustrates the configuration we used in the two experiments and provide an
explanation of the arpspoofing process. Figures 3.15 and 3.16 illustrate the results
of the two experiments.
Figure 3.14: Configuration used for dsniff and msgsnarf experiment
76

77

In this experiment we used Arpspoof to poison the targets ARP tables which
redirects all traffic between them through the attacking machine. Then we ran
msgsnarf to capture the conversation.
DNS spoofing does to a DNS server cache what Arpspoof does to an ARP
table cache. It poisons the information in the cache entries, then a hacker can forge
replies to DNS queries [137] [141]. Macof causes a switch to “fail open”, forcing
the switch into a hub state which then broadcasts traffic to all hosts. Once the hub is
in this state any sniffer can be used to gather information.
The final set of tools, Sshmitm and Webmitm, allows the hacker to proxy
and sniff SSH, HTTP and HTTPS traffic redirected by Dnsspoof, creating a man-
in-the-middle attack. In this case, passwords, logins, SSL encrypted logins and
form submissions can be captured.
EtterCap
Ettercap is a multi-featured, specialized sniffer that has several capabilities other
than just sniffing traffic. Ettercap is considered a network sniffer, interceptor and
logger for Ethernet LANs. It supports active and passive analysis of many protocols
including some ciphers like SSH and HTTPS. Ettercap also supports data injection
and an established connection and instant filtering without breaking the connection.
Features included in EtterCap are listed in Table 3.15,
78
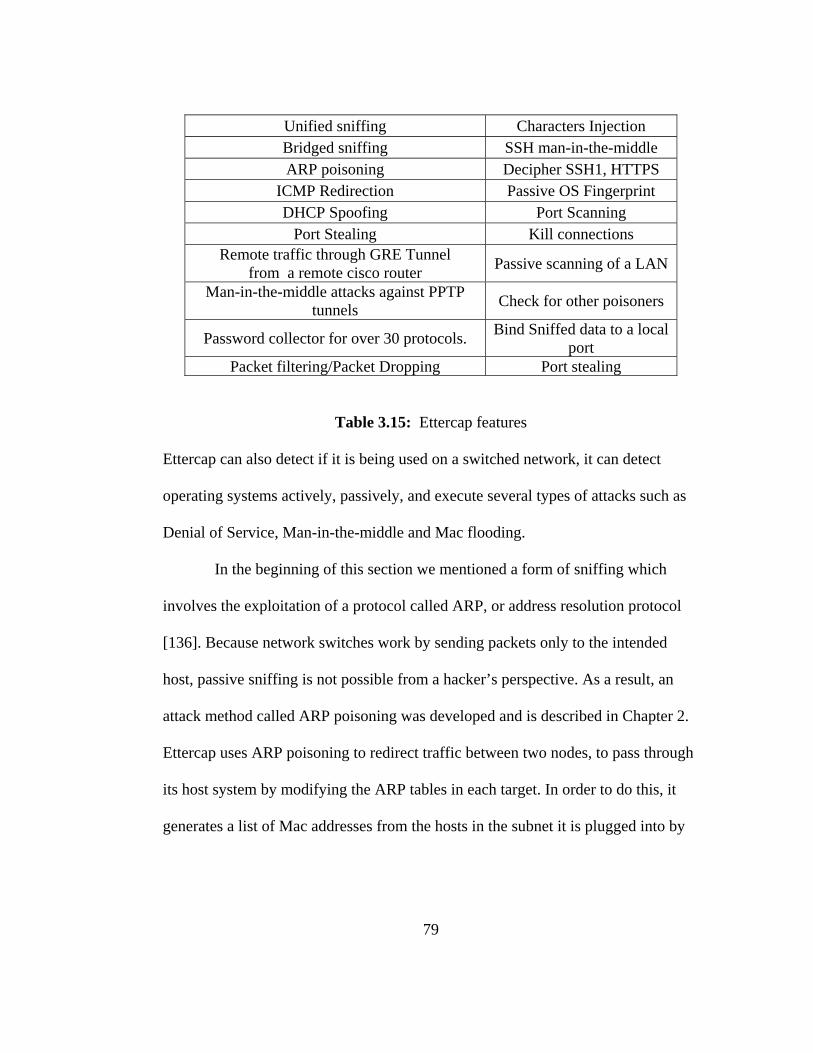
Unified sniffing Characters Injection Bridged sniffing SSH man-in-the-middle ARP poisoning Decipher SSH1, HTTPS
ICMP Redirection Passive OS Fingerprint DHCP Spoofing Port Scanning
Port Stealing Kill connections Remote traffic through GRE Tunnel
from a remote cisco router Passive scanning of a LAN
Man-in-the-middle attacks against PPTP tunnels Check for other poisoners
Password collector for over 30 protocols. Bind Sniffed data to a local port
Packet filtering/Packet Dropping Port stealing
Table 3.15: Ettercap features
Ettercap can also detect if it is being used on a switched network, it can detect
operating systems actively, passively, and execute several types of attacks such as
Denial of Service, Man-in-the-middle and Mac flooding.
In the beginning of this section we mentioned a form of sniffing which
involves the exploitation of a protocol called ARP, or address resolution protocol
[136]. Because network switches work by sending packets only to the intended
host, passive sniffing is not possible from a hacker’s perspective. As a result, an
attack method called ARP poisoning was developed and is described in Chapter 2.
Ettercap uses ARP poisoning to redirect traffic between two nodes, to pass through
its host system by modifying the ARP tables in each target. In order to do this, it
generates a list of Mac addresses from the hosts in the subnet it is plugged into by
79

sending out a burst of ARP requests. The interesting thing about ARP poisoning is
that it has no effect beyond the subnet it is running on.
Once this list is created, a source and destination can be selected which triggers the
ARP poisoning, and traffic between these two points can be sniffed. Figure 3.17
illustrates the Mac address list and a target being selected.
Figure 3.17: Ettercap interface and list of Mac addresses in subnet.
To illustrate the capabilities of Ettercap, we ran it against two machines in
our mock Florida Tech network. For this experiment we chose to use the hosts
192.168.2.102 and 192.168.2.104. Before targets are selected in Ettercap, the target
80

ARP tables contain the appropriate Mac address as illustrated in Figures 3.18-A
and 3.18-B,
Figure 3.18-A: Target 192.168.2.102 ARP table before ARP Poisoning
Figure 3.18-B: Target 192.168.2.104 ARP table before ARP Poisoning
Once targets have been selected, the ARP Poisoning takes place and the Mac
addresses in each of the targeted ARP tables are changed to reflect that of our
attacking machine 192.168.2.200 (00:02:A5:03:E5:53),
Figure 3.19-A: Target 192.168.2.102 ARP table after ARP Poisoning
81

Figure 3.19-B: Target 192.168.2.104 ARP table after ARP Poisoning
The entries in each target ARP table now show the same Mac address for both
hosts 192.168.2.102 and 192.168.2.104. Now we can read all the traffic between
our two victims using Ettercap’s sniffing features or any sniffer of choice. Figure
3.20 shows a captured username and password, and Figure 3.21 illustrates the flow
of events during this experiment.
Username and password
Figure 3.20: Ettercap capturing a website username and password
82

Figure 3.21: Ettercap Experiment Configuration
83

Summary
In this chapter we have illustrated reconnaissance techniques and tools that
hackers can use to gather network information. Tables 3.16 and 3.17 summarize the
type of information passive and active reconnaissance can provide for a hacker.
Information obtainable using passive reconnaissance
Does the company have web presence?
Does the company operate their own web server? If so what
kind?
IP range
Does the company own the IP range? Is the company hosting
their own website?
Does the company operate their own mail server?
What DNS servers are used?
Are the DNS servers managed in-house or outsourced?
Administrative and technical contact information
Company Address
Table 3.16: Information obtainable using passive reconnaissance
84

Information obtainable using active reconnaissance Which IP's are in use?
What ports are open on the live systems?
What services are running on those open ports?
Which operating systems are being used and what versions?
What are the names of the registered systems?
Table 3.17: Information obtainable using active reconnaissance
We have illustrated how the techniques and tools work and the type of information
each reconnaissance can gather. In the next chapter, we will take a closer look at
how these tools work by analyzing the traffic they generate and dissecting packets
to extract key identifiers that can then be used to help detect when a reconnaissance
is being performed. However, not all of the techniques demonstrated in this chapter
can be detected. Nonetheless, it is important to know that such techniques are in
practice, what tools are used to carry out these techniques, and how they work.
This knowledge can serve as a means for the development of better
countermeasures and security practices.
85

Chapter 4
Network traffic analysis: A Security Analyst’s Perspective
We have discussed network reconnaissance techniques used by hackers,
types of network reconnaissance tools that are available to hackers and the
information that can be gathered on a target network. Now, we will discuss how to
identify network reconnaissance traffic and the tools available to accomplish this.
This chapter is organized as follows,
1) Tools for traffic analysis
2) ICMP reconnaissance analysis: XPROBE2
3) ARP reconnaissance analysis: ETTERCAP
4) TCP/UDP reconnaissance analysis: NMAP
4.1 Tools for traffic analysis
In Chapter 3 we introduced several protocol analyzers in Tables 3.11 and
3.12. All of them are great products and offer many features. However, for the
experiments presented in this chapter we chose to use 2 of the open source protocol
analyzers, Tcpdump and Ethereal. We chose these two protocol analyzers, not only
because they are freely available, but because each one offers unique characteristics
and they happen to be the most widely used today.
86
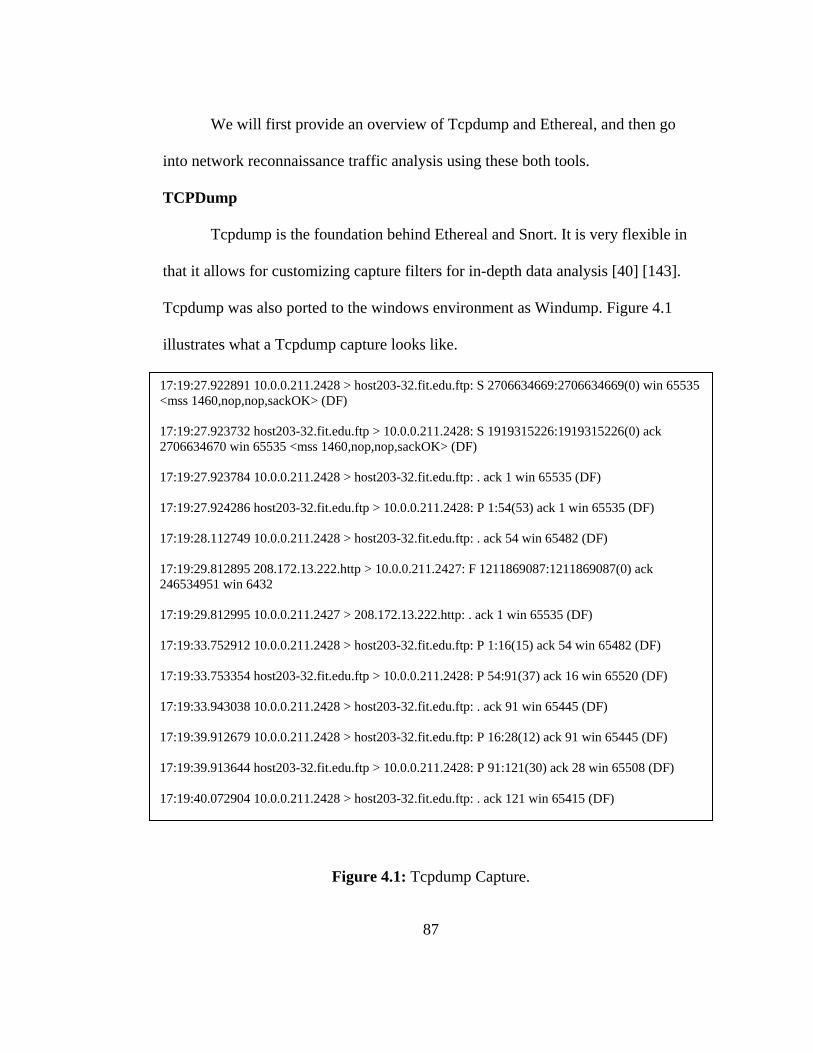
We will first provide an overview of Tcpdump and Ethereal, and then go
into network reconnaissance traffic analysis using these both tools.
TCPDump
Tcpdump is the foundation behind Ethereal and Snort. It is very flexible in
that it allows for customizing capture filters for in-depth data analysis [40] [143].
Tcpdump was also ported to the windows environment as Windump. Figure 4.1
illustrates what a Tcpdump capture looks like.
17:19:27.922891 10.0.0.211.2428 > host203-32.fit.edu.ftp: S 2706634669:2706634669(0) win 65535 <mss 1460,nop,nop,sackOK> (DF) 17:19:27.923732 host203-32.fit.edu.ftp > 10.0.0.211.2428: S 1919315226:1919315226(0) ack 2706634670 win 65535 <mss 1460,nop,nop,sackOK> (DF) 17:19:27.923784 10.0.0.211.2428 > host203-32.fit.edu.ftp: . ack 1 win 65535 (DF) 17:19:27.924286 host203-32.fit.edu.ftp > 10.0.0.211.2428: P 1:54(53) ack 1 win 65535 (DF) 17:19:28.112749 10.0.0.211.2428 > host203-32.fit.edu.ftp: . ack 54 win 65482 (DF) 17:19:29.812895 208.172.13.222.http > 10.0.0.211.2427: F 1211869087:1211869087(0) ack 246534951 win 6432 17:19:29.812995 10.0.0.211.2427 > 208.172.13.222.http: . ack 1 win 65535 (DF) 17:19:33.752912 10.0.0.211.2428 > host203-32.fit.edu.ftp: P 1:16(15) ack 54 win 65482 (DF) 17:19:33.753354 host203-32.fit.edu.ftp > 10.0.0.211.2428: P 54:91(37) ack 16 win 65520 (DF) 17:19:33.943038 10.0.0.211.2428 > host203-32.fit.edu.ftp: . ack 91 win 65445 (DF) 17:19:39.912679 10.0.0.211.2428 > host203-32.fit.edu.ftp: P 16:28(12) ack 91 win 65445 (DF) 17:19:39.913644 host203-32.fit.edu.ftp > 10.0.0.211.2428: P 91:121(30) ack 28 win 65508 (DF) 17:19:40.072904 10.0.0.211.2428 > host203-32.fit.edu.ftp: . ack 121 win 65415 (DF)
Figure 4.1: Tcpdump Capture.
87

If we want to extract only the SYN packet(s) from the above capture we use the
following filter,
Tcpdump -v -r ftp-login.cap 'tcp[tcpflags] & tcp-syn != 0 '
the output looks like this,
17:22:31.082908 10.0.0.211.venus-se > host203-32.fit.edu.ftp: S [tcp sum ok] 3307829625:3307829625(0) win 65535 <mss 1460,nop,nop,sackOK> (DF) (ttl 128, id 11068, len 48) 17:22:31.083279 host203-32.fit.edu.ftp > 10.0.0.211.venus-se: S [tcp sum ok] 1965082975:1965082975(0) ack 3307829626 win 65535 <mss 1460,nop,nop,sackOK> (DF) (ttl 126, id 51903, len 48)
Figure 4.2: TCP SYN packets filtered from Capture in Figure 4.1
TCPdump is a very powerful and flexible tool for network data analysis. For
further details please refer to [40] and [143].
Ethereal
Ethereal was created by Gerald Combs, but since its birth hundreds of
programmers have contributed to its evolution [36]. It offers everything Tcpdump
has to offers but with a detailed graphical view of network traffic, in real time or
not, making it a little easier to analyze. What makes Ethereal even more appealing
is that it accepts Tcpdump formatted filters. For example, if we wanted to extract
the SYN packets from the capture in Figure 4.1 as we did with Tcpdump, the out
put would look like this,
88

Figure 4.3: Ethereal Filter of Capture in Figure 4.1
Unlike Tcpdump, Ethereal also offers a clean way to analyze raw data packets and
its payload at the same time as illustrated in Figure 4.4. One other advantage
Ethereal has over Tcpdump is its ability to follow a TCP stream and display it in
ASCII, EBCDIC, HEX dump and in C arrays. Figure 4.5 displays the complete
login of the FTP capture in Figure 4.1. For further details on how to use Ethereal
and the many options and features it offers please refer to [36].
89

Selected packet
TCP/IP packet information
Payload data
Figure 4.4: Detailed view of a packet
Figure 4.5: Complete FTP login stream from Capture in Figure 4.1
90

4.2 ICMP Reconnaissance Analysis: XPROBE2
Xprobe2 was developed by Ofir Arkin, founder of Sys-Security Group. He
uses ICMP, or Internet Control Message Protocol, as a means to identify network
devices using a number of methods [69] [70] [71] [72].
Our goal is to analyze traffic and identify when this tool is being used.
Because this is the first tool analyzed, it will serve to illustrate the methodology. As
we analyze other tools, steps may be added or deleted based on tool characteristics.
Primarily, the analysis of a tool includes the following:
1. Understanding the protocol the tool exploits, in this case it is ICMP
(Please refer to Appendix B for more information on this protocol)
2. Use of a sniffer, or protocol analyzer, to analyze tool capabilities
a. Examine the available parameters.
b. Document the effects of changing parameter values.
c. Characterize traffic generated by the various option
permutations.
Using this information, we then extract a fingerprint for the tool that can
subsequently be used to develop a rule for an intrusion detection system like snort,
as we will demonstrate in Chapter 5.
Xprobe2 is a modular program. It contains a total of eleven modules, each
with a specific purpose. Depending on what a hacker wants to accomplish, he/she
91
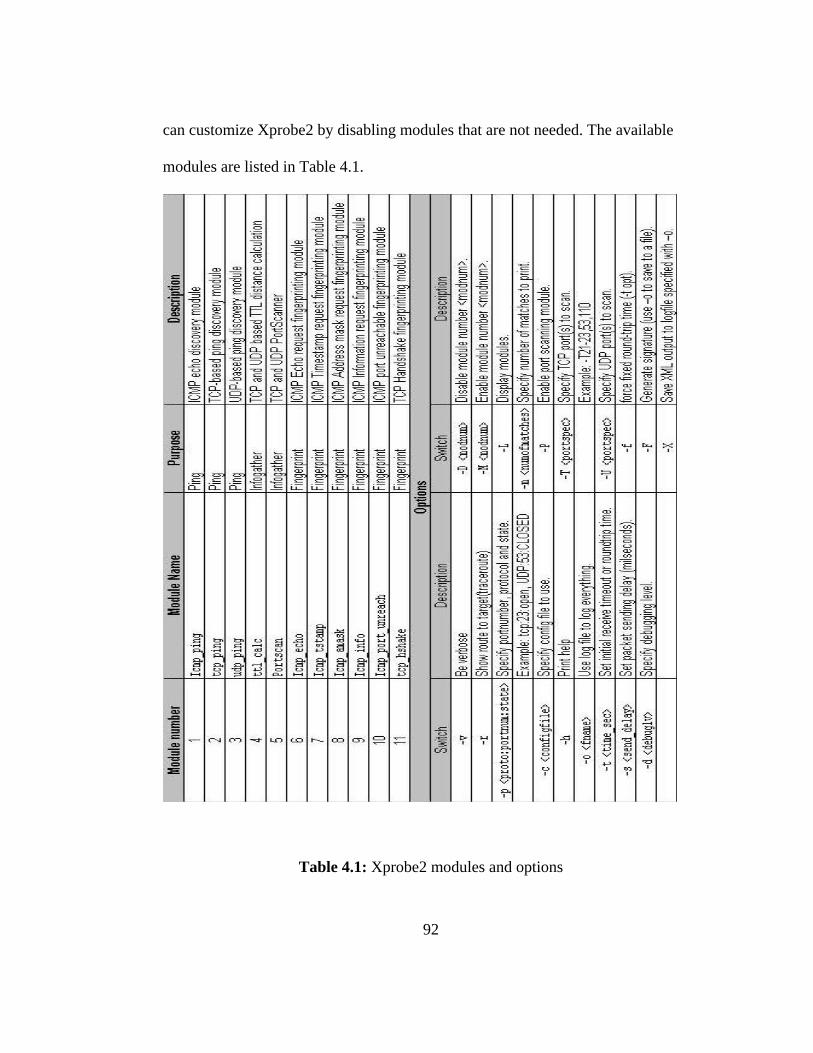
can customize Xprobe2 by disabling modules that are not needed. The available
modules are listed in Table 4.1.
Table 4.1: Xprobe2 modules and options
92
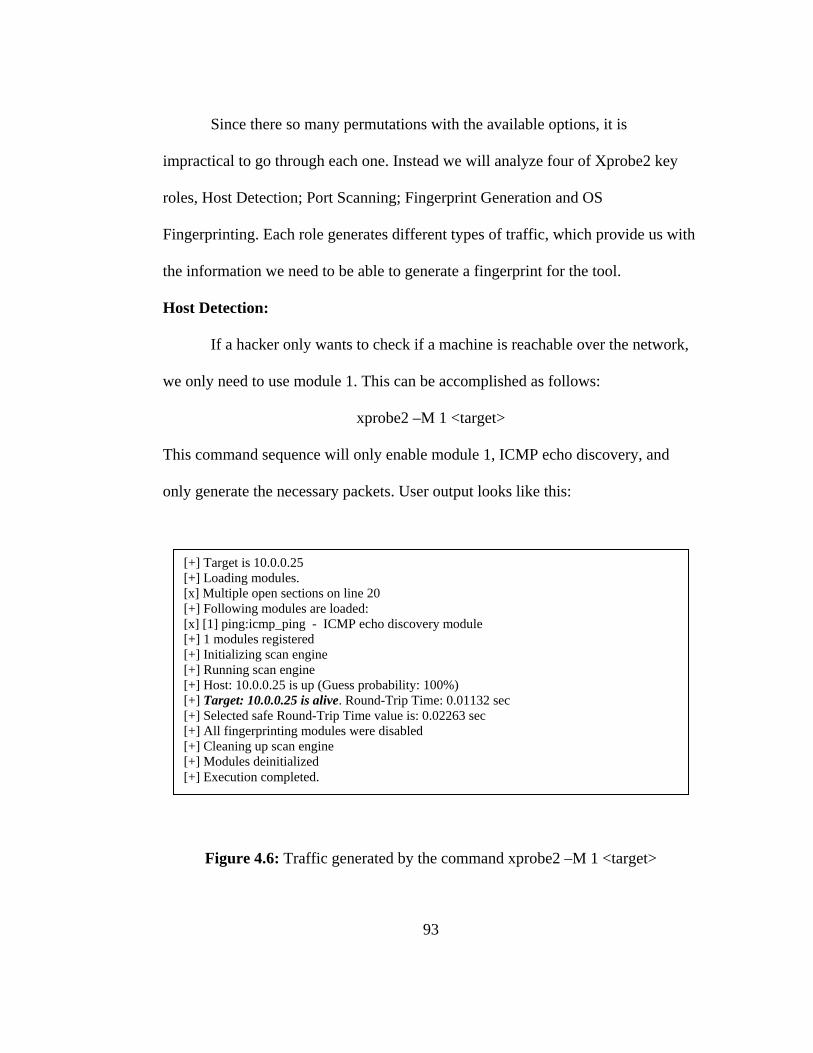
Since there so many permutations with the available options, it is
impractical to go through each one. Instead we will analyze four of Xprobe2 key
roles, Host Detection; Port Scanning; Fingerprint Generation and OS
Fingerprinting. Each role generates different types of traffic, which provide us with
the information we need to be able to generate a fingerprint for the tool.
Host Detection:
If a hacker only wants to check if a machine is reachable over the network,
we only need to use module 1. This can be accomplished as follows:
xprobe2 –M 1 <target>
This command sequence will only enable module 1, ICMP echo discovery, and
only generate the necessary packets. User output looks like this:
[+] Target is 10.0.0.25 [+] Loading modules. [x] Multiple open sections on line 20 [+] Following modules are loaded: [x] [1] ping:icmp_ping - ICMP echo discovery module [+] 1 modules registered [+] Initializing scan engine [+] Running scan engine [+] Host: 10.0.0.25 is up (Guess probability: 100%) [+] Target: 10.0.0.25 is alive. Round-Trip Time: 0.01132 sec [+] Selected safe Round-Trip Time value is: 0.02263 sec [+] All fingerprinting modules were disabled [+] Cleaning up scan engine [+] Modules deinitialized [+] Execution completed.
Figure 4.6: Traffic generated by the command xprobe2 –M 1 <target>
93
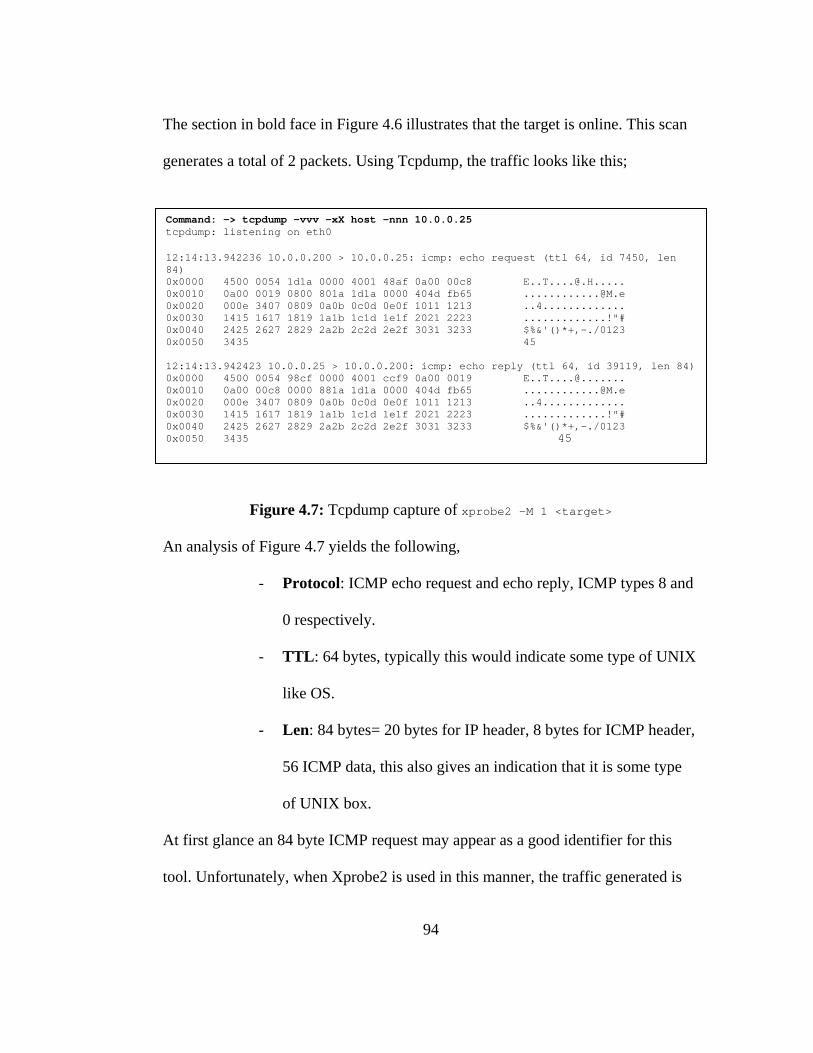
The section in bold face in Figure 4.6 illustrates that the target is online. This scan
generates a total of 2 packets. Using Tcpdump, the traffic looks like this;
Command: -> tcpdump -vvv -xX host -nnn 10.0.0.25 tcpdump: listening on eth0 12:14:13.942236 10.0.0.200 > 10.0.0.25: icmp: echo request (ttl 64, id 7450, len 84) 0x0000 4500 0054 1d1a 0000 4001 48af 0a00 00c8 [email protected]..... 0x0010 0a00 0019 0800 801a 1d1a 0000 404d fb65 [email protected] 0x0020 000e 3407 0809 0a0b 0c0d 0e0f 1011 1213 ..4............. 0x0030 1415 1617 1819 1a1b 1c1d 1e1f 2021 2223 .............!"# 0x0040 2425 2627 2829 2a2b 2c2d 2e2f 3031 3233 $%&'()*+,-./0123 0x0050 3435 45 12:14:13.942423 10.0.0.25 > 10.0.0.200: icmp: echo reply (ttl 64, id 39119, len 84)0x0000 4500 0054 98cf 0000 4001 ccf9 0a00 0019 E..T....@....... 0x0010 0a00 00c8 0000 881a 1d1a 0000 404d fb65 [email protected] 0x0020 000e 3407 0809 0a0b 0c0d 0e0f 1011 1213 ..4............. 0x0030 1415 1617 1819 1a1b 1c1d 1e1f 2021 2223 .............!"# 0x0040 2425 2627 2829 2a2b 2c2d 2e2f 3031 3233 $%&'()*+,-./0123 0x0050 3435 45
Figure 4.7: Tcpdump capture of xprobe2 –M 1 <target>
An analysis of Figure 4.7 yields the following,
- Protocol: ICMP echo request and echo reply, ICMP types 8 and
0 respectively.
- TTL: 64 bytes, typically this would indicate some type of UNIX
like OS.
- Len: 84 bytes= 20 bytes for IP header, 8 bytes for ICMP header,
56 ICMP data, this also gives an indication that it is some type
of UNIX box.
At first glance an 84 byte ICMP request may appear as a good identifier for this
tool. Unfortunately, when Xprobe2 is used in this manner, the traffic generated is
94
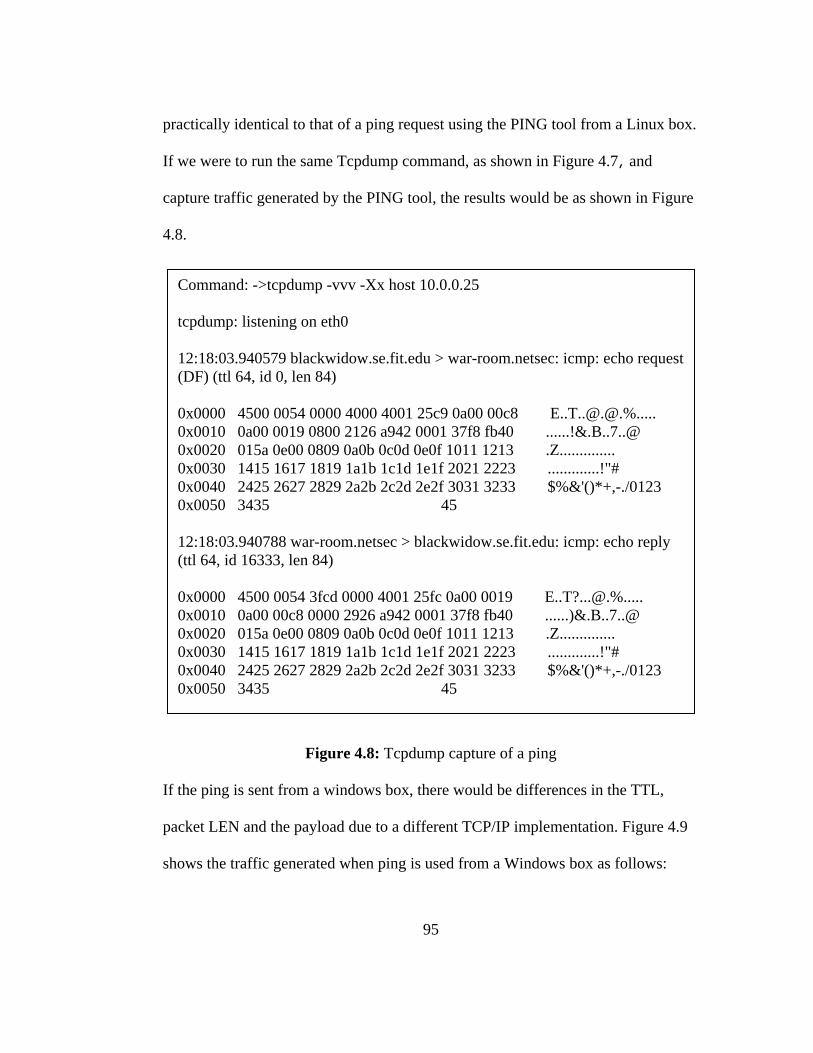
practically identical to that of a ping request using the PING tool from a Linux box.
If we were to run the same Tcpdump command, as shown in Figure 4.7, and
capture traffic generated by the PING tool, the results would be as shown in Figure
4.8.
I
p
s
Command: ->tcpdump -vvv -Xx host 10.0.0.25 tcpdump: listening on eth0 12:18:03.940579 blackwidow.se.fit.edu > war-room.netsec: icmp: echo request(DF) (ttl 64, id 0, len 84) 0x0000 4500 0054 0000 4000 4001 25c9 0a00 00c8 E..T..@.@.%..... 0x0010 0a00 0019 0800 2126 a942 0001 37f8 fb40 ......!&.B..7..@ 0x0020 015a 0e00 0809 0a0b 0c0d 0e0f 1011 1213 .Z.............. 0x0030 1415 1617 1819 1a1b 1c1d 1e1f 2021 2223 .............!"# 0x0040 2425 2627 2829 2a2b 2c2d 2e2f 3031 3233 $%&'()*+,-./0123 0x0050 3435 45 12:18:03.940788 war-room.netsec > blackwidow.se.fit.edu: icmp: echo reply (ttl 64, id 16333, len 84) 0x0000 4500 0054 3fcd 0000 4001 25fc 0a00 0019 E..T?...@.%..... 0x0010 0a00 00c8 0000 2926 a942 0001 37f8 fb40 ......)&.B..7..@ 0x0020 015a 0e00 0809 0a0b 0c0d 0e0f 1011 1213 .Z.............. 0x0030 1415 1617 1819 1a1b 1c1d 1e1f 2021 2223 .............!"# 0x0040 2425 2627 2829 2a2b 2c2d 2e2f 3031 3233 $%&'()*+,-./0123 0x0050 3435 45
Figure 4.8: Tcpdump capture of a ping
f the ping is sent from a windows box, there would be differences in the TTL,
acket LEN and the payload due to a different TCP/IP implementation. Figure 4.9
hows the traffic generated when ping is used from a Windows box as follows:
95
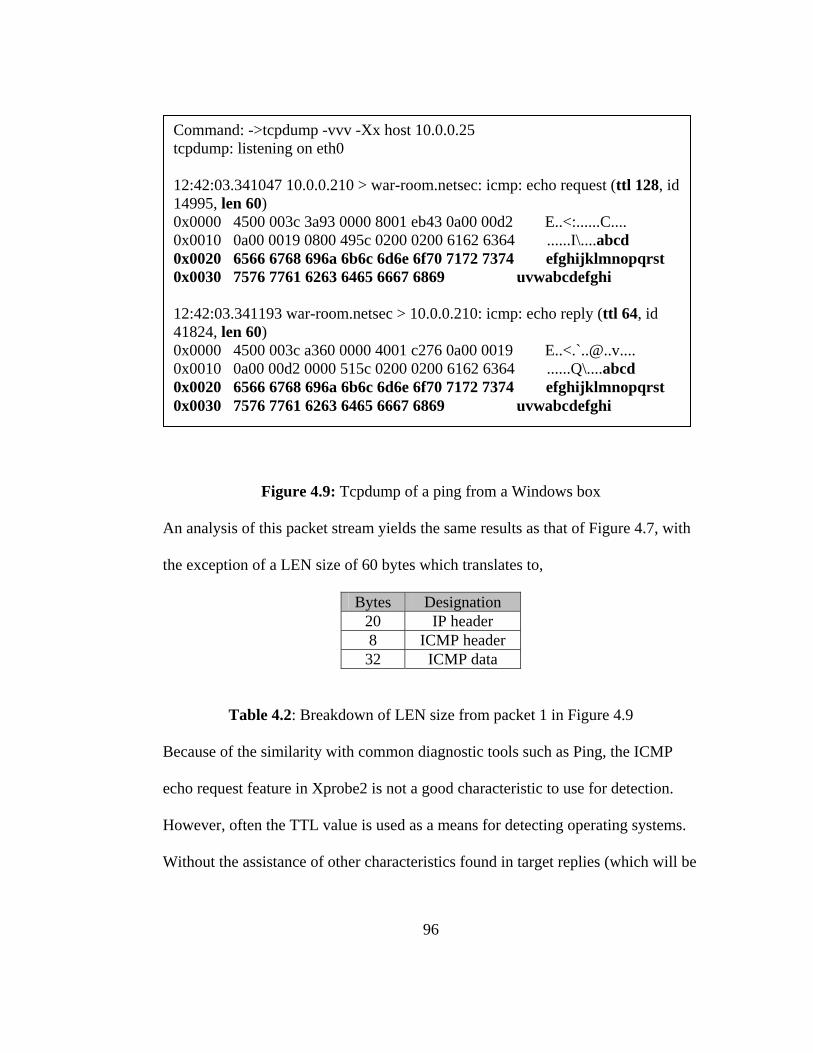
Command: ->tcpdump -vvv -Xx host 10.0.0.25 tcpdump: listening on eth0 12:42:03.341047 10.0.0.210 > war-room.netsec: icmp: echo request (ttl 128, id 14995, len 60) 0x0000 4500 003c 3a93 0000 8001 eb43 0a00 00d2 E..<:......C.... 0x0010 0a00 0019 0800 495c 0200 0200 6162 6364 ......I\....abcd 0x0020 6566 6768 696a 6b6c 6d6e 6f70 7172 7374 efghijklmnopqrst 0x0030 7576 7761 6263 6465 6667 6869 uvwabcdefghi 12:42:03.341193 war-room.netsec > 10.0.0.210: icmp: echo reply (ttl 64, id 41824, len 60) 0x0000 4500 003c a360 0000 4001 c276 0a00 0019 E..<.`[email protected].... 0x0010 0a00 00d2 0000 515c 0200 0200 6162 6364 ......Q\....abcd 0x0020 6566 6768 696a 6b6c 6d6e 6f70 7172 7374 efghijklmnopqrst 0x0030 7576 7761 6263 6465 6667 6869 uvwabcdefghi
Figure 4.9: Tcpdump of a ping from a Windows box
An analysis of this packet stream yields the same results as that of Figure 4.7, with
the exception of a LEN size of 60 bytes which translates to,
Bytes Designation 20 IP header 8 ICMP header 32 ICMP data
Table 4.2: Breakdown of LEN size from packet 1 in Figure 4.9
Because of the similarity with common diagnostic tools such as Ping, the ICMP
echo request feature in Xprobe2 is not a good characteristic to use for detection.
However, often the TTL value is used as a means for detecting operating systems.
Without the assistance of other characteristics found in target replies (which will be
96

covered later), using the TTL values alone to detect operating systems has proven
at times to be inaccurate. Although not a common practice, TTL values can be
modified to mask the true identity of operating systems. Some common operating
system TTLs are listed in Table 4.11.
Operating System TCP-TTL
UDP-TTL Operating System
TCP-TTL
UDP-TTL
AIX 60 30 Solaris 2.x 255 255 DEC Pathworks V5 30 30 SunOS 4.1.3/4.1.4 60 60
FreeBSD 2.1R 64 64 Ultrix V4.1/V4.2A 60 30 HP/UX 9.0x 30 30 VMS/Multinet 64 64 HP/UX 10.01 64 64 VMS/TCPware 60 64
Irix 5.3 60 60 VMS/Wollongong
1.1.1.1 128 30
Irix 6.x 60 60 VMS/UCX (latest
rel.) 128 128 Linux 64 64 MS WfW 32 32
MacOS/MacTCP 2.0.x 60 60 MS Windows 95 32 32
OS/2 TCP/IP 3.0 64 64 MS Windows NT
3.51 32 32 OSF/1 V3.2A 60 30 MS Windows NT 4.0 128 128
Table 4.3: Default TTL Values in TCP/IP [101]
Another observation worth mentioning is the difference with the data in the
echo reply. Although RFC 792 states that the data sent in an echo request must be
returned in the echo reply, we found that this does not hold true with any of the
operating systems we used in our experiments.
Port scanning:
To determine what ports are listening on the target with Xprobe2, we used
xprobe2 –M 5 –P –T <port/port range> <host>
97

This command sequence loads module 5, puts Xprobe2 in port scanning mode and
tells Xprobe2 to scan the ports specified. As we mentioned earlier, the output for
these options is quit different from that of host scanning. User output looks like
this:
[+] Target is 10.0.0.25 [+] Loading modules. [+] Following modules are loaded: [x] [1] infogather:portscan - TCP and UDP PortScanner [+] 1 modules registered [+] Initializing scan engine [+] Running scan engine [+] All alive tests disabled [+] Target: 10.0.0.25 is alive. Round-Trip Time: 0.00000 sec [+] Selected safe Round-Trip Time value is: 10.00000 sec [+] Portscan results for 10.0.0.25: [+] Stats: [+] TCP: 1 - open, 0 - closed, 0 - filtered [+] UDP: 0 - open, 0 - closed, 0 - filtered [+] Portscan took 0.02 seconds. [+] Details: [+] Proto Port Num. State Serv. Name [+] TCP 22 open ssh [+] All fingerprinting modules were disabled [+] Cleaning up scan engine [+] Modules deinitialized [+] Execution completed.
Figure 4.10: User output from xprobe2 –M 5 –P –T <port/port range> <host>
98
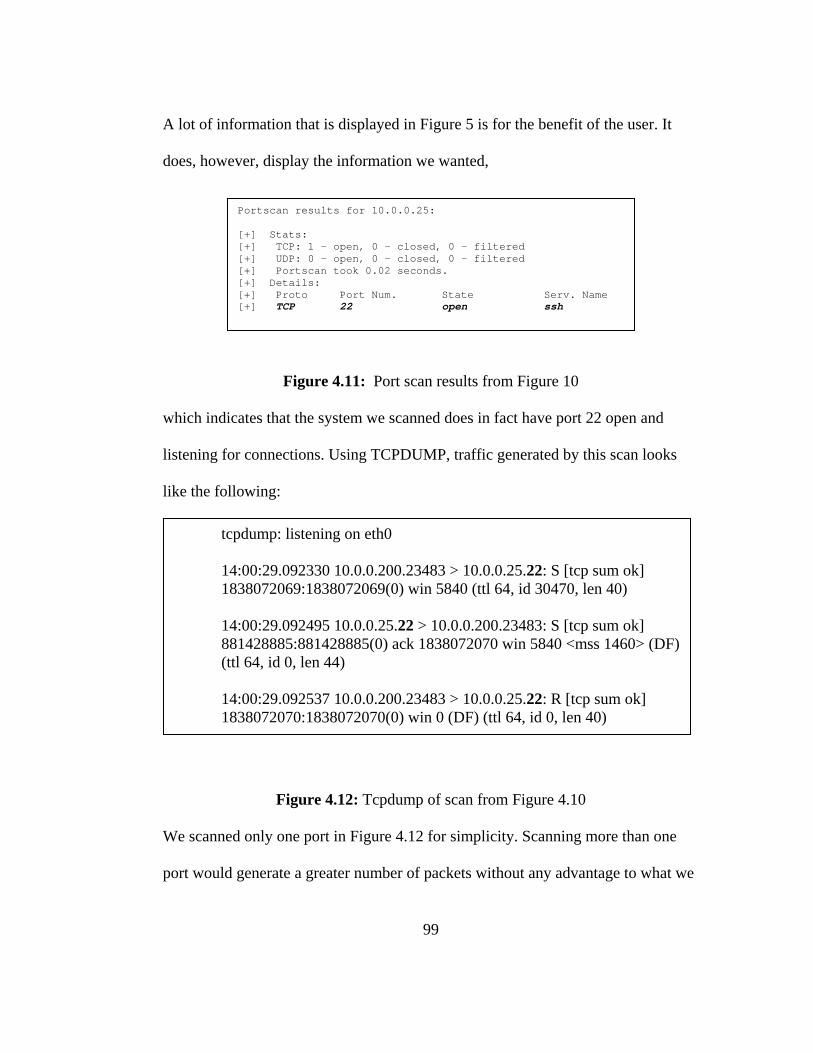
A lot of information that is displayed in Figure 5 is for the benefit of the user. It
does, however, display the information we wanted,
which indi
listening fo
like the fol
tc 11 18(t 11
We scanne
port would
Portscan results for 10.0.0.25: [+] Stats: [+] TCP: 1 - open, 0 - closed, 0 - filtered [+] UDP: 0 - open, 0 - closed, 0 - filtered [+] Portscan took 0.02 seconds. [+] Details: [+] Proto Port Num. State Serv. Name [+] TCP 22 open ssh
Figure 4.11: Port scan results from Figure 10
cates that the system we scanned does in fact have port 22 open and
r connections. Using TCPDUMP, traffic generated by this scan looks
lowing:
pdump: listening on eth0
4:00:29.092330 10.0.0.200.23483 > 10.0.0.25.22: S [tcp sum ok] 838072069:1838072069(0) win 5840 (ttl 64, id 30470, len 40)
4:00:29.092495 10.0.0.25.22 > 10.0.0.200.23483: S [tcp sum ok] 81428885:881428885(0) ack 1838072070 win 5840 <mss 1460> (DF) tl 64, id 0, len 44)
4:00:29.092537 10.0.0.200.23483 > 10.0.0.25.22: R [tcp sum ok] 838072070:1838072070(0) win 0 (DF) (ttl 64, id 0, len 40)
Figure 4.12: Tcpdump of scan from Figure 4.10
d only one port in Figure 4.12 for simplicity. Scanning more than one
generate a greater number of packets without any advantage to what we
99

are presenting. If 50 ports would have been scanned, the traffic generated for each
scan would have the same characteristics. At first glance this traffic might look like
a normal TCP SYN packet, but close examination will prove otherwise.
Analyzing the first packet,
14:00:29.092330 10.0.0.200.23483 > 10.0.0.25.22: S [tcp sum ok]
1838072069:1838072069(0) win 5840 (ttl 64, id 30470, len 40)
Figure 4.13: First packet from Figure 4.12
we conclude that the protocol being used is TCP, the SYN flag is initiated, the
source system might be using a Unix type operating system because of the size of
the TTL, and this is the initial packet in a TCP handshake
An observation that merits the most attention about the packet in Figure
4.13, is that it is an initial TCP SYN packet, and is only 40 bytes in length. Almost
all the operating systems use at least one TCP option in the SYN packet. Normally
this would be the MSS, or Maximum Segment Size, an option which is 4 bytes in
length [102]. The minimum size for a SYN packet should be 44 bytes; 20 bytes for
the IP header, 20 bytes for the TCP header and 4 bytes for the MSS option.
Absence of the MSS option in a SYN packet makes the total length only 40 bytes,
which indicates that the SYN packet is crafted. A crafted packet means that the
packet was generated by something other than a network device. Typically, a 40
byte SYN packet is a characteristic of a SYN scanner. There are a number of tools
100

that perform this type of scan, and because of the commonality with other such
tools we can not use this characteristic as a means for detecting Xprobe2. However,
if this type of activity is detected, it can be concluded that a scanning tool is being
used against the network.
Generate Fingerprint
This feature allows one to build fingerprints of the devices on a network.
This can be extremely useful when building an overall fingerprint of an
infrastructure. Custom fingerprints can also assist in network audits. This feature
can be executed with the following command,
xprobe2 -F -M 6 -M 7 -M 8 -M 9 -M 10 -M 11 10.0.0.26
It is important to know that these commands can be scripted for simplicity. For
example,
#!/bin/sh # Name: fprint # Description: generate a fingerprint of the target device echo –n “Enter Target: “ read target xprobe2 -F -M 6 -M 7 -M 8 -M 9 -M 10 –M 11 $target
Figure 4.14: Shell script using xprobe command
User output for the command in Figure 4.14 is as follows,
101
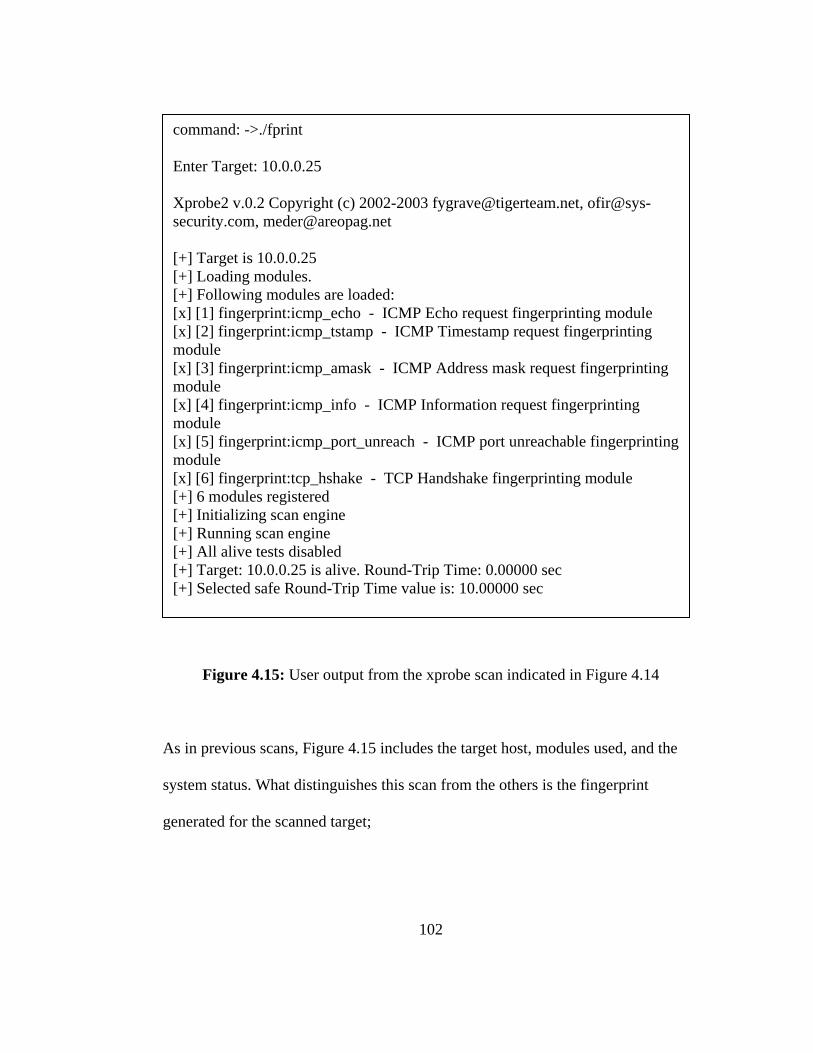
A
s
g
command: ->./fprint Enter Target: 10.0.0.25 Xprobe2 v.0.2 Copyright (c) 2002-2003 [email protected], [email protected], [email protected] [+] Target is 10.0.0.25 [+] Loading modules. [+] Following modules are loaded: [x] [1] fingerprint:icmp_echo - ICMP Echo request fingerprinting module [x] [2] fingerprint:icmp_tstamp - ICMP Timestamp request fingerprinting module [x] [3] fingerprint:icmp_amask - ICMP Address mask request fingerprinting module [x] [4] fingerprint:icmp_info - ICMP Information request fingerprinting module [x] [5] fingerprint:icmp_port_unreach - ICMP port unreachable fingerprintingmodule [x] [6] fingerprint:tcp_hshake - TCP Handshake fingerprinting module [+] 6 modules registered [+] Initializing scan engine [+] Running scan engine [+] All alive tests disabled [+] Target: 10.0.0.25 is alive. Round-Trip Time: 0.00000 sec [+] Selected safe Round-Trip Time value is: 10.00000 sec
Figure 4.15: User output from the xprobe scan indicated in Figure 4.14
s in previous scans, Figure 4.15 includes the target host, modules used, and the
ystem status. What distinguishes this scan from the others is the fingerprint
enerated for the scanned target;
102
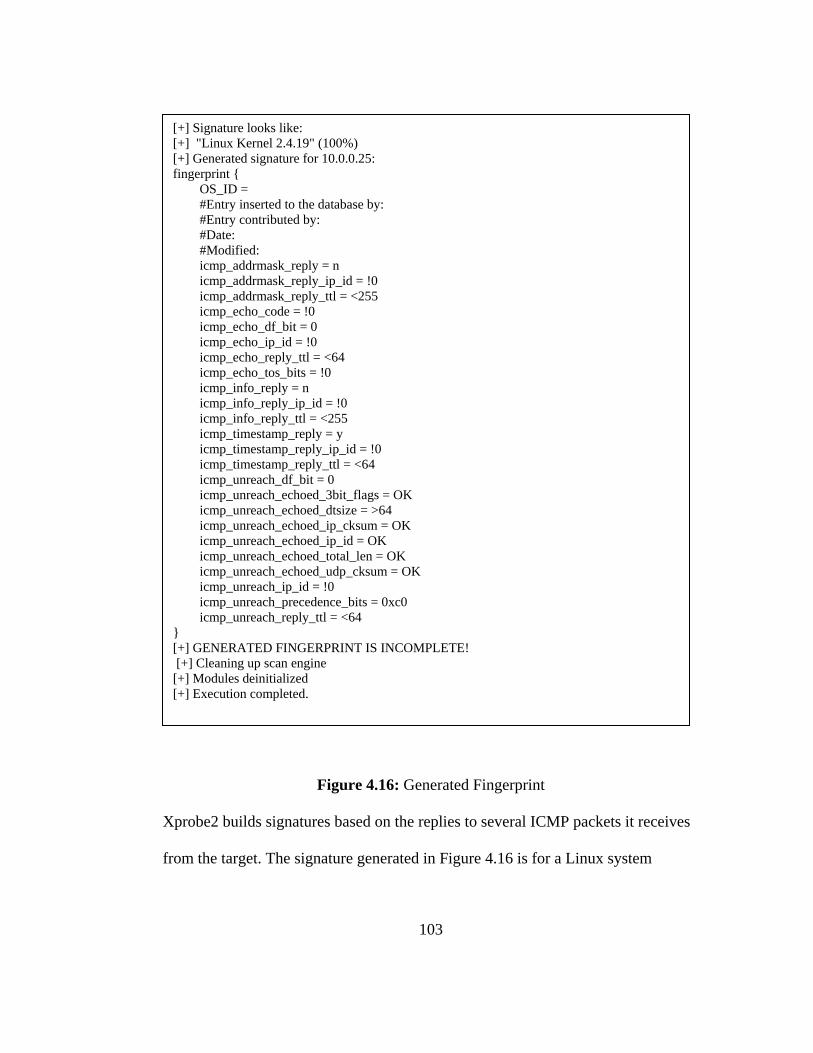
[+] Signature looks like: [+] "Linux Kernel 2.4.19" (100%) [+] Generated signature for 10.0.0.25: fingerprint { OS_ID = #Entry inserted to the database by: #Entry contributed by: #Date: #Modified: icmp_addrmask_reply = n icmp_addrmask_reply_ip_id = !0 icmp_addrmask_reply_ttl = <255 icmp_echo_code = !0 icmp_echo_df_bit = 0 icmp_echo_ip_id = !0 icmp_echo_reply_ttl = <64 icmp_echo_tos_bits = !0 icmp_info_reply = n icmp_info_reply_ip_id = !0 icmp_info_reply_ttl = <255 icmp_timestamp_reply = y icmp_timestamp_reply_ip_id = !0 icmp_timestamp_reply_ttl = <64 icmp_unreach_df_bit = 0 icmp_unreach_echoed_3bit_flags = OK icmp_unreach_echoed_dtsize = >64 icmp_unreach_echoed_ip_cksum = OK icmp_unreach_echoed_ip_id = OK icmp_unreach_echoed_total_len = OK icmp_unreach_echoed_udp_cksum = OK icmp_unreach_ip_id = !0 icmp_unreach_precedence_bits = 0xc0 icmp_unreach_reply_ttl = <64 } [+] GENERATED FINGERPRINT IS INCOMPLETE! [+] Cleaning up scan engine [+] Modules deinitialized [+] Execution completed.
Figure 4.16: Generated Fingerprint
Xprobe2 builds signatures based on the replies to several ICMP packets it receives
from the target. The signature generated in Figure 4.16 is for a Linux system
103
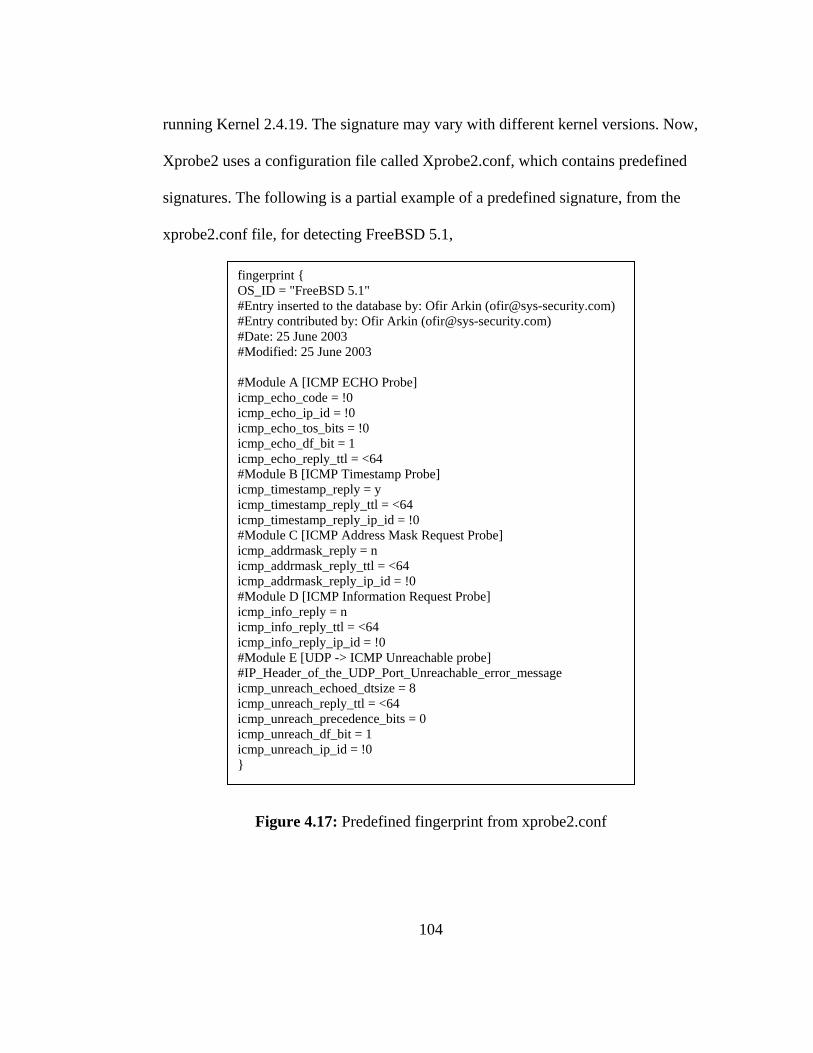
running Kernel 2.4.19. The signature may vary with different kernel versions. Now,
Xprobe2 uses a configuration file called Xprobe2.conf, which contains predefined
signatures. The following is a partial example of a predefined signature, from the
xprobe2.conf file, for detecting FreeBSD 5.1,
fingerprint { OS_ID = "FreeBSD 5.1" #Entry inserted to the database by: Ofir Arkin ([email protected]) #Entry contributed by: Ofir Arkin ([email protected]) #Date: 25 June 2003 #Modified: 25 June 2003 #Module A [ICMP ECHO Probe] icmp_echo_code = !0 icmp_echo_ip_id = !0 icmp_echo_tos_bits = !0 icmp_echo_df_bit = 1 icmp_echo_reply_ttl = <64 #Module B [ICMP Timestamp Probe] icmp_timestamp_reply = y icmp_timestamp_reply_ttl = <64 icmp_timestamp_reply_ip_id = !0 #Module C [ICMP Address Mask Request Probe] icmp_addrmask_reply = n icmp_addrmask_reply_ttl = <64 icmp_addrmask_reply_ip_id = !0 #Module D [ICMP Information Request Probe] icmp_info_reply = n icmp_info_reply_ttl = <64 icmp_info_reply_ip_id = !0 #Module E [UDP -> ICMP Unreachable probe] #IP_Header_of_the_UDP_Port_Unreachable_error_message icmp_unreach_echoed_dtsize = 8 icmp_unreach_reply_ttl = <64 icmp_unreach_precedence_bits = 0 icmp_unreach_df_bit = 1 icmp_unreach_ip_id = !0 }
Figure 4.17: Predefined fingerprint from xprobe2.conf
104
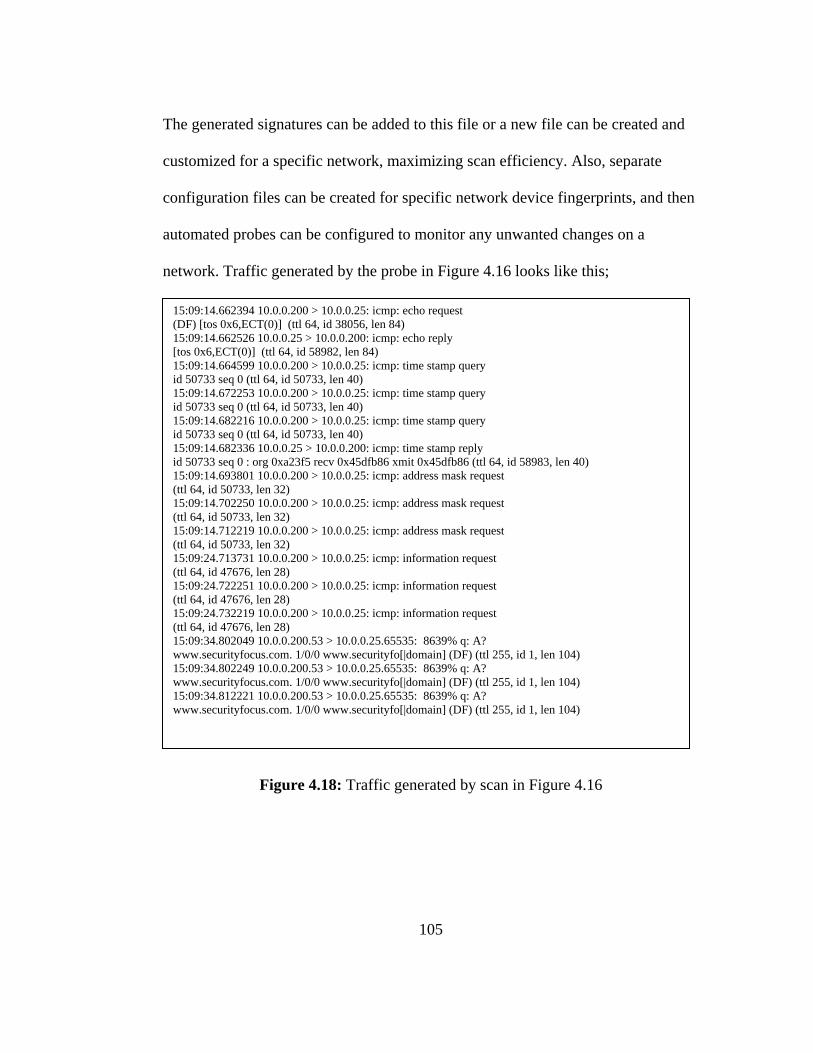
The generated signatures can be added to this file or a new file can be created and
customized for a specific network, maximizing scan efficiency. Also, separate
configuration files can be created for specific network device fingerprints, and then
automated probes can be configured to monitor any unwanted changes on a
network. Traffic generated by the probe in Figure 4.16 looks like this;
15:09:14.662394 10.0.0.200 > 10.0.0.25: icmp: echo request (DF) [tos 0x6,ECT(0)] (ttl 64, id 38056, len 84) 15:09:14.662526 10.0.0.25 > 10.0.0.200: icmp: echo reply [tos 0x6,ECT(0)] (ttl 64, id 58982, len 84) 15:09:14.664599 10.0.0.200 > 10.0.0.25: icmp: time stamp query id 50733 seq 0 (ttl 64, id 50733, len 40) 15:09:14.672253 10.0.0.200 > 10.0.0.25: icmp: time stamp query id 50733 seq 0 (ttl 64, id 50733, len 40) 15:09:14.682216 10.0.0.200 > 10.0.0.25: icmp: time stamp query id 50733 seq 0 (ttl 64, id 50733, len 40) 15:09:14.682336 10.0.0.25 > 10.0.0.200: icmp: time stamp reply id 50733 seq 0 : org 0xa23f5 recv 0x45dfb86 xmit 0x45dfb86 (ttl 64, id 58983, len 40) 15:09:14.693801 10.0.0.200 > 10.0.0.25: icmp: address mask request (ttl 64, id 50733, len 32) 15:09:14.702250 10.0.0.200 > 10.0.0.25: icmp: address mask request (ttl 64, id 50733, len 32) 15:09:14.712219 10.0.0.200 > 10.0.0.25: icmp: address mask request (ttl 64, id 50733, len 32) 15:09:24.713731 10.0.0.200 > 10.0.0.25: icmp: information request (ttl 64, id 47676, len 28) 15:09:24.722251 10.0.0.200 > 10.0.0.25: icmp: information request (ttl 64, id 47676, len 28) 15:09:24.732219 10.0.0.200 > 10.0.0.25: icmp: information request (ttl 64, id 47676, len 28) 15:09:34.802049 10.0.0.200.53 > 10.0.0.25.65535: 8639% q: A? www.securityfocus.com. 1/0/0 www.securityfo[|domain] (DF) (ttl 255, id 1, len 104) 15:09:34.802249 10.0.0.200.53 > 10.0.0.25.65535: 8639% q: A? www.securityfocus.com. 1/0/0 www.securityfo[|domain] (DF) (ttl 255, id 1, len 104) 15:09:34.812221 10.0.0.200.53 > 10.0.0.25.65535: 8639% q: A? www.securityfocus.com. 1/0/0 www.securityfo[|domain] (DF) (ttl 255, id 1, len 104)
Figure 4.18: Traffic generated by scan in Figure 4.16
105
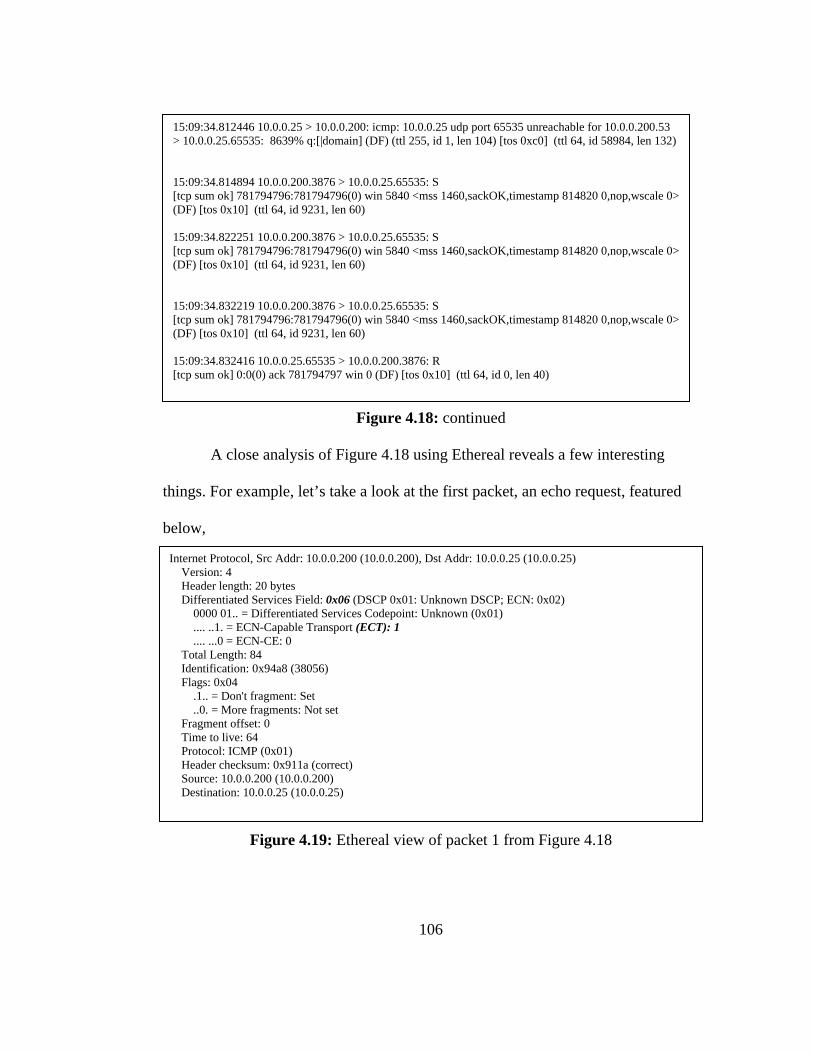
Figure 4.18: continued
A close analysis of Figure 4.18 using Ethereal reveals a few interesting
things. For example, let’s take a look at the first packet, an echo request, featured
below,
Internet Protocol, Src Addr: 10.0.0.200 (10.0.0.200), Dst Addr: 10.0.0.25 (10.0.0.25) Version: 4 Header length: 20 bytes Differentiated Services Field: 0x06 (DSCP 0x01: Unknown DSCP; ECN: 0x02) 0000 01.. = Differentiated Services Codepoint: Unknown (0x01) .... ..1. = ECN-Capable Transport (ECT): 1 .... ...0 = ECN-CE: 0 Total Length: 84 Identification: 0x94a8 (38056) Flags: 0x04 .1.. = Don't fragment: Set ..0. = More fragments: Not set Fragment offset: 0 Time to live: 64 Protocol: ICMP (0x01) Header checksum: 0x911a (correct) Source: 10.0.0.200 (10.0.0.200) Destination: 10.0.0.25 (10.0.0.25)
15:09:34.812446 10.0.0.25 > 10.0.0.200: icmp: 10.0.0.25 udp port 65535 unreachable for 10.0.0.200.53 > 10.0.0.25.65535: 8639% q:[|domain] (DF) (ttl 255, id 1, len 104) [tos 0xc0] (ttl 64, id 58984, len 132) 15:09:34.814894 10.0.0.200.3876 > 10.0.0.25.65535: S [tcp sum ok] 781794796:781794796(0) win 5840 <mss 1460,sackOK,timestamp 814820 0,nop,wscale 0> (DF) [tos 0x10] (ttl 64, id 9231, len 60) 15:09:34.822251 10.0.0.200.3876 > 10.0.0.25.65535: S [tcp sum ok] 781794796:781794796(0) win 5840 <mss 1460,sackOK,timestamp 814820 0,nop,wscale 0> (DF) [tos 0x10] (ttl 64, id 9231, len 60) 15:09:34.832219 10.0.0.200.3876 > 10.0.0.25.65535: S [tcp sum ok] 781794796:781794796(0) win 5840 <mss 1460,sackOK,timestamp 814820 0,nop,wscale 0> (DF) [tos 0x10] (ttl 64, id 9231, len 60) 15:09:34.832416 10.0.0.25.65535 > 10.0.0.200.3876: R [tcp sum ok] 0:0(0) ack 781794797 win 0 (DF) [tos 0x10] (ttl 64, id 0, len 40)
Figure 4.19: Ethereal view of packet 1 from Figure 4.18
106

Internet Control Message Protocol Type: 8 (Echo (ping) request) Code: 123 Checksum: 0xcfc3 Identifier: 0xc62d Sequence number: 00:01 Data (56 bytes) 0000 00 08 74 29 18 51 00 02 a5 03 e5 53 08 00 45 06 ..t).Q.....S..E. 0010 00 54 94 a8 40 00 40 01 91 1a 0a 00 00 c8 0a 00 .T..@.@......... 0020 00 19 08 7b cf c3 c6 2d 00 01 40 57 5e ea 00 09 ...{...-..@W^... 0030 d7 44 08 09 0a 0b 0c 0d 0e 0f 10 11 12 13 14 15 .D.............. 0040 16 17 18 19 1a 1b 1c 1d 1e 1f 20 21 22 23 24 25 .......... !"#$% 0050 26 27 28 29 2a 2b 2c 2d 2e 2f 30 31 32 33 34 35 &'()*+,-./0123450050 26 27 28 29 2a 2b 2c 2d 2e 2f 30 31 32 33 34 35 &'()*+,-./012345
Figure 4.19: continued
In this case, the total packet size is 84 bytes, which breaks down as follows,
- 8 bytes for the ICMP header
- 56 bytes for the Data
- 20 bytes for the IP header
which is correct according to RFC 792. An ICMP type 8 echo request should use
code 0, not 123 and the type of service should also be 0, not 6. For the valid codes
for ICMP type 8 please refer to appendix B.
Further inspection of Capture 14 reveals a few more unique identifiers that
can assist in detecting Xprobe2,
- ICMP information request, type 15
- ICMP address mask request, type 17
- DNS responses to port 65535
107

The first two request types are intended for diskless workstations at boot time, so if
there are no such systems on a network then this is certainly a good indicator of
possible malicious intent.
Another interesting characteristic about the capture in Figure 4.18 are the
DNS packets. We’ve isolated the DNS packets in Figure 4.20 for easier analysis.
The field “q: A?” in the first packet indicates that the packet is a response to a DNS
query by an authoritative name server. Also, the alleged query was for the
“www.securityfocus.com” website and the response was sent to port 65535 on the
target system. The first three packets in Figure 4.20 all have the identical
characteristics.
15:09:34.802049 10.0.0.200.53 > 10.0.0.25.65535: 8639% q: A? www.securityfocus.com. 1/0/0 www.securityfo[|domain] (DF) (ttl 255, id 1, len 104) 15:09:34.802249 10.0.0.200.53 > 10.0.0.25.65535: 8639% q: A? www.securityfocus.com. 1/0/0 www.securityfo[|domain] (DF) (ttl 255, id 1, len 104) 15:09:34.812221 10.0.0.200.53 > 10.0.0.25.65535: 8639% q: A? www.securityfocus.com. 1/0/0 www.securityfo[|domain] (DF) (ttl 255, id 1, len 104) 15:09:34.812446 10.0.0.25 > 10.0.0.200: icmp: 10.0.0.25 udp port 65535 unreachable for 10.0.0.200.53 > 10.0.0.25.65535: 8639% q:[|domain] (DF) (ttl 255, id 1, len 104) [tos 0xc0] (ttl 64, id 58984, len 132)
Figure 4.20: DNS packets from Figure 4.18
To verify that this was not some error in the program we ran the same scan on three
other systems and obtained the same results. Therefore Xprobe2 sends out
responses to unsolicited DNS queries using the same website in the DNS response
108

to a port, which is beyond what is normally used, port 65535. Breaking down the
first packet for a closer analysis reveals a few more interesting characteristics,
Field Description
15:09:34.802049 time stamp
10.0.0.200.53 > 10.0.0.25.65535 src and dst
q: A? www.securityfocus.com query type A to domain www.securityfocus.com
1/0/0 www.securityfo[|domain] 1 Resource record
0 Authority Resource Records 0 Additional Resource Records
DNS packet len 104 length of the DNS packet header and response data
Table 4.4: DNS Packet Decoding
At first glance this packet appears normal. However, further inspection reveals
additional characteristics that make the packets in Figure 15 suspicious,
- They are all type A query responses to queries that were never made
- The query type is always the same
- The resource record responses, 1/0/0, are always the same
- The responses to the alleged DNS query is always
www.securityfocus.com
Taking the analysis a step further, we perform a DNS look up on
www.securityfocus.com,
109
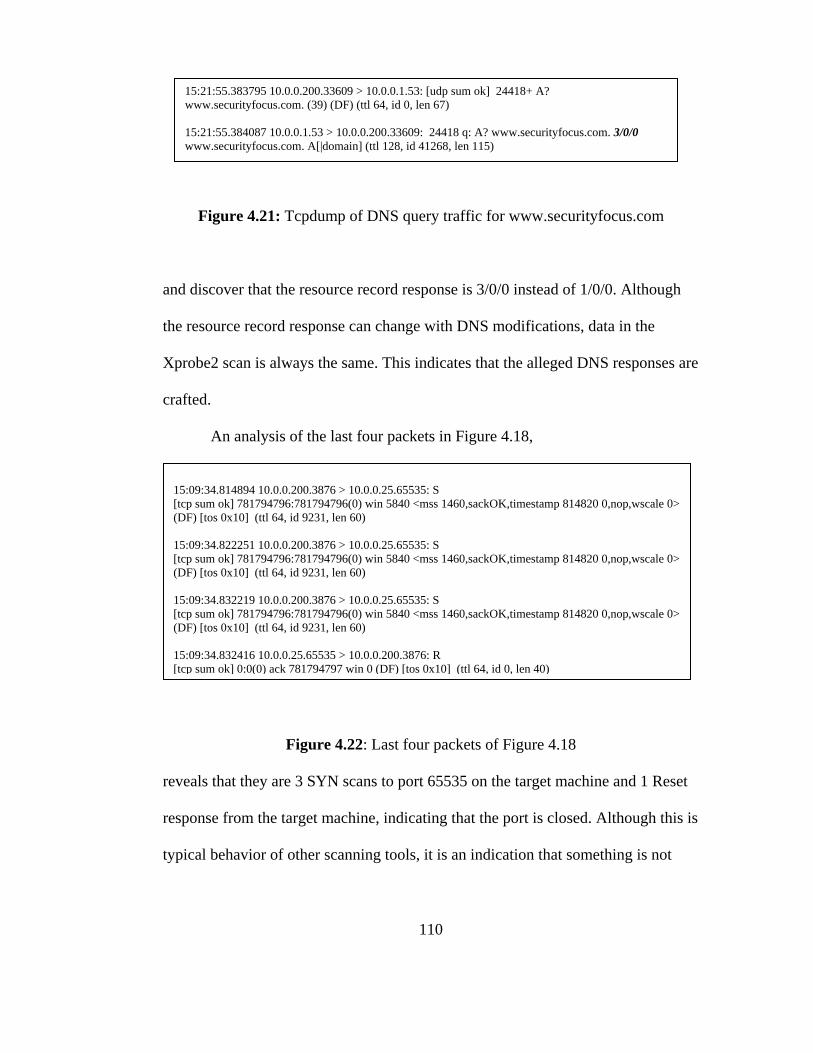
an
the
Xp
cra
1[( 1[( 1[( 1[
rev
res
typ
15:21:55.383795 10.0.0.200.33609 > 10.0.0.1.53: [udp sum ok] 24418+ A? www.securityfocus.com. (39) (DF) (ttl 64, id 0, len 67) 15:21:55.384087 10.0.0.1.53 > 10.0.0.200.33609: 24418 q: A? www.securityfocus.com. 3/0/0 www.securityfocus.com. A[|domain] (ttl 128, id 41268, len 115)
Figure 4.21: Tcpdump of DNS query traffic for www.securityfocus.com
d discover that the resource record response is 3/0/0 instead of 1/0/0. Although
resource record response can change with DNS modifications, data in the
robe2 scan is always the same. This indicates that the alleged DNS responses are
fted.
An analysis of the last four packets in Figure 4.18,
5:09:34.814894 10.0.0.200.3876 > 10.0.0.25.65535: S tcp sum ok] 781794796:781794796(0) win 5840 <mss 1460,sackOK,timestamp 814820 0,nop,wscale 0> DF) [tos 0x10] (ttl 64, id 9231, len 60)
5:09:34.822251 10.0.0.200.3876 > 10.0.0.25.65535: S tcp sum ok] 781794796:781794796(0) win 5840 <mss 1460,sackOK,timestamp 814820 0,nop,wscale 0> DF) [tos 0x10] (ttl 64, id 9231, len 60)
5:09:34.832219 10.0.0.200.3876 > 10.0.0.25.65535: S tcp sum ok] 781794796:781794796(0) win 5840 <mss 1460,sackOK,timestamp 814820 0,nop,wscale 0> DF) [tos 0x10] (ttl 64, id 9231, len 60)
5:09:34.832416 10.0.0.25.65535 > 10.0.0.200.3876: R tcp sum ok] 0:0(0) ack 781794797 win 0 (DF) [tos 0x10] (ttl 64, id 0, len 40)
Figure 4.22: Last four packets of Figure 4.18
eals that they are 3 SYN scans to port 65535 on the target machine and 1 Reset
ponse from the target machine, indicating that the port is closed. Although this is
ical behavior of other scanning tools, it is an indication that something is not
110

right, especially if it is known that there are no services running on port 65535 of
the target system.
The fingerprinting scan provides 4 identifiers that can be used to identify
Xprobe2. They are,
1) DSS and ICMP Code value for echo request.
Packet Fields Xprobe2 correct value DSS 6 0 Code 123 0
Table 4.5: DSS and ICMP Code value for Xprobe2 echo request
2) ICMP Type 15 and 17 requests.
ICMP Description 15 support of self configuring systems such as diskless stations 17 assists diskless systems to obtain its subnet mask at boot time
Table 4.6: ICMP Types in Xprobe2 scan
3) The DNS responses to queries that were never made with
www.securityfocus.com in the data.
4) SYN scan to port 65535. Although this is typical of other scanning
tools, the fact that this scan targets port 65535 can help re-enforce the
conclusion when searching for the use of this tool on a network.
111

OS finger printing
OS fingerprinting is the main premise behind Xprobe2. To determine what
type of operating system is running on a target we would execute Xprobe2 as
follows,
xprobe2 -M 6 -M 7 -M 8 -M 9 -M 10 –M 11 $target
Options used here are essentially the same as when generating a fingerprint, except
for omitting the –F option. Also, the data generated is nearly identical,
- Crafted type 8 ICMP packets.
- ICMP Address mask and information request packets.
- DNS responses to requests never made to port 65535.
- SYN scan to port 65535.
Complete Xprobe2 scan analysis:
Let us now take a look at a complete scan of Xprobe2 using all of the
available modules. The output generated is as follows,
112

[+] Target is 10.0.0.25 [+] Loading modules. [+] Following modules are loaded: [x] [1] ping:icmp_ping - ICMP echo discovery module [x] [2] ping:tcp_ping - TCP-based ping discovery module [x] [3] ping:udp_ping - UDP-based ping discovery module [x] [4] infogather:ttl_calc - TCP and UDP based TTL distance calculation [x] [5] infogather:portscan - TCP and UDP PortScanner [x] [6] fingerprint:icmp_echo - ICMP Echo request fingerprinting module [x] [7] fingerprint:icmp_tstamp - ICMP Timestamp request fingerprinting module [x] [8] fingerprint:icmp_amask - ICMP Address mask request fingerprinting module [x] [9] fingerprint:icmp_info - ICMP Information request fingerprinting module [x] [10] fingerprint:icmp_port_unreach - ICMP port unreachable fingerprinting module [x] [11] fingerprint:tcp_hshake - TCP Handshake fingerprinting module [+] 11 modules registered [+] Initializing scan engine [+] Running scan engine [-] ping:tcp_ping module: no closed/open TCP ports known on 10.0.0.25. Module test failed[-] ping:udp_ping module: no closed/open UDP ports known on 10.0.0.25. Module test failed [+] No distance calculation. 10.0.0.25 appears to be dead or no ports known [+] Host: 10.0.0.25 is up (Guess probability: 25%) [+] Target: 10.0.0.25 is alive. Round-Trip Time: 0.01707 sec [+] Selected safe Round-Trip Time value is: 0.03414 sec [+] Primary guess: [+] Host 10.0.0.25 Running OS: "Linux Kernel 2.4.19" (Guess probability: 70%) [+] Other guesses: [+] Host 10.0.0.25 Running OS: "Linux Kernel 2.4.20" (Guess probability: 70%) [+] Host 10.0.0.25 Running OS: "Linux Kernel 2.4.21" (Guess probability: 70%) [+] Host 10.0.0.25 Running OS: "Linux Kernel 2.0.36" (Guess probability: 70%) [+] Host 10.0.0.25 Running OS: "Linux Kernel 2.0.34" (Guess probability: 70%) [+] Host 10.0.0.25 Running OS: "Linux Kernel 2.0.30" (Guess probability: 70%) [+] Host 10.0.0.25 Running OS: "Linux Kernel 2.2.5" (Guess probability: 61%) [+] Host 10.0.0.25 Running OS: "Linux Kernel 2.2.6" (Guess probability: 61%) [+] Host 10.0.0.25 Running OS: "Linux Kernel 2.2.7" (Guess probability: 61%) [+] Host 10.0.0.25 Running OS: "Linux Kernel 2.2.8" (Guess probability: 61%) [+] Cleaning up scan engine [+] Modules deinitialized [+] Execution completed.
Figure 4.23-A: Complete Xprobe2 scan user output
113

15:50:15.622447 10.0.0.200 > 10.0.0.25: icmp: echo request (ttl 64, id 45014, len 84) 15:50:15.622585 10.0.0.25 > 10.0.0.200: icmp: echo reply (ttl 64, id 51858, len 84) 15:50:15.642245 10.0.0.200 > 10.0.0.25: icmp: echo request (DF) [tos 0x6,ECT(0)] (ttl 64, id 16862, len 84) 15:50:15.642389 10.0.0.25 > 10.0.0.200: icmp: echo reply [tos 0x6,ECT(0)] (ttl 64, id 51859, len 84) 15:50:15.644622 10.0.0.200 > 10.0.0.25: icmp: time stamp query id 45014 seq 0 (ttl 64, id 45014, len 40)15:50:15.652248 10.0.0.200 > 10.0.0.25: icmp: time stamp query id 45014 seq 0 (ttl 64, id 45014, len 40)15:50:15.662216 10.0.0.200 > 10.0.0.25: icmp: time stamp query id 45014 seq 0 (ttl 64, id 45014, len 40)15:50:15.662374 10.0.0.25 > 10.0.0.200: icmp: time stamp reply id 45014 seq 0 : org 0x9d5ef recv 0x4838916 xmit 0x4838916 (ttl 64, id 51860, len 40) 15:50:15.663757 10.0.0.200 > 10.0.0.25: icmp: address mask request (ttl 64, id 45014, len 32) 15:50:15.672248 10.0.0.200 > 10.0.0.25: icmp: address mask request (ttl 64, id 45014, len 32) 15:50:15.682217 10.0.0.200 > 10.0.0.25: icmp: address mask request (ttl 64, id 45014, len 32) 15:50:15.723497 10.0.0.200 > 10.0.0.25: icmp: information request (ttl 64, id 45014, len 28) 15:50:15.732246 10.0.0.200 > 10.0.0.25: icmp: information request (ttl 64, id 45014, len 28) 15:50:15.742216 10.0.0.200 > 10.0.0.25: icmp: information request (ttl 64, id 45014, len 28) 15:50:15.844855 10.0.0.200.53 > 10.0.0.25.65535: 38420% q: A? www.securityfocus.com. 1/0/0 www.securityfo[|domain] (DF) (ttl 255, id 1, len 104) 15:50:15.852249 10.0.0.200.53 > 10.0.0.25.65535: 38420% q: A? www.securityfocus.com. 1/0/0 www.securityfo[|domain] (DF) (ttl 255, id 1, len 104) 15:50:15.862218 10.0.0.200.53 > 10.0.0.25.65535: 38420% q: A? www.securityfocus.com. 1/0/0 www.securityfo[|domain] (DF) (ttl 255, id 1, len 104) 15:50:15.862381 10.0.0.25 > 10.0.0.200: icmp: 10.0.0.25 udp port 65535 unreachable for 10.0.0.200.53 > 10.0.0.25.65535: 38420% q:[|domain] (DF) (ttl 255, id 1, len 104) [tos 0xc0] (ttl 64, id 51861, len 132) 15:50:15.864840 10.0.0.200.54959 > 10.0.0.25.65535: S [tcp sum ok] 387072478:387072478(0) win 5840 <mss 1460,sackOK,timestamp 864765 0,nop,wscale 0> (DF) [tos 0x10] (ttl 64, id 45014, len 60) 15:50:15.872248 10.0.0.200.54959 > 10.0.0.25.65535: S [tcp sum ok] 387072478:387072478(0) win 5840 <mss 1460,sackOK,timestamp 864765 0,nop,wscale 0> (DF) [tos 0x10] (ttl 64, id 45014, len 60) 15:50:15.882217 10.0.0.200.54959 > 10.0.0.25.65535: S [tcp sum ok] 387072478:387072478(0) win 5840 <mss 1460,sackOK,timestamp 864765 0,nop,wscale 0> (DF) [tos 0x10] (ttl 64, id 45014, len 60) 15:50:15.882367 10.0.0.25.65535 > 10.0.0.200.54959: R [tcp sum ok] 0:0(0) ack 387072479 win 0 (DF) [tos 0x10] (ttl 64, id 0, len 40)
Figure 4.23-B: Tcpdump of Figure 4.23-B
A close look at the scan in Figure 4.23-A and the Tcpdump capture in Figure 4.23-
B will reveal that the information corresponds with the scans and captures
114
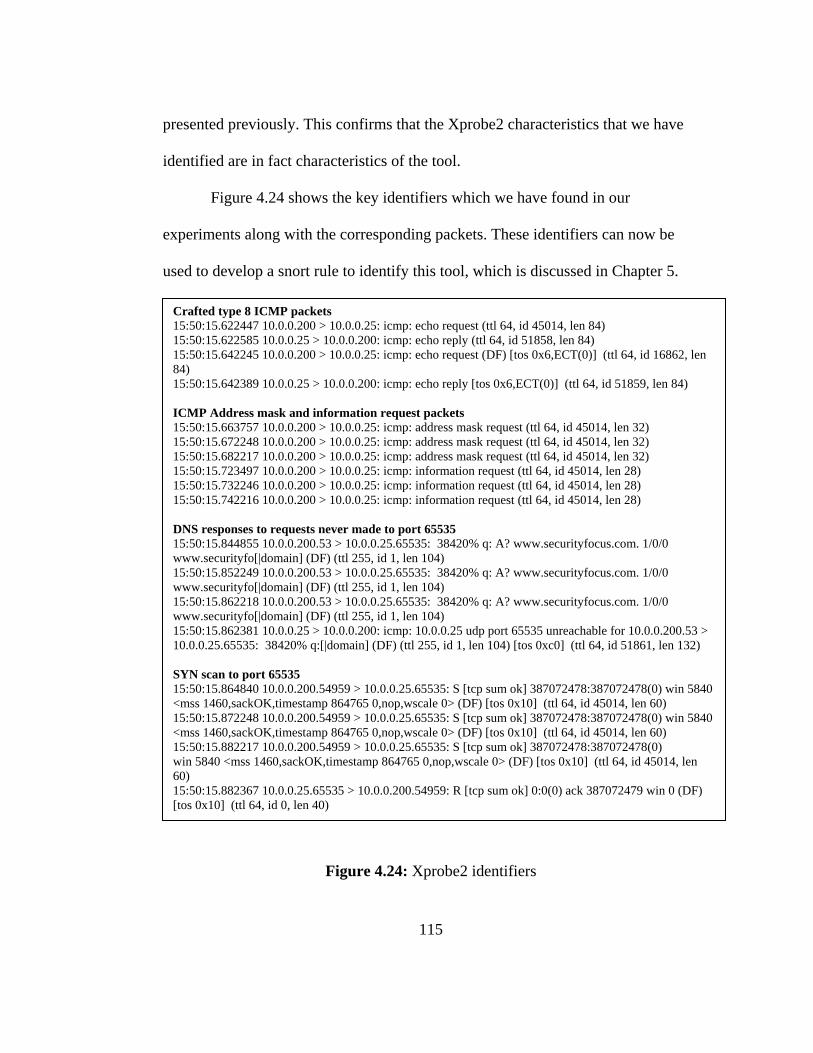
presented previously. This confirms that the Xprobe2 characteristics that we have
identified are in fact characteristics of the tool.
Figure 4.24 shows the key identifiers which we have found in our
experiments along with the corresponding packets. These identifiers can now be
used to develop a snort rule to identify this tool, which is discussed in Chapter 5.
Crafted type 8 ICMP packets 15:50:15.622447 10.0.0.200 > 10.0.0.25: icmp: echo request (ttl 64, id 45014, len 84) 15:50:15.622585 10.0.0.25 > 10.0.0.200: icmp: echo reply (ttl 64, id 51858, len 84) 15:50:15.642245 10.0.0.200 > 10.0.0.25: icmp: echo request (DF) [tos 0x6,ECT(0)] (ttl 64, id 16862, len 84) 15:50:15.642389 10.0.0.25 > 10.0.0.200: icmp: echo reply [tos 0x6,ECT(0)] (ttl 64, id 51859, len 84) ICMP Address mask and information request packets 15:50:15.663757 10.0.0.200 > 10.0.0.25: icmp: address mask request (ttl 64, id 45014, len 32) 15:50:15.672248 10.0.0.200 > 10.0.0.25: icmp: address mask request (ttl 64, id 45014, len 32) 15:50:15.682217 10.0.0.200 > 10.0.0.25: icmp: address mask request (ttl 64, id 45014, len 32) 15:50:15.723497 10.0.0.200 > 10.0.0.25: icmp: information request (ttl 64, id 45014, len 28) 15:50:15.732246 10.0.0.200 > 10.0.0.25: icmp: information request (ttl 64, id 45014, len 28) 15:50:15.742216 10.0.0.200 > 10.0.0.25: icmp: information request (ttl 64, id 45014, len 28) DNS responses to requests never made to port 65535 15:50:15.844855 10.0.0.200.53 > 10.0.0.25.65535: 38420% q: A? www.securityfocus.com. 1/0/0 www.securityfo[|domain] (DF) (ttl 255, id 1, len 104) 15:50:15.852249 10.0.0.200.53 > 10.0.0.25.65535: 38420% q: A? www.securityfocus.com. 1/0/0 www.securityfo[|domain] (DF) (ttl 255, id 1, len 104) 15:50:15.862218 10.0.0.200.53 > 10.0.0.25.65535: 38420% q: A? www.securityfocus.com. 1/0/0 www.securityfo[|domain] (DF) (ttl 255, id 1, len 104) 15:50:15.862381 10.0.0.25 > 10.0.0.200: icmp: 10.0.0.25 udp port 65535 unreachable for 10.0.0.200.53 > 10.0.0.25.65535: 38420% q:[|domain] (DF) (ttl 255, id 1, len 104) [tos 0xc0] (ttl 64, id 51861, len 132)
SYN scan to port 65535 15:50:15.864840 10.0.0.200.54959 > 10.0.0.25.65535: S [tcp sum ok] 387072478:387072478(0) win 5840 <mss 1460,sackOK,timestamp 864765 0,nop,wscale 0> (DF) [tos 0x10] (ttl 64, id 45014, len 60) 15:50:15.872248 10.0.0.200.54959 > 10.0.0.25.65535: S [tcp sum ok] 387072478:387072478(0) win 5840 <mss 1460,sackOK,timestamp 864765 0,nop,wscale 0> (DF) [tos 0x10] (ttl 64, id 45014, len 60) 15:50:15.882217 10.0.0.200.54959 > 10.0.0.25.65535: S [tcp sum ok] 387072478:387072478(0) win 5840 <mss 1460,sackOK,timestamp 864765 0,nop,wscale 0> (DF) [tos 0x10] (ttl 64, id 45014, len 60) 15:50:15.882367 10.0.0.25.65535 > 10.0.0.200.54959: R [tcp sum ok] 0:0(0) ack 387072479 win 0 (DF) [tos 0x10] (ttl 64, id 0, len 40)
Figure 4.24: Xprobe2 identifiers
115

Summary
Although our process for network traffic analysis appears to be straight
forward so far, the analysis becomes more difficult as we start to diagnose
reconnaissance methods which use more complicated protocols like TCP, IP and
UDP as we will discuss in the next few sections. Additional steps will be added, or
modified, as we go through the analysis of the reconnaissance technique that use
these protocols. Table 4.7 summarizes the initial steps for network reconnaissance
traffic analysis discussed in this section.
Method for Analyzing Network Reconnaissance traffic Setup mock network with at minimum three systems 1
running linux, 1 running winxp and 1 running win2k. Having both a switch and a hub handy would be helpful install/configure the tool to be analized in appropriate
environment Install sniffer on one of the systems. Preferrably all
three. capture traffic to a file or standard output
decode each packet using sniffer Analyze and verify packet field
Table 4.7: Initial steps for the method described in Section 4.2
116

4.3 TCP, IP and UDP reconnaissance: NMAP
Methods mentioned in the previous section can also be applied when
analyzing TCP, IP and UDP network reconnaissance. However, ICMP does not use
ports like TCP and UDP. ICMP does not require the complexity of having to
perform handshaking to setup an end-to-end connection to communicate like TCP.
With these additional characteristics, there is a lot more that a hacker can do to hide
his intent while doing a network reconnaissance. With a tool like NMAP, the
number of option combinations and methods a hacker can use to perform
reconnaissance is extensive; therefore we only look at option combinations which
apply to the protocols we analyze in this section. Also, since scans produce over
1000 packets, we use a sample of each scan in our illustrations. Tables 4.8 and 4.9
list the Nmap options based on the protocols analyzed:
Table 4.8: NMAP TCP Options
117

Table 4.9: NMAP IP and UDP Options
TCP Scan Options
We ran separate experiments for each of the options to analyze NMAP and
find characteristics we can use to identify it to generate a fingerprint. To analyze
Nmap traffic, in addition to the methods we used for Xprobe2, we also looked for
patterns and protocol violations in the packets generated. For example, Nmap –sS
<target> generates the following traffic:
Figure 4.25: Nmap SYN scan capture
118
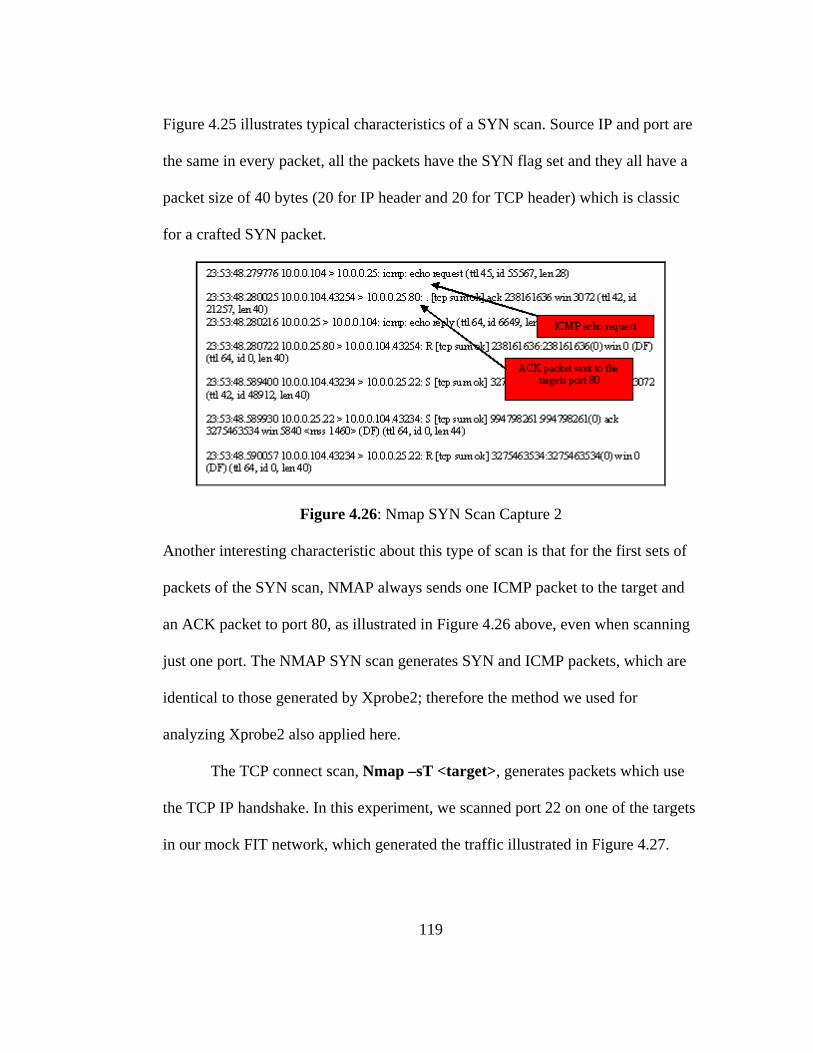
Figure 4.25 illustrates typical characteristics of a SYN scan. Source IP and port are
the same in every packet, all the packets have the SYN flag set and they all have a
packet size of 40 bytes (20 for IP header and 20 for TCP header) which is classic
for a crafted SYN packet.
Figure 4.26: Nmap SYN Scan Capture 2
Another interesting characteristic about this type of scan is that for the first sets of
packets of the SYN scan, NMAP always sends one ICMP packet to the target and
an ACK packet to port 80, as illustrated in Figure 4.26 above, even when scanning
just one port. The NMAP SYN scan generates SYN and ICMP packets, which are
identical to those generated by Xprobe2; therefore the method we used for
analyzing Xprobe2 also applied here.
The TCP connect scan, Nmap –sT <target>, generates packets which use
the TCP IP handshake. In this experiment, we scanned port 22 on one of the targets
in our mock FIT network, which generated the traffic illustrated in Figure 4.27.
119

Figure 4.27: NMAP TCP Connect Scan
Interestingly, we found that the TCP connect scan also sends out an ICMP request
and an ACK packet to port 80. NMAP does have a switch –PO, which turns off the
ICMP request and the ACK packet. However, we should not ignore this similarity
with the SYN scan. Because both scanning techniques send out identical packets in
the beginning of the scanning process, we can use this characteristic as an indicator
for determining if a scan is being done.
Also, as mentioned earlier, TCP connect uses the TCP handshake. In this
technique, once the tool determines that port is listening on the target, an RST-
ACK packet is sent to terminate the connection. The following packet sequence
illustrates the process:
120

SYN – Connection is initiated 00:25:46.878241 10.0.0.104.4250 > 10.0.0.25.22: S [tcp sum ok] 1620463576:1620463576(0) win 5840 <mss 1460,sackOK,timestamp 5075885 0,nop,wscale 0> (DF) (ttl 64, id 15477, len 60)
SYN-ACK –acknowledgment of connection initiation
00:25:46.878750 10.0.0.25.22 > 10.0.0.104.4250: S [tcp sum ok] 3031214419:3031214419(0) ack 1620463577 win 5792 <mss 1460,sackOK,timestamp 245443556 5075885,nop,wscale 0> (DF) (ttl 64, id 0, len 60)
ACK – acknowledgement that the initiation attempt was acknowledged, handshake completed
00:25:46.878906 10.0.0.104.4250 > 10.0.0.25.22: . [tcp sum ok] ack 1 win 5840 <nop,nop,timestamp 5075885 245443556> (DF) (ttl 64, id 15478, len 52)
PUSH-ACK – target sends the service banner, in this case it was SSH-1.99-OpenSSH_3.7.1p2
00:25:46.879786 10.0.0.25.22 > 10.0.0.104.4250: P [tcp sum ok] 1:26(25) ack 1 win 5792 <nop,nop,timestamp 245443556 5075885> (DF) (ttl 64, id 33456, len 77)
ACK – acknowledgement that the data was received 00:25:46.879883 10.0.0.104.4250 > 10.0.0.25.22: . [tcp sum ok] ack 26 win 5840 <nop,nop,timestamp 5075885 245443556> (DF) (ttl 64, id 15479, len 52)
RST-ACK – connection is closed 00:25:46.880220 10.0.0.104.4250 > 10.0.0.25.22: R [tcp sum ok] 1:1(0) ack 26 win 5840 <nop,nop,timestamp 5075885 245443556> (DF) (ttl 64, id 15480, len 52)
Once the scan process sends out RST-ACK, the tool moves on to the next port,
choosing a random source port and starts the process all over again. Another
interesting characteristic about the TCP connect scan is that the packet ID from the
source IP increments by one, as shown in Figure 4.28, unlike the SYN scan where
the packet IDs are random.
121

Figure 4.28: TCP Connect Scan Packet ID increment by 1
The FIN, ACK and NULL scans show the same pattern as SYN and TCP
scan, except that TCP flags set in the source packets for the FIN/ACK scans are the
FIN or ACK respectively, as illustrated in Figure 4.29 and 4.30. The NULL scan,
shown in Figures 4.31, as no flags set. Another similarity is that the packet length
in all these scans is 40 bytes, just like the SYN and the TCP connect scans.
Figure 4.29: XMAS Scan Results
122

Figure 4.30: FIN Scan Results
Figure 4.31: ACK Scan Results
The –PT and –PS options and the TCP Ping options send out ACK and
SYN packets, respectively.
IP Scan Options
The command Nmap –sO <target> is used to determine which IP protocols
the target supports. Nmap sends out raw IP packets without any protocol header
information. Traffic generated by the command Nmap –sO <target>, looks like
this:
123
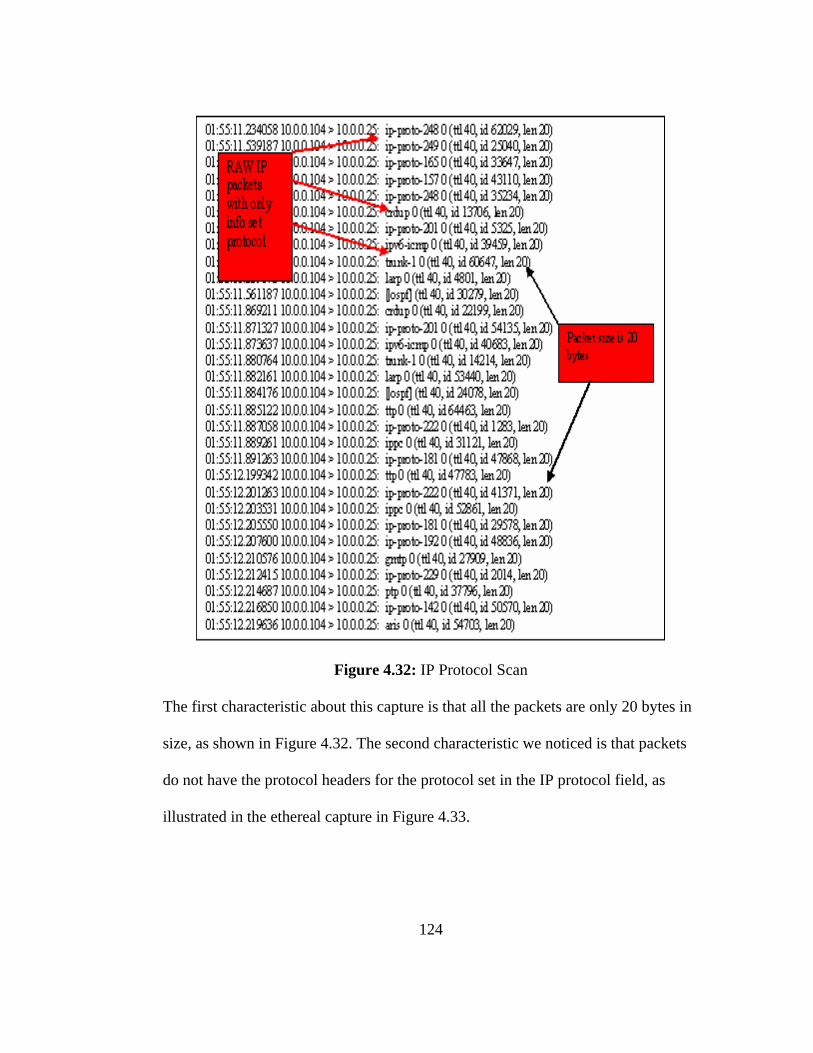
Figure 4.32: IP Protocol Scan
The first characteristic about this capture is that all the packets are only 20 bytes in
size, as shown in Figure 4.32. The second characteristic we noticed is that packets
do not have the protocol headers for the protocol set in the IP protocol field, as
illustrated in the ethereal capture in Figure 4.33.
124
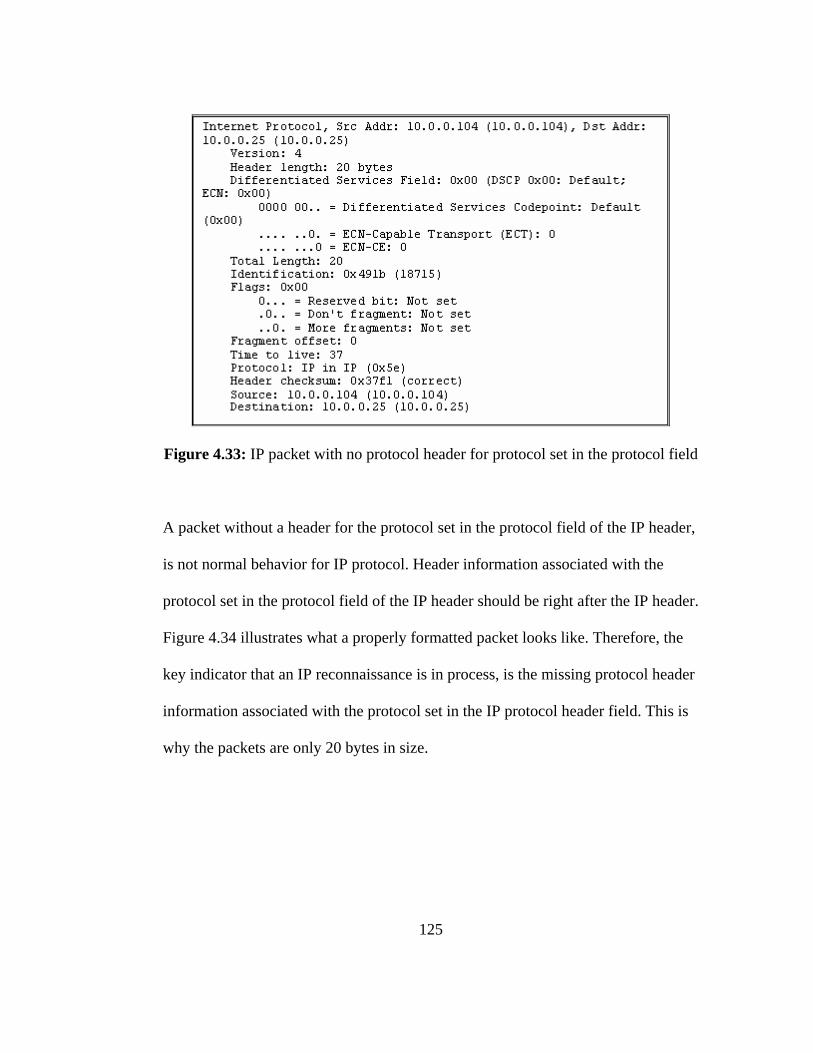
Figure 4.33: IP packet with no protocol header for protocol set in the protocol field
A packet without a header for the protocol set in the protocol field of the IP header,
is not normal behavior for IP protocol. Header information associated with the
protocol set in the protocol field of the IP header should be right after the IP header.
Figure 4.34 illustrates what a properly formatted packet looks like. Therefore, the
key indicator that an IP reconnaissance is in process, is the missing protocol header
information associated with the protocol set in the IP protocol header field. This is
why the packets are only 20 bytes in size.
125

Figure 4.34: Illustrates what a properly formatted IP packet looks like.
126
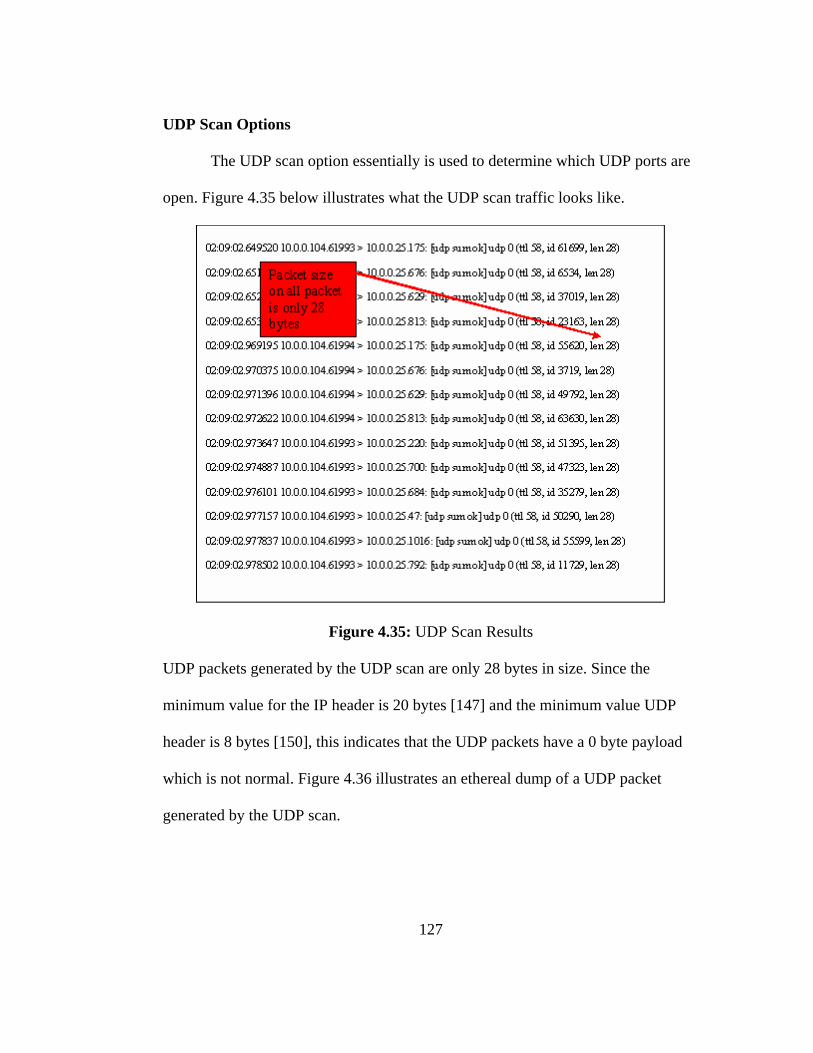
UDP Scan Options
The UDP scan option essentially is used to determine which UDP ports are
open. Figure 4.35 below illustrates what the UDP scan traffic looks like.
Figure 4.35: UDP Scan Results
UDP packets generated by the UDP scan are only 28 bytes in size. Since the
minimum value for the IP header is 20 bytes [147] and the minimum value UDP
header is 8 bytes [150], this indicates that the UDP packets have a 0 byte payload
which is not normal. Figure 4.36 illustrates an ethereal dump of a UDP packet
generated by the UDP scan.
127

Figure 4.36: Ethereal capture of a UDP packet generated by the UDP scan
The other characteristic of this scan is that it tends to send out malformed packets.
Figure 4.37 is a closer look at the malformed packet warning shown in the bottom
of Figure 4.36.
Figure 4.37: Malformed SNMP packet warning from Figure 4.36
128

When analyzing traffic for this type of tool we want to look for the
following,
1) Patterns
i. Multiple SYN, FIN, or ACK packets
ii. Multiple FIN-PUSH-URG packets
iii. Multiple RST-ACK connections from same source
iv. Packets with no protocol headers for protocol set in IP
header protocol field
2) Crafted Packets
i. SYN Packets with a packet length of 40 bytes
ii. IP packets with the length of 20 bytes
iii. UDP Packet with 0 byte payloads
129
4.4 ARP Reconnaissance: ETTERCAP
Ettercap is more complicated to detect than Xprobe2 and Nmap because it
does not send any crafted packets. Instead of sending crafted packets, Ettercap
exploits the lack of authentication in the ARP protocol. It sends out 255 ARP
request packets when the program is started, that are no different than an ARP
request packet sent by any system on a network. Figure 4.38 illustrates what an
ARP packet looks like using Ethereal, and Table 4.7 explains what each field
stands for. After gathering all the ARP request information, Ettercap builds a list of
the hosts that replied, as mentioned in Chapter 3. After the list is completed,
Ettercap goes completely silent. It doesn’t even go into promiscuous mode until it
is enabled by the user.
Since Ettercap does not inject crafted packets into the network like Xprobe2
and Nmap, but rather manipulates traffic stream by modifying the target’s ARP
table, it can not be fingerprinted with methods we have demonstrated so far. We
use a different method which involves analyzing network behavior, monitoring
network traffic, scanning techniques, setting traffic specific thresholds and using a
set of detection tools. These techniques and tools however are discussed in Chapter
5.
130

Figure 4.25: ARP Packet decoded in Ethereal
The definitions of each field in the ARP packet shown in Figure 4.25 are as
follows:
131
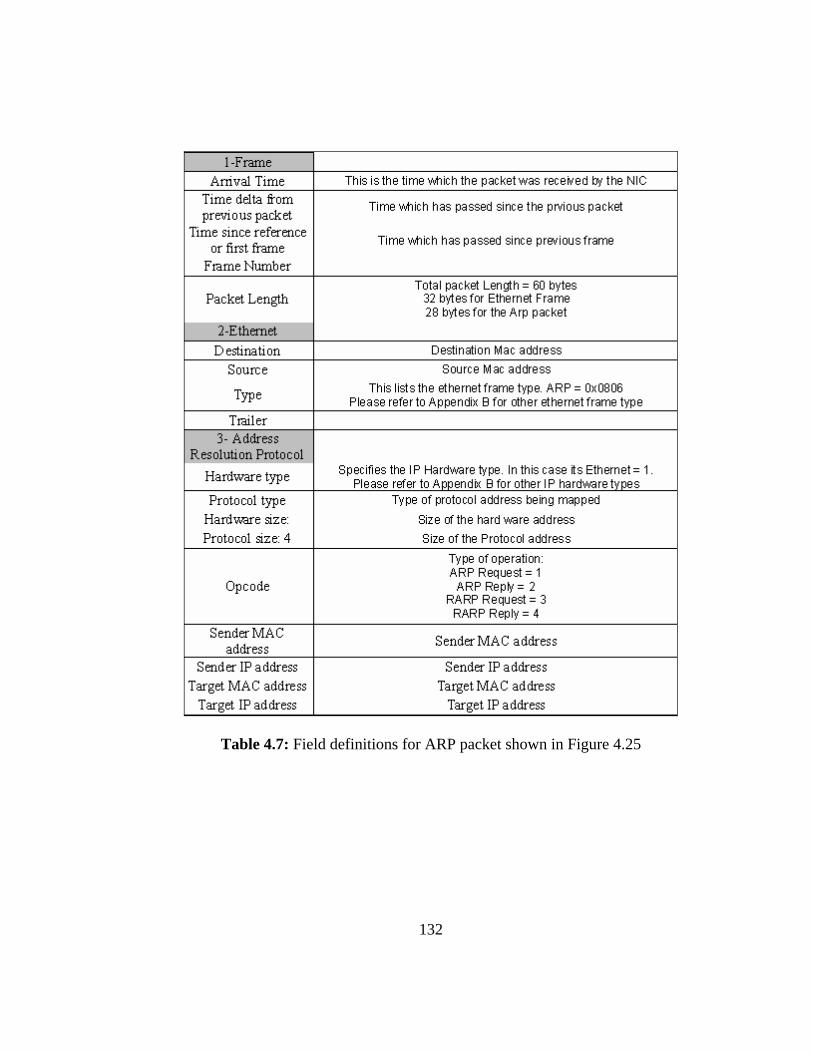
Table 4.7: Field definitions for ARP packet shown in Figure 4.25
132

Chapter 5 Techniques for Detecting and Countering
Network Reconnaissance Network traffic analysis is not trivial, especially when identifying specific
activity such as network reconnaissance. Hackers are becoming more cunning with
their techniques and tools everyday, which adds to the difficulty of analysis and
detection. The only way to counter this dangerous adversary is to think like them,
read what they read, experiment with the technology as they do, and challenge
ourselves with “what if” scenarios. Therefore, deployment and management of
security solutions is not enough to maintain a secure information infrastructure
today. As security professionals, not only do we need to understand how to deploy
and configure a solid security solution, we also need to understand how hackers
obtain information about networks in order to anticipate and mitigate network
attacks.
We have analyzed the network traffic generated by several reconnaissance
tools and extracted key characteristics from the traffic which can subsequently be
used to detect these tools. In this chapter, we complete our methodology for
identifying and detecting network reconnaissance by discussing how to use the
information gathered in the previous chapter to develop filters that will assist in
detecting and countering network reconnaissance. This chapter is organized as
follows,
133

o Network Reconnaissance Detection Tools and Techniques
Snort: Intrusion Detection System
Acid: Analysis Console for Intrusion Databases
o Oinker: A graphical user interface for developing Snort rules
o Developing rules for detecting network reconnaissance
Snort rules for detecting ICMP reconnaissance
• Countering ICMP reconnaissance
Snort rules for detecting TCP/IP reconnaissance
• Countering TCP/IP reconnaissance
Snort rules for detecting ARP reconnaissance
• Countering ARP reconnaissance
o Applying Snort Rules: Experimental Results
5.1 Network Reconnaissance Detection tools and Techniques
As mentioned in Chapter 2, there are a number of tools today that can be
used to assist with network reconnaissance detection. However, we decided to use
Snort with a PHP-based web front-end called Acid, Analysis Console for Intrusion
Databases. Both Snort and ACID offer features that will not be covered in this
paper. This section will serve as a brief overview of these two tools. Please refer to
[37] [39] [119] [152] for more details.
134

Snort: Intrusion detection system
Snort uses signature based detection to identify anomalies in network
traffic. It also doubles as a network sniffer, Figure 5.1 illustrates what a network
traffic capture looks like using Snort in sniffer mode.
Figure 5.1: Snorts sniffer output
The capture format isn’t very different than Tcpdump, as we illustrated in Chapter
4.
The intrusion detection features Snort offers are very extensive. It uses
filters, also known as rules, to analyze and log traffic. Once a filter is triggered it is
135

labeled and categorized, as we will demonstrate later in Section 5.4. A typical Snort
rule would look like this;
Figure 5.2: Components of a Snort rule
Snort rules contain two key components; a rule header and rule options, as
illustrated in Figure 5.2 above. The rule header consists of the following;
• Action
o alert - generate an alert using the selected alert method, and then
log the packet
o log - log the packet
o pass - ignore the packet
o activate - alert and then turn on another dynamic rule
136

o dynamic - remain idle until activated by an activate rule , then
act as a log rule
• Protocol: TCP, UDP, ICMP or IP
• Source IP address
• Source Port
• Direction of traffic: -> or <>
• Destination IP address
• Destination Port
There are four categories of rule options: Metadata, Payload, Non-payload and
Port-detection. Tables 5.1, 5.2, 5.3 and 5.4 list the required keywords for each
category, the descriptions and format.
Table 5.1: Metadata Rule Options
The Meta-data rules are used for readability and organization of rules.
137

Table 5.2-A: Payload Rule Options
The Payload rule options (Table 5.2-A above) are used for analyzing packet
payloads. The keywords shown below in Table 5.2-B are used for determining how
the content keyword value should be analyzed. The Non-Payload rule options, in
Table 5.3-A and 5.3-B, are used for verifying packet header field information.
138

Table 5.2-B: Content behavior modifiers. These options are used with keyword
content in Table 5.2-A.
Table 5.3-A: Non-payload Rule Options
139
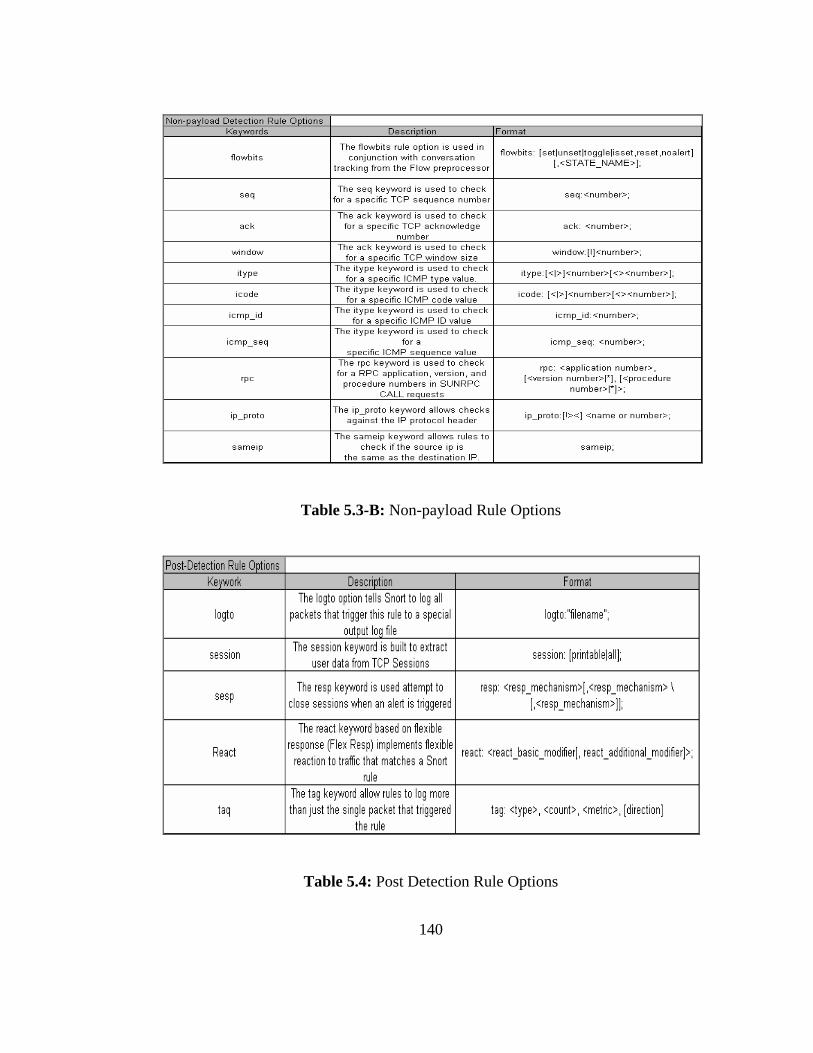
Table 5.3-B: Non-payload Rule Options
Table 5.4: Post Detection Rule Options
140
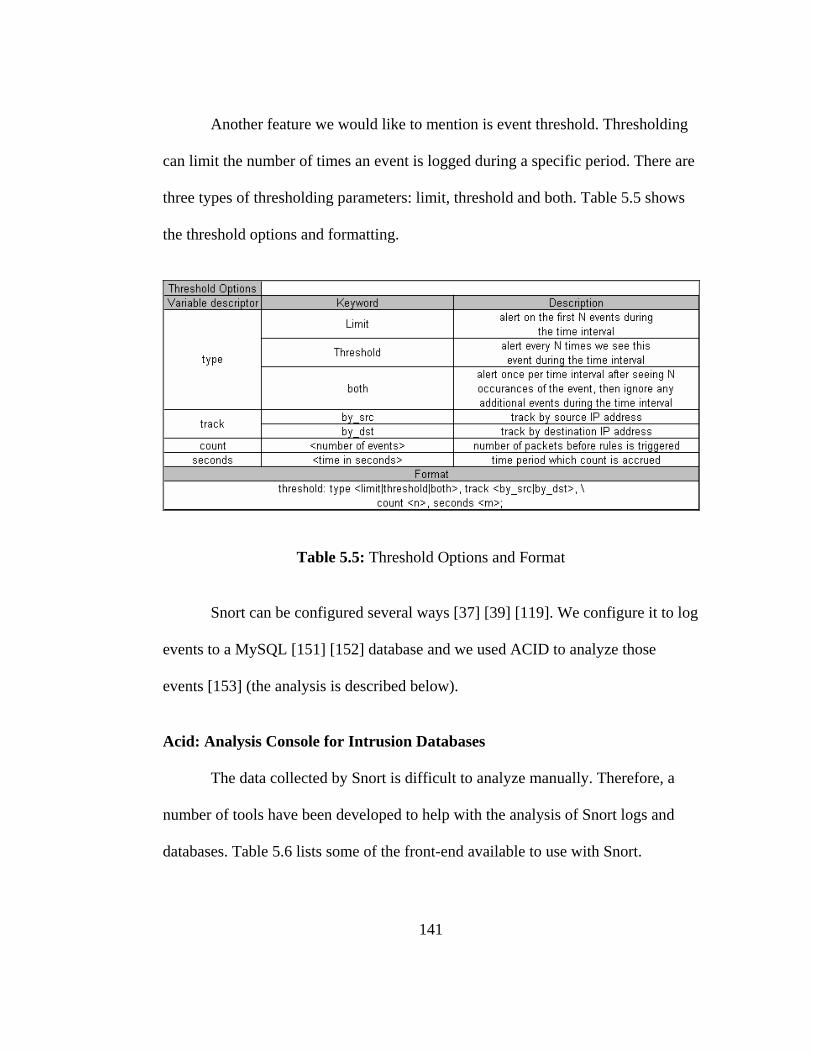
Another feature we would like to mention is event threshold. Thresholding
can limit the number of times an event is logged during a specific period. There are
three types of thresholding parameters: limit, threshold and both. Table 5.5 shows
the threshold options and formatting.
Table 5.5: Threshold Options and Format
Snort can be configured several ways [37] [39] [119]. We configure it to log
events to a MySQL [151] [152] database and we used ACID to analyze those
events [153] (the analysis is described below).
Acid: Analysis Console for Intrusion Databases
The data collected by Snort is difficult to analyze manually. Therefore, a
number of tools have been developed to help with the analysis of Snort logs and
databases. Table 5.6 lists some of the front-end available to use with Snort.
141
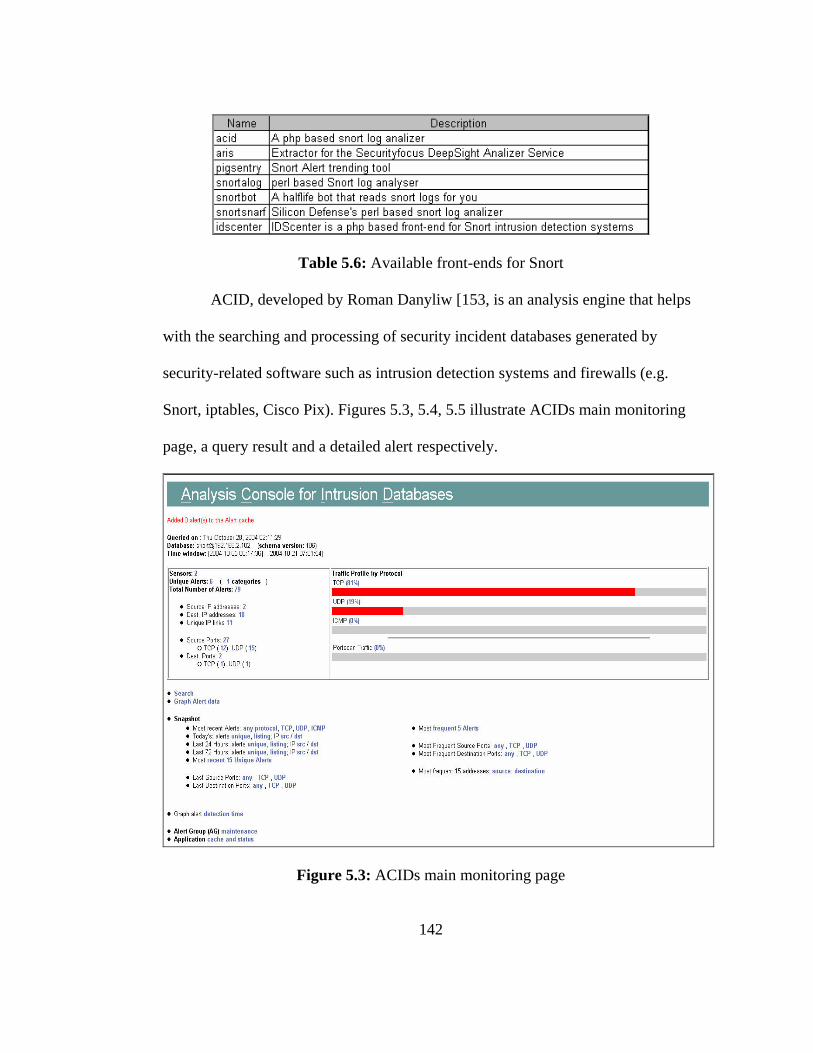
Table 5.6: Available front-ends for Snort
ACID, developed by Roman Danyliw [153, is an analysis engine that helps
with the searching and processing of security incident databases generated by
security-related software such as intrusion detection systems and firewalls (e.g.
Snort, iptables, Cisco Pix). Figures 5.3, 5.4, 5.5 illustrate ACIDs main monitoring
page, a query result and a detailed alert respectively.
Figure 5.3: ACIDs main monitoring page
142

Figure 5.4: ACID query result
Figure 5.5 : Detailed ACID alert
For further information on ACID please see [153].
143

5.2 Oinker: A graphical user interface for creating Snort Rules
During the course of our experiments we found that one of the tasks that
took the most time was developing snort rules. Having to reference the Snort
manual constantly to verify formatting and definitions of fields was very time
consuming. We decided that we needed a tool that put all of the Snort rule options
in one location, took care of formatting and allowed us to work on multiple files.
With these requirements in mind, Oinker was developed. Due to time constraints
we decided to prototype Oinker in Microsoft Visual Basic .Net, therefore it will
only work under the Microsoft Windows operating system.
Oinker
Oinker is a graphical user interface program for writing Snort rules. It
provides the user with the flexibility for:
• Easily creating new Snort rule files
• Easily editing existing files
• Cutting and pasting rules between Snort rule files
• Instantly duplicating rules
• Working with multiple Snort rule files
• Instantly customizable to environments using Snort configuration
files, such as: Snort.conf, Classification.config and
References.config
144

Figures 5.6 below illustrates Oinker’s main window.
Figure 5.6: Oinkers main window
In the main menu the user can create a new Rules file, open an existing rule file, or
edit the configuration files Snort.conf, Classification.config or References.config.
145
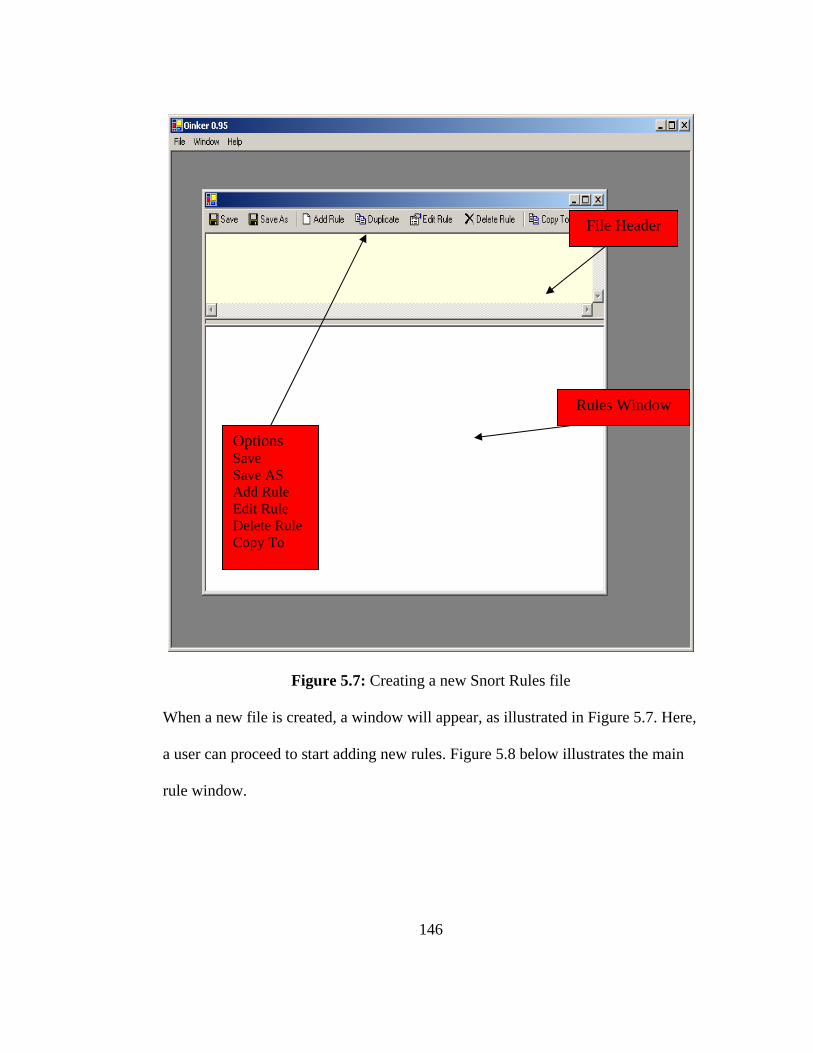
File Header
Options Save Save AS Add Rule Edit Rule Delete Rule Copy To
Rules Window
Figure 5.7: Creating a new Snort Rules file
When a new file is created, a window will appear, as illustrated in Figure 5.7. Here,
a user can proceed to start adding new rules. Figure 5.8 below illustrates the main
rule window.
146

Figure 5.8: Adding a new rule
In the window shown in Figure 5.8, the user can start creating a new rule. The
initial options shown are those for creating the rule header. The rule header fields
are listed and described in section 5.1. Figure 5.9 illustrates the selection window
for all the rule options, which are also listed and described in section 5.1.
147

Figure 5.9: Rule options selection window
For more information please refer to Appendix C.
148

5.3 Developing Snort Rules for detecting network reconnaissance
In this section we will illustrate how we developed Snort rules using the
information we gathered on Xprobe2, Nmap and Ettercap. Then we will present our
results after testing the rules on two live network environments.
Detecting ICMP reconnaissance: Xprobe2
As we mentioned in Chapter 4, Xprobe2 sends out a total of 7 packets as
shown in the Tcpdump capture in Figure 5.10 below.
Figure 5.10: Xprobe2 7 key packets
Packet 1:
This is a normal ICMP echo request; but as mentioned in Chapter 4, it can be used
to identify the type of operating system it came from. Apparently 46 bytes of a
default unmodified ICMP Request payload, from a UNIX type system, remain the
same. Table 5.7 below illustrates this similarity,
149

Table 5.7: Ping Payload similarity between Linux and SunOS 5.9
The first ICMP echo request generated by Xprobe2 is no exception to this, as it is
illustrated in Figure 5.11 below:
Figure 5.11: Ethereal view of first ICMP echo request packet from Xprobe2 scan
Therefore the Snort Rule for detecting this packet would look like this:
alert icmp any any -> any any (msg:"ICMP Echo Request from a Unix Type box"; content:"|20 21 22 23 24 25 26 27 28 29 2a 2b 2c 2d 2e 2f 30 31 32 33 34 35|";
itype:8; icode:0; offset:32; sid:1000008; rev:1;)
This rule states: Alert if an ICMP packet is detected from any source IP and port to
any destination IP and port in the private network (alert icmp any any -> any any )
with type 8 code 0 (itype:8; icode:0) and contains the data "|20 21 22 23 24 25 26
150

27 28 29 2a 2b 2c 2d 2e 2f 30 31 32 33 34 35|" in the payload starting at byte 32
(offset:32). If this rule is activated, it will display “ICMP Echo Request from a
Unix Type box” in ACID, as it will be demonstrated in section 5.4.
Packet 2:
Although the packet displays as an echo request in Figure 5.10, when we
took a closer look with Ethereal this is what we found,
Figure 5.12: Ethereal view of second ICMP echo request packet from an Xprobe2
scan
This packet contains an invalid DS Field (aka: TOS) value and the ICMP type 8 has
an invalid code of 123. The Snort rule to detect this packet would be as follows,
alert icmp any any -> any any (msg:"ICMP TYPE 8 with invalid CODE 123 and invalid TOS"; itype:8; icode:123; tos:6; sid:1000000123; rev:1;)
151
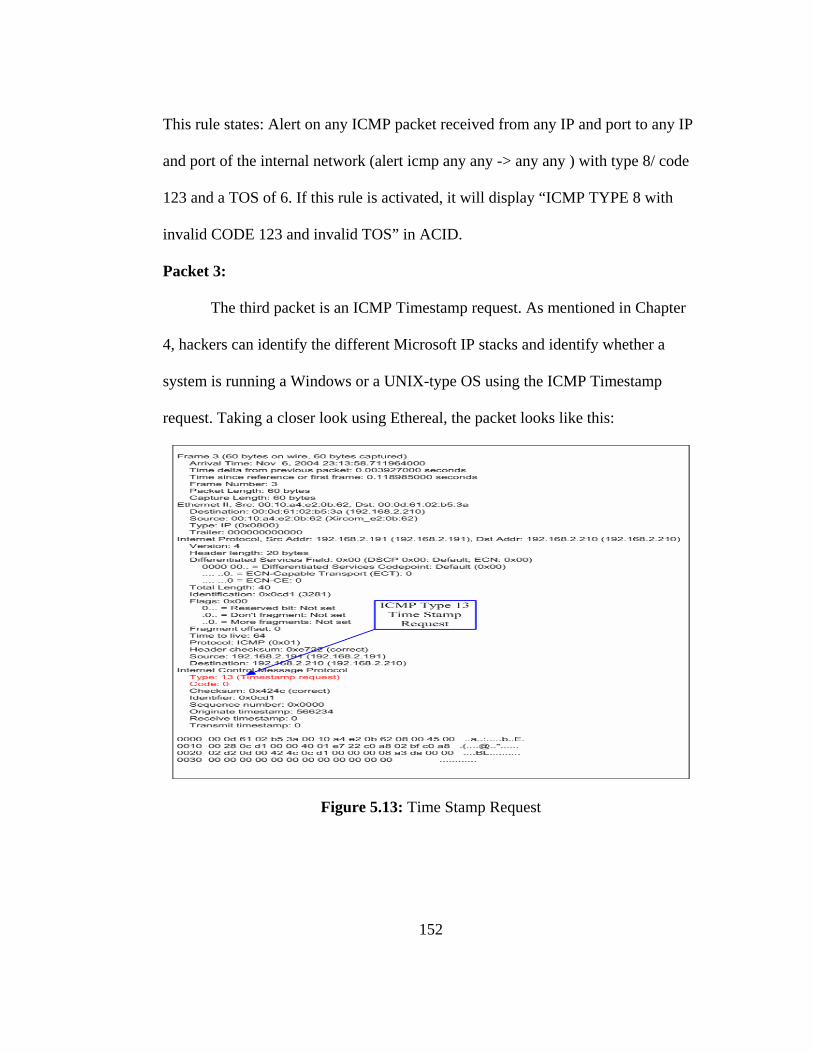
This rule states: Alert on any ICMP packet received from any IP and port to any IP
and port of the internal network (alert icmp any any -> any any ) with type 8/ code
123 and a TOS of 6. If this rule is activated, it will display “ICMP TYPE 8 with
invalid CODE 123 and invalid TOS” in ACID.
Packet 3:
The third packet is an ICMP Timestamp request. As mentioned in Chapter
4, hackers can identify the different Microsoft IP stacks and identify whether a
system is running a Windows or a UNIX-type OS using the ICMP Timestamp
request. Taking a closer look using Ethereal, the packet looks like this:
Figure 5.13: Time Stamp Request
152

The snort rule for packet 3 would look as such:
alert icmp any any -> any any (msg:"ICMP TimeStamp Request"; itype:13; icode:0; sid:100000013; rev:1;)
This rule states: Alert on any ICMP packet received from any IP and port to any IP
and port of the internal network (alert icmp any any -> any any ) with type 13 code
0. If this rule is activated, it will display “ICMP Timestamp Request“ in ACID.
Packet 4 and 5:
Packets 4 and 5, ICMP Types 15 (Information Request) and 17 (Address
Mask Request) are typically used for diskless operating systems. So if these ICMP
types are detected, the source IP should be investigated. The packets look like this:
Figure 5.14: ICMP Type 17 Address Mask Request
153

Figure 5.15: ICMP Type 15 Information Request
The Snort Rules for packets 4 and 5 would look like this:
alert icmp any any -> any any (msg:"ICMP Address mask request"; itype:17; icode:0;
sid:100000017; rev:1;)
alert icmp any any -> any any (msg:"ICMP Information Request - used for diskless workstations"; itype:15; sid:100000015; rev:1;)
ICMP Type 17 rule states: Alert if an ICMP packet is receive from any source IP
and port to any IP and port of the local network (alert icmp any any -> any any)
with type 17 code 0. If the rule is activated the message “ICMP Address mask
154
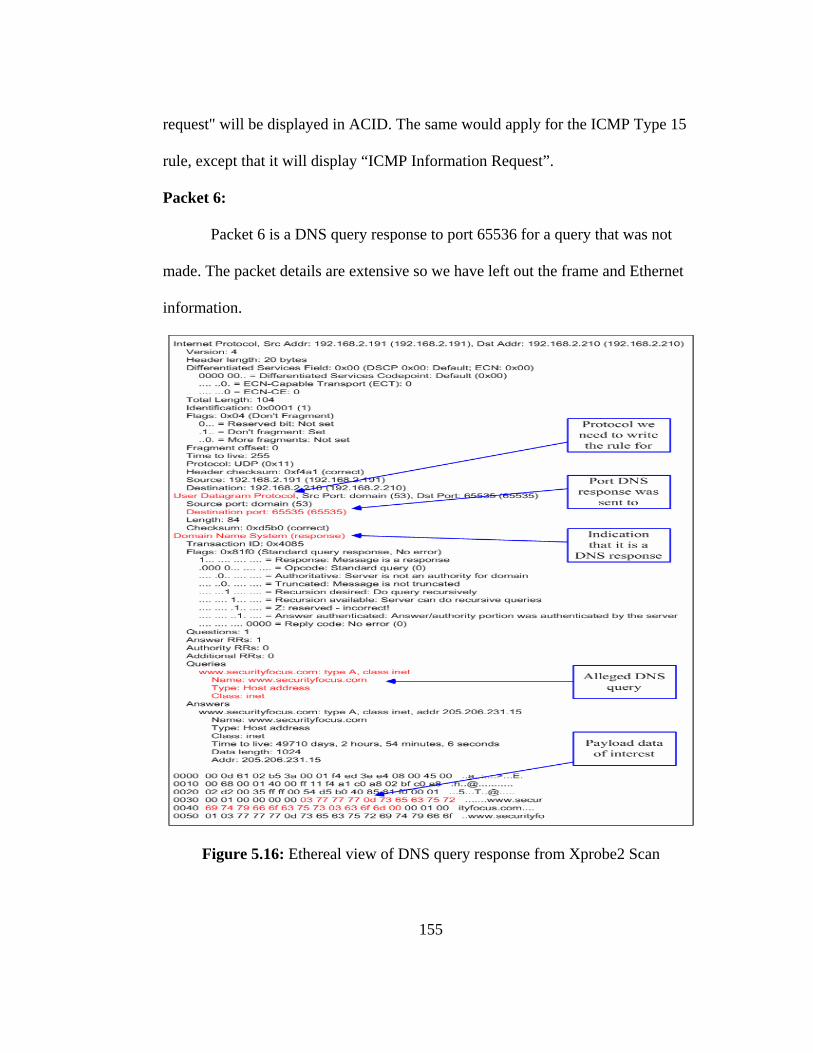
request" will be displayed in ACID. The same would apply for the ICMP Type 15
rule, except that it will display “ICMP Information Request”.
Packet 6:
Packet 6 is a DNS query response to port 65536 for a query that was not
made. The packet details are extensive so we have left out the frame and Ethernet
information.
Figure 5.16: Ethereal view of DNS query response from Xprobe2 Scan
155

The snort rule for this packet is a little more involved than the others we have
presented so far. We have to search for data sent to port 65535 starting and
stopping at a specific location in the payload as illustrated in the rule below.
alert udp any any -> any 65535 (msg:"UDP - Unsolicited DNS response"; \ content:"|03 77 77 77 0d 73 65 63 75 72 69 74 79 66 6f 63 75 73 03 63 6f 6d 00|"; \
offset:7; \ depth:56; \ sid:1000053; \ rev:1;)
This rule states: Alert on any UDP packet received from any location and port to
any location and port 65535 in the internal network (alert udp any any -> any
65535) with the content :"|03 77 77 77 0d 73 65 63 75 72 69 74 79 66 6f 63 75 73
03 63 6f 6d 00|" in the payload at an offset of 7 bytes ( offset:7) and depth of 56
bytes (depth:56). If this rule is activated it will show the message “UDP -
Unsolicited DNS response” in ACID.
156
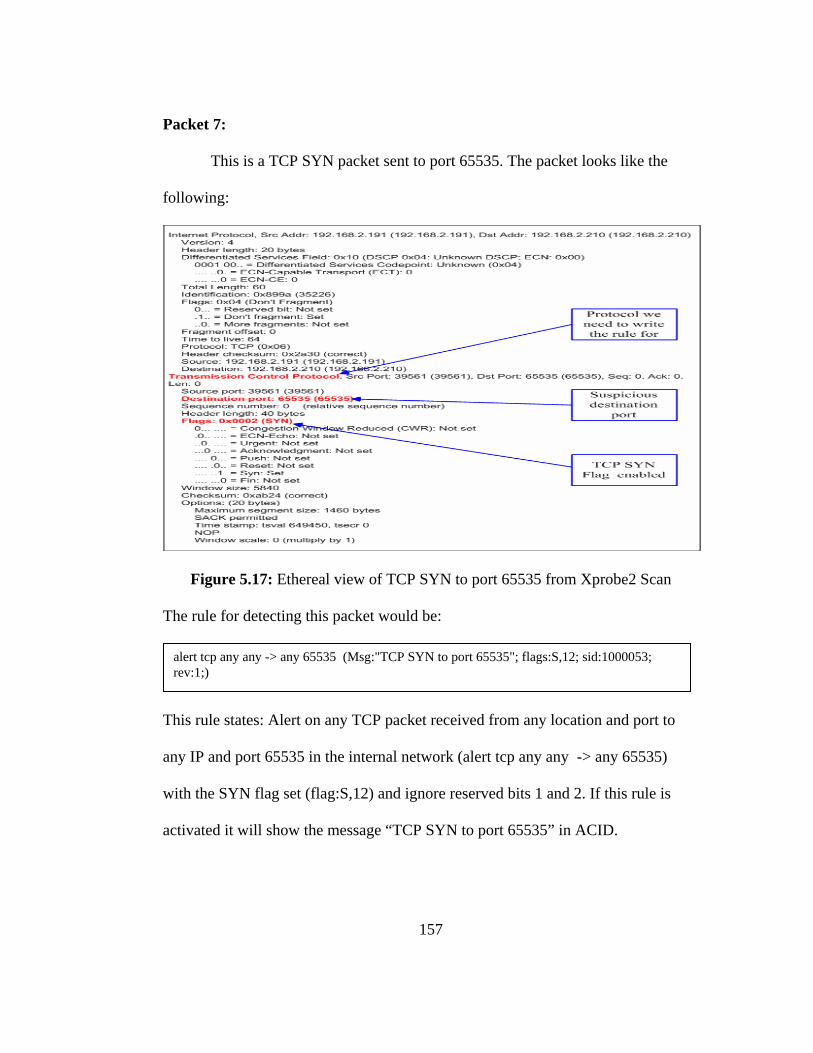
Packet 7:
This is a TCP SYN packet sent to port 65535. The packet looks like the
following:
Figure 5.17: Ethereal view of TCP SYN to port 65535 from Xprobe2 Scan
The rule for detecting this packet would be:
alert tcp any any -> any 65535 (Msg:"TCP SYN to port 65535"; flags:S,12; sid:1000053; rev:1;)
This rule states: Alert on any TCP packet received from any location and port to
any IP and port 65535 in the internal network (alert tcp any any -> any 65535)
with the SYN flag set (flag:S,12) and ignore reserved bits 1 and 2. If this rule is
activated it will show the message “TCP SYN to port 65535” in ACID.
157

This completes our rule set for Xprobe2. Table 5.8 below lists all the rules with the
corresponding packet number.
Table 5.8: Complete Rule Set for detecting Xprobe2
Detecting TCP/IP/UDP reconnaissance: NMAP version 3.0
As mentioned in Chapter 4, NMAP has a lot of options and the
combinations of those options are extensive, so we decided to analyze only a few as
listed in Table 4.9. In addition to the extensive option combinations, each scan type
sends out over 1600 packets. Therefore, for practicality and simplicity we sampled
traffic of each scan technique and extracted key characteristics which we will use to
develop the Snort rules.
158
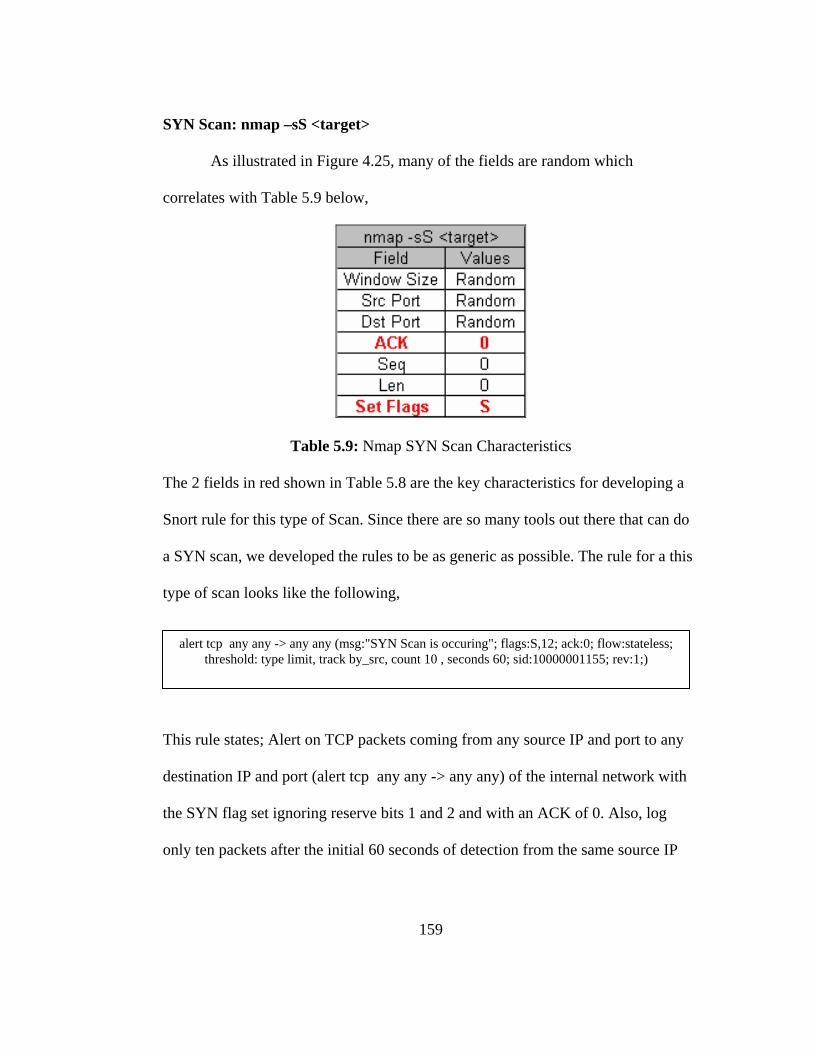
SYN Scan: nmap –sS <target>
As illustrated in Figure 4.25, many of the fields are random which
correlates with Table 5.9 below,
Table 5.9: Nmap SYN Scan Characteristics
The 2 fields in red shown in Table 5.8 are the key characteristics for developing a
Snort rule for this type of Scan. Since there are so many tools out there that can do
a SYN scan, we developed the rules to be as generic as possible. The rule for a this
type of scan looks like the following,
alert tcp any any -> any any (msg:"SYN Scan is occuring"; flags:S,12; ack:0; flow:stateless;
threshold: type limit, track by_src, count 10 , seconds 60; sid:10000001155; rev:1;)
This rule states; Alert on TCP packets coming from any source IP and port to any
destination IP and port (alert tcp any any -> any any) of the internal network with
the SYN flag set ignoring reserve bits 1 and 2 and with an ACK of 0. Also, log
only ten packets after the initial 60 seconds of detection from the same source IP
159
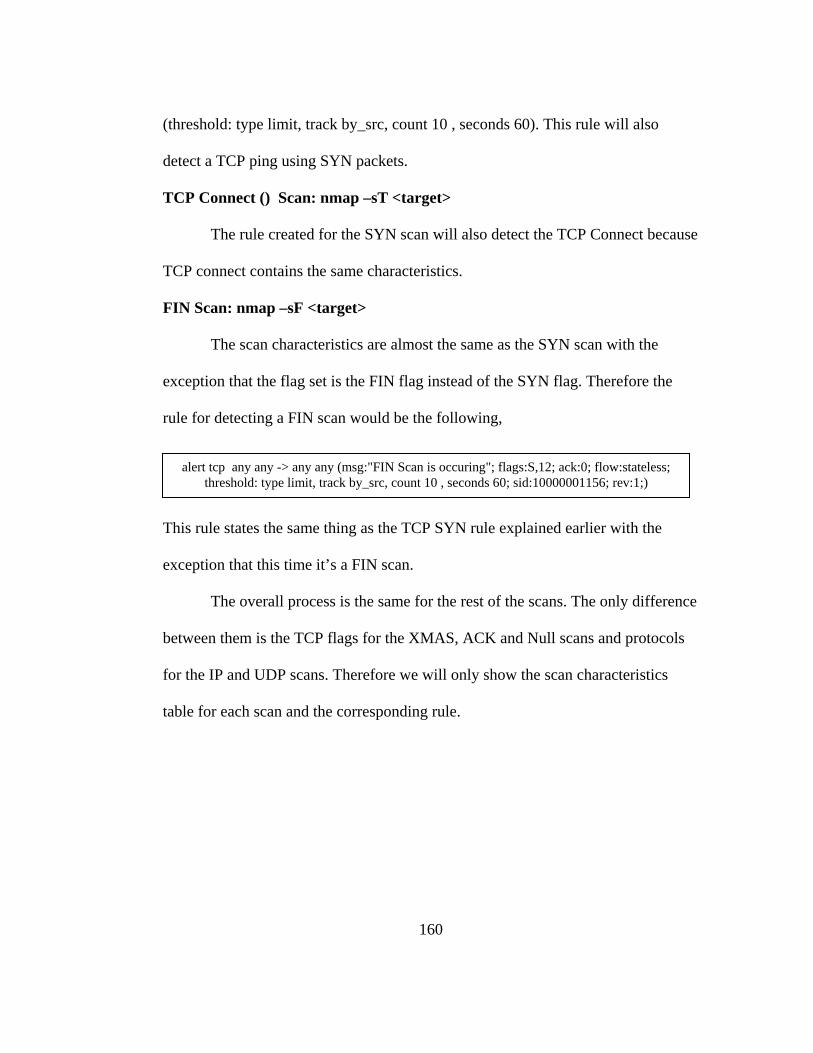
(threshold: type limit, track by_src, count 10 , seconds 60). This rule will also
detect a TCP ping using SYN packets.
TCP Connect () Scan: nmap –sT <target>
The rule created for the SYN scan will also detect the TCP Connect because
TCP connect contains the same characteristics.
FIN Scan: nmap –sF <target>
The scan characteristics are almost the same as the SYN scan with the
exception that the flag set is the FIN flag instead of the SYN flag. Therefore the
rule for detecting a FIN scan would be the following,
alert tcp any any -> any any (msg:"FIN Scan is occuring"; flags:S,12; ack:0; flow:stateless;
threshold: type limit, track by_src, count 10 , seconds 60; sid:10000001156; rev:1;)
This rule states the same thing as the TCP SYN rule explained earlier with the
exception that this time it’s a FIN scan.
The overall process is the same for the rest of the scans. The only difference
between them is the TCP flags for the XMAS, ACK and Null scans and protocols
for the IP and UDP scans. Therefore we will only show the scan characteristics
table for each scan and the corresponding rule.
160

XMAS Scan: nmap –sX <target>
Table 5.10: Nmap XMAS Scan Characteristics
alert tcp any any -> any any (msg:"XMAS Scan is occuring"; flags:FPU,12; ack:0; \ flow:stateless; sid:10000000156; rev:1;)
Null scan: nmap –sN <target>
Table 5.11: Nmap Null Scan Characteristics
>
alert tcp any any -> any any (msg:"NULL Scan is occuring"; flags:0; ack:0; \ flow:stateless; sid:10000000158; rev:1;)
161

ACK Scan: nmap –sA <target>
Table 5.12: Nmap ACK Scan Characteristics
alert tcp any any -> any any (msg:"ACK Scan is occurring"; \ flags: A, 12; ack:0; \ flow: stateless; \ sid:10000000158; rev:1;)
IP Protocol Scan: nmap –sO <target>
The technique to detect this kind of scan is a little different. ACID is limited
to displaying TCP, UDP and ICMP traffic only. Also, Snort rules are limited to
monitoring only a subset of all fields. Therefore, we needed to develop what are
known as Berkeley Packet Filters (BPF) [39] [40] [142] [158]. Using BPF filters
we can look at any fields of incoming packets and can be used with either Snort or
tcpdump. The BPF filter for this type of scan would look like the following;
Snort –v ‘(ip[3] = 20)’ –L ip_protocol_scan.cap
162
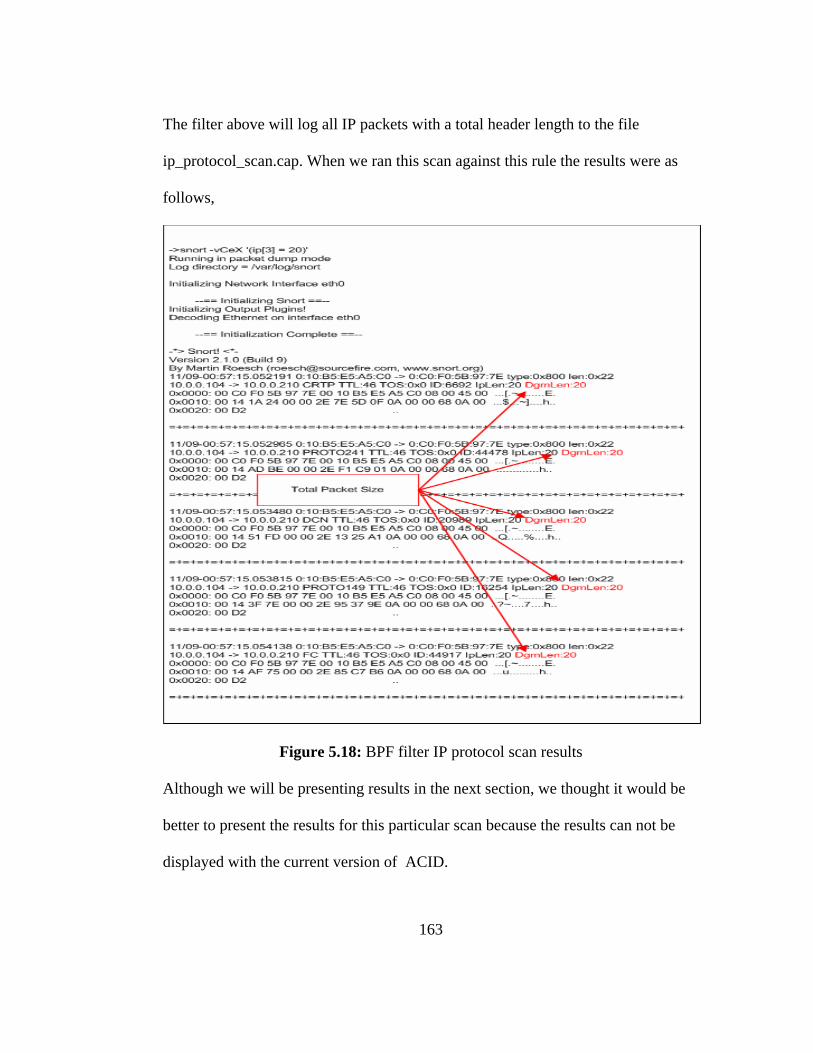
The filter above will log all IP packets with a total header length to the file
ip_protocol_scan.cap. When we ran this scan against this rule the results were as
follows,
Figure 5.18: BPF filter IP protocol scan results
Although we will be presenting results in the next section, we thought it would be
better to present the results for this particular scan because the results can not be
displayed with the current version of ACID.
163

UDP Protocol Scan: nmap –sU <target>
Table 5.13: Nmap UDP Scan Characteristics
alert udp any any -> any any (msg:"UDP Scan is occuring"; dsize:0; threshold: type \ limit, track by_src, count 3, seconds 60; sid:10000000157; rev:1;)
This Snort rule can also be writing using BPF, it would look like this;
Snort –v ‘(ip[9] = 0x11 && ip [3] = 28)’
This completes our Nmap ruleset, Table 5.14 below summarizes all the
rules with the corresponding scan type.
Table 5.14: Complete rules set for detecting Different scan types
164
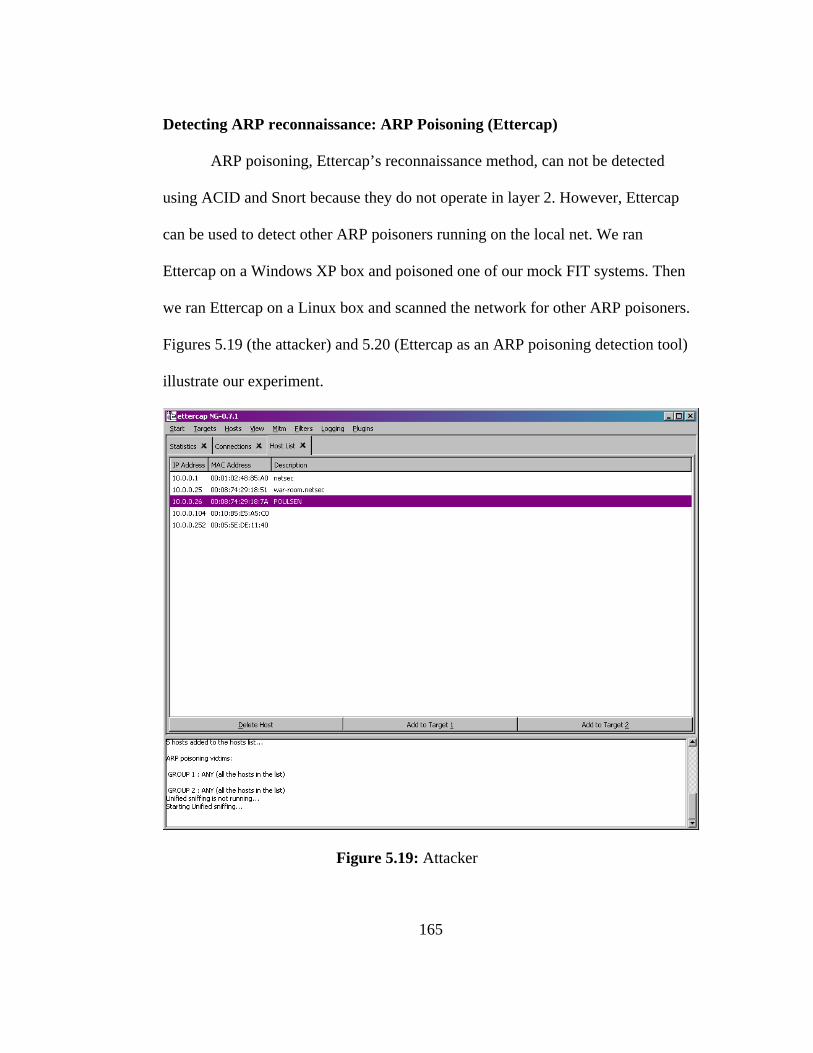
Detecting ARP reconnaissance: ARP Poisoning (Ettercap)
not be detected
using A p
Then
ARP poisoning, Ettercap’s reconnaissance method, can
CID and Snort because they do not operate in layer 2. However, Etterca
can be used to detect other ARP poisoners running on the local net. We ran
Ettercap on a Windows XP box and poisoned one of our mock FIT systems.
we ran Ettercap on a Linux box and scanned the network for other ARP poisoners.
Figures 5.19 (the attacker) and 5.20 (Ettercap as an ARP poisoning detection tool)
illustrate our experiment.
Figure 5.19: Attacker
165
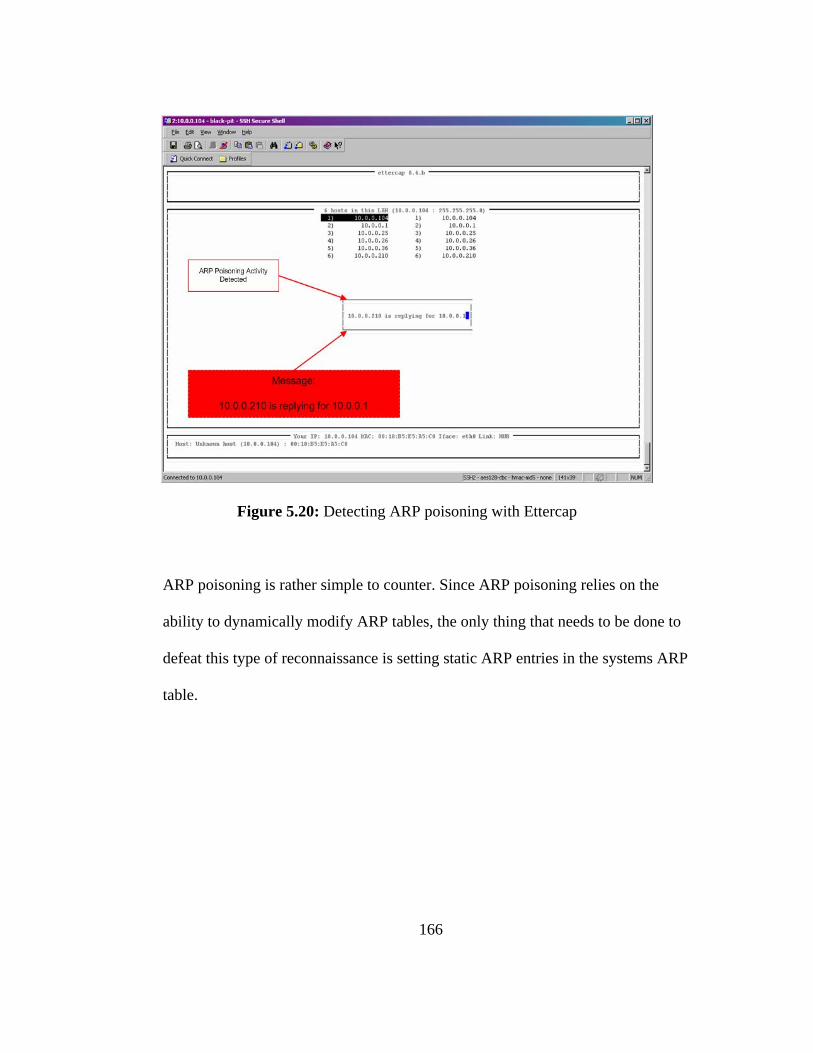
Figure 5.20: Detecting ARP poisoning with Ettercap
ARP poisoning is rather simple to counter. Since ARP poisoning relies on the
to
ability to dynamically modify ARP tables, the only thing that needs to be done
defeat this type of reconnaissance is setting static ARP entries in the systems ARP
table.
166

5.4 Applying the new Snort Rules: Experiment results
be, Nmap and
Etterca
Now that we developed the necessary rules for detecting Xpro
p type reconnaissance, we will now discuss how we tested the rule sets in
two distinct live environments and our end results. The configuration of our live
environments is illustrated in Figures 5.20 and 5.21.
Figure 5.20: Test Site one configuration
167

Figure 5.21: Test Site two configuration
The network environ ed of four major
1) The Internet
etwork
ort
ments in Figures 5.20 and 5.21 are compos
parts:
2) The internal n
3) IDS system running Sn
4) Passive Ethernet TAP
168
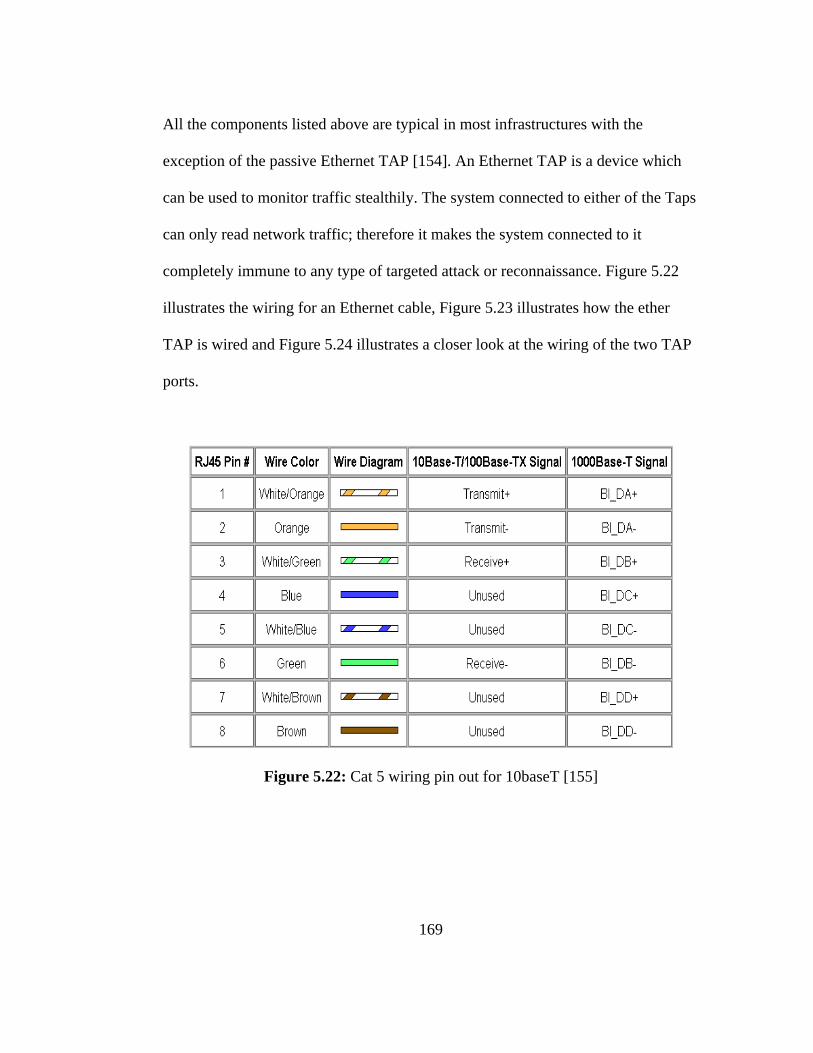
All the components listed above are typical in most infrastructures with the
exception of the passive Ethernet TAP [154]. An Ethernet TAP is a device which
can be used to monitor traffic stealthily. The system connected to either of the Taps
can only read network traffic; therefore it makes the system connected to it
completely immune to any type of targeted attack or reconnaissance. Figure 5.22
illustrates the wiring for an Ethernet cable, Figure 5.23 illustrates how the ether
TAP is wired and Figure 5.24 illustrates a closer look at the wiring of the two TAP
ports.
Figure 5.22: Cat 5 wiring pin out for 10baseT [155]
169

Figure 5.23: Ethernet TAP wiring [154]
Figure 5.24: Close up of TAP port wiring
The reason why the system is stealthy when plugged into the TAP ports of the
Ethernet TAP is because the only pins that are used are the Receive+ (Pin #3) and
the Receive- (Pin#6) of the RJ45 Ethernet connection, as illustrated in Figure 5.23.
170
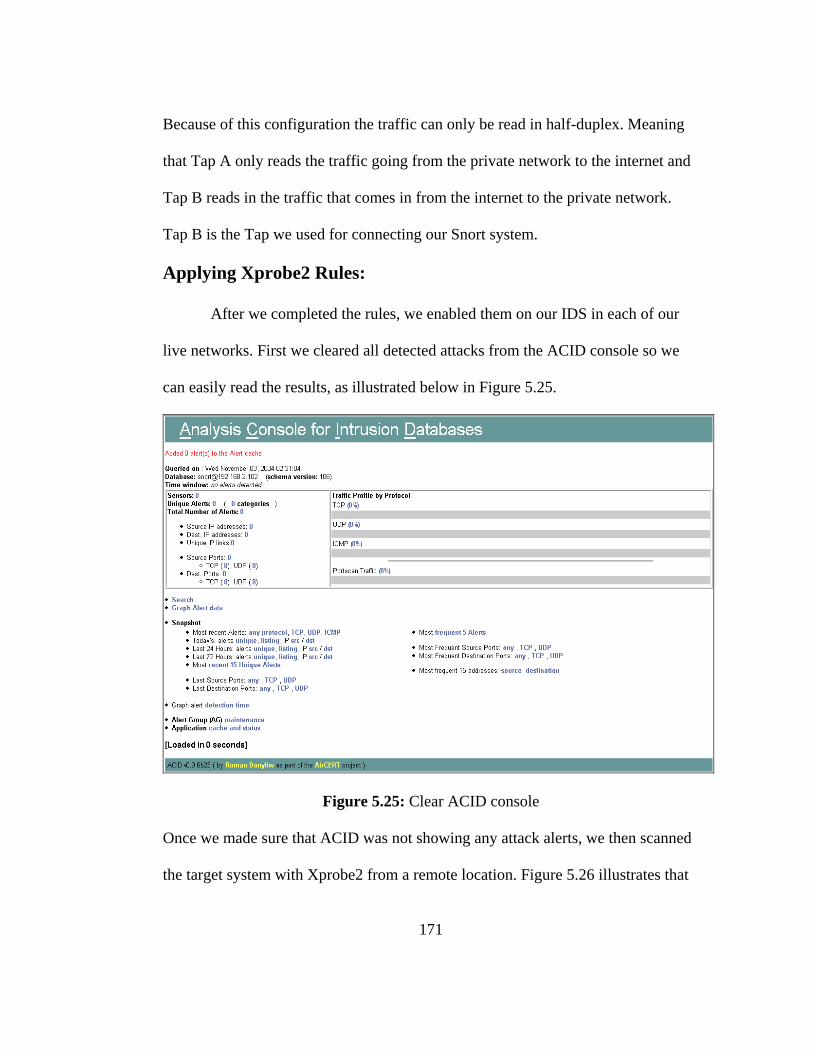
Because of this configuration the traffic can only be read in half-duplex. Meaning
that Tap A only reads the traffic going from the private network to the internet and
Tap B reads in the traffic that comes in from the internet to the private network.
Tap B is the Tap we used for connecting our Snort system.
Applying Xprobe2 Rules:
After we completed the rules, we enabled them on our IDS in each of our
live networks. First we cleared all detected attacks from the ACID console so we
can easily read the results, as illustrated below in Figure 5.25.
Figure 5.25: Clear ACID console
Once we made sure that ACID was not showing any attack alerts, we then scanned
the target system with Xprobe2 from a remote location. Figure 5.26 illustrates that
171

Snort has detected some illegitimate activity based on the enabled rule set. When
we take a closer look at what was detected we find that all the rules we have
enabled have been activated
Figure 5.26: Detection of suspicious packets
Figure 5.27: TCP rule for detection SYN packets to port 65535 is activated
172
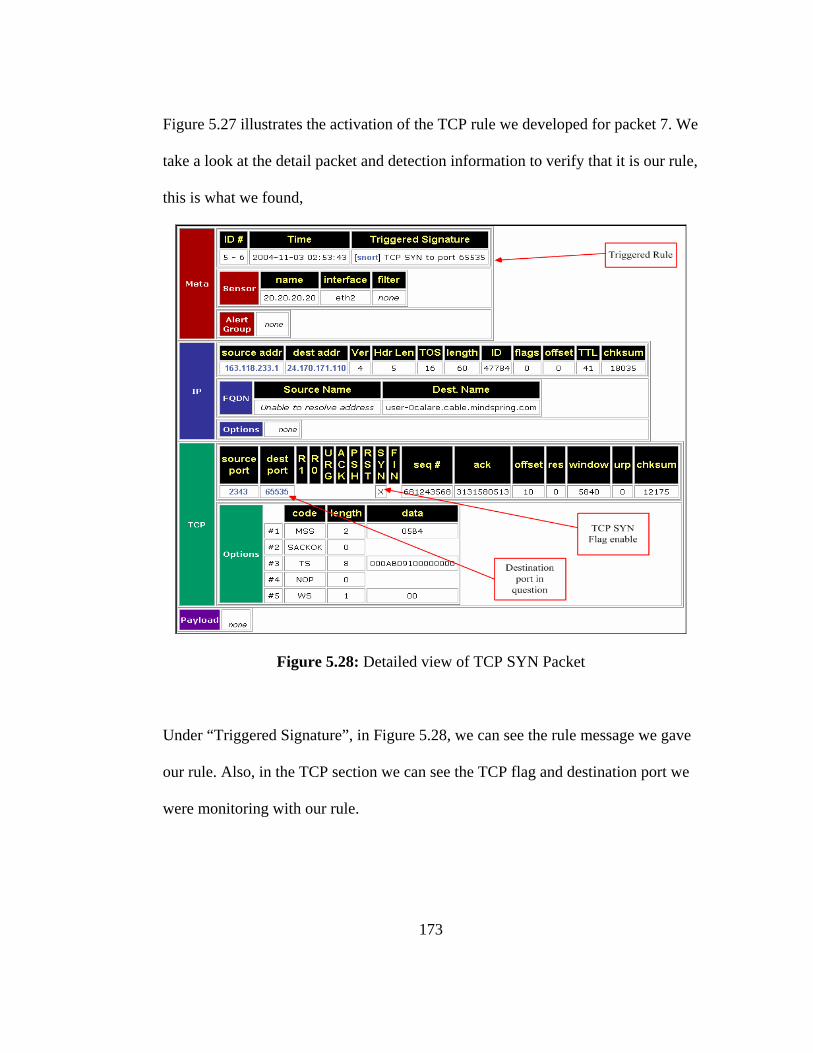
Figure 5.27 illustrates the activation of the TCP rule we developed for packet 7. We
take a look at the detail packet and detection information to verify that it is our rule,
this is what we found,
Figure 5.28: Detailed view of TCP SYN Packet
Under “Triggered Signature”, in Figure 5.28, we can see the rule message we gave
our rule. Also, in the TCP section we can see the TCP flag and destination port we
were monitoring with our rule.
173
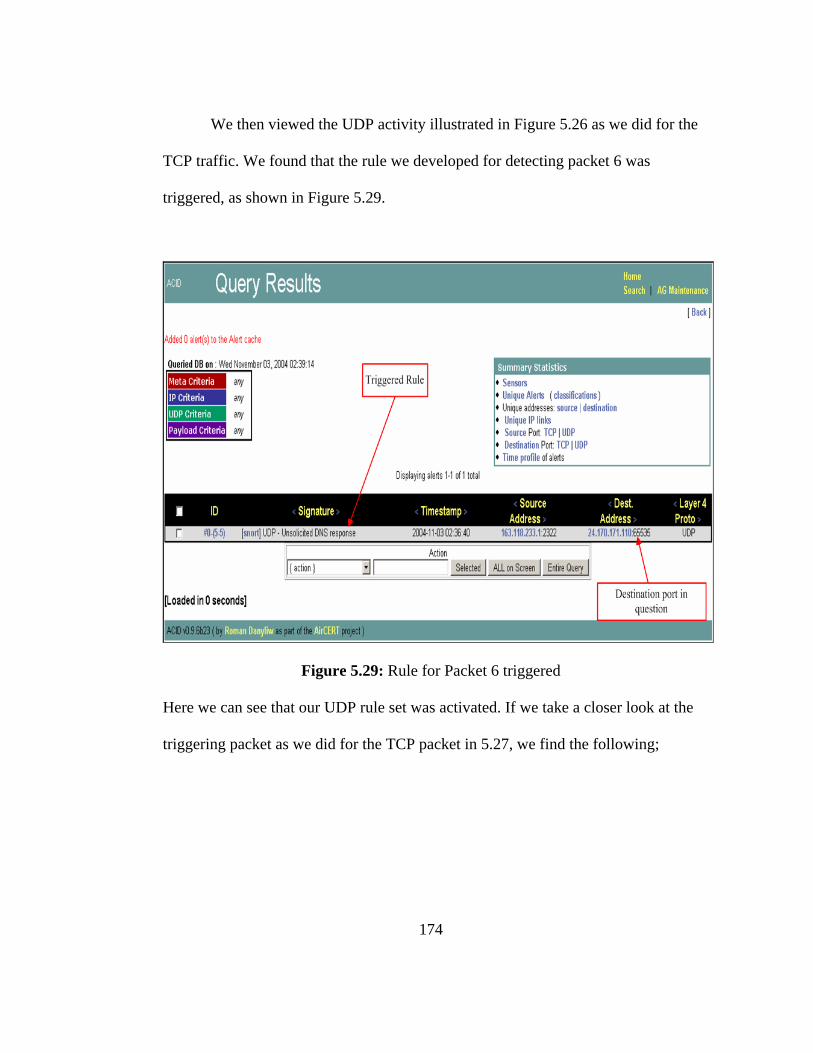
We then viewed the UDP activity illustrated in Figure 5.26 as we did for the
TCP traffic. We found that the rule we developed for detecting packet 6 was
triggered, as shown in Figure 5.29.
Figure 5.29: Rule for Packet 6 triggered
Here we can see that our UDP rule set was activated. If we take a closer look at the
triggering packet as we did for the TCP packet in 5.27, we find the following;
174

Figure 5.30: Unsolicited DNS response
The triggered rule has the message we assigned to the rule, the destination port
(65535) in question is the same as we designated in our rule and the payload we are
looking for is also displayed. All this confirms that our rule is working properly.
We then analyzed the ICMP traffic, and again we found rules with our
messages in the signature column, as illustrated in Figure 5.31.
175

Figure 5.31: ICMP Rules triggered
All of the rules were triggered except for one, the ICMP Type 15
Information Request packet. We tested the rule in several environments but were
not successful at getting it to trigger when Xprobe2 was used. It seems that Snort
simply drops this kind of ICMP packet. Figures 5.32, 5.33, 5.34 and 5.35 illustrate
the details of the packets that were detected and the key identifiers that triggered
the rule.
176

Figure 5.32: ICMP Type 17 (Address Mask Request)
Figure 5.33: ICMP Type 8 with invalid Code 123
177
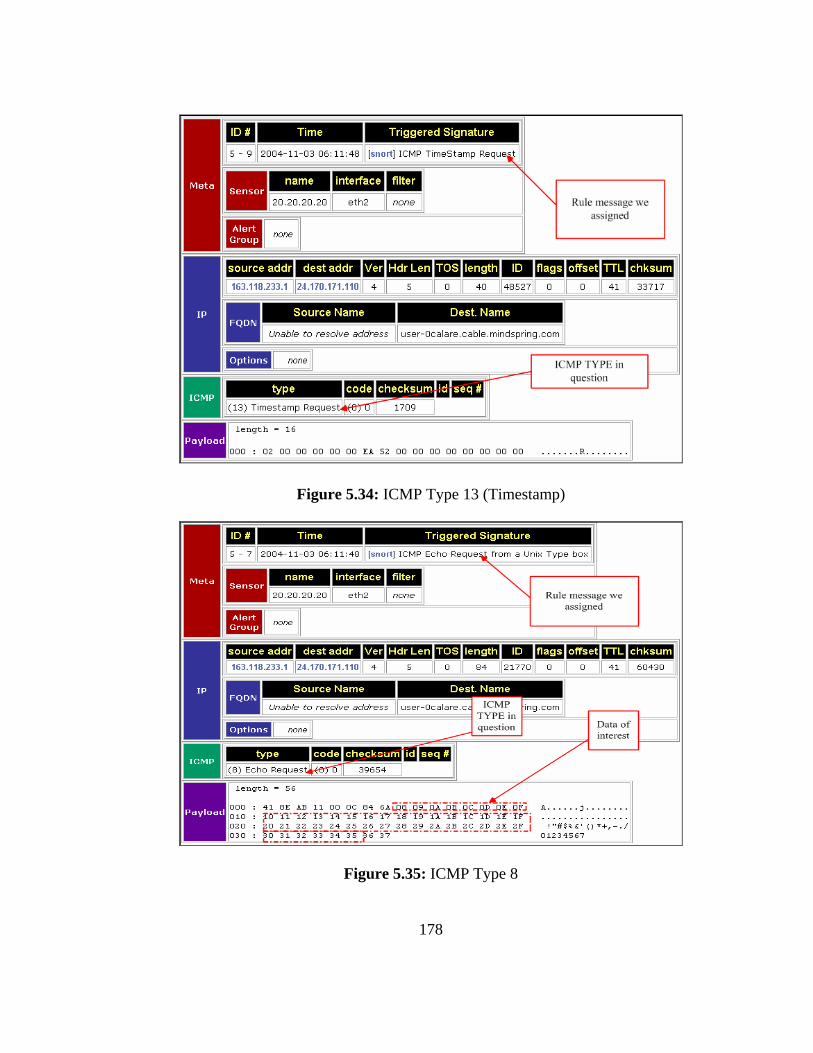
Figure 5.34: ICMP Type 13 (Timestamp)
Figure 5.35: ICMP Type 8
178

With the exception of the ICMP Type 15 packet, the experiment results were
positive. Figure 5.36 below illustrates the scans and the rules which apply to them.
Applying Nmap Rules:
We cleared the ACID console again and ran Nmap against our test
environments. Our results were as conclusive as those for Xprobe2. Figures 5.36-
5.41 illustrate our results.
Figure 5.36: ACK Scan Detected
179
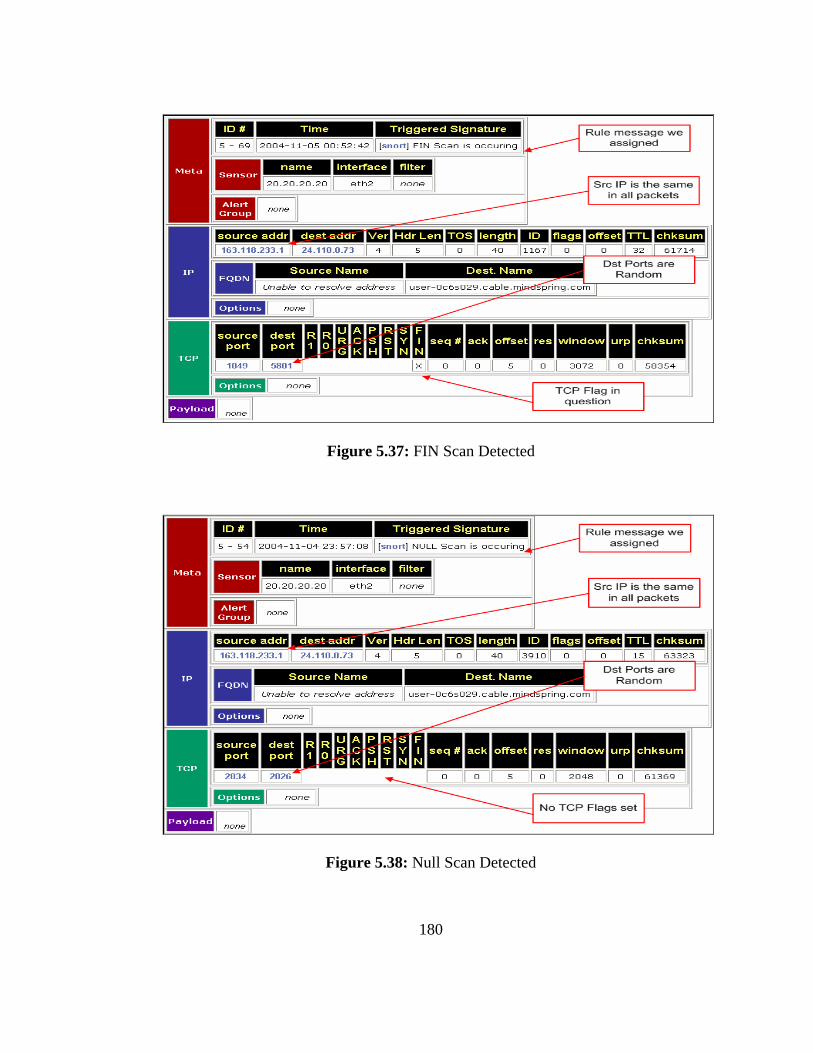
Figure 5.37: FIN Scan Detected
Figure 5.38: Null Scan Detected
180

Figure 5.39: SYN Scan Detected
Figure 5.40: UDP Scan Detected
181

Figure 5.41: XMAS Scan Detected
182

Conclusions and Future work
Diverse network protocols and complex infrastructures make network
traffic analysis an extremely difficult task. However, the whole approach to
network traffic analysis is redefined when the burden of having to stay ahead of
hackers is added to the mix because now we have the added problem of intrusion
detection and prevention. The security industry as a whole has done a good job at
developing tools that react to attacks either as they are occurring or shortly after
they have occurred. However, one could argue that an attack which is detected
shortly after it has occurred, in essence, is a successful attack.
As we explained in Chapter 2, very little work has been done in the area of
network reconnaissance analysis and detection. Current tools and techniques focus
on the attacks themselves rather than what comes before the attack. They lack the
ability to analyze network traffic to detect hostile network reconnaissance to
anticipate and mitigate network attacks. However, if network reconnaissance
detection is performed in a methodical way, such as the four step technique we
have presented in this thesis, detection of malicious network reconnaissance is a
little easier and false positives can be kept at a minimum.
183

The four steps of our technique are as follows;
Step 1: Build an isolated network environment
As illustrated in Chapter 1 and 5, this involves setting up a group of
machines with various operating systems. It is recommended to setup the
environment to be as dynamic as possible so that it can be changed around to meet
the requirements of different experiments. This is necessary so that the production
environment will not be affected by the tools that are run during the experiments.
Step 2: Capture network traffic generated by the hacker tool
In this step we capture the traffic to a file using a protocol analyzer such as
Ethereal or tcpdump
Step 3: Analyzing the captured traffic
This is where most of the work is done and knowledge of the network
protocol the tool uses to do network reconnaissance is required. Using this
knowledge we identified key elements that can subsequently be used to detect the
tool being analyzed. It is important to understand that, although we used Snort in
our experiments, our technique can be applied to develop filters/rules for any
intrusion detection system, intrusion prevention system or firewall.
184

Step 4: Creating and testing the filters against a live environment for validation.
Using key elements we identified from the captured packets, we developed
filters/rules for Snort. This final step also involves setting up the chosen anomaly
detection system (IDS, IPS or firewall) on a live network with our new filters/rules.
We recommend that an ethertap be used to connect the system to the live network,
as illustrated in Figures 5.20 and 5.21, so that it can not be detected.
Once everything was properly set up and tested we ran the reconnaissance
tools against the live network to see if the new filters/rules will detect them. As we
demonstrated in results in Chapter 5, our rules did detect the tools every time. An
important thing to keep in mind is that all environments are different; therefore the
level of false positives will vary. It might be required to use features offered by
Snort, which weren’t covered in this thesis or development of BPF rules in order to
get the level of detection accuracy desired.
Also, during our research we found that creating Snort rules was extremely
time consuming; thus, we developed Oinker, a tool that makes it easier to write
Snort rules. Oinker also facilitates working with multiple files simultaneously.
Future work
Although we have proven that our technique has worked, we feel that it can
certainly be improved. The process of analyzing the traffic generated by the tools
can be time consuming, and in some environments, impractical. Since we know
how network protocols should behave based on the standards set forth by the
185

RFC’s, we believe the analysis of reconnaissance traffic and rule creation can be
automated. However, the work to automate the kind of analysis done for this thesis
may well be suitable for doctoral-level research.
186

References
[1] The Atlas of Cyberspaces, Historical Maps of Computer Networks
http://www.cybergeography.org/atlas/historical.html
[2] Internet Software Consortium (2003), “Internet Domain Survey” http://www.isc.org/index.pl?/ops/ds/
[3] CERT (2003), “CERT/CC Statistics 1988-2003”
http://www.cert.org/stats/cert_stats.html
[4] CSI/FBI (2003), “Computer Crime and Security Survey”, Computer Security Institute, http://www.gocsi.com/forms/fbi/pdf.jhtml
[5] S. Corcoran (2001), Peiter “Mudge” Zatko From the L0pht to the West
Wing http://infosecuritymag.techtarget.com/articles/november01/people_mudge.shtml
[6] E. H. Spafford (1991), “The Internet Worm Incident”,
http://citeseer.nj.nec.com/spafford91internet.html
[7] S. M. Bellovin (1989), “Security Problems in the TCP/IP Protocol Suite”, http://citeseer.ist.psu.edu/cache/papers/cs/5603/http:zSzzSzwww.ja.netzSzCERTzSzJANET-CERTzSz..zSzBellovinzSzTCP-IP_Security_Problems.pdf/bellovin89security.pdf
[8] J. Viega (2003), “Secure Programming Cookbook for C and C++”, Orielly
[9] S. M. Bellovin (1992), “Packets Found on an Internet”,
http://www.research.att.com/~smb/papers/packets.ps.
[10] V. Jayaswal, W. Yurcik, D. Doss (2002), “Internet Hack Back: Counter Attacks as Self-Defense or Vigilantism?”, IEEE 2002 Technology and Society International Symposium
[11] Recourse Technologies (2002), “The Evolution of Deception Technologies
as a Means for Network Defense”, SANS Reading Room http://www.sans.org/rr/wp/recourse.pdf
187

[12] S. Northcutt, M. Cooper, M. Fearnow, K. Frederick (2001), “Intrusion
Signature and analysis”, 1st Edition, New Riders Publishing
[13] L. Spitzner (2003), “Honeypots: Tracking Hackers”, Addison Wesley
[14] Juels, J. Brainard (1999), “Client Puzzles: A cryptographic Countermeasure Against Connection Depletion Attacks”, RSA Security http://www.rsasecurity.com/rsalabs/node.asp?id=2050
[15] C. Castaldi (2004), “Behavioral network Security: Is it right for your
company”, Computerworld, http://www.computerworld.com/printthis/2004/0,4814,93096,00.html
[16] Mazu Networks (2004), “Mazu Enforcer, an overview”, Mazu Netowrks,
http://www.mazunetworks.com/
[17] F. Cohen (1999), “A mathematical structure of simple defensive network deceptions”, Fred Cohen and Associates, http://www.all.net/journal/deception/mathdeception/mathdeception.html
[18] L. Liebmann (2002), “Counterespionage for networks”, Comnews.com,
http://www.comnews.com/stories/articles/c0702bottom.htm
[19] D. B. Moran (2000), “Trapping and Tracking Hackers: Collective security for survival in the internet”, CERT, http://www.cert.org/research/isw/isw2000/papers/15.pdf
[20] ForeScout Technologies (2002), “Beyond Detection: Neutralizing Attacks
Before They Reach the Firewall”, eSecure Live, http://www.esecurelive.com/whitepapers/BeyondDetectionWhitePaper.pdf
[21] C. C. Zou, L. Gao, W. Gong, D. Towsley (2003), “Monitoring and Early
Warning for Internet Worms”, Proceedings of the 10th ACM conference on Computer and communication security
[22] Happy Trails Computer Club (2004), “Scanning Worms”, CyberCoyote.org,
http://cybercoyote.org/security/av-worms.htm
[23] N. Weaver, V. Paxson, S. Staniford, R. Cunningham (2003), “Taxonomy of Computer Worms”, ACM Workshop on Rapid Code.
188

[24] P. Barford, J. Kline, D. Plonka, A. Ron (2002),”A Signal Analysis of
Network Traffic Anomalies”, Internet Measurement Workshop 2002 http://www.icir.org/vern/imw-2002/imw2002-papers/173.pdf
[25] M. Handley, V. Paxson (2001), “Network Intrusion Detection: Evasion,
Traffic Normalization, and End-to-End Protocol Semantics”, ICIR (The ICSI Center for Internet Research), http://www.icir.org/vern/papers/norm-usenix-sec-01.pdf
[26] M. Bykova, S. Ostermann (2002), “Statistical Analysis of Malformed
Packets and their Origins in the Modern Internet”, CiteSeer, http://citeseer.ist.psu.edu/cache/papers/cs/26755/http:zSzzSzwww.icir.orgzSzvernzSzimw-2002zSzimw2002-paperszSz129.pdf/bykova02statistical.pdf
[27] S. Staniford, J. Hoagland, J. McAlerney (2002), “Practical Automated
Detection of Stealthy Portscans”. ACM Journal of Computer Security
[28] C. Lee, C. Roedel, E. Silenok (2003), “Detection and Characterization of Port Scan Attacks”, Univeristy of California, Department of Computer Science and Engineering, http://www.cs.ucsd.edu/users/clbailey/PortScans.pdf
[29] Millican (2003), “Network Reconnaissance – Detection and Prevention”,
SANS Institute, http://www.giac.org/practical/GSEC/Andy_Millican_GSEC.pdf
[30] J.Jung, V. Paxson. A. Berger, H Balakrishnan (2004), “Fast Portscan
Detection Using Sequential Hypothesis Testing”, Proceedings IEEE Symposium on security and Privacy.
[31] Recourse Technologies (2001), “Attacks and Countermeasures: A study of
Network Attack”, SecurityTechNet.com,http://cnscenter.future.co.kr/resource/rsc-center/vendor-wp/recourse/Attacks.pdf
[32] P. Anderson (2001), “Deception: a healthy part of any defense in-depth
strategy”, SANS Institute,http://www.sans.org/rr/papers/50/506.pdf
189

[33] Yasinsac, Y. Manzano (2002), “Honeytraps, A Network Forensic Tool”, Florida State University http://www.cs.fsu.edu/~yasinsac/Papers/YM02.pdf
[34] N. Gupta (2003), “Improving the effectiveness of deception honeynets
through an empirical learning approach. ”, Securitytechnet.com, http://cnscenter.future.co.kr/resource/security/ids/Gupta_Honeynets.pdf
[35] X. Geng, A. Whinston (2000), “Defeating Distributed Denial of Service
Attacks”, IEEE IT Pro
[36] Ethereal, The world's most popular network protocol analyzer http://www.ethereal.com/
[37] Snort.org, The Open Source Network Intrusion Detection System,
http://www.snort.org/
[38] Naval Surface Warfare Center (NSWC), NSWC Shadow Index, NSWC http://www.nswc.navy.mil/ISSEC/CID/
[39] J. Koziol (2003), “ Intrusion Detection with Snort”, SAMS Publishing
[40] S.Northcutt (2003), “Network Intrusion Detection”, 3rd Edition, New
Riders Publishing
[41] W. R. Stevens (1994), “TCP/IP Illustrated, Volume 1 The Protocols”, Addison-Wesley Publishing
[42] S. Carl-Mitchell, J. S. Quarterman (1993), “Practical Internetworking with
TCP/IP and UNIX”, Addison-Wesley Publishing
[43] S. M. Bellovin (1989), “Security problems in the TCP/IP Protocol Suite”, Computer Communications Review 2:19, pp. 32-48
[44] Unix Insider (2001), “Using TCP/IP against itself”, ITWorld.com,
http://security.itworld.com/4339/UIR010410tcpip1/pfindex.html
[45] Cryptonomicon (2004), “Vulnerability in TCP/IP Exposed”, Cryptonomicon.net, http://www.cryptonomicon.net/modules.php?name=News&file=print&sid=746
190
[46] NISCC (2004), “Vulnerabilities Issues in TCP”, NISCC Vulnerability Advisory,http://www.uniras.gov.uk/vuls/2004/236929/index.htm
[47] Chambers, J. Dolske, J. Iyer (1998), “TCP/IP Security”,
LinuxSecurity.com, http://www.linuxsecurity.com/resource_files/documentation/tcpip-security.html
[48] CERT (2002), “Information Security for Technical Staff Module 5: TCP/IP
Security”, Networked Systems
[49] CERT Advisory (1996), "TCP SYN Flooding and IP Spoofing Attacks",CERT Coordination Center, http://www.cert.org/advisories/CA-1996-21.html
[50] CERT® Advisory (1998), "Vulnerability in Certain TCP/IP
Implementations",CERT Coordination Center, http://www.cert.org/advisories/CA-1998-13.html#AppendixA
[51] CERT Advisory (2000), "Denial-of-Service Vulnerabilities in TCP/IP
Stacks", CERT Coordination Center, http://www.cert.org/advisories/CA-2000-21.html
[52] BindView (2001), "Strange Attractors and TCP/IP Sequence Number
Analysis", BindView, http://www.bindview.com/Support/RAZOR/Papers/2001/tcpseq.cfm
[53] M.Zalewski (), "Strange Attractors and TCP/IP Sequence Number Analysis
- One Year Later", BindView Razor Team, http://lcamtuf.coredump.cx/newtcp/
[54] Request for Comments (1981), “Transmission Control Protocol DARPA
Internet Program Protocol SPECIFICATION”, FAQS.com, http://www.faqs.org/rfcs/rfc793.html
[55] J. S. Havrilla (2001), "Multiple TCP/IP implementations may use
statistically predictable initial sequence numbers", US-CERT, http://www.kb.cert.org/vuls/id/498440
[56] US-CERT (2004) "Vulnerabilities in TCP", US-CERT, http://www.us-
cert.gov/cas/techalerts/TA04-111A.html
191

[57] Osborne (1999), "NAI-Sep201999: Windows IP Source Routing Vulnerability", Network Associates, http://www.securityfocus.com/advisories/1761
[58] Microsoft (), “Chapter 5 - Security Design Reference Architecture Guide”,
Version 1.5, Revision 1, Microsoft Corp., http://www.microsoft.com/resources/documentation/msa/idc/all/solution/en-us/rag/ragc05.mspx
[59] Freesoft.org, “RIP Protocol Overview”,
http://www.freesoft.org/CIE/Topics/90.htm
[60] K. Downes, M. Ford, H. K. Lew, S. Spanier, T. Stevenson (1998), “ Internetworking Technologies Handbook”, 2nd Edition, Cisco Press
[61] NIUNet, http://cs.baylor.edu/~donahoo/NIUNet/hijack.html
[62] CERT Advisory (2001), “CA-2001-09 Statistical Weaknesses in TCP/IP
Initial Sequence Numbers”, http://www.cert.org/advisories/CA-2001-09.html
[63] E. Hines (2002), “ Non blind IP Spoofing and session Hijacking: A Diary
from the garden of good and evil”, Fatelabs.com, http://www.fatelabs.com/library/non-blind-hijacking.pdf
[64] Paul A. Watson (2003), “Slipping in the Window: TCP Reset attacks”,
OSVDB.net, http://www.osvdb.org/reference/SlippingInTheWindow_v1.0.doc
[65] Jeremy (2004), “Feature: Understanding TCP Reset Attacks, Part I”,
http://kerneltrap.org/node/view/3072
[66] SANS (2001), “ICMP Attacks Illustrated”, SANS Institute, http://www.sans.org/rr/papers/60/477.pdf
[67] C. Huegen (2000), “The latest in denial of servers attacks: “Smurfing”
Description and Information to minimize effect”, http://www.pentics.net/denial-of-service/white-papers/smurf.cgi
[68] O. Arkin (2002), “remote Active fingerprinting tool using ICMP”, Sys-
Security http://www.sys-security.com/archive/articles/login.pdf
192

[69] O. Arkin, F. Yarochkin, M. Kydyraliev (2003), “The Present and Future of Xprobe2 - The Next Generation of Active Operating System Fingerprinting”, Sys-Security, http://www.sys-security.com/archive/papers/Present_and_Future_Xprobe2-v1.0.pdf
[70] O. Arkin, F. Yarochkin (2002), “XProbe2 - A 'Fuzzy' Approach to Remote
Active Operating System Fingerprinting”, http://www.sys-security.com/archive/papers/Xprobe2.pdf
[71] O. Arkin (2001), “X remote ICMP based OS fingerprinting tool
techniques”, Sys-Security, http://www.sys-security.com/archive/papers/X_v1.0.pdf
[72] O. Arkin (2001) , “ICMP Usage In Scanning”, Sys-Security,
http://www.sys-security.com/archive/papers/ICMP_Scanning_v3.0.pdf
[73] B. B. Bhansali (2001), “Man-In-the-Middle-Attack – A Brief”, SANS Institute, http://www.giac.org/practical/gsec/Bhavin_Bhansali_GSEC.pdf
[74] Kimble Consultancy Services, “DNS Attacks”,
http://mapage.noos.fr/kimble/papers/security/img42.html
[75] CERT (2001), “Denial of Service Attacks using Name servers”, CERT Coordination Center, http://www.cert.org/incident_notes/IN-2000-04.html
[76] Network Sorcery, “DNS, Domain Name System”,
http://www.networksorcery.com/enp/protocol/dns.htm
[77] Network Sorcery, RFC830, http://www.networksorcery.com/enp/rfc/rfc830.txt
[78] J. Mirkovic, J. Martin, P. Reiher (2001), “A Taxonomy of DDoS Attacks
and DDoS Defense Mechanisms ”, http://lasr.cs.ucla.edu/ddos/ucla_tech_report_020018.pdf
[79] K. Mitnick (2002), “The Art of Deception”, Indiana: Wiley Publishing
[80] D. Parker (2004), “TCP/IP Skills Required for Security Analysts”, Security
Focus, http://www.securityfocus.com/infocus/1779
193

[81] Truncode (2003), “Passive Network Reconnaissance: Syn packet Analysis”,http://64.233.161.104/search?q=cache:JGVvmp8kEHAJ:truncode.org/files/papers/PNR-SYNPacketAnalysis.txt+Passive+Network+Reconnaissance:+Syn+packet+Analysis&hl=en
[82] S. Northcutt (2003), “Network Perimeter Security”, New Riders Publishing
[83] American Registry for Internet Numbers (ARIN),
http://www.arin.net
[84] Asia Pacific Network Information Centre (APNIC), http://www.apnic.org
[85] Latin American and Caribbean IP address Regional Registry (LACNIC), http://www.lacnic.org
[86] RIPE Network Coordination Centre (RIPE NCC), http://www.ripencc.org
[87] African Network Information Center (AfriNIC) http://www.afrinic.org
[88] Register, http://www.register.com
[89] Network Solutions, http://www.networksolutions.com
[90] Central Ops, http://centralops.net/co/
[91] BlackCode, http://centralops.net/co/
[92] adHOC Tools,
http://tatumweb.com/iptools.htm
[93] Analog, http://www.analogx.com/contents/dnsdig.htm
194
[94] Jargon File (2001), “JARGON FILE Version:4.3.1” http://www.elsewhere.org/jargon/jargon.html
[95] Microsoft Internet Data Center Resources,
http://www.microsoft.com/resources/documentation/msa/idc/all/solution/en-us/rag/ragc05.mspx
[96] S. McClure, J. Scambray, G. Kurtz (2001), “ Hacking Exposed: Third Edition”, McGraw-Hill Companies
[97] S. Litt (1999), “IP Forwarding”, Troubleshooters.com,
http://www.troubleshooters.com/linux/ip_fwd.htm
[98] B. B. Bhansali (2001),”Man-in-the-middle Attack Brief”, SANS http://ouah.kernsh.org/mitmbrief.htm
[99] ISS, “SYN Flood”, Internet Security Systems,
http://www.iss.net/security_center/advice/Exploits/TCP/SYN_flood/default.htm
[100] Defcon 9, “Routing & Tunneling Protocol Attacks”,
http://www.geektown.de/doc/routing.pdf
[101] Switch (1999), “Default TTL Values in TCP/IP”, http://secfr.nerim.net/docs/fingerprint/en/ttl_default.html
[102] Toby Miller (2001), “Passive OS fingerprinting: Details and Techniques”, http://www.incidents.org/papers/OSfingerprinting.php
[103] Guy Burneau (2001), “The History and Evolution of Intrusion Detection”
http://www.sans.org/rr/papers/index.php?id=344
[104] L. R. Halme, R. K. Bauer (2002), “AINT Misbehaving: A Taxonomy of Anti-Intrusion Techniques” http://www.sans.org/resources/idfaq/aint.php
[105] M. Bykova, S. Ostermann, B. Tjaden (2001), “Detecting Network Intrusions via a Statistical Analysis of Network Packet Characteristics”, 33rd Southeastern Symposium on System Theory
[106] M. Phung (2000), “Data Mining in Intrusion Detection”,
http://www.sans.org/resources/idfaq/data_mining.php
195

[107] SPIKE (2003), “A Comparison of Anomaly detection techniques”,
http://users.ox.ac.uk/~exet1386/pdf/
[108] T. Abraham (2001), “ IDDM: Intrusion Detection using Data Mining Techniques”, http://www.dsto.defence.gov.au/corporate/reports/DSTO-GD-0286.pdf
[109] W. Lee, S. J. Stolfo (1998), “Data Mining Approaches for Intrusion
Detection”, 7th USENIX Security Symposium, 1998, http://www.usenix.org/publications/library/proceedings/sec98/full_papers/lee/lee.pdf
[110] G. Smitth (2000), “A Brief Taxonomy of Firewalls- Great Walls of Fire”,
http://www.giac.org/practical/gsec/Gary_Smith_GSEC.pdf
[111] P. Kazienko, P. Dorosz (2003), “Intrusion Detection Systems (IDS) Part I - (network intrusions; attack symptoms; IDS tasks; and IDS architecture)”, http://www.windowsecurity.com/pages/article_p.asp?id=1147
[112] P. Kazienko, P. Dorosz (2004), “Intrusion Detection Systems (IDS) Part 2
- Classification; methods; techniques”, http://www.windowsecurity.com/pages/article_p.asp?id=1335
[113] E. Eskin, Et Al (2001), “Adaptive Model Generation for Intrusion Detection Systems” http://philby.ucsd.edu/~cse291_IDVA/papers/eskin,miller,zhong,yi,lee,stolfo.adaptive_model_generation_for_intrusion_detection_systems.pdf
[114] C. Boeckman (2000), “Getting Closer to Policy-Based Intrusion
Detection Systems, Security Bulletin May 2000 http://www.chi-publishing.com/portal/backissues/pdfs/ISB_2000/ISB0504/ISB0504CB.pdf
[115] E. E. Schultz (2000), “Policy-based Intrusion Detection (Finally)”,
Security Bulletin May 2000
[116] E. Sekar, Et. Al (2002), “Specification-based anomaly detection: a new approach for detecting network intrusions”, Proceedings of the 9th ACM conference on Computer and communications security November 2002
196

[117] Bro: A System for Detecting Network Intruders in Real-Time,
http://www.icir.org/vern/bro-info.html
[118] Shadow Version 1.8 Installation Manual, http://www.nswc.navy.mil/ISSEC/CID/SHADOW-1.8-Install.pdf
[119] B. Caswell, Et Al (2003), “Snort 2.0 Intrusion Detection”, Syngress
Publishing [120] Yoann Vandoorselaere, “Prelude: an Open Source, Hybrid Intrusion
Detection System”, http://www.prelude-ids.org/article.php3?id_article=66
[121] R. Magalhaes (2003), “Host-Based IDS vs Network-Based IDS (Part 1)”,
http://www.windowsecurity.com/articles/Hids_vs_Nids_Part1.html
[122] P. Innella, et al (2001), “ The Evolution of Intrusion Detection Systems”, http://www.securityfocus.com/infocus/1514
[123] N. Desai (2003), “Intrusion Prevention Systems: the Next Step in the
Evolution of IDS”,
http://www.securityfocus.com/infocus/1670
[124] R. Ford, H. Ray (2004), “Googling for Gold: Web Crawlers, Hacking and Defense Explained”, Network Security, January 2004, vol. 2004, iss. 1, pp. 10-13(4) Elsevier Science
[125] Webopedia (2004), Online dictionary for computer and Internet
technology definitions, http://networking.webopedia.com/TERM/A/active_reconnaissance.html
[126] H. So (2002), GIAC Intrusion Detection In Depth, http://www.sans.org/rr/papers/23/836.pdf
[127] NMAP, Insecure.org http://www.insecure.org/nmap/nmap_documentation.html
[128] Nmap network security scanner man page, http://www.insecure.org/nmap/data/nmap_manpage.html
[129] SNMPWALK, http://www.mkssoftware.com/docs/man1/snmpwalk.1.asp
197
[130] Fyodor (1998), Remote OS detection via TCP/IP Stack fingerprinting http://www.insecure.org
[131] L. Spitzner (2000), “Passive Fingerprinting: IDing remote hosts, without
them knowing”, Honey Pot Project, http://www.honeynet.org
[132] L. Spitzner (2002), “Know Your Enemy: Passive Fingerprinting”, Honey Pot Project, http://www.honeynet.org
[133] P. Zatko (2004), “Inside the insider threat”, Computer World June 14,
2004, http://www.computerworld.com/
[134] SearchNetworking.com,
http://searchnetworking.techtarget.com/sDefinition/0,,sid7_gci511650,00.html
[135] Sniffit,
http://reptile.rug.ac.be/~coder/sniffit/sniffit.html
[136] RFC 826, Ethernet Address Resolution Protocol http://www.faqs.org/rfcs/
[137] Dsniff,
http://www.monkey.org/~dugsong/dsniff/
[138] Ettercap, http://ettercap.sourceforge.net/
[139] Hunt, http://lin.fsid.cvut.cz/~kra/index.html
[140] Fragroute,
http://www.monkey.org/~dugsong/fragroute/
[141] C. Russel(2001), “Penetration Testing with dsniff”,SANS, http://www.sans.org
[142] TCPDump man page,
http://www.tcpdump.org
198
[143] L0pht Heavy Industries (1999), “AntiSniff – User Guide.”,
http://www.atstake.com/antisniff/tech-paper.html
[144] R. Spangler (2003), “Packet Sniffer Detection with AntiSniff”, http://www.packetwatch.net/
[145] R. Spangler (2003), “Packet Sniff on Layer 2 Switched Local Area
Networks”, http://www.packetwatch.net/
[146] ARPWatch, LBNL's Network Research Group,
http://www-nrg.ee.lbl.gov/
[147] RFC 791, Internet Protocol Specification [148] RFC 792, Internet Message Control Protocol
[149] RFC 790, Assign Protocols
[150] RFC 768, User Datagram Protocol
[151] P. Dubois (2003), “MySQL, The definitive guide to using, programming,
and administering MySQL 4”, 2nd Edition, Sams
[152] MySQL, The world's most popular open source database, http://www.mysql.com
[153] Analysis Console for Intrusion Databases,
http://www.andrew.cmu.edu/user/rdanyliw/snort/snortacid.html
[154] M. Peters, “Construction and Use of a Passive Ethernet Tap”, Snort http://www.snort.org/docs/tap/
[155] How-TO-Ethernet Cables,
http://www.ertyu.org/~steven_nikkel/ethernetcables.html
[156] Security Space, icmp timestamp request http://www.securityspace.com/smysecure/catid.html?viewsrc=1&id=10114
199

[157] ICMP types, Faqs.org, http://www.faqs.org/docs/iptables/icmptypes.html
[158] Manual Reference Pages for BPF,
http://www.gsp.com/cgi-bin/man.cgi?section=4&topic=bpf#2
[159] IP Protocol Suite, Network Sorcery, http://www.networksorcery.com/enp/topic/ipsuite.htm
[160] ICMP Type Numbers, Internet Assigned Numbers Authority http://www.iana.org/assignments/icmp-parameters
[161] Curt Wilson (2000), “Protecting Network Infrastructure at the Protocol Level”, SANS
200
Appendix A The information in this appendix was taken from the man pages developed by the
respective programmer of each tool.
ETTERCAP MAN PAGE
USAGE: ettercap [OPTIONS] [HOST:PORT] [HOST:PORT] [MAC] [MAC]
Five sniffing methods:
+ IPBASED, the packets are filtered matching IP:PORT source and IP:PORT dest
+ MACBASED, packets filtered matching the source and dest MAC address.
(useful to sniff connections through gateway)
+ ARPBASED, uses arp poisoning to sniff in switched LAN between two hosts
(full-duplex m-i-t-m).
+ SMARTARP, uses arp poisoning to sniff in switched LAN from a victim host to
all other hosts knowing the entire list of the hosts (full-duplex m-i-t-m).
+ PUBLICARP, uses arp poison to sniff in switched LAN from a victim host to all
other hosts (half-duplex).
With this method the ARP replies are sent in broadcast, but if ettercap has the
complete host list (on start up it has scanned the LAN) SMARTARP method is
automatically selected, and the arp replies are sent to all the hosts but the victim,
avoiding conflicting MAC addresses as reported by win2K.
201
The most relevant ettercap features are:
Characters injection in an established connection: you can inject character to
server (emulating commands) or to client (emulating replies) maintaining the
connection alive !!
SSH1 support: you can sniff User and Pass, and even the data of an SSH1
connection. ettercap is the first software capable to sniff an SSH connection in
FULL-DUPLEX
HTTPS support: you can sniff http SSL secured data... and even if the connection
is made through a PROXY
Remote traffic sniffing through GRE tunnel: you can sniff remote traffic
through a GRE tunnel from a remote cisco router and make mitm attack on it
Plug-ins support: You can create your own plugin using the ettercap's API.
Password collector for: TELNET, FTP, POP, RLOGIN, SSH1, ICQ, SMB,
MySQL, HTTP, NNTP, X11, NAPSTER, IRC, RIP, BGP, SOCKS 5, IMAP 4,
VNC, LDAP, NFS, SNMP, HALF LIFE, QUAKE 3, MSN, YMSG (other
protocols coming soon...)
202

Packet filtering/dropping: You can set up a filter chain that search for a particular
string (even hex) in the TCP or UDP payload and replace it with yours or drop the
entire packet.
Passive OS fingerprint: you scan passively the lan (without sending any packet)
and gather detailed info about the hosts in the LAN: Operating System, running
services, open ports, IP, mac address and network adapter vendor.
OS fingerprint: you can fingerprint the OS of the victim host and even its network
adapter (it uses the nmap (c) Fyodor database)
Kill a connection: from the connections list you can kill all the connections you
want
Packet factory: You can create and sent packet forged on the fly. The factory let
you to forge from Ethernet header to application level.
Bind sniffed data to a local port:You can connect to that port with a client and
decode unknown protocols or inject data to it (only in arp based mode)
Options
Options that make sense together can generally be combined. ettercap will warn the
user about unsupported option combinations.
203

Sniffing Methods
-a, --arpsniff
ARP BASED sniffing
This is THE sniffing method for switched LAN, and if you want to use the
man-in-the-middle technique you have to use it. In conjunction with the
silent mode (-z option) you must specify two IP and two MAC for
ARPBASED (full-duplex) or one IP and one MAC for PUBLICARP (half-
duplex). in PUBLICARP the ARP replies are sent in broadcast, but if
ettercap has the complete host list (on start up it has scanned the LAN)
SMARTARP method is automatically selected, and the arp replies are sent
to all the hosts but the victim, and an hash table is created to re-route back
the packet form victim to client obtaining in this way a full-duplex man in
the middle attack.
NOTE: if you manage to poison a client with the smart arp sniffing,
remember to set the gateway's IP in the conf file (GWIP option) and load it
with the -e option, otherwise that client will not be able to connect to remote
hosts.
Filters that have as action a replacement or a drop, can be used only with
ARPBASED sniffing because it is necessary to re-adjust the sequence
number in full-duplex in order to maintain the connection alive.
204

-s, --sniff
IP BASED sniffing
This is the good old style sniffing method. It rocks on "hubbed" LAN, but
useless on switched ones. You can choose the target specifying only source,
only dest, with or without port, or nothing (to sniff all connections). A
special ip "ANY" means from or to every host.
-m, --macsniff
MAC BASED sniffing
Very useful to sniff TCP traffic with remote hosts. On hubbed LANs if you
want to sniff a connection through a gateway is useless to specify the
victim's ip and the gateway's ip, because the packet are for an external host,
not for the gateway. So you can use this method. Simply specify the victim's
MAC and the gateway's MAC and you will see all the connections from and
to the Internet.
Off Line Sniffing
-T, --readpcapfile <FILE>
OFF LINE sniffing
With this option enabled, ettercap will sniff packets from a pcap compatible
file instead of capturing from the wire.
This is useful if you have a file dumped from tcpdump or ethereal and you
want to make an analysis (search for passwords or passive fingerprint) on it.
205

-Y, --writepcapfile <FILE>
DUMP packet to a pcap file
This is useful if you have to use active-sniffing (arp poison) on a switched
LAN but you want to analyze the packets with tcpdump or ethereal. You
can use this option to dump the packets to a file and then load it into your
favourite application.
General Options
-N, --simple
NON interactive mode (without ncurses)
This method is useful if you want to launch ettercap from a script or if you
already know some informations of your target or if you want to launch
ettercap in background collecting data or password for you (in combination
with the --quiet option).
Some features are not available in this method, obviously the ones which
requires interaction with the user, such as characters injection. But others
(for example filtering) are fully supported, so you can set up ettercap to
poison two host (a victim and its gateway) and to filter all its connection on
the port 80 and replace some string with others, all its traffic to the Internet
will be changed as you wish.
206

-z, --silent
start in silent mode (no arp storm on start up)
If you want to launch ettercap with a non invasive method (some NIDS may
raise a warn if they detects too much arp request). You have to know all the
requested data of the target in order to use this options. For example if you
want to poison two host, you need the two IP and the two MAC addresses
of the victims. If you select ipsniff or macsniff this method is automatically
selected, because you don't need to know the list of the host in the LAN.
To know the entire list of the hosts use "ettercap -Nl", but remember that it
is a invasive method.
-O, --passive
Collect infos in passive mode. This method WILL NOT SEND ANY packet
on the wire. It will put the interface in promiscuous mode and look for
packets passing through it. every interesting packet (SYN or SYN+ACK) is
analyzed and used to make a complete map of the LAN.
The infos collected are: IP and MAC of the hosts, type of Operating System
(passive OS fingerprint), network adapter vendor and running services. (for
a technical description refer to README) In the list are show even other
infos: "GW" if the host is a GateWay, "NL" if the IP is not belonging to the
LAN and "RT" if the host act as a router.
Useful if you want to make a start up host list in complete passive mode,
207

when you are satisfied of the collected infos, you can convert it to the
startup host list by simply press 'C', and then work as usual.
The description of its functionality in simple mode is explained in the next
section.
-b, --broadping
use a broadcast ping instead of arp storm on start up.
this method is less intrusive, but even less accurate. some hosts will not
respond at the broadcast ping (es. Windows) so they remain invisible to this
method. Useful if you want to scan a LAN with Linux hosts. As usual you
can combine this option with --list to have a list of the hosts "ettercap -Nlb"
-D, --delay <n sec>
the delay in seconds between the arp replies if you have selected an ARP
poison sniffing method. This is useful if you want to be less aggressive in
the poisoning. On many OS the default validity interval of the arp cache is
more than a minute (on FreeBSD is 1200 sec).
The default delay value is 30 sec.
-Z, --stormdelay <n usec>
the delay in micro-seconds between the arp request on arp storm at start up.
This is useful if you want to be less aggressive in the scanning. Many IDS
will report massive arp request, but if you send them in a slower rate, they
208

will not report any strange behavior.
The default delay value is 1500 usec.
-r, --refresh <n sec>
ettercap will refresh its internal connection list after n seconds. Set a low
value if you have huge traffic load.
The default delay value is 300 sec.
-B, --bufferlen <n pck>
the lenght of each connection buffer. 0 will disable connection buffers. Last
n packets of each connection will be saved for visualization and logging
from ncurses interface.
The default value is 3.
-S, --spoof <IP>
If you want to elude some IDS, you can specify a spoofed IP used to scan
the LAN with arp request. The source MAC can't be spoofed because a well
configured switch will block your request.
-H, --hosts <IP1[;IP2][;IP3][;...]>
on start up, scan only these hosts.
this is useful if you want to use an ARP scanning of the LAN but only on
certain IPs. so you can benefit from a ARP scan but remaining less invasive.
Useful even if you want to do PUBLIC ARP but you want to poison only
specific hosts. since with a list PUBLIC ARP is automatically converted to
209

SMARTARP, only these host will be poisoned and you can leave
untouched the arp caches of the other hosts.
the IP list must be in dotted notation and separated by semi-colon (without
blank spaces between them), you can use range ip (use the hyphen) or
single ip list (use the comma).
EXAMPLES:
192.168.0.2-25 --> from 2 to 25
192.168.0.1,3,5 --> host 1, 3 and 5
192.168.0-3.1-10;192.168.4.5,7 --
> will scan from 1 to 10 in the 192.168.0, 192.168.1, 192.168.2, 192.168.3
subnet and hosts 5 and 7 in the 192.168.4
-d, --dontresolve
don't resolve IPs on start up. this is useful if you experience an insane
"Resolving n hostnames..." message on start up. This is due to a very slow
DNS in your environment.
210
-i, --iface <IFACE>
network interface to be used for all the operation. you can even specify
network aliases in order to scan a subnet with different ip form your current
one.
-n, --netmask <NETMASK>
the netmask used to scan the LAN. (in dotted notation). the default is your
current ifconfig netmask. but your netmask is for example 255.255.0.0 I
encourage you to specify a more restrictive one, if you managed to do an
ARP scanning on start up.
-e, --etterconf <FILENAME>
use the config file instead of command line options
etter.conf example file is packaged in the tarball, refer to it to know how to
write a config file. all the instruction are written in this example. via the
conf file you can disable selectively one protocol dissector or move it on
one other port.
command line options and config file can be mixed for much flexibility, but
remember that the options in the config file override the command line, so
if in etter.conf you have specified IFACE: eth0, and you launch "ettercap -i
eth1 -e etter.conf" the selected iface will be eth0.
NOTE: the "-e etter.conf" options has to be specified after all other options.
211

-g, --linktype
this flag has two complementary function. so mind it !
if used in interactive mode it DOESN'T check for lan type. On the other
hand, if used in conjunction with command line mode (-N) it DOES a check
to discover if you are on a switched LAN or not... Sometimes if there are
only 2 hosts in the lan this discovery method can fail.
-j, --loadhosts <FILENAME>
it is used to load an hosts list from a file created by the -k option. (see
below)
-k, --savehosts
saves the hosts list to a file. useful when you have many hosts and you don't
want to do an arp storm at startup any time you use ettercap. simply use this
options and dump the list to a file, then to load the information from it use
the -j <filename> option.
the file is in the form "netaddress_netmask.ehl"
-X, --forceip
disable the spoofed ICMP packet before poisoning.
-v, --version
check for the latest ettercap version.
All operation are under your control. Every step requires a user
confirmation. With this option ettercap will connect to the
212

http://ettercap.sourceforge.net:80 web site and ask for the page /latest.php.
then the result are parsed and compared with your current version. If there is
a newer version available, ettercap will ask you if you want to wget it.
(wget must be in the path).
If you want to automatically answer yes at all the question add the option -y
-h, --help
prints the help screen with a short summary of the available options.
Silent Mode Options (only combined with -N)
-t, --proto <PROTO>
sniff only PROTO packets (default is TCP + UDP). This option is only
useful in "simple" mode, if you start ettercap in interactive mode both TCP
and UDP are sniffed.
PROTO can be "tcp", "udp" or "all" for both.
-J, --onlypoison
With this option ettercap wont sniff anything, but it only poison the victims.
This can be useful if you want to poison with ettercap and sniff with
ethereal or tcpdump. (remember in this case to enable IP_forwarding).
Another use is for multitarget sniffing.
As you know, with ettercap you can sniff connection between two target
(ARP BASED) or to and from a single target (SMART ARP). With this
213

option you can sniff from couples of target at a time (as you have launched
many instance together).
Launch the first instance in SMART ARP, and use the -H options to
limitate the smart feature to the hosts you want to poison (remember that if
you want to involve the Gateway in the poisoning, you MUST select it from
the smart arp instance). Then launch the other "ettercap -J".
-R, --reverse
sniff all the connection but the selected one. This option is useful if you are
using ettercap on a remote machine and you want to sniff all the traffic but
you connection from local to remote, because including it will sniff even the
ettercap output and it will be screwed up...
-O, --passive
Collect infos in passive mode as described in the previous section. In simple
mode we can use this option in many mode.
"ettercap -NO" will start ettercap in semi-interactive mode, hit 'h' for help.
You can view or log to a file a detailed report of the collected infos, or
simply view each alert of analyzed packet.
"ettercap -NOL" as above but it log automatically the data into a file every 5
min.
"ettercap -NOLq" deminizes ettercap and log to a file every 5 minutes. Go
214
away and smoke your cigarette... return and a complete report of the lan is
there waiting for you... ;)
-p, --plugin <NAME>
run the external plugin "NAME".
most plugins need a destination host. simply specify it after plugin name, in
fact hosts are parsed on command line as first the DEST and so the
SOURCE.
To have a list of the available external plugins use "list" (without quotes) as
plugin name.
Since ettercap 0.6.2 hooking plugins system is provided, so some plugins
are not executed as a separated program, they can interact with ettercap and
can be enabled or disabled via the interface or conf file.
More detailed info about plugins and about how to write your own are
found in the README.PLUGINS file.
-l, --list
lists all the hosts in the LAN, reporting each MAC address.
Commonly combined options are -b (for broadcast ping) and -d (don't
resolve hostname).
215

-C, --collect
collect all users and password from the hosts specified on command line.
Password collector are configured in the config file (etter.conf), if you want
you can disable them selectively or move them on other port. This is useful
if you don't want to sniff SSH connection (the key change alert will raise
suspects) but want to sniff all other supported protocols. Or even if you
know that a host has the telnet service on port 4567, simply move the telnet
dissector on 4567/tcp
-f, --fingerprint <HOST>
do OS fingerprinting on HOST.
This option activates remote host identification via TCP/IP fingerprinting.
In other words, it uses a bunch of techniques to detect subtleties in the
underlying operating system network stack of the computers you are
scanning. It uses this information to create a 'fingerprint' which it compares
with its database of known OS fingerprints (the nmap-os-fingerprints file)
to decide what type of system you are scanning.
the -f options even provides you the vendor of the network adapter of the
scanned host. the info are stored in the mac-fingerprints database.
216

-1, --hexview
to dump data in hex mode.
TIP: while sniffing you can change the visualization mode by hitting 'a' for
ascii or 'x' for hex. on line help is recalled by 'h'.
-2, --textview
to dump data in text mode.
-3, --ebcdicview
to dump data in ebcdic mode.
-L, --logtofile
if used alone logs all data to specific file(s). it crates a separate file for each
connection in the form "YYYYMMDD-P-IP:PORT-IP:PORT.log" (under
unix) and "P-IP[PORT]-IP[PORT].log" under windows due to filename
limitations.
if used with -C (collector) it creates a file with all the password sniffed in
the session in the form "YYYYMMDD-collected-pass.log"
-q, --quiet
"demonize" ettercap.
useful if you want to log all data in background. this options will detach
ettercap from the current tty and set it as a demon collecting data to files. it
must be combined with -NL (or -NLC) otherwise it has no effects.
217

Obviously the sniffing method is required, so you have to combine it with
this option.
-w, --newcert
create a new cert file for HTTPS man-in-the-middle.
useful if you want to create a certfile with social engineered information...
the new file is created in the current working directory. to permanently
substitute the default cert file (etter.sll.crt) you have to overwrite
/usr/share/ettercap/etter.ssl.crt
-F, --filter <FILENAME>
load the filters chains from FILENAME
the Filtering chains file is written in pseudo XML format. You can write by
hand this file or (better) use the ncurses interface to let ettercap create it
(press 'F' in the connection list interface). If you are skilled in XML parsing,
you can write your own program to make a filter chain file.
the rules are simple:
If the proto <proto> AND the source port <source> AND the dest port
<dest> AND the payload <search> match the rules, after the filter as done
its action <action>, it jumps in the chain to the filter id specified in the
<goto> field, else it jumps to <elsegoto>. If these field are left blank the
218
chain is interrupted. Source and dest port equal to 0 (zero) means ANY port.
You can use wildcards in the search string (see README for detail)
NOTE: with this options filter are enabled by default, if you want to disable
them on the fly, press "S" (for source) or "D" (for dest) while sniffing
NOTE: on command line the hosts are parsed as "ettercap -F etter.filter
DEST SOURCE", so the first host is bound to the dest chain and the second
to the source chain.
VERY IMPORTANT: the source chain is applied to data COMING FROM
source and NOT GOING TO source. keep this in mind !! the same is for
dest...
-c, --check
check if you were poisoned by other poisoners in the LAN
219

ETHEREAL MAN PAGE
Options
-B
Sets the initial height of the byte view (bottom) pane.
-c
Sets the default number of packets to read when capturing live data.
-f
Sets the capture filter expression.
-h
Prints the version and options and exits.
-i
Sets the name of the network interface or pipe to use for live packet capture.
Network interface names should match one of the names listed in ``netstat -
i'' or ``ifconfig -a''. Pipe names should be either the name of a FIFO (named
pipe) or ``-'' to read data from the standard input. Data read from pipes must
be in libpcap format.
-k
Starts the capture session immediately. If the -i flag was specified, the
capture uses the specified interface. Otherwise, Ethereal searches the list of
interfaces, choosing the first non-loopback interface if there are any non-
loopback interfaces, and choosing the first loopback interface if there are no
220

non-loopback interfaces; if there are no interfaces, Ethereal reports an error
and doesn't start the capture.
-m
Sets the name of the font used by Ethereal for most text. Ethereal will
construct the name of the bold font used for the data in the byte view pane
that corresponds to the field selected in the protocol tree pane from the
name of the main text font.
-n
Disables network object name resolution (such as hostname, TCP and UDP
port names).
-o
Sets a preference value, overriding the default value and any value read
from a preference file. The argument to the flag is a string of the form
prefname:value, where prefname is the name of the preference (which is the
same name that would appear in the preference file), and value is the value
to which it should be set.
-p
Don't put the interface into promiscuous mode. Note that the interface might
be in promiscuous mode for some other reason; hence, -p cannot be used to
ensure that the only traffic that is captured is traffic sent to or from the
221
machine on which Ethereal is running, broadcast traffic, and multicast
traffic to addresses received by that machine.
-P
Sets the initial height of the packet list (top) pane.
-Q
Causes Ethereal to exit after the end of capture session (useful in batch
mode with -c option for instance); this option requires the -i and -w
parameters.
-r
Reads packet data from file.
-R
When reading a capture file specified with the -r flag, causes the specified
filter (which uses the syntax of display filters, rather than that of capture
filters) to be applied to all packets read from the capture file; packets not
matching the filter are discarded.
-S
Specifies that the live packet capture will be performed in a separate
process, and that the packet display will automatically be updated as
packets are seen.
-s
222

Sets the default snapshot length to use when capturing live data. No more
than snaplen bytes of each network packet will be read into memory, or
saved to disk.
-T
Sets the initial height of the tree view (middle) pane.
-t
Sets the format of the packet timestamp displayed in the packet list window.
The format can be one of `r' (relative), `a' (absolute), `ad' (absolute with
date), or `d' (delta). The relative time is the time elapsed between the first
packet and the current packet. The absolute time is the actual time the
packet was captured, with no date displayed; the absolute date and time is
the actual time and date the packet was captured. The delta time is the time
since the previous packet was captured. The default is relative.
-v
Prints the version and exits.
-w
Sets the default capture file name.
223

INTERFACE
Menu Items
File:Open, File:Close, File:Reload
Open, close, or reload a capture file. The File:Open dialog box allows a
filter to be specified; when the capture file is read, the filter is applied to all
packets read from the file, and packets not matching the filter are discarded.
File:Save, File:Save As
Save the current capture, or the packets currently displayed from that
capture, to a file. Check boxes let you select whether to save all packets, or
just those that have passed the current display filter and/or those that are
currently marked, and an option menu lets you select (from a list of file
formats in which at particular capture, or the packets currently displayed
from that capture, can be saved), a file format in which to save it.
File:Print
Prints, for all the packets in the current capture, either the summary line for
the packet or the protocol tree view of the packet; when printing the
protocol tree view, the hex dump of the packet can be printed as well.
Printing options can be set with the Edit:Preferences menu item, or in the
dialog box popped up by this item.
File:Print Packet
224

Print a fully-expanded protocol tree view of the currently-selected packet.
Printing options can be set with the Edit:Preferences menu item.
File:Quit
Exits the application.
Edit:Find Frame
Allows you to search forward or backward, starting with the currently
selected packet (or the most recently selected packet, if no packet is
selected), for a packet matching a given display filter.
Edit:Go To Frame
Allows you to go to a particular numbered packet.
Edit:Mark Frame
Allows you to mark (or unmark if currently marked) the selected packet.
Edit:Mark All Frames
Allows you to mark all packets that are currently displayed.
Edit:Unmark All Frames
Allows you to unmark all packets that are currently displayed.
Edit:Preferences
Sets the packet printing, column display, TCP stream coloring, and GUI
options (see the section on Preferences below).
Edit:Filters
225

Edits the saved list of filters, allowing filters to be added, changed, or
deleted, and lets a selected filter be applied to the current capture, if any.
Edit:Protocols
Edits the list of protocols, allowing protocol dissection to be enabled or
disabled.
Capture:Start
Initiates a live packet capture (see the section on Capture Preferences
below). A temporary file will be created to hold the capture. The location of
the file can be chosen by setting your TMPDIR environment variable before
starting Ethereal. Otherwise, the default TMPDIR location is system-
dependent, but is likely either /var/tmp or /tmp.
Capture:Stop
In a capture that updates the packet display as packets arrive (so that
Ethereal responds to user input other than pressing the ``Stop'' button in the
capture packet statistics dialog box), stops the capture.
Display:Options
Allows you to sets the format of the packet timestamp displayed in the
packet list window to relative, absolute, absolute date and time, or delta, to
enable or disable the automatic scrolling of the packet list while a live
capture is in progress or to enable or disable translation of addresses to
names in the display.
226

Display:Match Selected
Creates and applies a display filter based on the data that is currently
highlighted in the protocol tree. If that data is a field that can be tested in a
display filter expression, the display filter will test that field; otherwise, the
display filter will be based on absolute offset within the packet, and so
could be unreliable if the packet contains protocols with variable-length
headers, such as a source-routed token-ring packet.
Display:Colorize Display
Allows you to change the foreground and background colors of the packet
information in the list of packets, based upon display filters. The list of
display filters is applied to each packet sequentially. After the first display
filter matches a packet, any additional display filters in the list are ignored.
Therefore, if you are filtering on the existence of protocols, you should list
the higher-level protocols first, and the lower-level protocols last.
Display:Collapse All
Collapses the protocol tree branches.
Display:Expand All
Expands all branches of the protocol tree.
Display:Expand All
Expands all branches of the protocol tree.
Display:Show Packet In New Window
227

Creates a new window containing a protocol tree view and a hex dump
window of the currently selected packet; this window will continue to
display that packet's protocol tree and data even if another packet is
selected.
Tools:Plugins
Allows you to use and configure dynamically loadable modules (see the
section on Plugins below).
Tools:Follow TCP Stream
If you have a TCP packet selected, it will display the contents of the data
stream for the TCP connection to which that packet belongs, as text, in a
separate window, and will leave the list of packets in a filtered state, with
only those packets that are part of that TCP connection being displayed. You
can revert to your old view by pressing ENTER in the display filter text box,
thereby invoking your old display filter (or resetting it back to no display
filter).
The window in which the data stream is displayed lets you select whether to
display:
whether to display the entire conversation, or one or the other side of it;
whether the data being displayed is to be treated as ASCII or EBCDIC text or
as raw hex data;
228

and lets you print what's currently being displayed, using the same print
options that are used for the File:Print Packet menu item, or save it as text
to a file.
WINDOWS
Main Window
The main window is split into three panes. You can resize each pane using a
``thumb'' at the right end of each divider line. Below the panes is a strip that
shows the current filter and informational text.
Top Pane
The top pane contains the list of network packets that you can scroll through
and select. By default, the packet number, packet timestamp, source and
destination addresses, protocol, and description are displayed for each
packet; the Columns page in the dialog box popped up by Edit:Preferences
lets you change this (although, unfortunately, you currently have to save the
preferences, and exit and restart Ethereal, for those changes to take effect).
If you click on the heading for a column, the display will be sorted by that
column; clicking on the heading again will reverse the sort order for that
column.
229

An effort is made to display information as high up the protocol stack as
possible, e.g. IP addresses are displayed for IP packets, but the MAC layer
address is displayed for unknown packet types.
The right mouse button can be used to pop up a menu of operations.
The middle mouse button can be used to mark a packet.
Middle Pane
The middle pane contains a protocol tree for the currently-selected packet.
The tree displays each field and its value in each protocol header in the
stack. The right mouse button can be used to pop up a menu of operations.
Bottom Pane
The lowest pane contains a hex dump of the actual packet data. Selecting a
field in the protocol tree highlights the corresponding bytes in this section.
The right mouse button can be used to pop up a menu of operations.
Current Filter
A display filter can be entered into the strip at the bottom. A filter for HTTP,
HTTPS, and DNS traffic might look like this:
tcp.port == 80 || tcp.port == 443 || tcp.port == 53
230
Selecting the Filter: button lets you choose from a list of named filters that
you can optionally save. Pressing the Return or Enter keys will cause the
filter to be applied to the current list of packets. Selecting the Reset button
clears the display filter so that all packets are displayed.
Preferences
The Preferences dialog lets you control various personal preferences for the
behavior of Ethereal.
Printing Preferences
The radio buttons at the top of the Printing page allow you choose between
printing packets with the File:Print Packet menu item as text or PostScript,
and sending the output directly to a command or saving it to a file. The
Command: text entry box is the command to send files to (usually lpr), and
the File: entry box lets you enter the name of the file you wish to save to.
Additionally, you can select the File: button to browse the file system for a
particular save file.
Column Preferences
The Columns page lets you specify the number, title, and format of each
column in the packet list.
The Column title entry is used to specify the title of the column displayed at
the top of the packet list. The type of data that the column displays can be
231

specified using the Column format option menu. The row of buttons on the
left perform the following actions:
New
Adds a new column to the list.
Change
Modifies the currently selected list item.
Delete
Deletes the currently selected list item.
Up / Down
Moves the selected list item up or down one position.
OK
Currently has no effect.
Save
Saves the current column format as the default.
Cancel
Closes the dialog without making any changes.
TCP Stream Preferences
The TCP Streams page can be used to change the color of the text displayed
in the TCP stream window. To change a color, simply select an attribute
from the ``Set:'' menu and use the color selector to get the desired color.
The new text colors are displayed in a sample window.
232

GUI Preferences
The GUI page is used to modify small aspects of the GUI to your own
personal taste:
Scrollbars
The vertical scrollbars in the three panes can be set to be either on the left or
the right.
Selection Bars
The selection bar in the packet list and protocol tree can have either a
``browse'' or ``select'' behavior. If the selection bar has a ``browse''
behavior, the arrow keys will move an outline of the selection bar, allowing
you to browse the rest of the list or tree without changing the selection until
you press the space bar. If the selection bar has a ``select'' behavior, the
arrow keys will move the selection bar and change the selection to the new
item in the packet list or protocol tree. The highlight method in the hex
dump display for the selected protocol item can be set to use either inverse
video, or bold characters.
Fonts
The ``Font...'' button lets you select the font to be used for most text.
Colors
The ``Colors...'' button lets you select the colors to be used for instance for
the marked frames.
233

Protocol Preferences
There are also pages for various protocols that Ethereal dissects, controlling
the way Ethereal handles those protocols.
Filters
The Filters dialog lets you create and modify filters, and set the default
filter to use when capturing data or opening a capture file.
The Filter name entry specifies a descriptive name for a filter, e.g. Web
and DNS traffic. The Filter string entry is the text that actually describes
the filtering action to take, as described above.The dialog buttons perform
the following actions:
New
If there is text in the two entry boxes, it creates a new associated list item.
Change
Modifies the currently selected list item to match what's in the entry boxes.
Copy
Makes a copy of the currently selected list item.
Delete
Deletes the currently selected list item.
Apply
234
Sets the currently selected list item as the active filter, and applies it to the
current capture, if any. (The currently selected list item must be a display
filter, not a capture filter.) If nothing is selected, turns filtering off.
OK
Sets the currently selected list item as the active filter. If nothing is selected,
turns filtering off.
Save
Saves the current filter list in $HOME/.ethereal/filters.
Cancel
Closes the dialog without making any changes.
Capture Preferences
The Capture Preferences dialog lets you specify various parameters for
capturing live packet data.
The Interface: combo box lets you specify the interface from which to
capture packet data, or the name of a FIFO from which to get the packet
data. The Count: entry specifies the number of packets to capture. Entering
0 will capture packets indefinitely. The Filter: entry lets you specify the
capture filter using a tcpdump-style filter string as described above. The
File: entry specifies the file to save to, as in the Printer Options dialog
above. You can specify the maximum number of bytes to capture per packet
with the Capture length entry, can specify whether the interface is to be put
235

in promiscuous mode or not with the Capture packets in promiscuous mode
check box, can specify that the display should be updated as packets are
captured with the Update list of packets in real time check box, can specify
whether in such a capture the packet list pane should scroll to show the
most recently captured packets with the Automatic scrolling in live capture
check box, and can specify whether addresses should be translated to names
in the display with the Enable name resolution check box.
Display Options
The Display Options dialog lets you specify the format of the time stamp in
the packet list. You can select ``Time of day'' for absolute time stamps,
``Date and time of day'' for absolute time stamps with the date, ``Seconds
since beginning of capture'' for relative time stamps, or ``Seconds since
previous frame'' for delta time stamps. You can also specify whether, when
the display is updated as packets are captured, the list should automatically
scroll to show the most recently captured packets or not and whether
addresses should be translated to names in the display.
Plugins
The Plugins dialog lets you view and configure the plugins available on
your system.
236

The Plugins List shows the name, description, version and state (enabled or
not) of each plugin found on your system. The plugins are searched in the
following directories: /usr/share/ethereal/plugins,
/usr/local/share/ethereal/plugins and ~/.ethereal/plugins
A plugin must be activated using the Enable button in order to use it to
dissect packets. It can also be deactivated with the Disable button.
The Filter button shows the filter used to select packets which should be
dissected by a plugin (see the section on DISPLAY FILTER SYNTAX below).
This filter can be modified.
Capture Filter Syntax
Please refer to the TCPDUMP man page in this Appendix.
Display Filter Syntax
Display filters help you remove the noise from a packet trace and let you see only
the packets that interest you. If a packet meets the requirements expressed in your
display filter, then it is displayed in the list of packets. Display filters let you
compare the fields within a protocol against a specific value, compare fields against
fields, and to check the existence of specified fields or protocols.
237

The simplest display filter allows you to check for the existence of a protocol or
field. If you want to see all packets which contain the IPX protocol, the filter would
be ``ipx''. (Without the quotation marks) To see all packets that contain a Token-
Ring RIF field, use ``tr.rif''.
Fields can also be compared against values. The comparison operators can be
expressed either through C-like symbols, or through English-like abbreviations:
eq, == Equal
ne, != Not equal
gt, > Greater than
lt, < Less Than
ge, >= Greater than or Equal to
le, <= Less than or Equal to
Furthermore, each protocol field is typed. The types are:
Unsigned integer (either 8-bit, 16-bit, 24-bit, or 32-bit)
Signed integer (either 8-bit, 16-bit, 24-bit, or 32-bit)
Boolean
Ethernet address (6 bytes)
Byte string (n-number of bytes)
IPv4 address
IPv6 address
IPX network number
238

String (text)
Double-precision floating point number
An integer may be expressed in decimal, octal, or hexadecimal notation. The
following three display filters are equivalent:
frame.pkt_len > 10
frame.pkt_len > 012
frame.pkt_len > 0xa
Boolean values are either true or false. However, a boolean field is present in a
protocol decode only if its value is true. If the value is false, the field is not
presence. You can therefore check the truth value of a boolean field by simply
checking for its existence, that is, by naming the field. For example, a token-ring
packet's source route field is boolean. To find any source-routed packets, the
display filter is simply:
tr.sr
Non source-routed packets can be found with the negation of that filter:
! tr.sr
Ethernet addresses, as well as a string of bytes, are represented in hex digits. The
hex digits may be separated by colons, periods, or hyphens:
fddi.dst eq ff:ff:ff:ff:ff:ff
ipx.srcnode == 0.0.0.0.0.1
239
eth.src == aa-aa-aa-aa-aa-aa
If a string of bytes contains only one byte, then it is represented as an unsigned
integer. That is, if you are testing for hex value `ff' in a one-byte byte-string, you
must compare it agains `0xff' and not `ff'.
IPv4 addresses can be represented in either dotted decimal notation, or by using the
hostname:
ip.dst eq www.mit.edu
ip.src == 192.168.1.1
IPv4 address can be compared with the same logical relations as numbers: eq, ne,
gt, ge, lt, and le. The IPv4 address is stored in host order, so you do not have to
worry about how the endianness of an IPv4 address when using it in a display filter.
Classless InterDomain Routing (CIDR) notation can be used to test if an IPv4
address is in a certain subnet. For example, this display filter will find all packets in
the 129.111 Class-B network:
ip.addr == 129.111.0.0/16
240

Remember, the number after the slash represents the number of bits used to
represent the network. CIDR notation can also be used with hostnames, in this
example of finding IP addresses on the same Class C network as `sneezy':
ip.addr eq sneezy/24
The CIDR notation can only be used on IP addresses or hostnames, not in variable
names. So, a display filter like ``ip.src/24 == ip.dst/24'' is not valid. (yet) IPX
networks are represented by unsigned 32-bit integers. Most likely you will be using
hexadecimal when testing for IPX network values:
ipx.srcnet == 0xc0a82c00
A substring operator also exists. You can check the substring (byte-string) of any
protocol or field. For example, you can filter on the vendor portion of an ethernet
address (the first three bytes) like this:
eth.src[0:3] == 00:00:83
Or more simply, since the number of bytes is inherent in the byte-string you
provide, you can provide just the offset. The previous example can be stated like
this:
eth.src[0] == 00:00:83
In fact, the only time you need to explicitly provide a length is when you don't
provide a byte-string, and are comparing fields against fields:
241

fddi.src[0:3] == fddi.dst[0:3]
If the length of your byte-string is only one byte, then it must be represented in the
same way as an unsigned 8-bit integer:
llc[3] == 0xaa
You can use the substring operator on a protocol name, too. And remember, the
``frame'' protocol encompasses the entire packet, allowing you to look at the nth
byte of a packet regardless of its frame type (Ethernet, token-ring, etc.).
token[0:5] ne 0.0.0.1.1
ipx[0:2] == ff:ff
llc[3:1] eq 0xaa
Offsets for byte-strings can also be negative, in which case the negative number
indicates the number of bytes from the end of the field or protocol that you are
testing. Here's how to check the last 4 bytes of a frame:
frame[-4] == 0.1.2.3
or
frame[-4:4] == 0.1.2.3
All the above tests can be combined together with logical expressions. These too
are expressable in C-like syntax or with English-like abbreviations:
and, && Logical AND
242

or, || Logical OR
xor, ^^ Logical XOR
not, ! Logical NOT
Expressions can be grouped by parentheses as well. The following are all valid
display filter expression:
tcp.port == 80 and ip.src == 192.168.2.1
not llc
(ipx.srcnet == 0xbad && ipx.srnode == 0.0.0.0.0.1) || ip
tr.dst[0:3] == 0.6.29 xor tr.src[0:3] == 0.6.29
A special caveat must be given regarding fields that occur more than once per
packet. ``ip.addr'' occurs twice per IP packet, once for the source address, and once
for the destination address. Likewise, tr.rif.ring fields can occur more than once per
packet. The following two expressions are not equivalent:
ip.addr ne 192.168.4.1
not ip.addr eq 192.168.4.1
The first filter says ``show me all packets where an ip.addr exists that does not
equal 192.168.4.1''. That is, as long as one ip.addr in the packet does not equal
192.168.44.1, the packet passes the display filter. The second filter ``don't show me
any packets that have at least one ip.addr field equal to 192.168.4.1''. If one ip.addr
243

is 192.168.4.1, the packet does not pass. If neither ip.addr fields is 192.168.4.1,
then the packet passes.
It is easy to think of the `ne' and `eq' operators as having an implict ``exists''
modifier when dealing with multiply-recurring fields. ``ip.addr ne 192.168.4.1'' can
be thought of as ``there exists an ip.addr that does not equal 192.168.4.1''.
Be careful with multiply-recurring fields; they can be confusing.
The following is a table of protocol and protocol fields that are filterable in
Ethereal. The abbreviation of the protocol or field is given. This abbreviation is
what you use in the display filter. The type of the field is also given.
244

SNORT MAN PAGE
USAGE
snort [-abCdDeNopqsvVx?] [-A alert-mode ] [-c rules-file ] [-F bpf-file ] [-h
home-net ] [-i interface ] [-l log-dir ] [-M smb-hosts-file ] [-n packet-count ] [-r
tcpdump-file ] [-S n=v ] expression
OPTIONS
-A alert-mode
Alert using the specified alert-mode. Valid alert modes include fast, full,
none, and unsock. Fast writes alerts to the default "alert" file in a single-
line, syslog style alert message. Full writes the alert to the "alert" file with
the full decoded header as well as the alert message. None turns off alerting.
Unsock is an experimental mode that sends the alert information out over a
UNIX socket to another process that attaches to that socket.
-a
Display ARP packets when decoding packets.
-b
Log packets in a tcpdump(1) formatted file. All packets are logged in their
native binary state to a tcpdump formatted log file called "snort.log". This
option results in much faster operation of the program since it doesn't have
245

to spend time in the packet binary->text converters. Snort can keep up
pretty well with 100Mbps networks in "-b" mode.
-c rules-file
Use the rules located in file rules-file.
-C
Print the character data from the packet payload only (no hex).
-d
Dump the application layer data when displaying packets.
-D
Run Snort in daemon mode. Alerts are sent to /var/log/snort.alert unless
otherwise specified.
-e
Display/log the Ethernet packet headers.
-F bpf-file
Read BPF filters from bpf-file. This is handy for people running Snort as a
SHADOW replacement or with a love of super complex BPF filters. See the
documentation for more information on writing BPF filters.
-h home-net
Set the "home network" to home-net. The format of this address variable is
a network prefix plus a CIDR block, such as 192.168.1.0/24. Once this
variable is set, all decoded packet logging will be done relative to the home
246

network address space. This is useful because of the way that Snort formats
its ASCII log data. With this value set to the local network, all decoded
output will be logged into decode directories with the address of the foreign
computer as the directory name, which is very useful during traffic analysis.
-i interface
Listen on interface.
-l log-dir
Set the output logging directory to log-dir. All alerts and packet traffic go
into this directory. If this option is not specified, the default logging
directory is set to /var/log/snort.
-M smb-hosts-file
Send WinPopup messages to the list of workstations contained in the smb-
hosts-file . This option requires Samba to be resident and in the path of the
machine running Snort. The workstation file is simple: each line of the file
contains the SMB name of the box to send the message to.
-n packet-count
Process packet-count packets and exit.
-N
Turn off packet logging. The program still generates alerts normally.
247

-o
Change the order in which the rules are applied to packets. Instead of being
applied in the standard Alert->Pass->Log order, this will apply them in
Pass->Alert->Log order.
-p
Turn off promiscuous mode sniffing.
-q
Quiet operation. Don't display banner and initialization informations.
-r tcpdump-file
Read the tcpdump-formatted file tcpdump-file. This will cause Snort to
read and process the file fed to it. This is useful if, for instance, you've got a
bunch of SHADOW files that you want to process for content, or even if
you've got a bunch of reassembled packet fragments which have been
written into a tcpdump formatted file.
-s
Send alert messages to syslog. On linux boxen, they will appear in
/var/log/secure, /var/log/messages on many other platforms.
248

-S n=v
Set variable name "n" to value "v". This is useful for setting the value of a
defined variable name in a Snort rules file to a command line specified
value. For instance, if you define a HOME_NET variable name inside of a
Snort rules file, you can set this value from it's predefined value at the
command line.
-v
Be verbose. Prints packets out to the console. There is one big problem with
verbose mode: it's slow. If you are doing IDS work with Snort, don't use the
-v switch, you WILL drop packets.
-V
Show the version number and exit.
-?
Show the program usage statement and exit.
expression
selects which packets will be dumped. If no expression is given, all packets
on the net will be dumped. Otherwise, only packets for which expression is
`true' will be dumped.
The expression consists of one or more primitives. Primitives usually
consist of an id (name or number) preceded by one or more qualifiers. There
are three different kinds of qualifier:
249

type
qualifiers say what kind of thing the id name or number refers to. Possible
types are host, net and port. E.g., `host foo', `net 128.3', `port 20'. If there is
no type qualifier, host is assumed.
dir
qualifiers specify a particular transfer direction to and/or from id. Possible
directions are src, dst, src or dst and src and dst. E.g., `src foo', `dst net
128.3', `src or dst port ftp-data'. If there is no dir qualifier, src or dst is
assumed. For `null' link layers (i.e. point to point protocols such as slip) the
inbound and outbound qualifiers can be used to specify a desired
direction.
proto
qualifiers restrict the match to a particular protocol. Possible protos are:
ether, fddi, ip, arp, rarp, decnet, lat, sca, moprc, mopdl, tcp and udp.
E.g., `ether src foo', `arp net 128.3', `tcp port 21'. If there is no proto
qualifier, all protocols consistent with the type are assumed. E.g., `src foo'
means `(ip or arp or rarp) src foo' (except the latter is not legal syntax), `net
bar' means `(ip or arp or rarp) net bar' and `port 53' means `(tcp or udp) port
53'.
[`fddi' is actually an alias for `ether'; the parser treats them identically as
meaning ``the data link level used on the specified network interface.''
250

FDDI headers contain Ethernet-like source and destination addresses, and
often contain Ethernet-like packet types, so you can filter on these FDDI
fields just as with the analogous Ethernet fields. FDDI headers also contain
other fields, but you cannot name them explicitly in a filter expression.]
In addition to the above, there are some special `primitive' keywords that
don't follow the pattern: gateway, broadcast, less, greater and arithmetic
expressions. All of these are described below.
More complex filter expressions are built up by using the words and, or
and not to combine primitives. E.g., `host foo and not port ftp and not port
ftp-data'. To save typing, identical qualifier lists can be omitted. E.g., `tcp
dst port ftp or ftp-data or domain' is exactly the same as `tcp dst port ftp or
tcp dst port ftp-data or tcp dst port domain'.
Allowable primitives are:
dst host host
True if the IP destination field of the packet is host, which may be either an
address or a name.
src host host
True if the IP source field of the packet is host.
251

host host
True if either the IP source or destination of the packet is host. Any of the
above host expressions can be prepended with the keywords, ip, arp, or
rarp as in:
ip host host
which is equivalent to:
ether proto \ip and host host
If host is a name with multiple IP addresses, each address will be checked
for a match.
ether dst ehost
True if the ethernet destination address is ehost. Ehost may be either a name
from /etc/ethers or a number (see ethers(3N) for numeric format).
ether src ehost
True if the ethernet source address is ehost.
ether host ehost
True if either the ethernet source or destination address is ehost.
gateway host
True if the packet used host as a gateway. I.e., the ethernet source or
destination address was host but neither the IP source nor the IP destination
was host. Host must be a name and must be found in both /etc/hosts and
/etc/ethers. (An equivalent expression is
ether host ehost and not host host
252

which can be used with either names or numbers for host / ehost.)
dst net net
True if the IP destination address of the packet has a network number of net.
Net may be either a name from /etc/networks or a network number (see
networks(4) for details).
src net net
True if the IP source address of the packet has a network number of net.
net net
True if either the IP source or destination address of the packet has a
network number of net.
net net mask mask
True if the IP address matches net with the specific netmask. May be
qualified with src or dst.
net net/len
True if the IP address matches net a netmask len bits wide. May be qualified
with src or dst.
dst port port
True if the packet is ip/tcp or ip/udp and has a destination port value of port.
The port can be a number or a name used in /etc/services (see tcp(4P) and
udp(4P)). If a name is used, both the port number and protocol are checked.
If a number or ambiguous name is used, only the port number is checked
253

(e.g., dst port 513 will print both tcp/login traffic and udp/who traffic, and
port domain will print both tcp/domain and udp/domain traffic).
src port port
True if the packet has a source port value of port.
port port
True if either the source or destination port of the packet is port. Any of the
above port expressions can be prepended with the keywords, tcp or udp, as
in:
tcp src port port
which matches only tcp packets whose source port is port.
less length
True if the packet has a length less than or equal to length. This is
equivalent to:
len <= length.
greater length
True if the packet has a length greater than or equal to length. This is
equivalent to:
len >= length.
ip proto protocol
True if the packet is an ip packet (see ip(4P)) of protocol type protocol.
Protocol can be a number or one of the names icmp, igrp, udp, nd, or tcp.
254

Note that the identifiers tcp, udp, and icmp are also keywords and must be
escaped via backslash (\), which is \\ in the C-shell.
ether broadcast
True if the packet is an ethernet broadcast packet. The ether keyword is
optional.
ip broadcast
True if the packet is an IP broadcast packet. It checks for both the all-zeroes
and all-ones broadcast conventions, and looks up the local subnet mask.
ether multicast
True if the packet is an ethernet multicast packet. The ether keyword is
optional. This is shorthand for `ether[0] & 1 != 0'.
ip multicast
True if the packet is an IP multicast packet.
ether proto protocol
True if the packet is of ether type protocol. Protocol can be a number or a
name like ip, arp, or rarp. Note these identifiers are also keywords and
must be escaped via backslash (\). [In the case of FDDI (e.g., `fddi protocol
arp'), the protocol identification comes from the 802.2 Logical Link
Control (LLC) header, which is usually layered on top of the FDDI header.
Tcpdump assumes, when filtering on the protocol identifier, that all FDDI
255
packets include an LLC header, and that the LLC header is in so-called
SNAP format.]
decnet src host
True if the DECNET source address is host, which may be an address of the
form ``10.123'', or a DECNET host name. [DECNET host name support is
only available on Ultrix systems that are configured to run DECNET.]
decnet dst host
True if the DECNET destination address is host.
decnet host host
True if either the DECNET source or destination address is host.
ip, arp, rarp, decnet
Abbreviations for:
ether proto p
where p is one of the above protocols.
lat, moprc, mopdl
Abbreviations for:
ether proto p
where p is one of the above protocols. Note that Snort does not currently
know how to parse these protocols.
tcp, udp, icmp
Abbreviations for:
256

ip proto p
where p is one of the above protocols.
expr relop expr
True if the relation holds, where relop is one of >, <, >=, <=, =, !=, and expr
is an arithmetic expression composed of integer constants (expressed in
standard C syntax), the normal binary operators [+, -, *, /, &, |], a length
operator, and special packet data accessors. To access data inside the
packet, use the following syntax:
proto [ expr : size ]
Proto is one of ether, fddi, ip, arp, rarp, tcp, udp, or icmp, and indicates
the protocol layer for the index operation. The byte offset, relative to the
indicated protocol layer, is given by expr. Size is optional and indicates the
number of bytes in the field of interest; it can be either one, two, or four,
and defaults to one. The length operator, indicated by the keyword len,
gives the length of the packet.
For example, `ether[0] & 1 != 0' catches all multicast traffic. The
expression `ip[0] & 0xf != 5' catches all IP packets with options. The
expression `ip[6:2] & 0x1fff = 0' catches only unfragmented datagrams and
frag zero of fragmented datagrams. This check is implicitly applied to the
tcp and udp index operations. For instance, tcp[0] always means the first
257

byte of the TCP header, and never means the first byte of an intervening
fragment.
Primitives may be combined using:
A parenthesized group of primitives and operators (parentheses are special
to the Shell and must be escaped).
Negation (`!' or `not').
Concatenation (`&&' or `and').
Alternation (`||' or `or').
Negation has highest precedence. Alternation and concatenation have equal
precedence and associate left to right. Note that explicit and tokens, not
juxtaposition, are now required for concatenation.
If an identifier is given without a keyword, the most recent keyword is
assumed. For example,
not host vs and ace
is short for
not host vs and host ace
which should not be confused with
not ( host vs or ace )
258

Expression arguments can be passed to Snort as either a single argument or
as multiple arguments, whichever is more convenient. Generally, if the
expression contains Shell metacharacters, it is easier to pass it as a single,
quoted argument. Multiple arguments are concatenated with spaces before
being parsed.
259
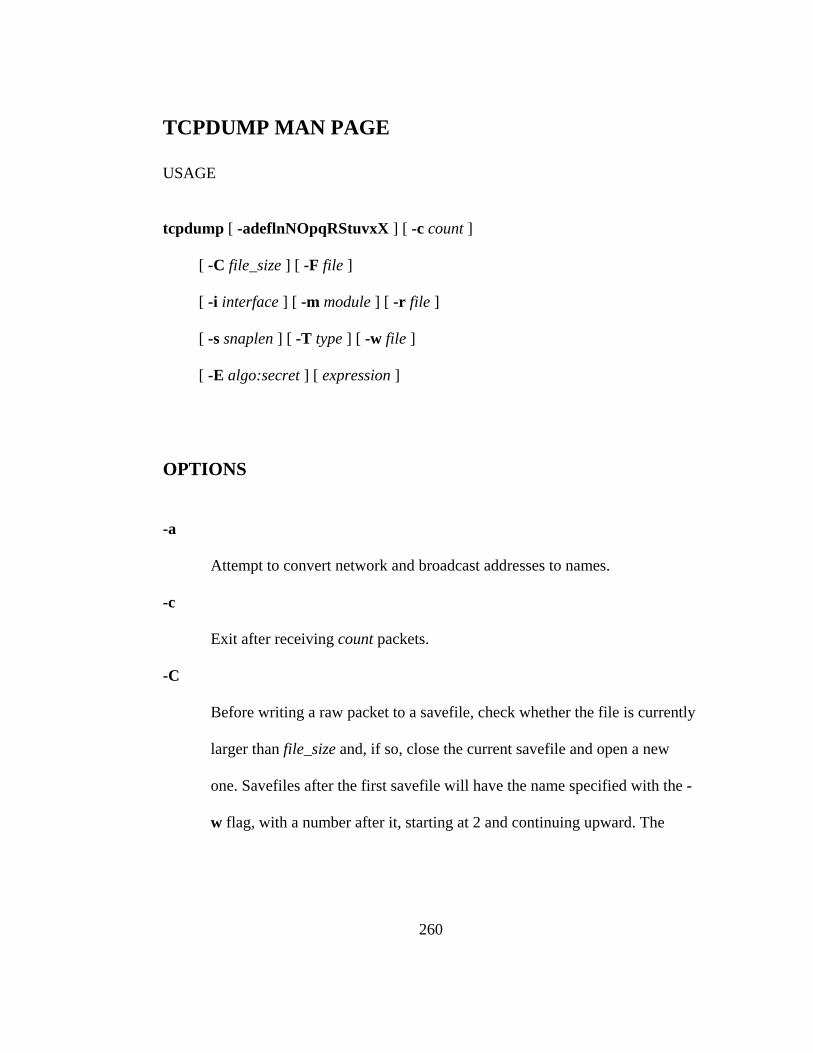
TCPDUMP MAN PAGE
USAGE
tcpdump [ -adeflnNOpqRStuvxX ] [ -c count ]
[ -C file_size ] [ -F file ]
[ -i interface ] [ -m module ] [ -r file ]
[ -s snaplen ] [ -T type ] [ -w file ]
[ -E algo:secret ] [ expression ]
OPTIONS
-a
Attempt to convert network and broadcast addresses to names.
-c
Exit after receiving count packets.
-C
Before writing a raw packet to a savefile, check whether the file is currently
larger than file_size and, if so, close the current savefile and open a new
one. Savefiles after the first savefile will have the name specified with the -
w flag, with a number after it, starting at 2 and continuing upward. The
260

units of file_size are millions of bytes (1,000,000 bytes, not 1,048,576
bytes).
-d
Dump the compiled packet-matching code in a human readable form to
standard output and stop.
-dd
Dump packet-matching code as a C program fragment.
-ddd
Dump packet-matching code as decimal numbers (preceded with a count).
-e
Print the link-level header on each dump line.
-E
Use algo:secret for decrypting IPsec ESP packets. Algorithms may be des-
cbc, 3des-cbc, blowfish-cbc, rc3-cbc, cast128-cbc, or none. The default is
des-cbc. The ability to decrypt packets is only present if tcpdump was
compiled with cryptography enabled. secret the ascii text for ESP secret
key. We cannot take arbitrary binary value at this moment. The option
assumes RFC2406 ESP, not RFC1827 ESP. The option is only for
debugging purposes, and the use of this option with truly `secret' key is
discouraged. By presenting IPsec secret key onto command line you make it
visible to others, via ps(1) and other occasions.
261

-f
Print `foreign' internet addresses numerically rather than symbolically (this
option is intended to get around serious brain damage in Sun's yp server ---
usually it hangs forever translating non-local internet numbers).
-F
Use file as input for the filter expression. An additional expression given on
the command line is ignored.
-i
Listen on interface. If unspecified, tcpdump searches the system interface
list for the lowest numbered, configured up interface (excluding loopback).
Ties are broken by choosing the earliest match.
On Linux systems with 2.2 or later kernels, an interface argument of ``any''
can be used to capture packets from all interfaces. Note that captures on the
``any'' device will not be done in promiscuous mode.
-l
Make stdout line buffered. Useful if you want to see the data while
capturing it. E.g.,
``tcpdump -l | tee dat'' or ``tcpdump -l > dat & tail -f dat''.
-m
Load SMI MIB module definitions from file module. This option can be
used several times to load several MIB modules into tcpdump.
262

-n
Don't convert addresses (i.e., host addresses, port numbers, etc.) to names.
-N
Don't print domain name qualification of host names. E.g., if you give this
flag then tcpdump will print ``nic'' instead of ``nic.ddn.mil''.
-O
Do not run the packet-matching code optimizer. This is useful only if you
suspect a bug in the optimizer.
-p
Don't put the interface into promiscuous mode. Note that the interface might
be in promiscuous mode for some other reason; hence, `-p' cannot be used
as an abbreviation for `ether host {local-hw-addr} or ether broadcast'.
-q
Quick (quiet?) output. Print less protocol information so output lines are
shorter.
-R
Assume ESP/AH packets to be based on old specification (RFC1825 to
RFC1829). If specified, tcpdump will not print replay prevention field.
Since there is no protocol version field in ESP/AH specification, tcpdump
cannot deduce the version of ESP/AH protocol.
263

-r
Read packets from file (which was created with the -w option). Standard
input is used if file is ``-''.
-S
Print absolute, rather than relative, TCP sequence numbers.
-s
Snarf snaplen bytes of data from each packet rather than the default of 68
(with SunOS's NIT, the minimum is actually 96). 68 bytes is adequate for
IP, ICMP, TCP and UDP but may truncate protocol information from name
server and NFS packets (see below). Packets truncated because of a limited
snapshot are indicated in the output with ``[|proto]'', where proto is the
name of the protocol level at which the truncation has occurred. Note that
taking larger snapshots both increases the amount of time it takes to process
packets and, effectively, decreases the amount of packet buffering. This
may cause packets to be lost. You should limit snaplen to the smallest
number that will capture the protocol information you're interested in.
Setting snaplen to 0 means use the required length to catch whole packets.
-T
Force packets selected by "expression" to be interpreted the specified type.
Currently known types are cnfp (Cisco NetFlow protocol), rpc (Remote
Procedure Call), rtp (Real-Time Applications protocol), rtcp (Real-Time
264

Applications control protocol), snmp (Simple Network Management
Protocol), vat (Visual Audio Tool), and wb (distributed White Board).
-t
Don't print a timestamp on each dump line.
-tt
Print an unformatted timestamp on each dump line.
-ttt
Print a delta (in micro-seconds) between current and previous line on each
dump line.
-tttt
Print a timestamp in default format proceeded by date on each dump line.
-u
Print undecoded NFS handles.
-v
(Slightly more) verbose output. For example, the time to live, identification,
total length and options in an IP packet are printed. Also enables additional
packet integrity checks such as verifying the IP and ICMP header
checksum.
-vv
Even more verbose output. For example, additional fields are printed from
NFS reply packets, and SMB packets are fully decoded.
265

-vvv
Even more verbose output. For example, telnet SB ... SE options are printed
in full. With -X telnet options are printed in hex as well.
-w
Write the raw packets to file rather than parsing and printing them out. They
can later be printed with the -r option. Standard output is used if file is ``-''.
-x
Print each packet (minus its link level header) in hex. The smaller of the
entire packet or snaplen bytes will be printed. Note that this is the entire
link-layer packet, so for link layers that pad (e.g. Ethernet), the padding
bytes will also be printed when the higher layer packet is shorter than the
required padding.
-X
When printing hex, print ascii too. Thus if -x is also set, the packet is
printed in hex/ascii. This is very handy for analysing new protocols. Even if
-x is not also set, some parts of some packets may be printed in hex/ascii.
expression
selects which packets will be dumped. If no expression is given, all packets
on the net will be dumped. Otherwise, only packets for which expression is
`true' will be dumped.
266

The expression consists of one or more primitives. Primitives usually
consist of an id (name or number) preceded by one or more qualifiers. There
are three different kinds of qualifier:
type
qualifiers say what kind of thing the id name or number refers to. Possible
types are host, net and port. E.g., `host foo', `net 128.3', `port 20'. If there is
no type qualifier, host is assumed.
dir
qualifiers specify a particular transfer direction to and/or from id. Possible
directions are src, dst, src or dst and src and dst. E.g., `src foo', `dst net
128.3', `src or dst port ftp-data'. If there is no dir qualifier, src or dst is
assumed. For `null' link layers (i.e. point to point protocols such as slip) the
inbound and outbound qualifiers can be used to specify a desired
direction.
proto
qualifiers restrict the match to a particular protocol. Possible protos are:
ether, fddi, tr, ip, ip6, arp, rarp, decnet, tcp and udp. E.g., `ether src foo',
`arp net 128.3', `tcp port 21'. If there is no proto qualifier, all protocols
consistent with the type are assumed. E.g., `src foo' means `(ip or arp or
rarp) src foo' (except the latter is not legal syntax), `net bar' means `(ip or
arp or rarp) net bar' and `port 53' means `(tcp or udp) port 53'.
267

[`fddi' is actually an alias for `ether'; the parser treats them identically as
meaning ``the data link level used on the specified network interface.''
FDDI headers contain Ethernet-like source and destination addresses, and
often contain Ethernet-like packet types, so you can filter on these FDDI
fields just as with the analogous Ethernet fields. FDDI headers also contain
other fields, but you cannot name them explicitly in a filter expression.
Similarly, `tr' is an alias for `ether'; the previous paragraph's statements
about FDDI headers also apply to Token Ring headers.]
In addition to the above, there are some special `primitive' keywords that
don't follow the pattern: gateway, broadcast, less, greater and arithmetic
expressions. All of these are described below.
More complex filter expressions are built up by using the words and, or
and not to combine primitives. E.g., `host foo and not port ftp and not port
ftp-data'. To save typing, identical qualifier lists can be omitted. E.g., `tcp
dst port ftp or ftp-data or domain' is exactly the same as `tcp dst port ftp or
tcp dst port ftp-data or tcp dst port domain'.
Allowable primitives are:
268

dst host host
True if the IPv4/v6 destination field of the packet is host, which may be
either an address or a name.
src host host
True if the IPv4/v6 source field of the packet is host.
host host
True if either the IPv4/v6 source or destination of the packet is host. Any of
the above host expressions can be prepended with the keywords, ip, arp,
rarp, or ip6 as in:
ip host host
which is equivalent to:
ether proto \ip and host host
If host is a name with multiple IP addresses, each address will be checked
for a match.
ether dst ehost
True if the ethernet destination address is ehost. Ehost may be either a name
from /etc/ethers or a number (see ethers(5) for numeric format).
ether src ehost
True if the ethernet source address is ehost.
ether host ehost
True if either the ethernet source or destination address is ehost.
269
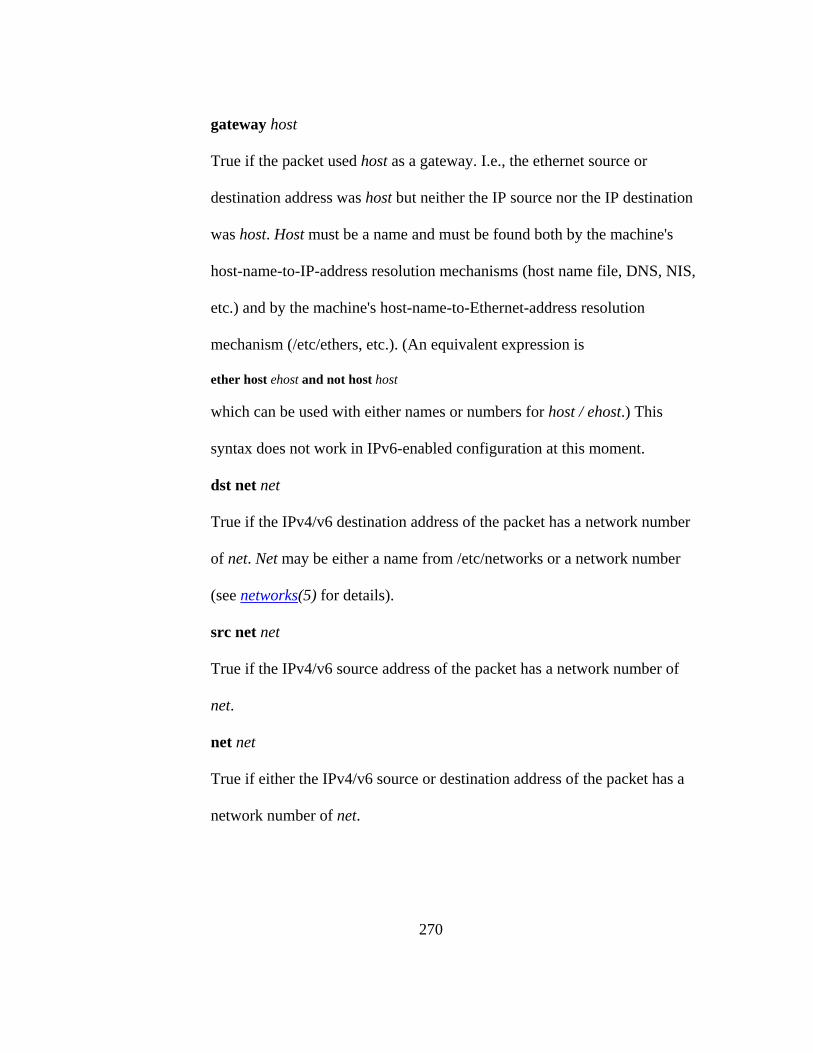
gateway host
True if the packet used host as a gateway. I.e., the ethernet source or
destination address was host but neither the IP source nor the IP destination
was host. Host must be a name and must be found both by the machine's
host-name-to-IP-address resolution mechanisms (host name file, DNS, NIS,
etc.) and by the machine's host-name-to-Ethernet-address resolution
mechanism (/etc/ethers, etc.). (An equivalent expression is
ether host ehost and not host host
which can be used with either names or numbers for host / ehost.) This
syntax does not work in IPv6-enabled configuration at this moment.
dst net net
True if the IPv4/v6 destination address of the packet has a network number
of net. Net may be either a name from /etc/networks or a network number
(see networks(5) for details).
src net net
True if the IPv4/v6 source address of the packet has a network number of
net.
net net
True if either the IPv4/v6 source or destination address of the packet has a
network number of net.
270

net net mask netmask
True if the IP address matches net with the specific netmask. May be
qualified with src or dst. Note that this syntax is not valid for IPv6 net.
net net/len
True if the IPv4/v6 address matches net with a netmask len bits wide. May
be qualified with src or dst.
dst port port
True if the packet is ip/tcp, ip/udp, ip6/tcp or ip6/udp and has a destination
port value of port. The port can be a number or a name used in /etc/services
(see tcp(4P) and udp(4P)). If a name is used, both the port number and
protocol are checked. If a number or ambiguous name is used, only the port
number is checked (e.g., dst port 513 will print both tcp/login traffic and
udp/who traffic, and port domain will print both tcp/domain and
udp/domain traffic).
src port port
True if the packet has a source port value of port.
port port
True if either the source or destination port of the packet is port. Any of the
above port expressions can be prepended with the keywords, tcp or udp, as
in:
tcp src port port
which matches only tcp packets whose source port is port.
271
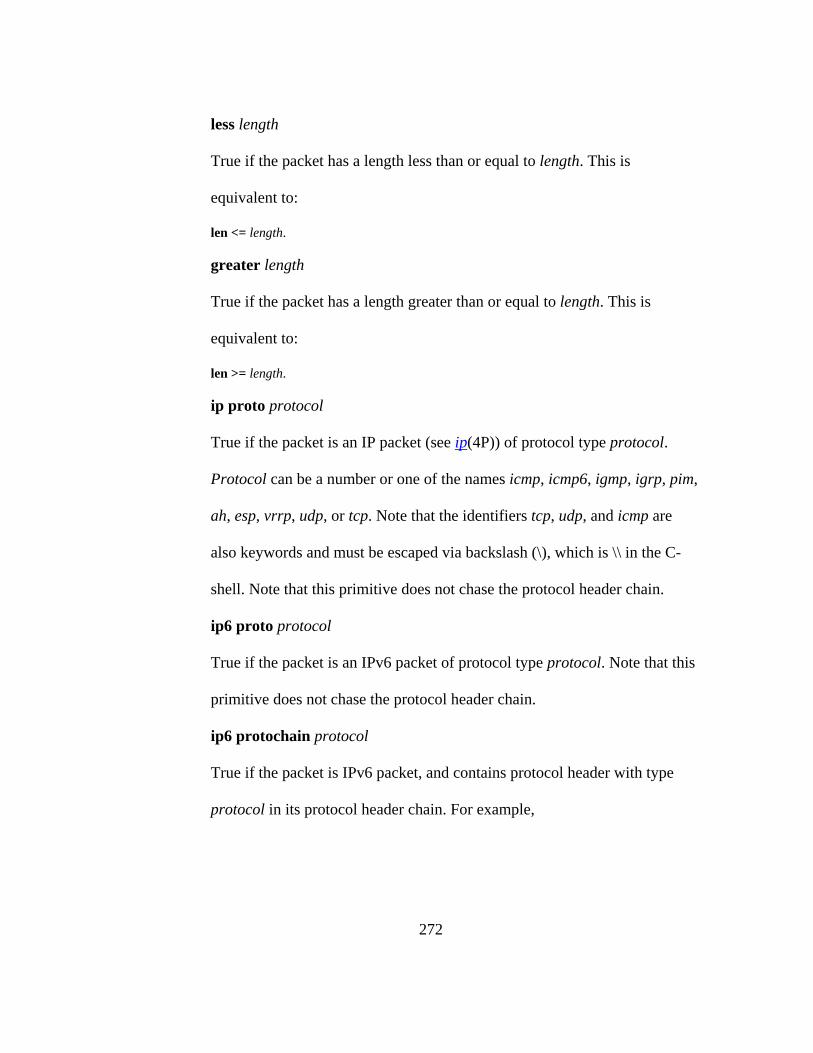
less length
True if the packet has a length less than or equal to length. This is
equivalent to:
len <= length.
greater length
True if the packet has a length greater than or equal to length. This is
equivalent to:
len >= length.
ip proto protocol
True if the packet is an IP packet (see ip(4P)) of protocol type protocol.
Protocol can be a number or one of the names icmp, icmp6, igmp, igrp, pim,
ah, esp, vrrp, udp, or tcp. Note that the identifiers tcp, udp, and icmp are
also keywords and must be escaped via backslash (\), which is \\ in the C-
shell. Note that this primitive does not chase the protocol header chain.
ip6 proto protocol
True if the packet is an IPv6 packet of protocol type protocol. Note that this
primitive does not chase the protocol header chain.
ip6 protochain protocol
True if the packet is IPv6 packet, and contains protocol header with type
protocol in its protocol header chain. For example,
272

ip6 protochain 6
matches any IPv6 packet with TCP protocol header in the protocol header
chain. The packet may contain, for example, authentication header, routing
header, or hop-by-hop option header, between IPv6 header and TCP header.
The BPF code emitted by this primitive is complex and cannot be optimized
by BPF optimizer code in tcpdump, so this can be somewhat slow.
ip protochain protocol
Equivalent to ip6 protochain protocol, but this is for IPv4.
ether broadcast
True if the packet is an ethernet broadcast packet. The ether keyword is
optional.
ip broadcast
True if the packet is an IP broadcast packet. It checks for both the all-zeroes
and all-ones broadcast conventions, and looks up the local subnet mask.
ether multicast
True if the packet is an ethernet multicast packet. The ether keyword is
optional. This is shorthand for `ether[0] & 1 != 0'.
ip multicast
True if the packet is an IP multicast packet.
ip6 multicast
True if the packet is an IPv6 multicast packet.
273

ether proto protocol
True if the packet is of ether type protocol. Protocol can be a number or one
of the names ip, ip6, arp, rarp, atalk, aarp, decnet, sca, lat, mopdl, moprc,
iso, stp, ipx, or netbeui. Note these identifiers are also keywords and must
be escaped via backslash (\).
[In the case of FDDI (e.g., `fddi protocol arp') and Token Ring (e.g., `tr
protocol arp'), for most of those protocols, the protocol identification
comes from the 802.2 Logical Link Control (LLC) header, which is usually
layered on top of the FDDI or Token Ring header.
When filtering for most protocol identifiers on FDDI or Token Ring,
tcpdump checks only the protocol ID field of an LLC header in so-called
SNAP format with an Organizational Unit Identifier (OUI) of 0x000000, for
encapsulated Ethernet; it doesn't check whether the packet is in SNAP
format with an OUI of 0x000000.
The exceptions are iso, for which it checks the DSAP (Destination Service
Access Point) and SSAP (Source Service Access Point) fields of the LLC
header, stp and netbeui, where it checks the DSAP of the LLC header, and
atalk, where it checks for a SNAP-format packet with an OUI of 0x080007
and the Appletalk etype.
In the case of Ethernet, tcpdump checks the Ethernet type field for most of
those protocols; the exceptions are iso, sap, and netbeui, for which it checks
274

for an 802.3 frame and then checks the LLC header as it does for FDDI and
Token Ring, atalk, where it checks both for the Appletalk etype in an
Ethernet frame and for a SNAP-format packet as it does for FDDI and
Token Ring, aarp, where it checks for the Appletalk ARP etype in either an
Ethernet frame or an 802.2 SNAP frame with an OUI of 0x000000, and ipx,
where it checks for the IPX etype in an Ethernet frame, the IPX DSAP in
the LLC header, the 802.3 with no LLC header encapsulation of IPX, and
the IPX etype in a SNAP frame.]
decnet src host
True if the DECNET source address is host, which may be an address of the
form ``10.123'', or a DECNET host name. [DECNET host name support is
only available on Ultrix systems that are configured to run DECNET.]
decnet dst host
True if the DECNET destination address is host.
decnet host host
True if either the DECNET source or destination address is host.
ip, ip6, arp, rarp, atalk, aarp, decnet, iso, stp, ipx, netbeui
Abbreviations for:
ether proto p
where p is one of the above protocols.
lat, moprc, mopdl
Abbreviations for:
275
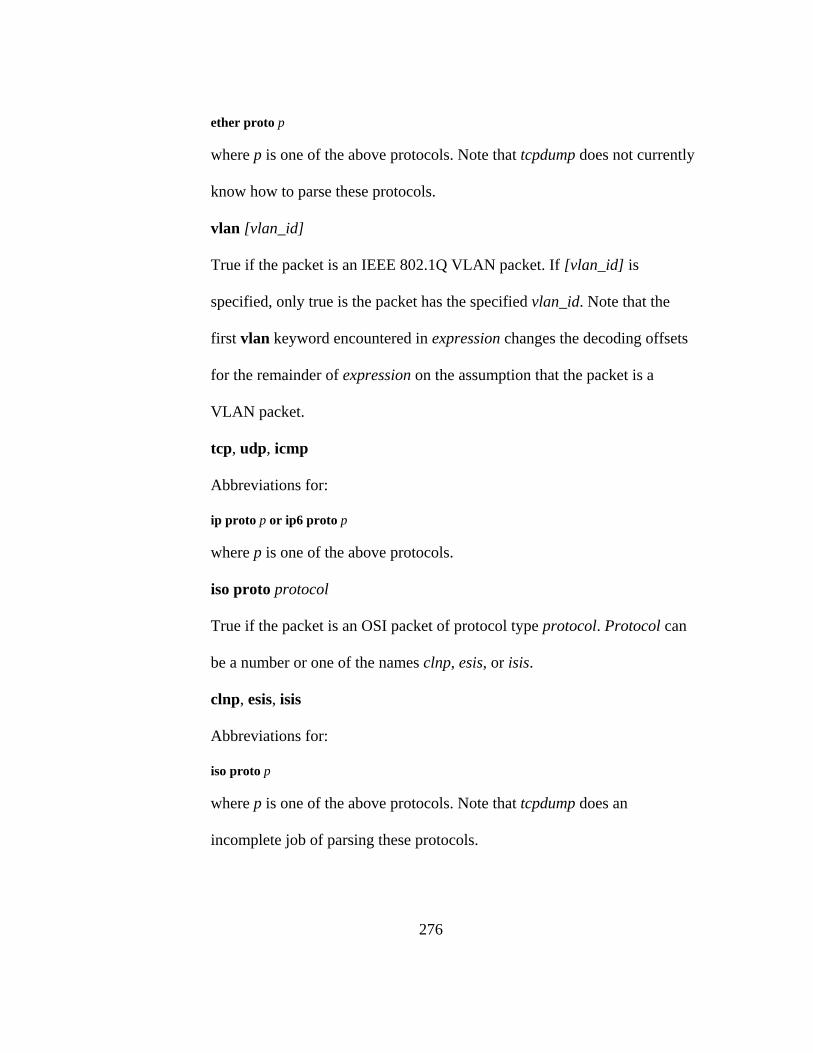
ether proto p
where p is one of the above protocols. Note that tcpdump does not currently
know how to parse these protocols.
vlan [vlan_id]
True if the packet is an IEEE 802.1Q VLAN packet. If [vlan_id] is
specified, only true is the packet has the specified vlan_id. Note that the
first vlan keyword encountered in expression changes the decoding offsets
for the remainder of expression on the assumption that the packet is a
VLAN packet.
tcp, udp, icmp
Abbreviations for:
ip proto p or ip6 proto p
where p is one of the above protocols.
iso proto protocol
True if the packet is an OSI packet of protocol type protocol. Protocol can
be a number or one of the names clnp, esis, or isis.
clnp, esis, isis
Abbreviations for:
iso proto p
where p is one of the above protocols. Note that tcpdump does an
incomplete job of parsing these protocols.
276

expr relop expr
True if the relation holds, where relop is one of >, <, >=, <=, =, !=, and expr
is an arithmetic expression composed of integer constants (expressed in
standard C syntax), the normal binary operators [+, -, *, /, &, |], a length
operator, and special packet data accessors. To access data inside the
packet, use the following syntax:
proto [ expr : size ]
Proto is one of ether, fddi, tr, ppp, slip, link, ip, arp, rarp, tcp, udp,
icmp or ip6, and indicates the protocol layer for the index operation. (ether,
fddi, tr, ppp, slip and link all refer to the link layer.) Note that tcp, udp and
other upper-layer protocol types only apply to IPv4, not IPv6 (this will be
fixed in the future). The byte offset, relative to the indicated protocol layer,
is given by expr. Size is optional and indicates the number of bytes in the
field of interest; it can be either one, two, or four, and defaults to one. The
length operator, indicated by the keyword len, gives the length of the
packet.
For example, `ether[0] & 1 != 0' catches all multicast traffic. The
expression `ip[0] & 0xf != 5' catches all IP packets with options. The
expression `ip[6:2] & 0x1fff = 0' catches only unfragmented datagrams and
frag zero of fragmented datagrams. This check is implicitly applied to the
tcp and udp index operations. For instance, tcp[0] always means the first
277

byte of the TCP header, and never means the first byte of an intervening
fragment.
Some offsets and field values may be expressed as names rather than as
numeric values. The following protocol header field offsets are available:
icmptype (ICMP type field), icmpcode (ICMP code field), and tcpflags
(TCP flags field).
The following ICMP type field values are available: icmp-echoreply,
icmp-unreach, icmp-sourcequench, icmp-redirect, icmp-echo, icmp-
routeradvert, icmp-routersolicit, icmp-timxceed, icmp-paramprob,
icmp-tstamp, icmp-tstampreply, icmp-ireq, icmp-ireqreply, icmp-
maskreq, icmp-maskreply.
The following TCP flags field values are available: tcp-fin, tcp-syn, tcp-
rst, tcp-push, tcp-push, tcp-ack, tcp-urg.
Primitives may be combined using:
A parenthesized group of primitives and operators (parentheses are special
to the Shell and must be escaped).
Negation (`!' or `not').
Concatenation (`&&' or `and').
Alternation (`||' or `or').
278

Negation has highest precedence. Alternation and concatenation have equal
precedence and associate left to right. Note that explicit and tokens, not
juxtaposition, are now required for concatenation.
If an identifier is given without a keyword, the most recent keyword is
assumed. For example,
not host vs and ace
is short for
not host vs and host ace
which should not be confused with
not ( host vs or ace )
Expression arguments can be passed to tcpdump as either a single argument
or as multiple arguments, whichever is more convenient. Generally, if the
expression contains Shell metacharacters, it is easier to pass it as a single,
quoted argument. Multiple arguments are concatenated with spaces before
being parsed.
279

XPROBE2 MAN PAGE
USAGE
xprobe2 [ -v ] [ -r ] [ -p proto:portnum:state ] [ -c configfile ] [ -o
logfile ] [ -p port ] [ -t receive_timeout ] [ -m numberofmatches ] [
-D modnum ] [ -F ] [ -X ] host
OPTIONS
-v be verbose.
-r display route to target (traceroute-like output).
-c use configfile to read the configuration file, xprobe2.conf,
from a non-default location.
-D disable module number modnum.
-m set number of results to display to numofmatches.
-o use logfile to log everything (default output is stderr).
-p specify port number (portnum), protocol (proto) and it’s state
280

for xprobe2 to use during rechability/fingerprinting tests of
remote host. Possible values for proto are tcp or udp, portnum
can only take values from 1 to 65535, state can be either
closed (for tcp that means that remote host replies with RST
packet, for udp that means that remote host replies with ICMP
Port Unreachable packet) or open (for tcp that means that
remote host replies with SYN ACK packet and for udp that means
that remote host doesn’t send any packet back).
-t set receive timeout to receive_timeout in seconds (the default
is set to 10 seconds).
-F generate signature for specified target (use -o to save finger-
print into file)
-X write XML output to logfile specified with –o
281

Appendix B:
Transmission Control Protocol/Internet Protocol (TCP/IP)
Transmission Control Protocol (TCP)
TCP is a Transport layer protocol that provides connection-oriented
communication. This protocol is typically used by applications that require
guaranteed delivery. It is a sliding window protocol that provides handling for both
timeouts and retransmissions. TCP establishes a full duplex virtual connection
between two endpoints. Each endpoint is defined by an IP address and a TCP port
number [41]. The byte stream is transferred in segments. The window size
determines the number of bytes of data that can be sent before an acknowledgement
from the receiver is necessary.
TCP Header
Figure B-1: TCP Header
282

Source Port
Port number which the packet left from the senders machine
Destination Port
Port number on the receiver’s machine
Sequence Number
The sequence number of the first data byte in this segment. If the SYN bit is set, the
sequence number is the initial sequence number and the first data byte is initial
sequence number + 1.
Acknowledgment Number
If the ACK bit is set, this field contains the value of the next sequence number the
sender of the segment is expecting to receive. Once a connection is established this
is always sent.
Data Offset
The number of 32-bit words in the TCP header. This indicates where the data
begins. The length of the TCP header is always a multiple of 32 bits.
Reserved
Must be set to zero.
283
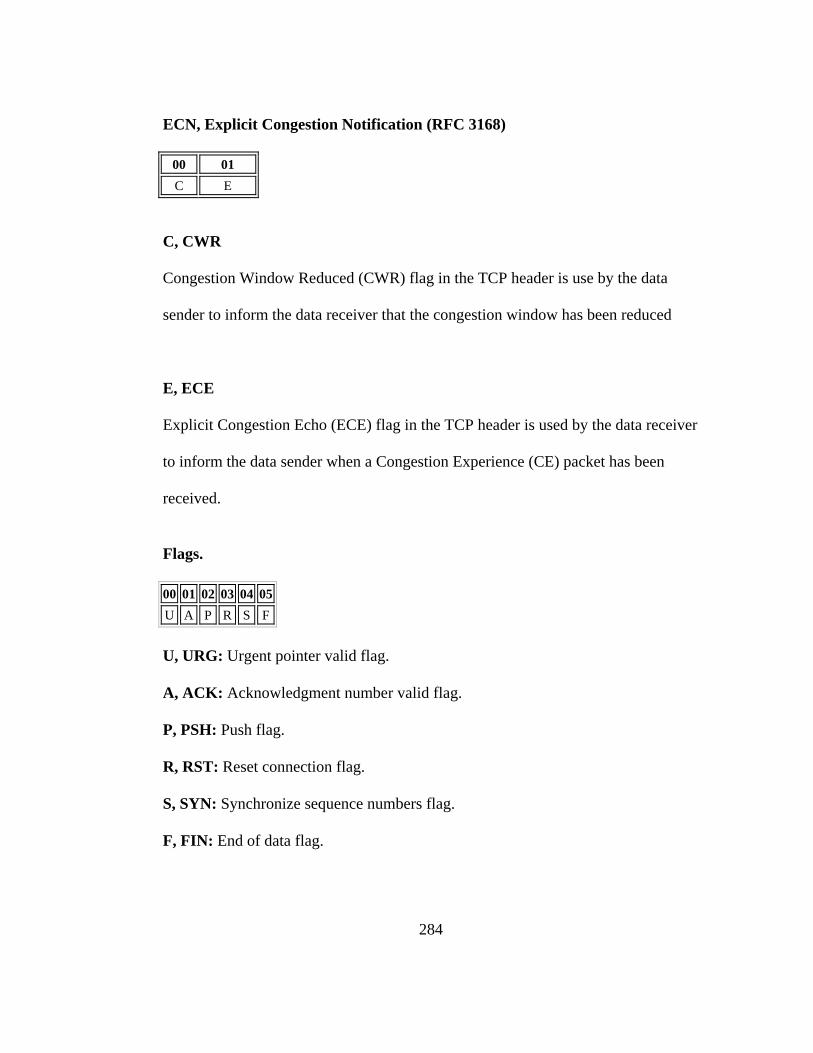
ECN, Explicit Congestion Notification (RFC 3168)
00 01 C E
C, CWR
Congestion Window Reduced (CWR) flag in the TCP header is use by the data
sender to inform the data receiver that the congestion window has been reduced
E, ECE
Explicit Congestion Echo (ECE) flag in the TCP header is used by the data receiver
to inform the data sender when a Congestion Experience (CE) packet has been
received.
Flags.
00 01 02 03 04 05 U A P R S F
U, URG: Urgent pointer valid flag.
A, ACK: Acknowledgment number valid flag.
P, PSH: Push flag.
R, RST: Reset connection flag.
S, SYN: Synchronize sequence numbers flag.
F, FIN: End of data flag.
284

Window
The number of data bytes beginning with the one indicated in the acknowledgment
field, which the sender of this segment is willing to accept. RFC 793, the
document that defines TCP, mandates use of this field in the TCP header of every
packet sent across a TCP connection. It provides a 16-bit integer that advertises the
number of bytes available in a recipient's receive buffer. This information is used
by the sending system's flow-control service to slow down and speed up the amount
of data being transferred according to the recipient's capabilities. It defines the
maximum number of bytes that can be sent without requiring the sender to stop
transmitting and wait for an acknowledgment.
Checksum
This is computed as the 16-bit one's complement of the one's complement sum of a
pseudo header of information from the IP header, the TCP header, and the data,
padded as needed with zero bytes at the end to make a multiple of two bytes. The
pseudo header contains the following fields:
Figure B2: Checksum Contents
Urgent Pointer
If the URG bit is set, this field points to the sequence number of the last byte in a
sequence of urgent data.
285
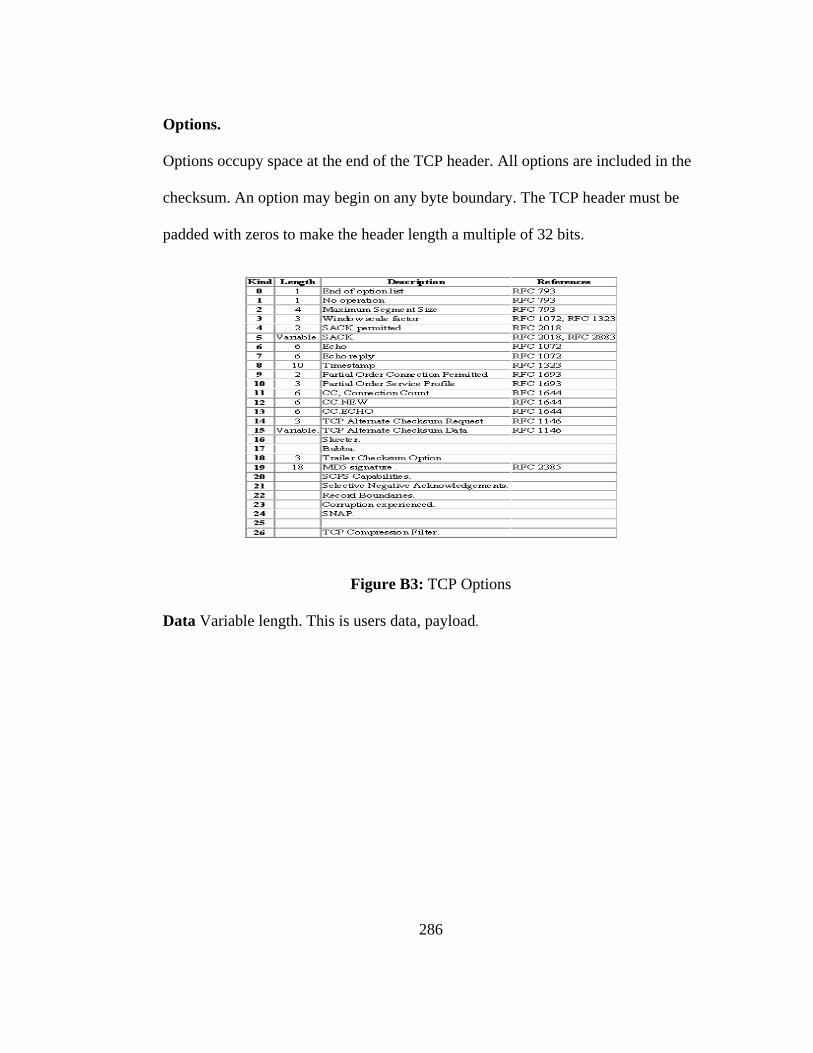
Options.
Options occupy space at the end of the TCP header. All options are included in the
checksum. An option may begin on any byte boundary. The TCP header must be
padded with zeros to make the header length a multiple of 32 bits.
Figure B3: TCP Options
Data Variable length. This is users data, payload.
286

Internet Protocol (IP)
The Internet Protocol is the heart of the TCP/IP stack, shown below
Figure B4: TCP/IP Protocol Stack IP is a network-layer protocol that contains addressing information and some
control information that enables packets to be routed. Therefore, it is responsible
for providing connectionless, best-effort delivery of datagram’s through an
internetwork and provides fragmentation and reassembly of datagram’s to support
data links with different maximum-transmission unit (MTU) sizes based on a four
byte (32 bit) destination address.
In order for IP to move packets of data from node to node, the data has to
go through a series of steps called encapsulation. This is the process that user data
goes through before it is routed to its destination. As the data goes through the
protocol stack, headers are added to the packet being sent. This process goes as
follows;
287
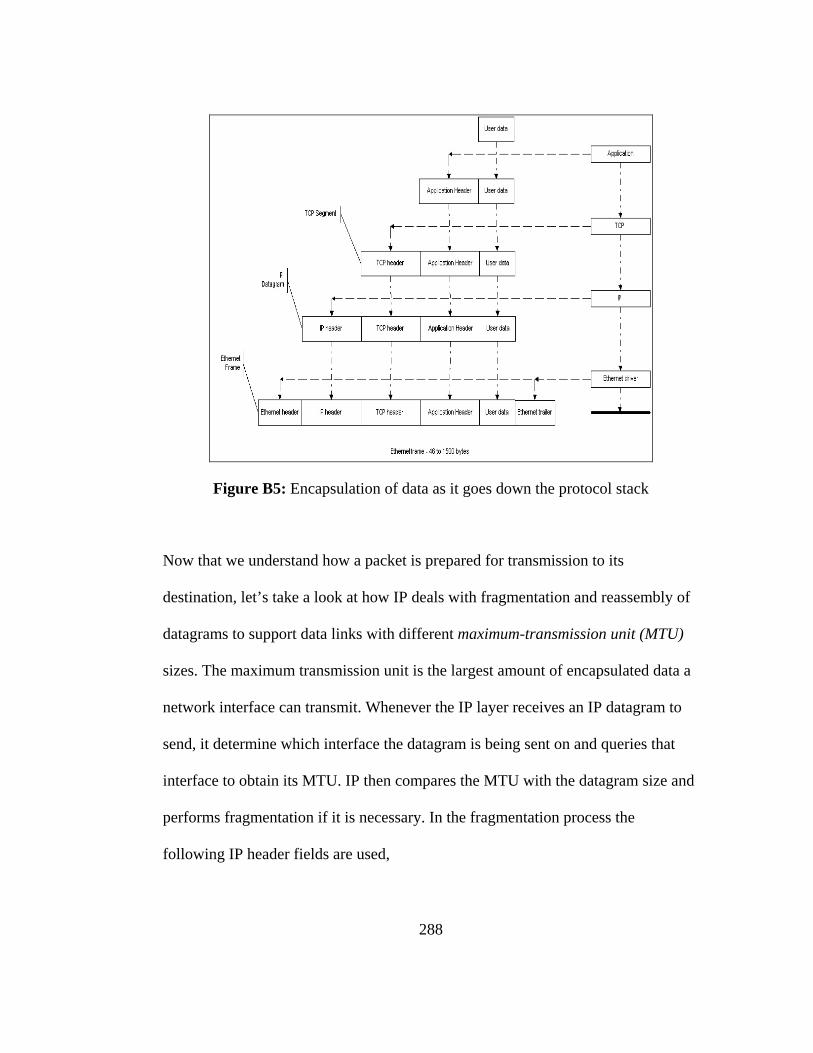
Figure B5: Encapsulation of data as it goes down the protocol stack Now that we understand how a packet is prepared for transmission to its
destination, let’s take a look at how IP deals with fragmentation and reassembly of
datagrams to support data links with different maximum-transmission unit (MTU)
sizes. The maximum transmission unit is the largest amount of encapsulated data a
network interface can transmit. Whenever the IP layer receives an IP datagram to
send, it determine which interface the datagram is being sent on and queries that
interface to obtain its MTU. IP then compares the MTU with the datagram size and
performs fragmentation if it is necessary. In the fragmentation process the
following IP header fields are used,
288

- Identification field: contains a unique value for each IP datagram that
the sender transmits. This number is copied into each fragment of a
particular datagram.
- Flags field: this field uses one bit to identify that there are “more
fragments” and is turned on for every fragment except for the final
fragment.
- Fragment offset field: contains the offset of this fragment from the
begging of the datagram.
- Total length field: this is reset to reflect its size.
When an IP datagram is fragmented, each fragment becomes its own packet with its
own IP header and routed independently. This makes it possible for the packets to
arrive at their destination out of order, but there is enough information in the IP
header to allow reassembly by the receiver. If at any point during the transmission
one fragment is lost, the entire datagram must be retransmitted.
Packet Header Field descriptions
Figure B6: 32 bit IP header
289

IP version number
This field is used to identify the version of IP being used. This field currently has
currently has no influence on the probability of intrusion. We say currently because
the only version currently in use is IPv4. Until IPv6 is in wide use, this field has no
influence on the probability of intrusion in the IDS model/algorithm.
Version Description 0 Reserved. 1 2 3
4 IP, Internet Protocol. 5 ST, ST Datagram Mode. 6 SIP, Simple Internet Protocol.
SIPP, Simple Internet Protocol Plus.IPv6, Internet Protocol.
7 TP/IX, The Next Internet. 8 PIP, The P Internet Protocol. 9 TUBA
10 -
14
15 Reserved.
Figure B7: IP versions Internet Header Length (IHL)
This is the length of the internet header in 32 bit words. Minimum value for a
correct header is 5 which would be a 20 byte header.
Type of Service
This is a one-byte field used to indicate parameters regarding the quality of service
required and may be used by gateways to select routing and queuing algorithms.
290
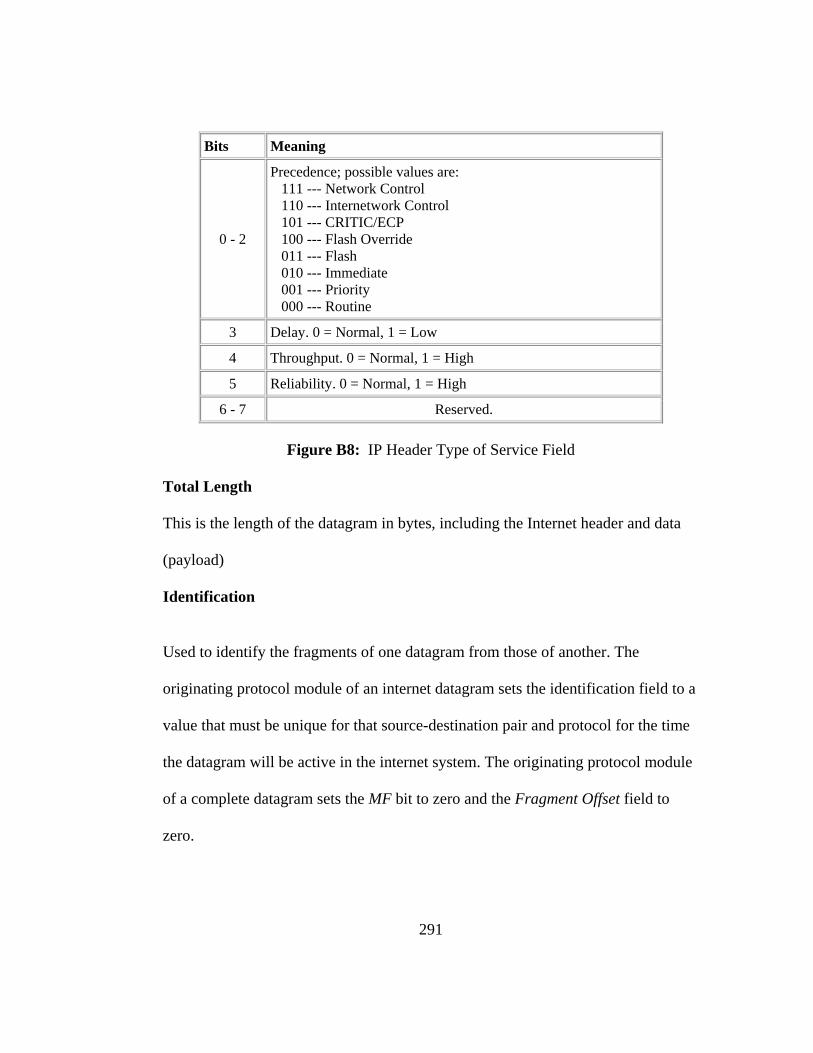
Bits Meaning
0 - 2
Precedence; possible values are: 111 --- Network Control 110 --- Internetwork Control 101 --- CRITIC/ECP 100 --- Flash Override 011 --- Flash 010 --- Immediate 001 --- Priority 000 --- Routine
3 Delay. 0 = Normal, 1 = Low
4 Throughput. 0 = Normal, 1 = High
5 Reliability. 0 = Normal, 1 = High
6 - 7 Reserved.
Figure B8: IP Header Type of Service Field
Total Length
This is the length of the datagram in bytes, including the Internet header and data
(payload)
Identification
Used to identify the fragments of one datagram from those of another. The
originating protocol module of an internet datagram sets the identification field to a
value that must be unique for that source-destination pair and protocol for the time
the datagram will be active in the internet system. The originating protocol module
of a complete datagram sets the MF bit to zero and the Fragment Offset field to
zero.
291
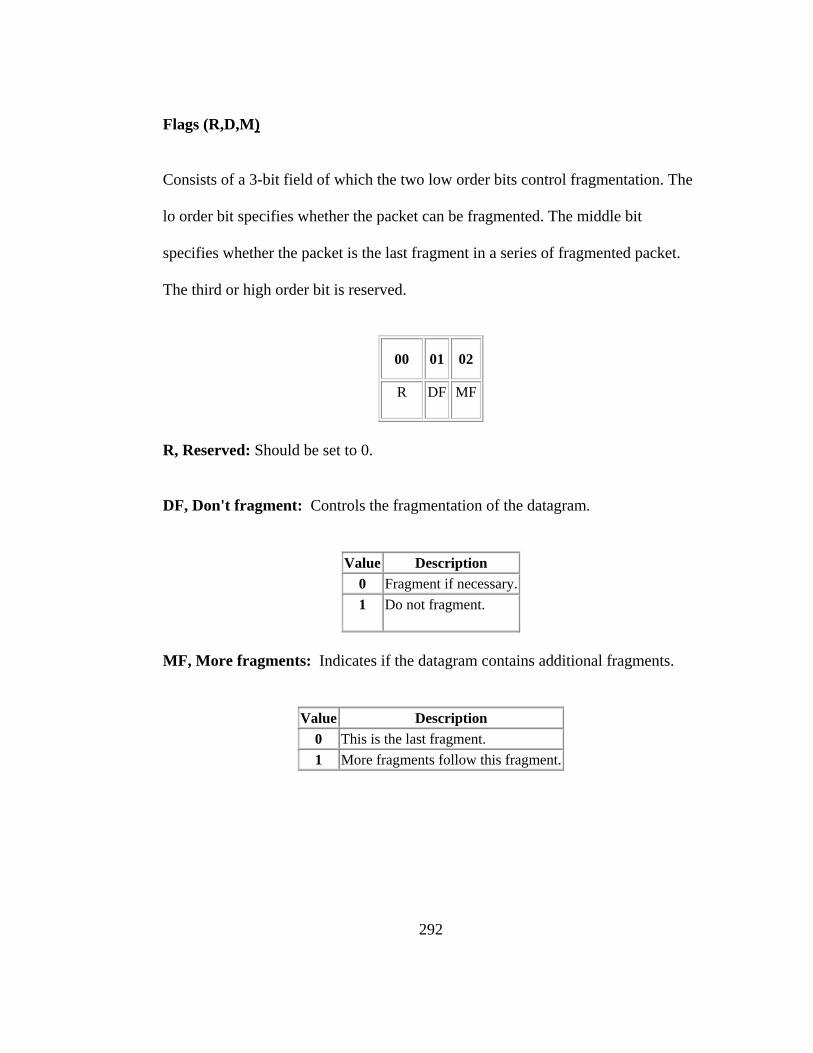
Flags (R,D,M)
Consists of a 3-bit field of which the two low order bits control fragmentation. The
lo order bit specifies whether the packet can be fragmented. The middle bit
specifies whether the packet is the last fragment in a series of fragmented packet.
The third or high order bit is reserved.
00 01 02
R DF MF
R, Reserved: Should be set to 0.
DF, Don't fragment: Controls the fragmentation of the datagram.
Value Description 0 Fragment if necessary.1 Do not fragment.
MF, More fragments: Indicates if the datagram contains additional fragments.
Value Description 0 This is the last fragment. 1 More fragments follow this fragment.
292

Fragment Offset
Fragment offset indicates the position of the fragment’s data relative to the
beginning of the data in the original datagram, which allows the destination IP
process to reconstruct the original packet.
Time to Live
Time to live (TTL) is the maximum amount of time a packet may exist. This filed
is decremented by at least 1 each time the IP header is processed by a router or a
host. Unless the packet is queued in a buffer for a long period of time, this filed
actually indicates the maximum number of intermediate routers a packet may cross
before it gets dropped. This is done to prevent packets from looping endlessly.
Protocol
This field indicates the type of protocol message is encapsulated with in the IP
Packet. The assigned internet protocol field values are as follows [Reynolds &
Postel 1992],
293
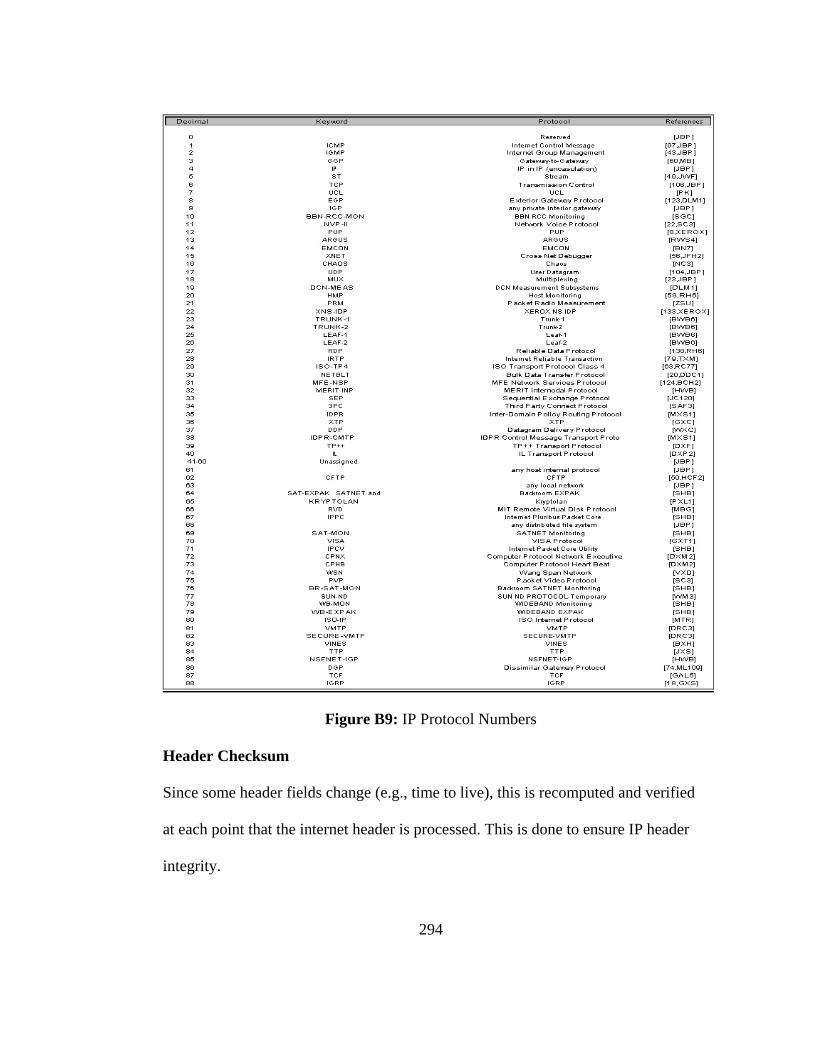
Figure B9: IP Protocol Numbers
Header Checksum
Since some header fields change (e.g., time to live), this is recomputed and verified
at each point that the internet header is processed. This is done to ensure IP header
integrity.
294

Source Internet Address
This is where the packet originates from.
Destination Internet Address
This is where the packet should be delivered to.
Options
These are the options the IP header may contain. Although an IP header may
contain options, most don’t. Field format is as follows;
00 01 02 03 04 05 06 07C Class Option
C, Copy flag.
Indicates if the option is to be copied into all fragments.
Value Description0 Do not copy.1 Copy.
Class..
Value Description 0 Control. 1 Reserved. 2 Debugging and measurement.3 Reserved.
295
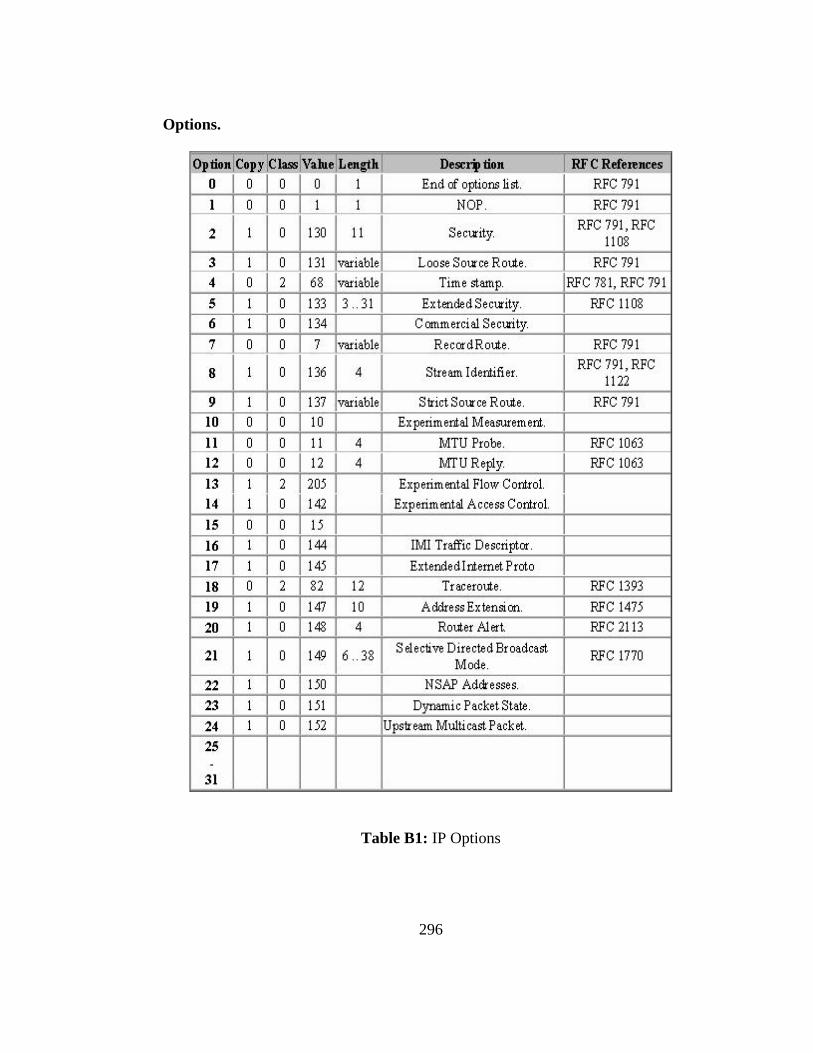
Options.
Table B1: IP Options
296

Padding
The internet header padding is used to ensure that the internet header ends on a 32
bit (4 byte) boundary. This is occasionally needed because not all IP options are
even multiples of 32 bits.
Data
This field contains upper-layer information.
297

Internet Message Protocol (ICMP) [159]
ICMP header:
Type. 8 bits. Specifies the format of the ICMP message.
Code. 8 bits.
Further qualifies the ICMP message.
ICMP Header Checksum. 16 bits.
Checksum that covers the ICMP message. This is the 16-bit one's complement of
the one's complement sum of the ICMP message starting with the Type field. The
checksum field should be set to zero before generating the checksum.
Data. Variable length.
This filed contains the data specific to the message type indicated by the Type and
Code fields. The Tables B2-A, B2-B, B2-C and B2-D list all the ICMP types and
corresponding codes [160].
298
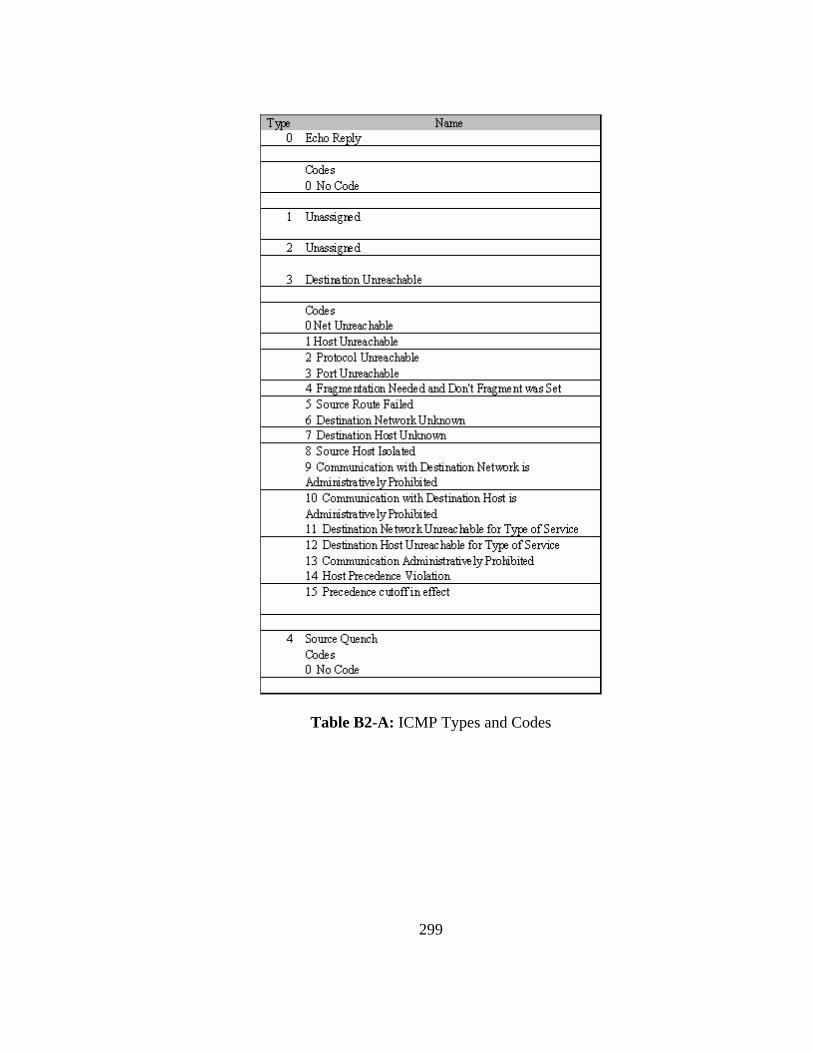
Table B2-A: ICMP Types and Codes
299

Table B2-B: ICMP Types and Codes
300
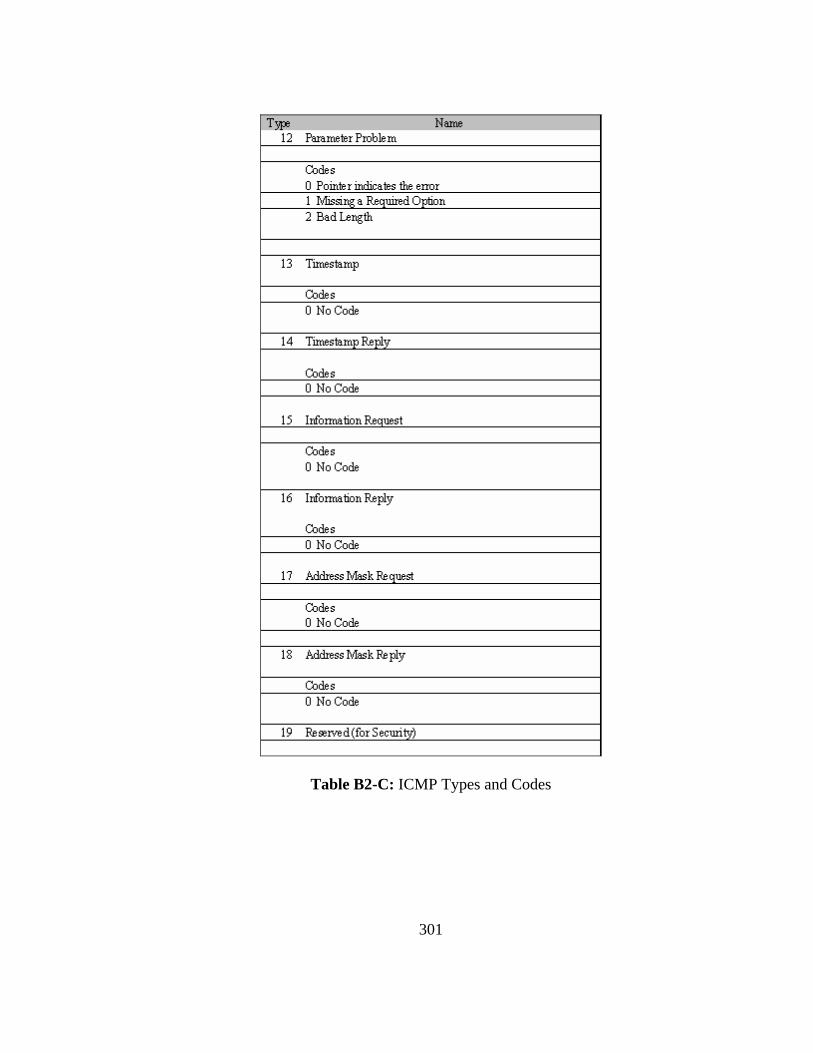
Table B2-C: ICMP Types and Codes
301
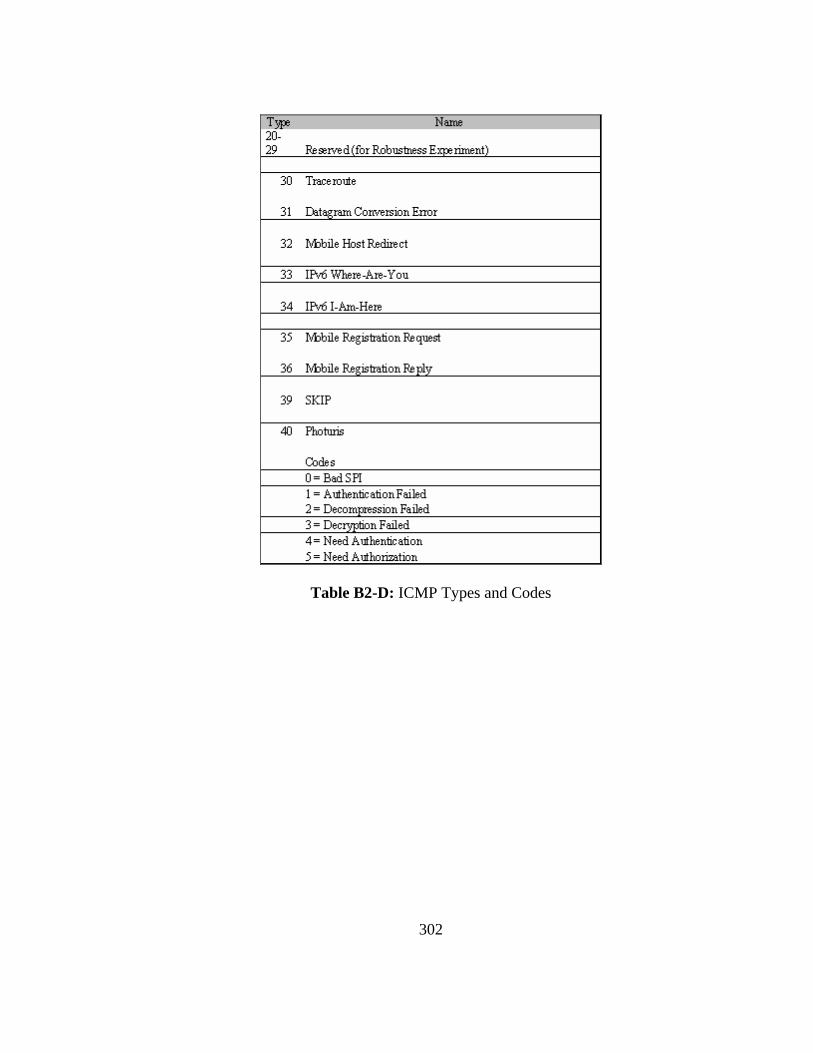
Table B2-D: ICMP Types and Codes
302

Appendix C
Oinker: A Graphical User Interface for writing Snort rules
Features:
• Easily creating new Snort rule files
• Easily editing existing files
• Cutting and pasting rules between Snort rule files
• Instantly duplicating rules
• Working with multiple Snort rule files
• Instantly customizable to environments using Snort configuration
files, such as: Snort.conf, Classification.config and
References.config
For definitions of the fields please refer back to tables 5.1, 5.2A, 5.2B, 5-3A, 5-3B
and 5.4.
Creating a new Snort Rule
To create a new Snort Rule the following files will be needed,
- Snort.conf
- classification.config
- reference.config
303
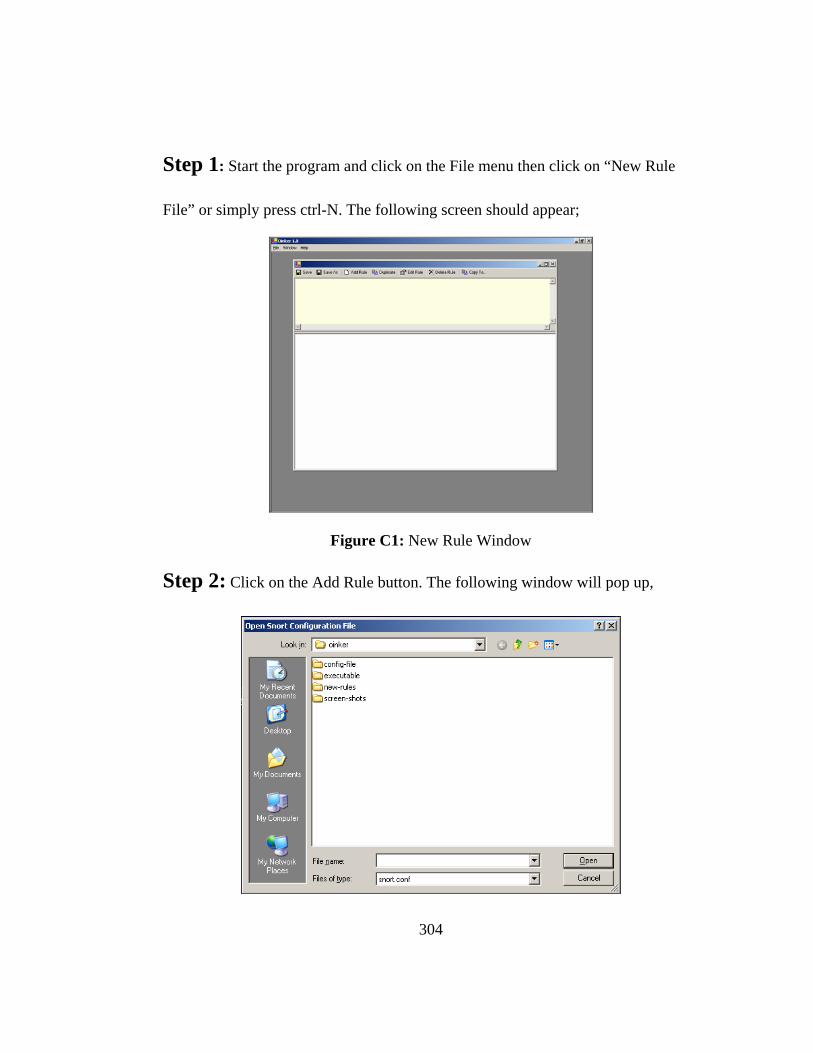
Step 1: Start the program and click on the File menu then click on “New Rule
File” or simply press ctrl-N. The following screen should appear;
Figure C1: New Rule Window
Step 2: Click on the Add Rule button. The following window will pop up,
304

Figure C2: Window requesting location of Snort.conf File
Provide the location of the snort.conf file.
Step 3: Once the location of the Snort.conf file has been provided, a new rule
can be created. The following screen should come up,
Figure C3: Beginning a new snort rule
This is the first of two tabs for creating a new rule. This window shows the
following,
Header:
Action: This tells snort how to react if this Rule is activated. There are 5 different
actions;
305
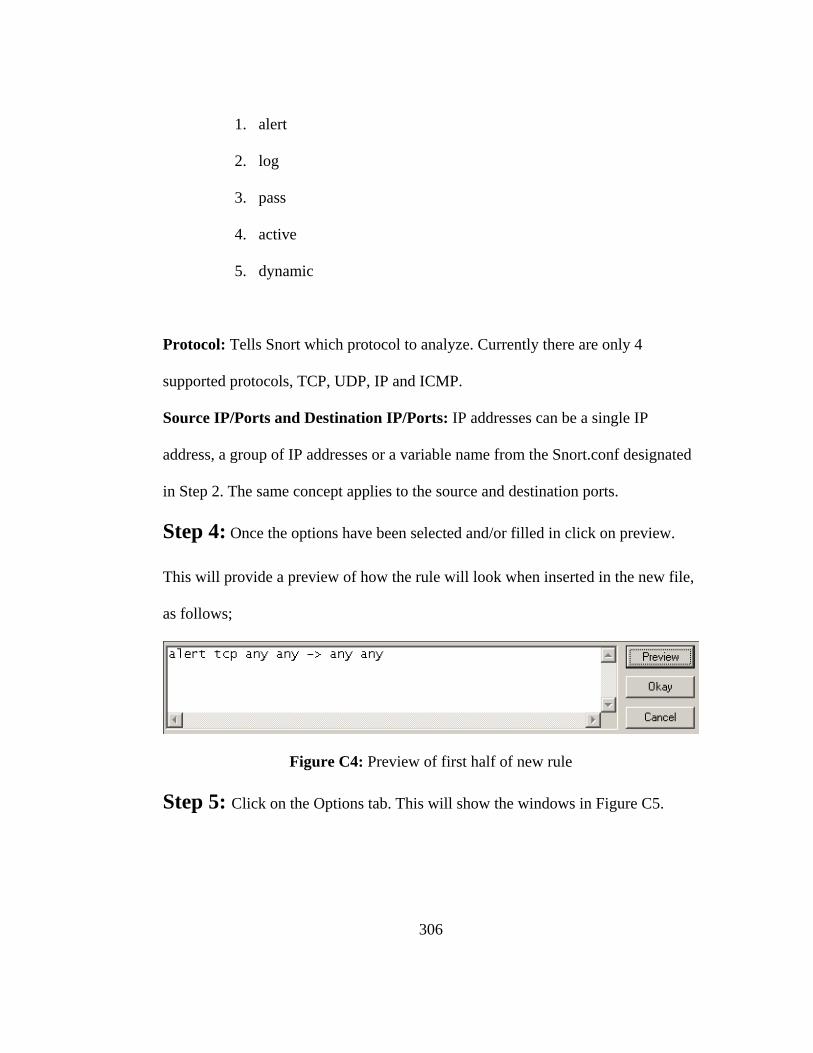
1. alert
2. log
3. pass
4. active
5. dynamic
Protocol: Tells Snort which protocol to analyze. Currently there are only 4
supported protocols, TCP, UDP, IP and ICMP.
Source IP/Ports and Destination IP/Ports: IP addresses can be a single IP
address, a group of IP addresses or a variable name from the Snort.conf designated
in Step 2. The same concept applies to the source and destination ports.
Step 4: Once the options have been selected and/or filled in click on preview.
This will provide a preview of how the rule will look when inserted in the new file,
as follows;
Figure C4: Preview of first half of new rule
Step 5: Click on the Options tab. This will show the windows in Figure C5.
306

Figure C5: Options window
This is the last window for creating a new rule. This window displays the
following;
Category: There are five categories and each category has several options;
1. Meta-data:
a. msg
b. reference
c. sid
d. rev
e. classtype
307

f. priority
2. Payload:
a. content
b. uricontent
c. isdataat
d. pcre
e. byte_jump
f. byte_test
3. Non-Payload
a. flag
b. flow
c. flowbits
d. seq
e. ack
f. window
g. rpc
h. dsize
4. Post-detection
a. logto
b. session
c. resp
308

d. react
e. tag
5. Other
a. threshold
Step 6: Once all the options are selected press preview and then ok. This ends
the rule creation. The following screen should look like the on in Step one except
that there is now a new rule in it, as shown below;
All that is needed is the header information and then simply save the file.
309
Editing an Existing Snort rule file
To edit an existing file simply press ctrl + O or use the File menu. Once the file is
open, double click on the desired rule for editing.
Duplicating a rule
Select a rule and click on the Duplicate button.
Copy rule between files
Open the two files in question. Click on the file where the rule that is going to be
duplicated resides. Click on the duplicate key select the file to duplicate to when
prompted.
310