Analysis of Greenhouse Gas Mitigation in Energy Sector ...
18
Vol. 6 No. 1, 49-66 http://dx.doi.org/10.22135/sje.2021.6.1.49-66 49 Analysis of Greenhouse Gas Mitigation in Energy Sector/Electricity Sub-Sector on Street Lighting (Case Study: Palembang City) Felicity 1 , Dedi Rohendi 2* , Budhi Setiawan 3 1 Student of Graduate Program in Environmental Management, Universitas Sriwijaya, Jl. Padang Selasa No.524, Bukit Besar, Ilir Barat I District, Palembang, South Sumatra. 2 Chemistry Department, Faculty of Mathematics and Natural Sciences, Universitas Sriwijaya, Jl. Palembang- Prabumulih Km.32, Indralaya, Ogan Ilir, South Sumatra. 3 Geology Engineering Department, Faculty of Engineering, Universitas Sriwijaya, Jl. Palembang-Prabumulih Km.32, Indralaya, Ogan Ilir, South Sumatra. *Corresponding Author: [email protected] Article history Received Received in revised form Accepted Available online 18 November 2020 31 March 2021 26 April 2021 30 April 2021 Abstract: The greatest source of GHG emission from energy sector comes from fossil fuel combustion. According to PLN, 63.75% of electricity distribution in South Sumatra is derived from coal combustion. Coal is a non-renewable energy source and will deplete in a few decades. The research objective is solving problems related to energy efficiency and GHG emission reduction by reducing electricity consumption in street lighting sector. The research method was carried out through SPSS statistical analysis and LEAP analysis which had been justified based on observation on the survey results of 1,619 street lighting unit at four distribution areas of Palembang. The implementation of electrical energy efficiency is carried out by replacing Son T 250 W lamps into LED lamps with different power. The SPSS statistical analysis determines that 1,000-unit street lightstreet lighting require light intensity quality of 1,570 lux with correlation coefficient of 0.214. GHG mitigation was conducted in accordance with convenience and safety standards for road users in which energy efficiency from the replacement of 3,741-unit energy-saving lamps can reduce GHG emissions by 1,650.9138 tons of CO2e with benefit economic 2,911,481,740 rupiahs. In addition, based on LEAP analysis, if 8000 units of LED lamps replace Son T lamps, the electricity consumption of Street Lighting in 2030 will decrease with a projected efficiency of 17.48%. Keywords: Street Lighting, Energy Efficiency, Emission Reduction, Green House Gas and LED Abstrak: Sumber emisi terbesar sektor energi berasal dari pembakaran bahan bakar fosil. Berdasarkan data PLN, 63,75% distribusi listrik wilayah Sumbagsel berasal dari batubara. Bahan bakar batubara merupakan sumber energi tidak terbarukan dan akan habis dalam beberapa dekade selanjutnya. Tujuan penelitian merupakan penyelesaian masalah terkait efisiensi energi listrik dan pengurangan emisi GRK yang didasari pengurangan konsumsi energi listrik Sektor PJU. Metode penelitian yang digunakan adalah analisis menggunakan statistik SPSS dan LEAP yang telah dijustifikasi berdasarkan pengamatan hasil survey PJU sebanyak 1.619 unit di keempat rayon yang mewakili wilayah Kota Palembang. Penerapan efisiensi energi listrik Sektor PJU dilakukan dengan mengganti lampu Son T 250 W menjadi lampu LED dengan daya berbeda. Hasil analisis statistik SPSS bahwa 1.000 unit lampu PJU membutuhkan kualitas penerangan cahaya dengan intensitas cahaya sebesar 1.570 lux dengan koefisien relasi 0,214. Aksi mitigasi GRK Sektor PJU dilakukan sesuai dengan standar kenyamanan dan keselamatan dengan efisiensi energi sebesar 9,603 % dengan pergantian LED sebanyak 3.741 unit mengurangi emisi GRK sebesar 1.650,9138 ton CO 2 e dengan biaya penghematan 2.911.481.740 rupiah. Maka berdasarkan analisis LEAP, sebanyak lampu LED 8.000 unit menggantikan lampu Son T maka konsumsi energi listrik PJU di tahun 2030 akan mengalami penurunan dengan proyeksi efisiensi 17,48%. Kata kunci: Penerangan Jalan Umum, Efisiensi Energi, Emisi, Mitigasi GRK dan LED 1. Introduction Electricity generation using coal fuel has become a problem in the energy sector and it requires a solution by reducing the use of this fuel [1]. In South Sumatra region, 95% of the electricity source is generated by private electricity generation [2]. The increase in electricity consumption increases the number of electricity generators and distribution to the four rayon in Palembang City. The distribution of electricity in Palembang City is divided into four districts consisting of Rivai, Kenten, Sukarami and Ampera Districts with an increase from 2015 to 2018 of 45,707,580 kWh and 52,845,036 kWh [3]. Total electrical energy in all sectors increases along with the increase in electrical energy in the Street Lighting sector [4]. To reduce the excessive use of electricity, it
Transcript of Analysis of Greenhouse Gas Mitigation in Energy Sector ...

Vol. 6 No. 1, 49-66 http://dx.doi.org/10.22135/sje.2021.6.1.49-66 49
Analysis of Greenhouse Gas Mitigation in Energy Sector/Electricity Sub-Sector on
Street Lighting (Case Study: Palembang City)
Felicity1, Dedi Rohendi2*, Budhi Setiawan3
1Student of Graduate Program in Environmental Management, Universitas Sriwijaya, Jl. Padang Selasa No.524,
Bukit Besar, Ilir Barat I District, Palembang, South Sumatra. 2Chemistry Department, Faculty of Mathematics and Natural Sciences, Universitas Sriwijaya, Jl. Palembang-
Prabumulih Km.32, Indralaya, Ogan Ilir, South Sumatra. 3Geology Engineering Department, Faculty of Engineering, Universitas Sriwijaya, Jl. Palembang-Prabumulih
Km.32, Indralaya, Ogan Ilir, South Sumatra.
*Corresponding Author: [email protected]
Article history Received Received in revised form Accepted Available online
18 November 2020 31 March 2021 26 April 2021 30 April 2021
Abstract: The greatest source of GHG emission from energy sector comes from fossil fuel combustion. According
to PLN, 63.75% of electricity distribution in South Sumatra is derived from coal combustion. Coal is a non-renewable
energy source and will deplete in a few decades. The research objective is solving problems related to energy
efficiency and GHG emission reduction by reducing electricity consumption in street lighting sector. The research
method was carried out through SPSS statistical analysis and LEAP analysis which had been justified based on
observation on the survey results of 1,619 street lighting unit at four distribution areas of Palembang. The
implementation of electrical energy efficiency is carried out by replacing Son T 250 W lamps into LED lamps with
different power. The SPSS statistical analysis determines that 1,000-unit street lightstreet lighting require light
intensity quality of 1,570 lux with correlation coefficient of 0.214. GHG mitigation was conducted in accordance
with convenience and safety standards for road users in which energy efficiency from the replacement of 3,741-unit
energy-saving lamps can reduce GHG emissions by 1,650.9138 tons of CO2e with benefit economic 2,911,481,740
rupiahs. In addition, based on LEAP analysis, if 8000 units of LED lamps replace Son T lamps, the electricity
consumption of Street Lighting in 2030 will decrease with a projected efficiency of 17.48%.
Keywords: Street Lighting, Energy Efficiency, Emission Reduction, Green House Gas and LED
Abstrak: Sumber emisi terbesar sektor energi berasal dari pembakaran bahan bakar fosil. Berdasarkan data PLN,
63,75% distribusi listrik wilayah Sumbagsel berasal dari batubara. Bahan bakar batubara merupakan sumber energi
tidak terbarukan dan akan habis dalam beberapa dekade selanjutnya. Tujuan penelitian merupakan penyelesaian
masalah terkait efisiensi energi listrik dan pengurangan emisi GRK yang didasari pengurangan konsumsi energi
listrik Sektor PJU. Metode penelitian yang digunakan adalah analisis menggunakan statistik SPSS dan LEAP yang
telah dijustifikasi berdasarkan pengamatan hasil survey PJU sebanyak 1.619 unit di keempat rayon yang mewakili
wilayah Kota Palembang. Penerapan efisiensi energi listrik Sektor PJU dilakukan dengan mengganti lampu Son T
250 W menjadi lampu LED dengan daya berbeda. Hasil analisis statistik SPSS bahwa 1.000 unit lampu PJU
membutuhkan kualitas penerangan cahaya dengan intensitas cahaya sebesar 1.570 lux dengan koefisien relasi 0,214.
Aksi mitigasi GRK Sektor PJU dilakukan sesuai dengan standar kenyamanan dan keselamatan dengan efisiensi
energi sebesar 9,603 % dengan pergantian LED sebanyak 3.741 unit mengurangi emisi GRK sebesar 1.650,9138 ton
CO2e dengan biaya penghematan 2.911.481.740 rupiah. Maka berdasarkan analisis LEAP, sebanyak lampu LED
8.000 unit menggantikan lampu Son T maka konsumsi energi listrik PJU di tahun 2030 akan mengalami penurunan
dengan proyeksi efisiensi 17,48%. Kata kunci: Penerangan Jalan Umum, Efisiensi Energi, Emisi, Mitigasi GRK dan LED
1. Introduction Electricity generation using coal fuel has
become a problem in the energy sector and it requires
a solution by reducing the use of this fuel [1]. In South
Sumatra region, 95% of the electricity source is
generated by private electricity generation [2]. The
increase in electricity consumption increases the
number of electricity generators and distribution to the
four rayon in Palembang City. The distribution of
electricity in Palembang City is divided into four
districts consisting of Rivai, Kenten, Sukarami and
Ampera Districts with an increase from 2015 to 2018
of 45,707,580 kWh and 52,845,036 kWh [3]. Total
electrical energy in all sectors increases along with the
increase in electrical energy in the Street Lighting
sector [4]. To reduce the excessive use of electricity, it

Vol. 6 No. 1, 49-66 http://dx.doi.org/10.22135/sje.2021.6.1.49-66 50
requires increasing the efficiency of electrical energy
and taking GHG mitigation action [5].
Street lighting is an important aspect of city
planning and is useful for making it easier for
pedestrians and motorized vehicles [6]. Installation of
Street Lighting also aims to facilitate the quality
adjustment of the distance between vehicles. The
profile of Street Lighting points in Palembang City is
42,770-unit lamps consisting of Son-T 250 W, 150 W,
70 W, LED, HPL 125 W and 80 W solar cell. Son-T
lamp points 250 W, 150 W, 70 W, LED and HPL 125
W are 3,386 units, 11,074 units, 24,352 units, 3,741
units, 3,594 units and 10 units respectively which are
installed on the protocol and collector roads of
Palembang City. Street lighting supervision and
operation are managed by Palembang City Public
Housing and Settlement Service [7].
Based on secondary data for 2019, the Son-T 70
W lamps totaling 24,351 units have the largest power
load of 1,704.57 kWh [8]. The biggest street lighting
power consumption is Son-T 70 W followed by the
Son-T 150 W with a percentage of 33.879% and
33.015%. The total consumption of electric energy for
Street Lighting in 2019 is 22,037,225.4 kWh or the
equivalent of 22,037.2 MWh [8]. Street lighting
electricity consumption has increased every year. The
increase in electricity consumption is due to the
installation of the number of lamps that increases
every year.
GHG mitigation actions are carried out by
replacing Son-T 250 W with LED lamps on protocol
road of Palembang City. The replacement of the LED
lamps aims to reduce the electricity consumption of
Palembang Street Lighting, improve electrical energy
efficiency and reduce greenhouse gas emissions
caused by the use of coal fuel. The results of indirect
emission resulting from the use of street lighting
electricity are calculated based on the emission factor
and the amount of electrical energy consumption
which is calculated for 1 (one) year [9]. The less
electrical energy consumption, the greater the
electricity savings for Street Lighting.
The target of achieving the reduction of GHG
emissions in the energy sector is 11% in accordance
with the strategic guidelines for implementing the
NDC document ratified by the Paris Agreement of
29% without foreign assistance and 41% with foreign
assistance by 2030 [10] [11] [12]. The amount of
electricity savings is multiplied by the emission factor
which is equivalent to the reduction in GHG
emissions. In calculating the energy balance calculated
according to the Energy and Mineral Resources office,
the reduction in GHG emissions should not exceed
29%. Thus, the achievement of emission reduction in
the energy sector is maintained with the justification
that the electricity consumption of Street Lighting will
decrease in 2030 and the electricity consumption of
LED lamps will increase [13]
Energy is power that can be used to carry out
various process activities; for instance, the generation
and consumption of electrical energy [32] [33].
According to the Directorate General of New,
Renewable Energy and Energy Conservation, the
current conditions illustrate that energy in Indonesia is
still dominated by fossil energy, energy prices that
must be suppressed, energy use is still not efficient,
Indonesia is committed to implementing the Paris
Agreement, energy distribution still needs to be
improved, the potential for renewable energy is still
not optimal [31].
GHG mitigation actions are part of energy
conservation efforts aimed at sustainable national
development, national energy security and reduction
of GHG emissions [31]. Long-term steps to reduce
greenhouse gas emissions with a target of reducing
emissions in the energy sector are 1,335 Mton CO2 in
the first scenario and 1,271 Mton CO2 in the second
scenario [31] [36]. The reduction in CO2 emissions in
the energy sector by 50.37 million tons of CO2 is the
energy sector's mitigation contribution to 16% of the
NDC target (until 2018) [31] [37].
The potential for energy saving LED street
lighting savings of 90 W 54 GWh/year is IDR 79
billion per year and the HPS 250 W 150 GWh/year is
IDR 220 billion per year assuming 8 hours running
hours, electricity tariff (P3) IDR 1,467.28/kWh and
205,940 Street Lighting units in Indonesia [38] [39].
In this study, it is assumed that the savings of LED
lamps is with a power of 120 W and a running hour of
12 hours and an electric power rate of IDR
1,467.28/kWh [38].
Based on the above background, the following
problems are formulated:
a. It is related to the Greenhouse Gas mitigation action
activities carried out by Palembang City
government in supporting efforts to achieve the
energy sector emission reduction target of 11%
from the national target of 29% in 2030 and support
the energy mix target of 23% by 2050. The
Greenhouse Gas mitigation action in the Street
Lighting sector in Palembang City has not yet
reached the energy saving target.
b. The consumption of electrical energy in Street
Lighting sector of Palembang City has increased
every year along with the construction of roads in
Palembang City according to spatial planning and
the community in inhabited road areas in
Palembang City.
c. The source of GHG emissions in the energy sector
has the potential to be the largest emission source
compared to emission sources in other sectors.
Furthermore, the objectives of the research
include:
a. Conducting an analysis of the GHG mitigation
efforts of Palembang City Government in Street
Lighting sectorelectricity sub-sector in order to

Vol. 6 No. 1, 49-66 http://dx.doi.org/10.22135/sje.2021.6.1.49-66 51
achieve an energy elasticity of less than 1 (one)
percent by 2025.
b. Conducting economic analysis related to GHG
mitigation in Street Lighting sector in Palembang
City so that the implementation of electricity
savings can be increased in a sustainable manner.
c. Providing energy saving recommendations in Street
Lighting sector based on the principle of energy
efficiency and environmental conservation with the
principle of sustainable development to realize the
role of renewable energy of more than 5%.
2. Research Material and Method 2.1. Material and Instrument
This research utilizes GPS (Global Positioning
System), stationery, measuring equipment, fiber roll
meter, spray paint, luxmeter, maps and camera.
2.2. Methods
2.2.1. Collecting Data Method
Primary data collection was carried out through
direct interview. Primary data related to the light
intensity of Street Lighting were taken directly at the
location of collector and arterial roads in Palembang
City. Secondary data were obtained from literature
studies or related agencies.
The characteristics of the light intensity of street
lighting depend on the values measured on the
luxmeter. Light intensity is the light current emitted in
every corner of the room in lumens [14]. The measured
light intensity is taken perpendicular to the street
surface.
2.2.2. Sampling Method
Street lighting samples were calculated based
on the Slovin formula. The use of the Slovin formula
can be seen in equation 1.1 as follows [15] :
n = 𝑁
1+ 𝑁.𝑒2 .................................................(1)
Description:
n = number of samples
N = number of populations
e = error margin (error rate)
The number of street lighting samples was taken
from arterial and collector roads of Palembang City
from a total of 42,770 street lighting units with a total
sample size of 397 units [8]. Survey and measurement
of intensity using a luxmeter were carried out on each
sample of the LED Street Lighting light points. In
addition to measuring the electrical energy
consumption of Street Lighting lamps, the
measurement of light intensity also determines the
feasibility of GHG mitigation actions based on the
replacement of Son-T lamps into LED lamps.
2.2.3. Electrical Energy Saving and Greenhouse Gas
Emissions Calculation Method
The calculation of electrical energy
consumption used in each Street Lighting lamp in
Palembang is calculated using the following formula
[16] :
Ex = 𝑃𝑜𝑤𝑒𝑟 (𝑘𝑊)𝑥 𝑙𝑎𝑚𝑝 𝑝𝑜𝑖𝑛𝑡 𝑜𝑓 𝑆𝑡𝑟𝑒𝑒𝑡 𝐿𝑖𝑔ℎ𝑡𝑖𝑛𝑔 (𝑢𝑛𝑖𝑡)𝑥 12 ℎ𝑜𝑢𝑟𝑠
1.000.000[MWh]
(2)
The total baseline electricity consumption of
Street Lighting (MWh) lamps consists of Son-T 250 W,
150 W and 70 W, HPL 125 W and SOX lamps. The
electricity consumption of LED lamp substitution is
also calculated using the same formula. The
substitution of LED lamps results in electricity savings
that are calculated using the following formula [4]:
E = E1 – E2, where ..........................................(3)
E1 is the energy consumption before mitigation is
carried out
E2 is the energy consumption after mitigation is
carried out
The greater the E value, the mitigation activities
will have a positive and significant impact in
supporting energy savings in Palembang City. The
electricity consumption of Street Lighting lamps
results in indirect GHG emissions. The electricity
generation for street light supply in Palembang does not
use coal. In addition, based on PLN WS2JB of
Palembang, they have not used coal for a long time; for
instance, PLTGU Keramasan, PLTG Borang, PLTG
Jakabaring, PLTGU Indralaya, and PLTG Talang
Duku use natural gas. However, there are many power
plants outside Palembang that still use coal sources
such as PTBA to supply the integrated power grid
throughout South Sumatra Province.
Thus, the resulting emissions are calculated
using the multiplication of the emission factors. The
calculation of GHG Emission formula is as follows :
Emission = activity data x emission factors ..............(4)
Activity data is the electrical energy
consumption data from Son-T and LED lamps.
Emission factors are data that follow the values given
by the Ministry of Energy and Mineral Resources in
2016. The production of electricity from the power
plant is integrated in one Sumbagsel (Southern
Sumatra) interconnection network or outside the Java
Madura Bali (JAMALI) interconnection system. [17].
Emission factors describe that the amount of coal used
varies in an area. Thus, it results in different emission
factors. The emission factors used constantly in this
research are based on secondary data from the
Directorate General of Electricity and Department of

Vol. 6 No. 1, 49-66 http://dx.doi.org/10.22135/sje.2021.6.1.49-66 52
LEAP
Energy and Mineral Resources in 2016. The calculation
of the GHG emission reduction formula is as follows
[18] :
Emission reduction = Emission Mitigation Action -
Emission without Mitigation Action [ton CO2e]
[19]...(5)
The amount of emission reduction can be seen
every year according to the feasibility of mitigation
action. Emission reduction is also an indicator of
environmental impact and results in GHG mitigation
action [20].
2.3. Electrical Energy Efficiency Method in
Street Lighting Sector
Replacement of LED Street Lighting provides
efficient use of electricity. The consumption of
electrical energy in low-power lamps is smaller than
that of high-power lamps. High power LED lamps
consume less electrical energy than Son-T lamps of the
same power. The calculation of the energy efficiency
formula using LED lamps is as follows [4] [5] :
Ef = 𝐸1− 𝐸2
𝐸1 x 100 %,…......................................(6)
Ef=efficiency of electrical energy after mitigation
action is carried out
E1=energy consumption before mitigation action is
carried out
E2=energy consumption after mitigation action is
carried out
The greater the E1 value, the smaller the
efficiency of electrical energy. Therefore, to improve
energy efficiency, reducing the waste of electrical
energy consumption in Street Lighting is needed.
2.4. Data Analysis Method
This study applies the SPSS Kendall Tau and
LEAP statistical analysis methods. The SPSS Kendall
Tau method aims to analyze the correlation between
light intensity of street lighting, the height of the
lampposts and the street width. The results of the
analysis provide safety and comfort standards for road
users according to the SNI 7391 standard (2008) [21].
The LEAP method aims to analyze and justify that the
installation of LED lamps can reduce the electricity
consumption of Street Lighting until 2030 [22]. LEAP
method based on berdasarkan framework project
scheme on Figure 1.
Based on the results of justification, saving
electrical energy by replacing LED lamps can be
continued and will provide economic savings every
year. These savings can be used for repair and
maintenance of street lamps as well as installing lamps
in locations that require street lighting [23]. In addition
to statistical analysis, it also analyzes the results of the
Street Lighting point profile survey, the lamp flash
survey, the Street Lighting electricity consumption
analysis per year, the Baseline Street Lighting analysis
per year, and the annual GHG emission reduction
analysis.
Figure 1. Project based mitigation framework
street lighting sector
3. Results and Discussion The results of the study consisted of analysis of
the Street Lighting point profile, Street Lighting
electricity consumption, street light intensity, and GHG
mitigation action analysis. The type of Street Lighting
used in Palembang City is a high-pressure sodium lamp
of the Son-T type with a maximum lifetime of 15,000
hours [14]. The efficiency of Son-T lamps has an
average of 110 lumens/watt according to the brand and
type of lamp [24]. The street lighting profile of
Palembang City has a total number of lamp points of
42,770 units with the total power and the percentage of
electricity consumption as presented in Table 3.1 [8].
Based on the data in Table 1, the number of
lamp points of Street Lighting is 42,770 units with a
total power of 5,136.14 kW. Based on data from the
Department of Housing and Settlement Areas, 3,408
LED lamps have replaced all of the Son-T 250 W
lamps [7]. Due to limited data on LED lamps in 2011
to 2018, it is assumed that the total LED lamp power
is 120 W which is used for the LEAP analysis study.
Based on the survey results, the LED lamps with a
Electricity Consumption Data
of Street Lighting for 10 years
CO2 Emissions &
Economy (BAU)
CO2 Emissions &
Economy (BAU)
CO2 Emissions &
Economy (BAU)
CO2 Emissions &
Economy (BAU)
Recommendations for Increasing Energy Saving and
Reducing GHG Emissions for Palembang Government
Electrical Energy
Consumption
Street Lighting
Sector

Vol. 6 No. 1, 49-66 http://dx.doi.org/10.22135/sje.2021.6.1.49-66 53
power of 120 W are retrofit lamps installed under the
LRT bridge.
Table 1. Number and power of street lighting
installed in 2004 to 2019
Type of
Lamp Unit
Total
Power
(kW)
Electrical
Energy
Consumption
(kWh)
Per 1 Year
Son-T250 W 3,486 871.5 3,817,170
Son-T150 W 11,074 1,661.1 7,275,618
Son-T70 W 24,351 1,704.5 7,466,016
HPL 125 W 3,594 449.25 1,967,715
LED 3,741 448.92 1,966,269
SolarCell80W 10 0.8 3,504
Total 42,770 5,136.14 22,496,293
Source: Department of Housing and Settlement Areas, 2019
The highest number of Street Lighting units by
type is the Son-T 70 W lamp. Each lamp has a different
electrical energy consumption based on the number of
lamps. The biggest Street Lighting power
consumption is the Son-T 70 W lamp at 33.87% with
a total power of 1,704.57 kW [8]. The percentage of
electrical energy consumption in the Son-T 250 W
lamp is 17.32%, which is greater than the LED lamp
of 6.84%. The value (%) of electrical energy
consumption will increase as the number of lamps
increases.
The survey results related to Street Lighting's
12-hour run time represents the varying consumption
of electrical energy per day and per year. The total
electricity consumption of Street Lighting by type of
lamp according to procurement for 2019 Table 1.
Electricity consumption profile of Street
Lighting based on secondary data from PLN UP3,
Palembang City area is divided into each district. The
distribution of electricity in Palembang City is divided
into Rivai District, Kenten District, Sukarami District
and Ampera District. Rivai District has the highest
level of electrical energy consumption of 16,182,968
kWh in 2019 [3].
The highest electricity consumption at Rivai
District (P3 tariff) in 2015 to 2019 is due to the large
number of office and hotel buildings as well as luxury
housing clusters that require more street lighting.
Based on PLN secondary data, an increase in the total
electricity consumption of Street Lighting in
Palembang City occurs annually from 45,707,580
kWh to 52,845,036 kWh in 2019 [3].
3.1. Lamp Point Profile and Operational
Maintenance for LED and Non-LED Street
Lighting
The installation of LED and non-LED Street
Lighting points is mainly carried out on arterial and
protocol roads of Palembang City. Arterial roads are
roads that serve major transportation. Its characteristics
are that it is intended for long-distance travel, a high
average speed, and the number of entrances is limited
[25].
Installation of Son-T lamps is carried out on the
left and right sides of arterial roads with a power of 250
W. The substitution of Son-T lamps into LED lamps is
also carried out on the middle section of arterial roads
(retrofitting) where the route passes through arterial
and collector roads in Palembang City. [26].
Meanwhile, on the collector road, the installation of
LED lamp points tends to be on the left and right side
of the road (standalone) with a power of 120 W. The
number of street lighting points along with the power
specifications is presented in Table 2.
Table 2. Number of LED and Non-LED lamp
points and power per year
Year Total of
Son-T
Total of
LED
Total of
HPL
Total of
Street
Lighting
2004 7,799 0 3,594 11,393
2005 8,515 0 3,594 12,109
2006 10,036 0 3,594 13,630
2007 11,990 0 3,594 15,584
2008 13,997 0 3,594 17,591
2009 15,580 0 3,594 19,174
2010 15,821 0 3,594 19,415
2011 17,599 382 3,594 20,811
2012 19,013 484 3,594 22,123
2013 21,978 1,417 3,594 25,419
2014 23,840 1,651 3,594 27,311
2015 28,427 1,651 3,594 31,898
2016 32,915 1,831 3,594 36,386
2017 36,358 2,018 3,594 39,829
2018 39,036 2,236 3,594 42,507
2019 39,036 3,741 3,594 42,770
Source: Department of Housing and Settlement Areas, 2019
Based on the data in Table 2 above, the total
number of Son-T lamp points is 39,036 units [8]. The
Son-T lamp is a yellow street lighting that uses an
incandescent filament [16]. Son-T Street Lighting is
installed on the collector road with a power of 150 W
and secondary collector road with a power of 70 W and
lamp power of 250 W which is installed on the arterial
road of Palembang City.
Meanwhile, Son-T lamps with a power of 70 W
are mostly installed in residential areas. Referring to
Table 2, the number of LED Street Lighting points in
the Palembang City area is 3,418 units. A number of
LED light points entirely replaces the Son-T 250 W
lamps. In addition, there is no increase in the number
of Son-T 250 lamps in 2019 and the following years.
Street Lighting SOx also did not experience additional
units. It is the same with HPL lamps with a total of
3,594 units in 2019.
Vol. 6 No. 1, 49-66 http://dx.doi.org/10.22135/sje.2021.6.1.49-66 54
The initial installation of LED lights was
prioritized at 8the Islamic Solidarity Games in 2013.
The installation of LED lights on arterial roads and
under the LRT (retrofit) bridge in Palembang City is
also a policy of the Palembang City government in the
success of the 2018 ASEAN Games.
The entire operational authority of Street
Lighting belongs to the Public Housing and Residential
Areas in carrying out the maintenance and management
of Street Lighting and community services [23]. The
city government of Palembang has made efforts to save
operational costs for street lighting by replacing the
Son-T 250 W lamps with LED lamps and solar cells.
Based on research conducted by Luqman
Assafat (2015), the performance of Son-T lamps is
betterthan HPL-N lamps because the light intensity is
better than HPL-N lamps, the absorption of electric
current is smaller and the efficiency is better [27]. The
number of additions of Son-T lamps compared to HPL
lamps in Palembang City also increases the efficiency
of Street Lighting. Referring to research conducted by
Asnal Effendi and Niko Razonta (2015), the efficient
street lighting for collector roads with a width of 6
meters is the Son-T 150 W lamp and for environmental
roads is the Son-T 70 W lamp [28].
The addition of 10 solar cell lights in 2019 is a
pilot project whose plans will be developed in the
following year [29]. The increase in the total number of
Street Lighting in the Palembang City area occurred
significantly from 2004 to 2019. The increase in the
number of Street Lighting units increased the
electricity consumption of Street Lighting every year.
The total electricity consumption of Street Lighting
reflects the increase in installed energy consumption in
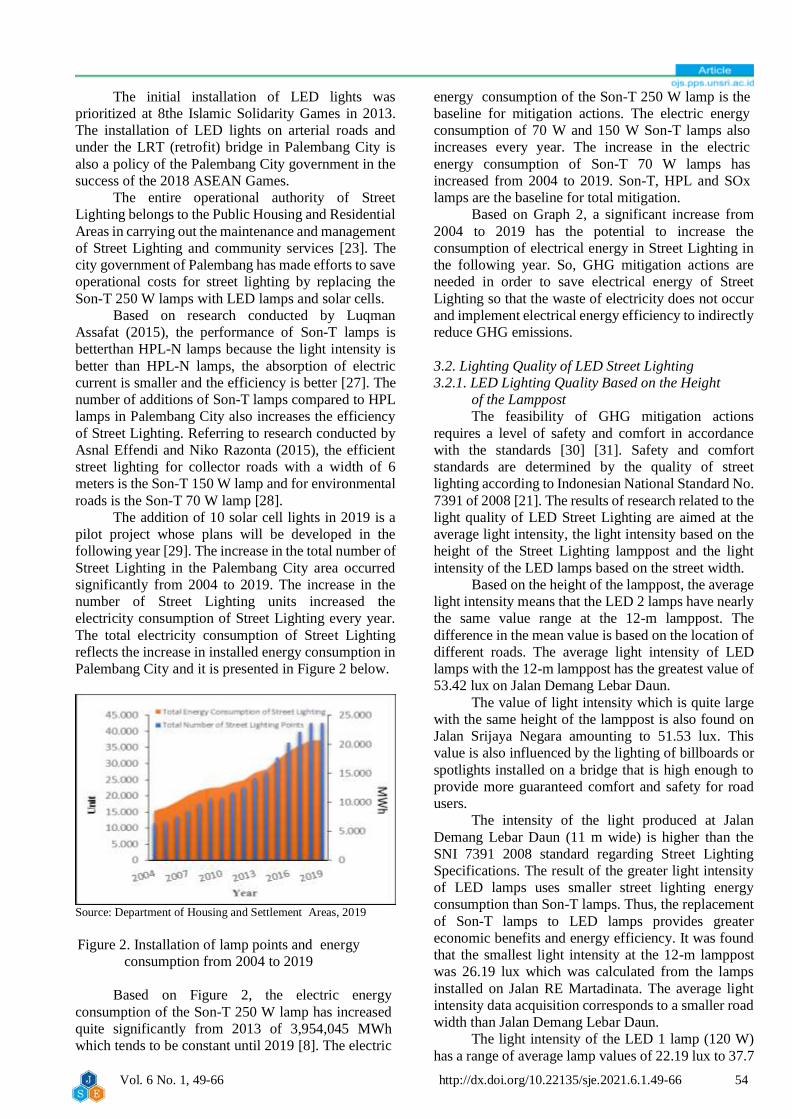
Palembang City and it is presented in Figure 2 below.
Source: Department of Housing and Settlement Areas, 2019
Figure 2. Installation of lamp points and energy
consumption from 2004 to 2019
Based on Figure 2, the electric energy
consumption of the Son-T 250 W lamp has increased
quite significantly from 2013 of 3,954,045 MWh
which tends to be constant until 2019 [8]. The electric
energy consumption of the Son-T 250 W lamp is the
baseline for mitigation actions. The electric energy
consumption of 70 W and 150 W Son-T lamps also
increases every year. The increase in the electric
energy consumption of Son-T 70 W lamps has
increased from 2004 to 2019. Son-T, HPL and SOx
lamps are the baseline for total mitigation.
Based on Graph 2, a significant increase from
2004 to 2019 has the potential to increase the
consumption of electrical energy in Street Lighting in
the following year. So, GHG mitigation actions are
needed in order to save electrical energy of Street
Lighting so that the waste of electricity does not occur
and implement electrical energy efficiency to indirectly
reduce GHG emissions.
3.2. Lighting Quality of LED Street Lighting
3.2.1. LED Lighting Quality Based on the Height
of the Lamppost
The feasibility of GHG mitigation actions
requires a level of safety and comfort in accordance
with the standards [30] [31]. Safety and comfort
standards are determined by the quality of street
lighting according to Indonesian National Standard No.
7391 of 2008 [21]. The results of research related to the
light quality of LED Street Lighting are aimed at the
average light intensity, the light intensity based on the
height of the Street Lighting lamppost and the light
intensity of the LED lamps based on the street width.
Based on the height of the lamppost, the average
light intensity means that the LED 2 lamps have nearly
the same value range at the 12-m lamppost. The
difference in the mean value is based on the location of
different roads. The average light intensity of LED
lamps with the 12-m lamppost has the greatest value of
53.42 lux on Jalan Demang Lebar Daun.
The value of light intensity which is quite large
with the same height of the lamppost is also found on
Jalan Srijaya Negara amounting to 51.53 lux. This
value is also influenced by the lighting of billboards or
spotlights installed on a bridge that is high enough to
provide more guaranteed comfort and safety for road
users.
The intensity of the light produced at Jalan
Demang Lebar Daun (11 m wide) is higher than the
SNI 7391 2008 standard regarding Street Lighting
Specifications. The result of the greater light intensity
of LED lamps uses smaller street lighting energy
consumption than Son-T lamps. Thus, the replacement
of Son-T lamps to LED lamps provides greater
economic benefits and energy efficiency. It was found
that the smallest light intensity at the 12-m lamppost
was 26.19 lux which was calculated from the lamps
installed on Jalan RE Martadinata. The average light
intensity data acquisition corresponds to a smaller road
width than Jalan Demang Lebar Daun.
The light intensity of the LED 1 lamp (120 W)
has a range of average lamp values of 22.19 lux to 37.7

Vol. 6 No. 1, 49-66 http://dx.doi.org/10.22135/sje.2021.6.1.49-66 55
lux based on different road locations. LED lamps 1
(120 W) at the 12-m lamppost are generally installed
on arterial and collector roads that represent the area of
PLN distribution areas.
3.2.3. Analysis of LED Light Intensity to
Lamppost Height and Street Width
Street light intensity is an important physical
aspect that determines safety and comfort. This study
conducted an SPSS analysis of street light intensity on
the lamppost height and street width. The influence and
magnitude of the correlation between the three
variables were calculated based on the SPSS method.
The survey results minus the number of lights that are
not lit by 49 units. Thus, the total number of lamps
analyzed is 1,619 units. The number of LED lamps
based on the survey results is greater than the minimum
sample size of 397 units. The results of the correlation
of light intensity and other influencing variables are
presented in Table 3.
Based on the results of calculations using the
SPSS method in Table 3, each street length of 1,000 m
requires a light intensity of 1,570 lux. Based on the
effect of lamp power on street width, the correlation
coefficient is 0.214. The power of one LED lamp
required on a street width of 9 m is 42.056 Watt with
the same coefficient calculation. The effect of lamp
power on the lamppost results in a correlation
coefficient of 0.622. Thus, the power of one LED lamp
for a lamppost of 7 m and 12 m is 11.25 Watt and 17.69
Watt.
Table 3. Correlation of light intensity to street width and
lamppost height using kendall tau Street Width Lamppost Height Power (Watt)
Street
Width
1.000 0.669 0.214
- 0 0
1619 1619 1619
Lamppost
Height
0.669 1 0.622
0 - 0
1619 1619 1619
Watt 0.214 0.622 1
0 0 -
1619 1619 1619
Lux 0.129 0.089 0.274
0 0 0
1570 1570 1570
(Source: The Researchers, 2020)
3.3. GHG Mitigation Analysis in Street Lighting
Sector
Street lighting sector savings also aim to reduce
final energy consumption, energy intensity of 1% per
year, and energy elasticity of less than 1% by 2025
according to the National Energy Policy. The
reduction in electrical energy consumption and
emissions in the Street Lighting sector is based on the
components and indicators of mitigation actions which
are presented in Table 4 below [20] [40] :
Table 4. GHG Mitigation Action Components an Indicators in Street Lighting Sector Components Criteria Unit Indicators
Replacement of Son-T
lamps into LED lamps
(non-retrofit)
Operation of new LED lamps to
replace incandescent lamps (Son-T
lamps)
MWh 1. Reducing the electricity consumption of Street
Lighting
Unit 2. Increasing the number of installed LED lamps
Installation of LED
lamps (retrofit)
The operation of LED lamps and
LED retrofit (installed under the
LRT bridge of Palembang City)
MWh 1. Lowering the electrical energy consumption of
Street Lighting
Unit 2. Increasing the number of installed LED lamps
3. Increasing the total number of street lamps
Use of energy efficient
solar cell (LED) lamps
The operation of the LED solar cell
lamps in the area near Tugu
Monpera
MWh 1. Increasing the power of the installed solar cell
lamps
Unit 2. Increasing the number of LED solar cell lamps
3. Increasing the total number of street lamps Source: Directorate General of Climate Change Control, Ministry of Environment and Forestry, 2018
Based on Table 4, regarding the criteria for
mitigation actions, a survey was conducted to
determine indicators and collect data on the number of
LED lamp points. Survey data regarding lamp points
and analysis of electrical energy consumption of Street
Lighting justify the installation of LED lamps, which
can reduce the consumption of electrical energy of
Street Lighting. Referring to secondary data, a total of
3,741 LED lighting units have been installed
throughout Palembang City [8]. LED retrofit lamps are
installed under the LRT bridge and non-retrofit LED
lights are installed on the left and right of the collector
road.
The baseline electricity consumption of Street
Lighting has increased every year. Baseline electrical
energy consumption is the consumption of electrical
energy without mitigation treatment which consists of
the total electrical energy consumption of Son-T 70 W,
150 W, 250 W, SOX and HPL 125 W lamps. Increasing
the number of LED lighting installations provides a
reduction in baseline energy consumption. It results in
∆ or the difference in electrical energy consumption of
Street Lighting as an indicator that the mitigation action
has been successful. The table of the baseline
electricity consumption and mitigation is presented in
Table 5 below.

Vol. 6 No. 1, 49-66 http://dx.doi.org/10.22135/sje.2021.6.1.49-66 56
Table 5. Baseline Electrical Energy Consumption
& Street Lighting Mitigation in 2011 –
2019
Total
Baseline
(MWh)
Mitigation
Energy
Consumption
(MWh)
Electricity
Energy
Saving
After
Mitigation
(MWh)
%
Efficiency
Energy
13,280.77 13,063.26 217.5108 1.638
13,773.17 13,497.58 275.5896 2.001
15,104.38 14,162.86 941.5248 6.233
15,712.06 14,637.30 1,074.764 6.840
17,293.29 16,218.52 1,074.764 6.215
18,786.69 17,609.43 1,177.256 6.266
19,842.31 18,558.58 1,283.734 6.470
20,663.39 19,255.53 1,407.863 6.813
20,663.39 18,679.12 1,984.271 9.603 Sumber :ource Department of Housing and Settlement Area, 2019
Electrical energy consumption is calculated based
on the project baseline. Based on the graph in Table 5,
the increase in baseline energy consumption in 2011 to
2019 with a slope of 1,045.9 has decreased to 858.35.
This is an indicator of the success of mitigation actions.
Total baseline electricity energy consumption in
2011 was 13,280,773 MWh, experiencing an increase in
2015 to 15,104,386 MWh and 20,663,394 MWh in
2019. The increase in total baseline consumption has
affected the amount of energy savings. If the amount of
baseline energy consumption increases sharply, the
installation of LED lamp points will still provide a low
energy efficiency value. The addition of a large enough
number of LED lamp points provides greater savings in
electrical energy. The efficiency of electrical energy in
Street Lighting sector from 2011 to 2019 is presented in
Table 6 [8].
Table 6. Electrical Energy Efficiency (%)
Year Electrical Energy Efficiency
(%)
2011 1.638
2012 2.001
2013 6.233
2014 6.840
2015 6.215
2016 6.266
2017 6.470
2018 6.813
2019 9.603
Source: Department of Housing and Settlement Areas, 2019
Referring to the data in Table 6, the electric energy
efficiency in the Street Lighting sector in 2011 was
1.638% and increased to 6.233%. It is because the
electrical energy consumption of LED lamps increases
along with the reduction in electrical energy
consumption from Son-T 250 W lamps. The result of
electrical energy efficiency in the Street Lighting sector
in 2019 is 9.603% with the addition of 10 solar cell lamp
units. Increasing the efficiency of electrical energy in
Street Lighting also provides an indirect increase in
emission reduction or reduction of GHG emissions. The
reduction in GHG emissions has increased according to
the increase in the number of LED lamp points which is
presented in Table 7 below. [8] [20].
Table 7. Reduction of GHG Emissions in Street
Lighting Sector in 2011 to 2019
Year Baseline Mitigation
Emission
Emission
after
Mitigation
Emission
Reduction
(%)
A B C D = B-C E=D/B*100
2011 11,049.60 10,868.6 180.968 1.64
2012 11,459.27 11,229.9 229.290 2.00
2013 12,566.84 11,783.5 783.348 6.23
2014 13,072.44 12,178.2 894.203 6.84
2015 14,388.01 13,493.8 894.203 6.21
2016 15,630.53 14,651.0 979.477 6.26
2017 16,508.81 15,440.7 1,068.06 6.46
2018 17,191.94 16,020.6 1,171.34 6.81
2019 17,191.94 15,541.0 1,650.91 9.60
Source: Department of Housing and Settlement Areas, 2019
Based on the data in Table 7, the baseline
emissions of Street Lighting have increased every year
based on the calculation of the total electricity
consumption of Son-T 70 W, 150 W, 250 W SOx and
HPL 125 W lamps. This increase has the potential to
continue in the next several years. In an effort to reduce
GHG emissions, it requires mitigation actions in order to
reduce GHG emissions so as to obtain a better
environmental impact.
The results of GHG emission calculations based
on the baseline project obtained 1,890.51 tons of CO2e
with a total number of LED lamps of 3,741 units. The
reduction of GHG emissions, based on data from a
survey of lamp points classified according to the street
name in Palembang City, obtained 4,281 units of LED
lamps with a reduction of 1,881,662 tons. In addition, the
1,619 LED lamp units that have been surveyed are
secondary data, so that the total number of LED lamps is
4,281 units in 2019. Additional LED lamp points are
added annually according to the official budget. LED
lamps and LED solar cells that are off are not taken into
account in GHG mitigation actions.
The results of GHG emission reduction in this
study can be seen in accordance with the reduction in the

Vol. 6 No. 1, 49-66 http://dx.doi.org/10.22135/sje.2021.6.1.49-66 57
slope of the emission graph by 714.15, which is smaller
than the slope of the baseline graph of 870.16. Emission
reduction before and after mitigation action is presented
in Figure 3 below.
Source: Department of Housing and Settlement Areas, 2019
Figure 3. Emission reduction of CO2 after mitigation action 2011 to 2019
Based on Figure 3, the slope reduction
according to the graphic above shows the mitigation
action indicator which is the replacement of the Son-T
250 W lamp into LED lamp. The percentage of GHG
emission reduction, in this case CO2, has the same
value as the percentage of electrical energy efficiency
of 9.603% or 1,650.9 tons of CO2-e.
The increase in emission reduction every year
needs to be maintained by adding or replacing Son-T
lamps into LED lamps. Increased emission reduction
also has positive environmental impacts [2] [41]. The
addition of LED lamps affects the economy in GHG
mitigation. The mitigation framework requires proper
economic planning to achieve the GHG mitigation
target of 29% by 2030 [36] [35].
The economics of GHG mitigation affect
operational costs as well as the cost of procuring Street
Lighting. The operating costs of LED lamps are
cheaper than the operating costs of Son-T lamps.
Meanwhile, the cost of installing Son-T lamps tends to
be cheaper than the operational costs [42]. Son-T
lamps of different power and type (brand) will also
provide different economic costs. The more the
number of LED lamps, the economic cost of the PJU
will decrease because the savings in electricity
consumption are increasing [43]. The increase in the
cost of saving electrical energy is presented in Figure
4.
Source: Department of Housing and Settlement Areas, 2019
Figure 4. Electricity Energy Saving Costs from Street Lighting in 2011 to 2019
The cost of electricity saving is calculated based
on kWh, the amount of electricity saved per year,
multiplied by rupiah per kWh. Based on the graph in
Figure 4, street lighting electricity savings experienced
a significant increase from 2012 to 2013 amounting to
IDR 237,558,235 to IDR 811,594,378. An increase in
y = 870,16x + 9989,2R² = 0,9767
y = 714,15x + 9896,8R² = 0,9453
02000400060008000
100001200014000160001800020000
2011 2012 2013 2014 2015 2016 2017 2018 2019
Emis
sio
n (
ton
C)2
-e
Year
Baseline Emission of Street Lighting Son T 70W, 120W, 250W & HPL
LED Street Lighting Mitigation Emission
Linear (Baseline Emission of Street Lighting Son T 70W, 120W, 250W & HPL)
Linear (LED Street Lighting Mitigation Emission)

Vol. 6 No. 1, 49-66 http://dx.doi.org/10.22135/sje.2021.6.1.49-66 58
the cost of electrical energy saving also occurred in
2018, amounting to IDR 1,883,559,005 to IDR
2,065,729,810. The increase in energy savings in
electricity reduces the total cost burden of operating
and installing street lighting. Thus, it requires planning
to add LED lamps in order to obtain greater savings
and the potential to achieve a 29% reduction in GHG
emissions.
The results of other GHG mitigation analyzes
are also based on light intensity data where GHG
mitigation actions do not affect street lighting. The
light intensity and correlation of street width and
lamppost height are adjusted to the SNI 7391 Standard
of 2008. In this case, the implementation of mitigation
actions for the replacement of LED lamps does not
reduce the quality of street lighting in Palembang City.
In order to improve the electrical energy
efficiency of Street Lighting and achieve GHG
emission reductions, the analysis of planning for
installing Street Lighting for the following year is
justified by LEAP method. The results of mitigation
analysis using the LEAP method justify that the
installation of LED lamps with a consistent number of
increments will achieve energy efficiency and a
significant reduction in GHG emissions by 2030.
LEAP analysis graphs are prepared by entering
data on street lamps, baseline, data on lamp points
before and after mitigation and a decrease in the
amount of electricity consumption. It is assumed that
there is a decrease in the energy consumption of Son T
lamps and an increase in the electricity consumption
of LED lamps. The demand for Street Lighting will
continue to increase and the power sources that
provide supply will not increase until 2030. An
analysis of the reduction in electrical energy
consumption for Street Lighting Son-T lamps in 2030
can be projected based on the existing data presented
in Figure 5 below.
Figure 5. Scenario of Projected Electric Energy Consumption for Son-T Lamps until 2030
Based on the graph (LEAP), the projected
electrical energy consumption of Son-T 250 W, 150
W and 70 W lamps will experience a significant
decrease in 2025. The electrical energy consumption
of Son-T 250 W lamps of 3.8 thousand kWh has
decreased continuously until 2019 by 0.5 thousand
kWh. It is projected that the reduction in the electrical
energy consumption of Son-T 250 W lamp in the
following year is 0 kWh until 2030. The projection of
electrical energy consumption of Son-T 150 W lamp
of 5,690.3 thousand kWh in 2010 will decrease
significantly by 5,155.4. thousand kWh in 2023 and
4,836.7 thousand kWh in 2030. The projected
reduction in electricity consumption also occurs in
Son-T 70 W lamps of 1,132.1 thousand kWh in 2010,
1,020.6 thousand kWh in 2023 and 957.5 thousand
kWh in 2030.
The projection of decreasing the electric energy
consumption of Son-T lamps is directly proportional
to the reduction in the number of Son-T lamp points
as a substitute form for LED lamps. The reduction in
the number of Son-T lamp points is also projected
using the LEAP method as justification for planning
the implementation of sustainable mitigation. The
results of the projection scenario for the reduction in
the number of Son T 150 W and 70 W lamp points are
presented in Figure 6
.
Vol. 6 No. 1, 49-66 http://dx.doi.org/10.22135/sje.2021.6.1.49-66 59
Figure 6. Scenario of Projected Number of Son-T Lamp Points until 2030
Based on the graph in Figure 6., the projected
number of Son-T lamp points until 2030 will
experience a decline. The projected number of Son-T
250 W lamp points will not be installed in 2020 and
will be exhausted in 2021. It is estimated that the
number of Son-T 150 W lamp points will decrease
from 10.9 thousand units in 2020 to 10 thousand units
in 2030. The number of Son-T 70 W lamp points is
also projected to decrease from 24.3 thousand units in
2020 to 24 thousand units in 2030.
The projection of reducing the number of Son-
T lamp points is a mitigation action that will be
implemented in accordance with installation planning
for LED lamps. The projection scenario of electricity
consumption and LED lamp points until 2030 is
presented in Figure 7.
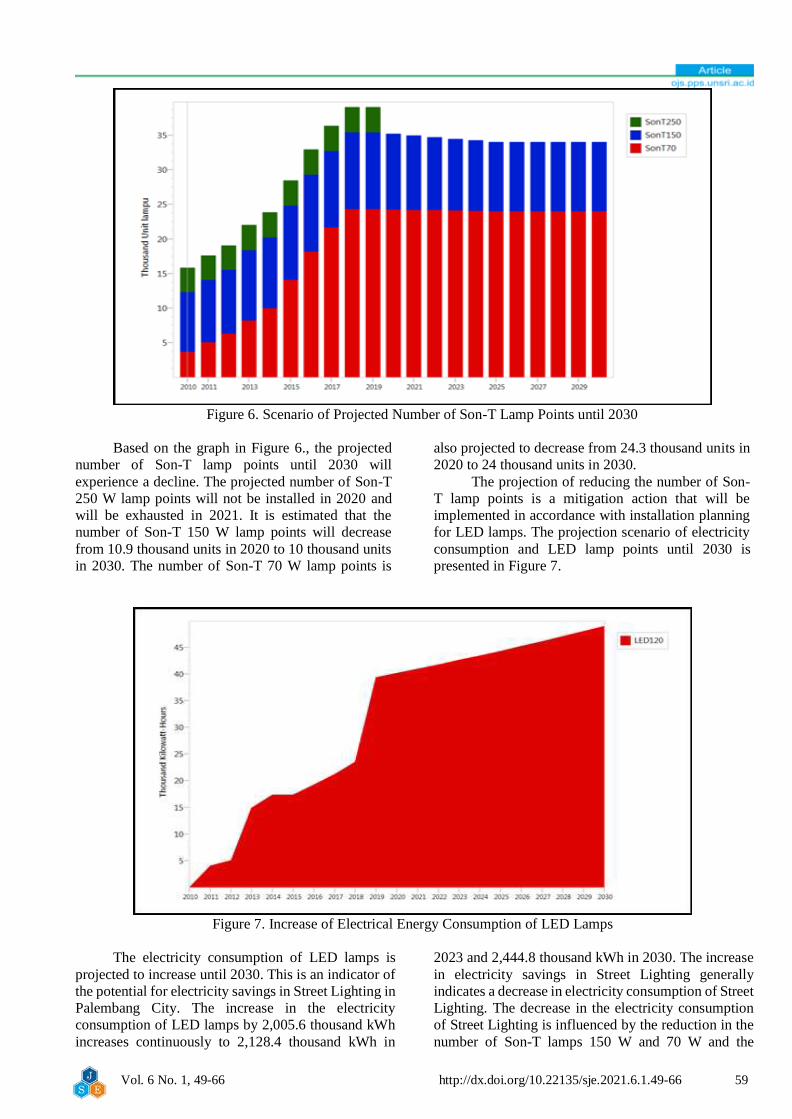
Figure 7. Increase of Electrical Energy Consumption of LED Lamps
The electricity consumption of LED lamps is
projected to increase until 2030. This is an indicator of
the potential for electricity savings in Street Lighting in
Palembang City. The increase in the electricity
consumption of LED lamps by 2,005.6 thousand kWh
increases continuously to 2,128.4 thousand kWh in
2023 and 2,444.8 thousand kWh in 2030. The increase
in electricity savings in Street Lighting generally
indicates a decrease in electricity consumption of Street
Lighting. The decrease in the electricity consumption
of Street Lighting is influenced by the reduction in the
number of Son-T lamps 150 W and 70 W and the

Vol. 6 No. 1, 49-66 http://dx.doi.org/10.22135/sje.2021.6.1.49-66 60
increase in the number of LED lamp points to be
installed. The more the number of LED lamp points
installed, the greater the chance of reducing energy
consumption in Street Lighting. The increase in the
number of LED lamp points installed until 2030 is
presented in Figure 8.
Figure 8. Projection of the Number of LED Lamp Points until 2030
Based on Figure 8, the projection of the number
of LED lamp points (LEAP) has increased
significantly in accordance with the increase in
electricity consumption of LED lamps in Figure 7. The
projected number of LED lamps in 2030 is 8,000 units.
Economy also determines the feasibility of mitigation
actions. The electricity savings obtained from the
replacement of Son-T 250 W lamps for LED lamps
provide reduced costs that can reduce the cost burden
of Street Lighting expenses.
The average electrical energy savings for Street
Lighting are calculated based on the data per district.
Secondary data on the average cost of electrical
energy saving are presented in Table 8 based on
Department of Housing and Settlement.
Table 8. Energy and Electricity Cost Savings in Street Lighting Sector in 2020
Source: Department of Housing and Settlement Areas, 2020
Based on the data in Table 8, the calculation of
the average cost savings per district refers to the data
on electricity customers who are subject to the
conversion of Son-T lamps into LED lamps, assuming
that one panel has a total of 30 lamps. Referring to this
data, it is found that 14 panels representing the
Palembang City area with 420 LED lamps so that the
calculation of the average cost savings for LED lamps
Customer IP Street Name Electrical Power Cost (before) Cost (after)
Kenten 2195323 R. Sukamto 5500 2,911,214 1,617,073
2195311 Basuki Rahmat 7700 4,243,505 2,190,780
14.100.219388.6 Sudirman - 5,837,325 625,127
14.100.219342.1 Sudirman - 9,083,063 3,078,484
Rivai 14.100.240806.6 DLD - 4,241,963 1,024,292
14.100.220465.1 DLD - 9,083,063 3,013,924
14.100.220462.4 Mayor Salim BB 11000 6,462,032 1,969,221
Sukarami 14.120.258943.0 Soekarno Hatta - 9,083,063 1,248,786
2449707 Bypass AAL 10600 5,838,438 2,701,292
2183612 Bypass AAL 23000 12,661,290 2,908,280
2183636 Bypass AAL 23000 12,661,290 2,539,993
Ampera 1242109 Ahmad Yani 5500 3,032,999 1,093,254
14.130.125161.9 Kertapati - 5,837,325 1,433,663
1247323 Ds. Palembang 13200 7,269,036 1,749,129
420 units 98,245,606 27,193,399
IDR 71,052,207
IDR 169,171.92
DistrictsElectricity Savings Per District
Total Number of Lamps (Assumption) =
Total Savings =
Savings @1 unit LED =

Vol. 6 No. 1, 49-66 http://dx.doi.org/10.22135/sje.2021.6.1.49-66 61
is IDR 169,171.92 per lamp. Thus, the estimated
average cost savings in 2030 is IDR 1,353,375,371
with 8,000 units of LED lamps. The estimated average
cost of saving electricity in 2019 based on LEAP
analysis is IDR 632,872,158 so that it will give a
twofold increase in cost savings. Based on the increase
in the percentage, Street Lighting savings cost
calculated based on electricity consumption (kWh) in
2030 (project based) is IDR 6,226,103,694 with an
electrical energy efficiency of 17.48%.
The greater the cost savings, the less the burden
of operating and installing costs for Street Lighting.
Thus, it is more profitable and simultaneously and
indirectly reduces GHG emissions in Street Lighting
sector [20] [44]. The GHG emission reduction target
based on the NDC document in 2030 is 29%.
Therefore, the achievement of the Street Lighting
sector emission reduction target is maintained at
17.48% with the addition of LED lamp replacement in
accordance with the Street Lighting Service’s budget.
Referring to these data indicators, the GHG mitigation
actions that have been carried out by the Palembang
City government have met the criteria and standards
for Street Lighting as presented in Table 8. The
achievement of the overall GHG emission reduction
target should not exceed 29% so as not to change the
energy calculation [13].
Mitigation actions in Street Lighting sector in a
sustainable manner require planning for the
installation of LED lamps in the following year with a
planned budget for the installation of LED lamps of
IDR 30,134,060,000 in 2021 [45]. The current project
cost of installing LED lamps in 2020 is IDR
9,560,000,000 [44].
Based on the installed lamp points, the analysis
of the investment cost between the Son T and LED
lamps also determines the planning of further
mitigation actions. Analysis of Son T and LED lamps,
with electricity consumption costs paid, is compared
to investment costs. The following is the total
comparison data between operating and investment
costs, which is presented in Table 9.
Table 9. Comparison of Total and Operating Costs
Year
Total Cost of
Electricity
Consumption
Per Unit (IDR)
Total Investment
Cost (IDR)
Comparison of
Electric Energy
Consumption
Costs to
Investment
Costs
2010 2,137,002 75,967,150,646 0.675
2011 2,567,994 84,914,394,842 0.707
2012 2,699,525 89,830,891,254 0.743
2013 2,699,525 107,645,706,238 0.743 2014 3,457,397 115,206,184,266 0.952
2015 4,569,150 127,549,461,828 1.258
2016 4,234,058 141,587,856,036 1.166
2017 4,595,081 152,890,513,842 1.265 2018 4,524,367 162,472,430,302 1.246
2019 3,448,643 179,619,576,460 0.735
Source: Department of Housing and Settlement Areas, 2019
Based on Table 9, the cost of electricity
consumption for Street Lighting before mitigation is
IDR 27,818,465,924.6 to IDR 26,985,729,287 in 2019.
In this case, there is a reduction or savings in electricity
consumption costs after the mitigation action is carried
out. This cost reduction is the basis and justification for
the need to implement mitigation actions of changing
LED lights in the following year.
During the 11 years of the LED lamp life, the
total investment cost was greater than before the
mitigation action was carried out, namely IDR
179,619,576,460. After the eleventh year, the LED
lamps are replaced with new LED lamps. LED lights
provide maintenance or management at low cost.
However, the cost of saving will also continue to
increase with a projection of 17.48% in 2030 and the
energy consumption of LED electricity is lower than
that of Son T lamps. Thus, the cost of electricity
consumption is cheaper. The comparison of investment
costs and electricity consumption refers to the data in
the graph in Figure 9.
Source: Department of Housing and Settlement Areas, 2019 Figure 9. Comparison of Investment Costs and Electric Power Consumption
0
5.000
10.000
15.000
20.000
25.000
30.000
0
2.000.000
4.000.000
6.000.000
8.000.000
10.000.000
12.000.000
14.000.000
16.000.000
Son T70 W
Son T150 W
Son T250 W
HPL125 W
LED SolarCell (80
W)
Son T70 W
Son T150 W
Son T250 W
HPL125 W
LED SolarCell (80
W)
2018 2019
Unit
IDR
Investation per unit Electricity Cost per Unit per Year Unit of Street Lighting

Vol. 6 No. 1, 49-66 http://dx.doi.org/10.22135/sje.2021.6.1.49-66 62
Based on Figure 9, the operational cost
compared to the investment cost for Son T 250 W
lamp is 58.78%. The number of points of the Son T
250 W lamps is small but consumes quite a lot of
electricity costs compared to other lamps of Street
Lighting. This value indicates that Son T 250 W lamps
need to be replaced.
Figure 10 The comparation of street light unit projection and power consumption unit year 2030
Based on the projection of the graph in Figure
10, the cost of electricity consumption for Street
Lighting has decreased and is an indicator of even
greater savings, assuming that PLN electricity rates
remain as in 2021. Cost savings per year are presented
in Table 10.
Table 10. Cost of Electricity Saving Per Year
Electrical Energy Saving
Year KWh Cost in IDR Percentage
(%)
2011 217,510.80 178,358.856 1.638
2012 275,589.60 237,558.235 2.001
2013 941,524.80 811,594.378 6.233
2014 1,074,764.40 1,186,539.898 6.840
2015 1,074,764.40 1,568,081.260 6.215
2016 1,177,256.40 1,591,650.653 6.266
2017 1,283,734.20 1,883,597.517 6.470
2018 1,407,863.40 1,213,578.251 6.813
2019 1,984,271.40 2,866,676.892 9.603
(Source: Department of Housing and Settlement Areas,
2019)
The results of this research calculation refer to
the data in Table 10, there are increases and decreases
in cost savings in 2018 and 2019. The biggest cost
savings occurred in 2019 amounting to IDR
2,866,676,892 due to the blackout of the lights under
the LRT bridge by PLN and the replacement of Son T
250 W lamps becomes the LED lamps. The correlation
of cost savings with investment costs and electricity
consumption can be analyzed through investment
costs and electricity consumption costs. The cost and
power consumption per year is presented in Figure 11.
Based on Figure 11, Street Lighting
consumption costs increase according to the lamp
power. Son T 150 W lamps have a higher electricity
consumption cost and are increasing every year.
Referring to the data in appendix 6, the cost of
electricity consumption for Son T 150 W lamps in 2013
and 2014 is IDR 5,739,795,090 and IDR
7,427,358,720. Then, the cost of electricity for Son T
150 W lamps increased in 2016 and became IDR
10,675,368,779 in 2017. This cost decreased in 2018
and 2019, namely IDR 10,511,085,325 because there
was no increase in the number of lamps.
In 2030, based on appendix data, the projected
reduction in electricity cost consumption for Son T 70
W lamps will be IDR 1,383,300,250, Son T 150 W
lamps IDR 6,987,580,490, HPL 125 W lamps IDR
2,842,757,861 and LEDs IDR 3,532,002,560 and solar
cell IDR 5,062,229. This indicator of reducing the cost
of electricity consumption provides greater savings if
mitigation actions are carried out in a sustainable
manner.
0
5000
10000
15000
20000
25000
30000
0200.000400.000600.000800.000
1.000.0001.200.0001.400.0001.600.0001.800.000
Son T70 W
Son T150W
Son T250W
HPL125W
LED SolarCell(80W)
Son T70 W
Son T150W
Son T250W
HPL125W
LED SolarCell(80W)
Son T70 W
Son T150W
Son T250W
HPL125W
LED SolarCell(80W)
2018 2019 2030
Un
itIDR
Electricity Cost Per Unit Per Year Unit of Street Lighting Linear (Electricity Cost Per Unit Per Year)

Vol. 6 No. 1, 49-66 http://dx.doi.org/10.22135/sje.2021.6.1.49-66 63
Figure 11. Cost and power consumption per year based on lamp type
Efforts to improve in reducing electrical energy
consumption require the value of concern for the
environment, especially energy consumption and
greenhouse gas emissions, which are involved in the
implementation of the construction and operation of
Street Lighting [46]. An alternative by conducting
energy audits in Street Lighting sector and making
alternative Street Lighting (low cost) energy savings
such as load substitution and reducing lamp hours.
Another effort that can be carried out is by installing
Street Lighting using solar cells, implementing a credit
mechanism (JCM Indonesia) in the framework of low-
carbon development to maintain the feasibility of the
quality of Street Lighting as well as optimizing
community services with minimal electrical energy
Street Lighting according to the national energy policy
[46] [47] [48].
4. Conclusions Conclusions for this research are as follows:
1. Each road length of 1,000 m requires a light intensity
of 1,570 lux with a correlation coefficient of 0.214.
In this case, the required power of one LED lamp on
a road width of 9 m is 42.056 watts with the same
coefficient calculation. So, the taller the lamppost
requires more lamp power to illuminate the road
surface of Palembang City.
2. The GHG mitigation action in the Street Lighting
sector provides projected savings below the electric
energy efficiency target of 17.48%. Street Light
energy efficiency with projected electricity
consumption savings (LEAP) and a reduction of
1,911 MWh results in cost savings of IDR
2,911,841,740 in 2019 with a reduction in CO2
(indirect) emissions of 1,650.9 tons CO2-e. The
scheme for the cost of saving electrical energy in
2030 is IDR 6,226,103,694 with an estimated
additional number of lamps of 8,000 units and
electricity consumption of 1,911 MWh.
Recommendations on the implementation of
mitigation actions in Street Lighting sector: a.
Replacing Son-T 150 W and 70 W lamps into LED
lamps by 2030; b. Implementing a low-carbon
development-based credit mechanism within the
Indonesian JCM framework; c. Replacing Son-T
lamps into LED lamps up to 8,000 units to reduce
street lighting electricity consumption and increase
GHG emission reduction
Acknowledgement
The author would like to thank Mr. Nanang
Kristanto and Mr. Jamaludin Lastiko from the National
Energy Council as the directors of LEAP program, Mr.
Dedi Suprianto, Head of Street Lighting Sector at the
Department of Housing and Settlement Areas of
Palembang City, who gave permission for the research
location, and Mr. Dicky Edwin Hindarto from JCM
Indonesia for providing valuable opportunities and
time to discuss about this research. Gratitude also goes
to Sriwijaya University that had funded this study
through Hibah Kompetitif 2017. The Head of Regional
Development Planning Agency, Research and
Development Agency of Palembang City, and the
Central Statistics Agency of Palembang City which has
0
10.000
20.000
30.000
40.000
50.000
60.000
0
2.000
4.000
6.000
8.000
10.000
12.000
Son
T 7
0 W
Son
T 2
50
W LED
Son
T 7
0 W
Son
T 2
50
W LED
Son
T 7
0 W
Son
T 2
50
W LED
Son
T 7
0 W
Son
T 2
50
W LED
Son
T 7
0 W
Son
T 2
50
W LED
Son
T 7
0 W
Son
T 2
50
W LED
Son
T 7
0 W
Son
T 2
50
W LED
Son
T 7
0 W
Son
T 2
50
W LED
Son
T 7
0 W
Son
T 2
50
W LED
Son
T 7
0 W
Son
T 2
50
W LED
Son
T 7
0 W
Son
T 2
50
W LED
2010 2011 2012 2013 2014 2015 2016 2017 2018 2019 2030
Un
it
Mill
ion
Ru
pia
hs
Elecricity Energy Consumption Cost (Million Rupiahs)
Unit of Street Lighting
Linear (Elecricity Energy Consumption Cost (Million Rupiahs))
Linear (Unit of Street Lighting)

Vol. 6 No. 1, 49-66 http://dx.doi.org/10.22135/sje.2021.6.1.49-66 64
granted research permits in Palembang City. The
author also thanks the Ministry of Environment and
Forestry, Mr. Rusdy Anwar, the Regional Mining and
Energy Company, the Jakabaring Solar Power Plant,
the Department of Energy, Resources and Minerals of
South Sumatra Province for providing discussion
opportunities and research permits, and Ms. Yossy
Sunda Permatasari, State University of Malang for
giving her valuable time to conduct discussions related
to this research.
References
[1] R. Dutu, "Challenges and Policies In Indonesia's
Energy Sector," Energy Policy, no. September
2016, pp. 513-519, 2016. [Online]. Available:
https://www.sciencedirect.com/science/article/a
bs/pii/S030142151630475X#:
[2] S. P. M. I. Dr. Fathoni Usman, "Energi antara
Kebutuhan dan Dampak Lingkungan," Institute
of Energy Infrastructure The National Energy
University Malaysia, Palembang, 2018.
[3] P. U. Palembang, "Laporan Penjualan Listrik
PLN," PLN UP3 Palembang , Palembang, 2018.
[4] Rizkie Abidin (PT Wahana Metrika); Gan
Dirgantara, Trita Katriana, Muhammad Iqbal
SIregar (GIZ), "Laporan Implementasi Prakarsa
PJU Cerdas Indonesia (Smart Lighting
Initiative) Proyek Percontohan Makassar.
Pergantian Lampu PJU menjadi Lampu LED di
Jalan Penghibur, Jalan Haji Bau, dan Jalan Pasar
Ikan," PT Wahana Metrika, GIZ, Makassar,
November 2014.
[5] Ramadhan Harisman, Joko Tri Haryanto,
Rakhmindyarto (BKF); Muhammad Handry
Imansyah, Philipp Munzinger (GIZ), "Desain
Mekanisme Pembiayaan Lampu Penerangan
Jalan Umum Hemat Energi LED untuk
Pemerintah Daerah," Kementrian Keuangan
Republik Indonesia Badan Kebijakan Fiskal
Pusat Kebijakan Pembiayaan Perubahan Iklim
dan Multilateral, Jakarta, 2013.
[6] M. Adam, "Studi Kapasitas Jalan Soekarno-
Hatta Kota Palembang Menggunakan Metode
Greenshield Pada Siang Hari dan Malam Hari
Dengan Pencahayaan Lampu Jalan," Jurnal
Teknik Sipil dan Lingkungan, vol. 2, no.
September 2014, pp. 565-572, 2014. [Online].
Available: https://ejournal.unsri.ac.id/index.
php/jtsl/article/view/1368
[7] S. M. (. Dedi Suprianto, Interviewee, Pergantian
Lampu SON T menjadi lampu LED. [Interview].
2019.
[8] PERAKP, "Daftar Jumlah Lampu Penerangan
Jalan Kota Palembang," Dinas Perumahan
Rakyat dan Kawasan Pemukiman (PRKP),
Palembang, 2019.
[9] I. I. K. MBA, "Efisiensi Energi," in Presentasi
Sinarmas Land Pada FGD Pengurus Utamaan
Efisiensi Energi Dalam Pembangunan Rendah
Karbon, Jakarta, 2019.
[10] UNFCCC, First Nationally Determined
Contribution Republic of Indonesia (COP 24),
UNFCCC, 2016.
[11] DPRD dan Presiden Republik Indonesia,
"Undang - undang Republik Indonesia Nomor
16 Tahun 2016," in Pengesahan Paris
Agreement to The Unites Nations Framework
Convention on Climate Change (Persetujuan
Paris Atas Konvensi Kerangka Kerja
Perserikatan Bangsa - bangsa Mengenai
Perubahan Iklim, Jakarta, 2016.
[12] J. C.Fort, "The Paris Climate Agreement and
Comming Global Implementation," in CLE
Seminar for In-House Counsel, Chiicago,
Illinois, 2016.
[13] Dewan Energi Nasional, "Perhitungan Capaian
Bauran Energi Primer," 19 August 2020.
[Online]. Available:
https://den.go.id/index.php/dinamispage/index/
925-perhitungan-capaian-bauran-energi-
primer.html. [Accessed 30 August 2020].
[14] H. Aprizal, "Analisis Ekonomi Penggunaan
Lampu LED Sebagai Alternatif Pengganti
Lampu Konvensional Pada PJU Di Kota
Pontianak".
[15] A. Hidayat, "Cara Hitung Rumus Slovin Besar
Sampel," Statistikian, 16 December 2017.
[Online]. Available:
https://www.statistikian.com/2017/12/hitung-
rumus-slovin-sampel.html. [Accessed 30
August 2020].
[16] A. S. Asnal Effendi, "Evaluasi Sistem
Pencahayaan Lampu Jalan Di Kecamatan
Sungai Bahar," Jurnal Teknik Elektro ITP, vol.
2, no. Juli 2013, pp. 86-94, Juli 2013.
[17] PLN KITSBS, "Data Produksi Bahan Bakar
KITSBS 2017," PLN KITSBS, Palembang ,
2017.
[18] IPCC, "2006 IPCC Guidelines for National
Greenhouse Gas Inventories," Institute for
Global Environment Strategies (IGES),
Hayama, 2008.
[19] W. Graus and E. Worrell, "Methods for
Calculating CO2 intensity of power generation
and consumption : A global perspective,"
Energy Policy, no. 20 October 2010, pp. 613-
627, 2010. [Online]. Available:
https://www.sciencedirect.com/science/article/
abs/pii/S0301421510007858
[20] Direktorat Jendral Pengendalian Perubahan

Vol. 6 No. 1, 49-66 http://dx.doi.org/10.22135/sje.2021.6.1.49-66 65
Iklim Kementrian Lingkungan Hidup dan
Kehutanan, Pedoman Penentuan Aksi Mitigasi
Perubahan Iklim, M. Ir. Emma Rachmawaty,
Ed., Jakarta: Direktorat Mitigasi Perubahan
Iklim, Direktorat Jendral Pengendalian
Perubahan Iklim KLHK, 2018.
[21] Standar Nasional Indonesia, Spesifikasi
Penerangan Jalan Di Kawasan Perkotaan (SNI
7391:2008), Jakarta: Badan Stadardisasi
Nasional, 2008.
[22] LEAP SEI, "LEAP," 2016. [Online]. Available:
www.leap.co.id. [Accessed August 2019].
[23] D. (PERAKP), Interviewee, Kewenangan
Operasional PJU. [Interview]. Februari 2019.
[24] A. Effendi and A. M, "Perencanaan Penerangan
Jalan Umum Jalan Lingkar Utara Kota Solok,"
Jurnal Teknik Elektro ITP, vol. 1, no. Januari
2012, pp. 23-32, 2012. [Online]. Available:
https://ejournal.itp.ac.id/index.php/telektro/artic
le/view/16
[25] Badan Pengembangan Sumber Daya Manusia
Pusat Pendidikan dan Pelatihan Jalan,
Perumahan Permukiman dan Pengembangan
Infrastruktur, Kementrian Pekerjaan Umum dan
Perumahan Rakyat, "Diklat Pembantu Pengawas
Pekerjaan Jalan dan Jembatan Undang-undang
Jalan Nomor 38 Tahun 2004 dan PP Nomor 34
Tahun 2006 tentang Jalan," [Online]. [Accessed
2020].
[26] PERAKP, "Daftar Lokasi Lampu Jalan Yang
Terkena Proyek Monorel dari Bandara S/d
Jakabaring," Dinas Perumahan Rakyat dan
Kawasan Pemukiman (PERAKP), Palembang,
2019.
[27] L. Assafat, "Perbandingan Unjuk Kerja Lampu
Jenis HPL-N dan SON-T Sebagai Lampu
Penerangan Jalan Umum".
[28] A. Effendi and N. Razonta, "Penataan dan
Meterisasi Lampu Penerangan Jalan Umum
(LPJU) Desa Apar Kecamatan Pariaman Utara,"
Jurnal Teknik Elektro ITP, vol. 4, no. 1 Januari
2015, pp. 9-18, 2015. [Online]. Available:
https://ejournal.itp.ac.id/index.php/telektro/artic
le/view/222
[29] D. B. Limbong and S. T. Kasim, "Perbandingan
Teknis dan Ekonomis Penggunaan Penerangan
Jalan Umum Solar Cell Dengan Penerangan
Jalan Umum Konvensional," Singuda Ensikom,
vol. 8, no. September 2014, pp. 146-151, 2014.
[Online]. Available: https://jurnal.usu.ac.
id/index.php/singuda_ensikom/article/downloa
d/7735/4002
[30] Direktorat Jendral Energi Baru Terbarukan dan
Konservasi Energi KESDM, "Peraturan Menteri
ESDM No.14 Tahun 2012 Tentang Manajemen
Energi," Jakarta, 2012.
[31] Direktorat Jendral Energi Baru Terbarukan dan
Konservasi Energi KESDM, "Efisiensi Energi
Dalam Pembangunan Rendah Karbon," Jakarta,
2019.
[32] S. M. Dr. Ronny Bako, Pengelolaan Energi dan
Sumber Daya Alam Nasional, Jakarta: PT Balai
Pusataka (Persero), 2016.
[33] A. Kadir, Energi Sumber Daya, Inovasi, Tenaga
Listrik dan Potensi Ekonomi, Jakarta: UI-Press,
1995.
[34] Direktorat Jendral Energi Baru Terbarukan dan
Konservasi Energi KESDM, Rekam Jejak
Sukses Keberhasilan Konservasi Energi,
Jakarta: Direktorat Konservasi Energi Direktorat
Jendral Energi Baru Terbarukan dan Konservasi
Energi KESDM, 2014.
[35] D. Bram, Hukum Perubahan Iklim Perspektif
Global dan Nasional, Malang: Setara Press,
2016.
[36] D. E. HIndarto, "Aspek Biaya Mitigasi dalam
Penerapan Pasar Karbon : Pembelajaran dari
CDM dan JCM," [Online]. Available:
jcm.ekon.go.id. [Accessed 2019].
[37] Republic Of Indonesia, First Nationally
Determined Contribution Republic of Indonesia,
Jakarta, 2016.
[38] Direktorat Konservasi Energi KESDM, Data &
Informasi Konservasi Energi, Jakarta: Direktorat
Konservasi Energi KESDM, 2018.
[39] PLN, Statistik PLN 2016, Jakarta: PT PLN
(Persero), 2016.
[40] Pemerintah Provinsi Sumatra Selatan , Rencana
Aksi Daerah (RAD) Emisi Gas Rumah Kaca
(GRK) Provinsi Sumatra Selatan Tahun 2010
sampai 2030, Palembang: Pemerintah Provinsi
Sumatra Selatan, 2018.
[41] M. M. Alam, M. W. Murad, A. H. M. Noman
and I. Ozturk, "Relationship among carbon
emissions, economic growth, energy
consumption and population growth: Testing
Environmental Kuznets Curve hypothesis for
Brazil, China, India and Indonesia," Ecological
Indicators, no. 22 June 2016, pp. 466-479, 2016.
[Online]. Available: https://www.sciencedirect.
com/science/article/abs/pii/S1470160X1630368
5
[42] A. F. Irawan, M. Dofir and H. Suyono, "Analisis
Peningkatan Efisiensi Penerangan Jalan Umum
(PJU) Di Kabupaten Jember," 2012.
[43] "Perencanaan dan Analisis Pembiayaan
Penerangan Jalan Umum (PJU) Studi Kasus : Jl.
Tangkil-Ngeluk Kec. Gesi Kab. Sragen".
[44] Ahmad Wahid; Ir. Junaidi, M.Sc.; Dr. Ir. H. M.

Vol. 6 No. 1, 49-66 http://dx.doi.org/10.22135/sje.2021.6.1.49-66 66
Iqbal Arsyad, MT, "Analisis Kapasitas dan
Kebutuhan Daya Listrik Untuk Menghemat
Penggunaan Energi Listrik Di Fakultas Teknik
Universitas Tanjungpura".
[45] Dinas Perumahan Rakyat dan Kawasan
Pemukiman Kota Palembang , "Rencana
Program Dan Kegiatan Serta Prakiraan Maju
Rencana Kerja SKPD Kota Palembang Tahun
2021 Seksi Penerangan Jalan Umum," Dinas
Perumahan Rakyat dan Kawasan Pemukiman ,
Palembang , 2020.
[46] Dinas Perumahan Rakyat dan Kawasan
Pemukiman , "Daftar Kegiatan Proyek Seksi
Penerangan Jalan Umum Dinas PRKP Kota
Palembang Tahun 2020," Dinas Perumahan
Rakyat dan Kawasan Pemukiman , Palembang ,
2020.
[47] R. Anwar, Interviewee, Penundaan Proyek
Pemasangan Lampu Solar Cell PJU PDPDE.
[Interview]. Juli 2020.
[48] M. Suparmoko, Ekonomi Sumber Daya Alam
dan Lingkungan Suatu Pendekatan Teoritis,
Yogyakarta: BPFE-Yogyakarta, 2013.
[49] D. E. Hindarto, "The 4 Years of JCM
Implementation in Indonesia and its Evolution
Towards Sustainable Low Carbon Growth
Scheme," JCM Indonesia , Jakarta.
[50] N. B. R. Rupawanti. "Analisis dan Efisiensi
Daya Instalasi Penerangan Jalan Umum
Menggunakan Solar Cell di Kabupaten
Lamongan," JE-Unisla Program Studi Teknik
Elektro. vol 2 No 2 pp. 1-7. 2017. [Online].
Available:https://jurnalteknik. unisla.ac.id/
index.php/elektronika/article/view/80
[51] R. A. Sugardiman, E. Rachmawaty, M. Idrus A.,
R. G. Dewi, E. Pratiwi, A. Gunawan, E.
Prasonta, A. Srihananto, D. F. Wijayanti, et.al,
"Identifikasi dan Penghitungan Aksi Mitigasi
Pada Event Asian Games 2018," Direktorat
Jendral Pengendalian Perubahan Iklim
Kementrian Lingkungan Hidup dan Kehutanan,
Jakarta, 2018.