analysis Of Gene Expression Data - University Of...
39
Jianlin Cheng, PhD Department of Computer Science Informatics Institute Analysis of Gene Expression Data 2011
Transcript of analysis Of Gene Expression Data - University Of...

Jianlin Cheng, PhD
Department of Computer Science
Informatics Institute
Analysis of Gene Expression Data
2011

Outline
• Introduction to gene expression and DNA
microarray
• Data normalization
• Analysis of differential gene expression
• Clustering of gene expression data
• Classification of gene expression data
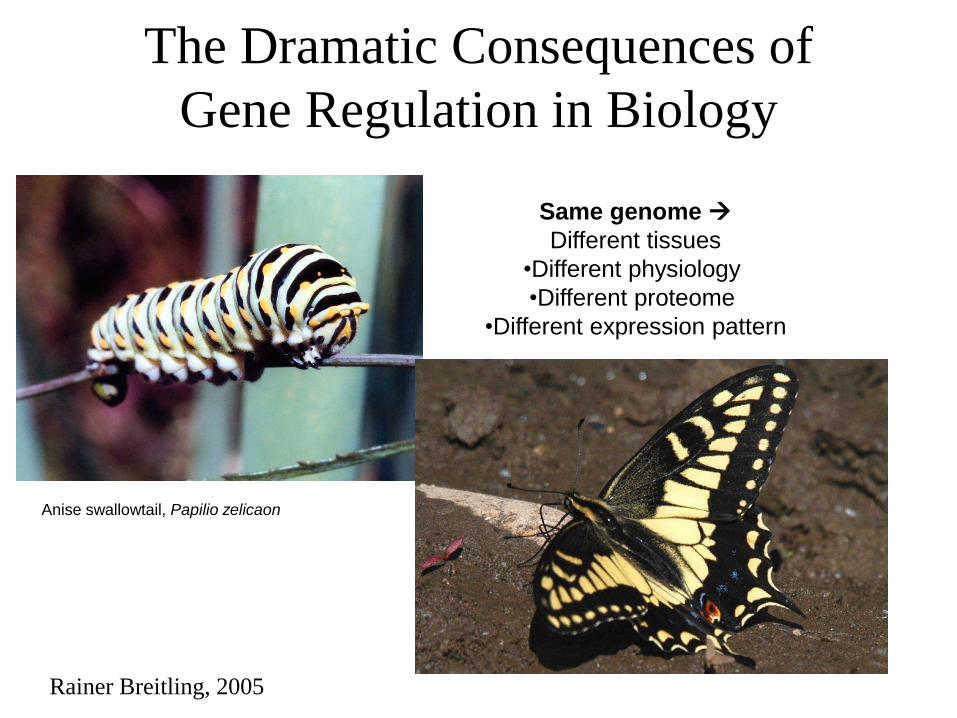
The Dramatic Consequences of
Gene Regulation in Biology
Same genome
Different tissues
•Different physiology
•Different proteome
•Different expression pattern
Anise swallowtail, Papilio zelicaon
Rainer Breitling, 2005

Gene Expression Measurement
• mRNA expression represents dynamic aspects of cell
• mRNA expression can be measured by DNA Microarrays
• mRNA is isolated and labeled with fluorescent protein
• mRNA is hybridized to the target; level of hybridization
corresponds to light emission which is measured with a
laser
• DNA Microarray can measure the expression of thousands
of genes at the same time (high throughput)

GeneChip® Hybridization
Image courtesy of Affymetrix.
Rainer Breitling, 2005

Microarray Images -> Differential
Expression
Reference cDNA
Experimental cDNA
Upregulated
Downregulated
A. Singh, 2005

H. Do, T. Kirsten, E. Rahm, 2003

Data Extraction
One Color
• Calculate ratio of red to green fluorescence
• Convert to log2 and round to integer
Two-Color
• Calculate log R and log G.

Microarray Data Example
Fig. 7.1
Page 190 J. Pevsner, 2005
Genes
Time Points
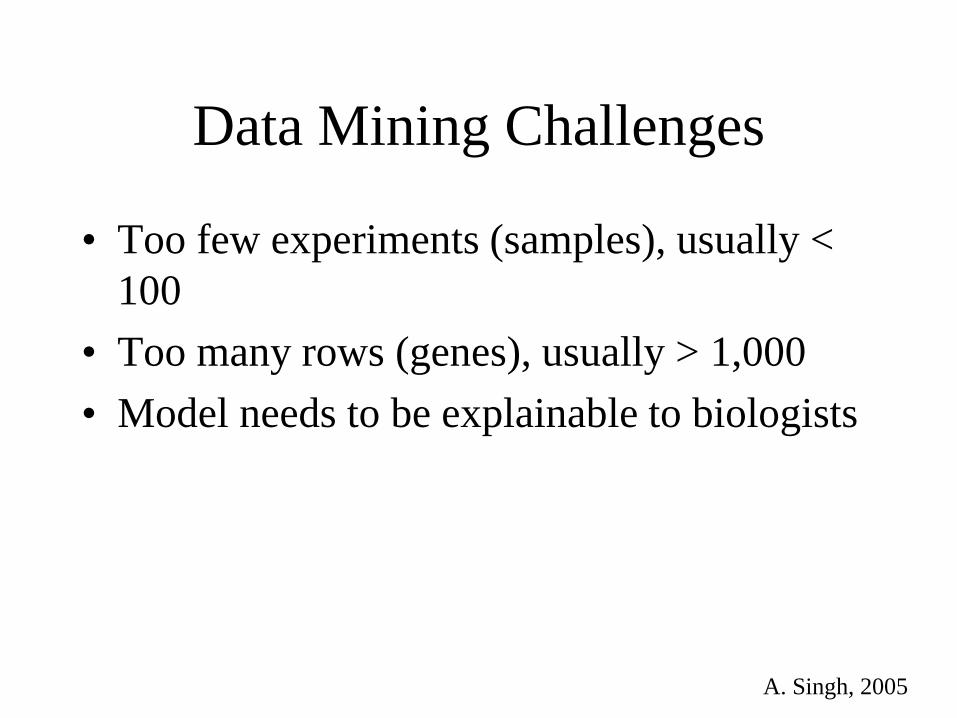
Data Mining Challenges
• Too few experiments (samples), usually <
100
• Too many rows (genes), usually > 1,000
• Model needs to be explainable to biologists
A. Singh, 2005
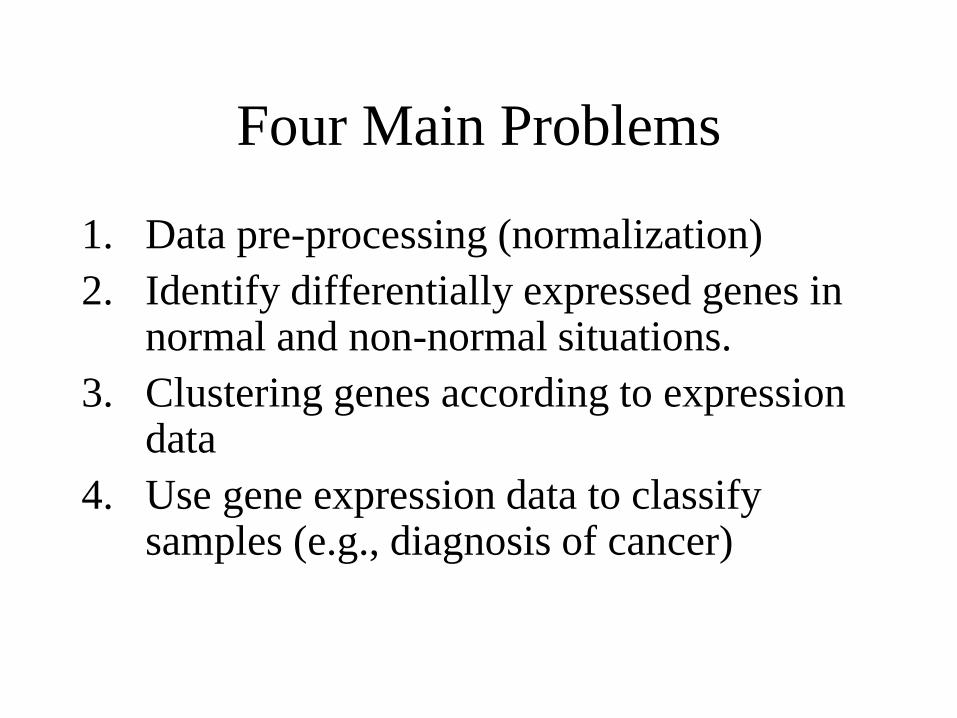
Four Main Problems
1. Data pre-processing (normalization)
2. Identify differentially expressed genes in normal and non-normal situations.
3. Clustering genes according to expression data
4. Use gene expression data to classify samples (e.g., diagnosis of cancer)

Outline
• Introduction to gene expression and DNA
microarray
• Data normalization
• Analysis of differential gene expression
• Clustering
• Classification
• Databases and software

Microarray data analysis: normalization
The main goal of data preprocessing is to remove
the systematic bias in the data as completely as
possible, while preserving the variation in gene
expression that occurs because of biologically
relevant changes in transcription.
A basic assumption of most normalization procedures
is that the average gene expression level does not
change in an experiment.
Page 191
J. Pevnser, 2005

Data normalization
Calibrated, red and green equally detected Uncalibrated, red light under detected
A. Singh, 2005

Normalization: global
• Normalization based on a global adjustment
log2 R/G log2 R/G - c
• Common choices for c = median or mean of log
ratios for a particular gene set (e.g. all genes, or
control or housekeeping genes)
http://ludwig-sun2.unil.ch/~darlene/

Gene expression data example
Data on m genes for n samples
Genes
mRNA samples
Gene expression level of gene i in mRNA sample j
= (normalized) Log( Red intensity / Green intensity)
sample1 sample2 sample3 sample4 sample5 …
1 0.46 0.30 0.80 1.51 0.90 ...
2 -0.10 0.49 0.24 0.06 0.46 ...
3 0.15 0.74 0.04 0.10 0.20 ...
4 -0.45 -1.03 -0.79 -0.56 -0.32 ...
5 -0.06 1.06 1.35 1.09 -1.09 ...
http://ludwig-sun2.unil.ch/~darlene/

Outline
• Introduction to gene expression and DNA
microarray
• Data normalization
• Analysis of differential gene expression
• Clustering
• Classification
• Inference of gene regulatory networks
• Databases and software

Scatter plots
Differentially expressed genes are higher (or lower) in one of the
samples
classical scatter plot
Rainer Breitling, 2005
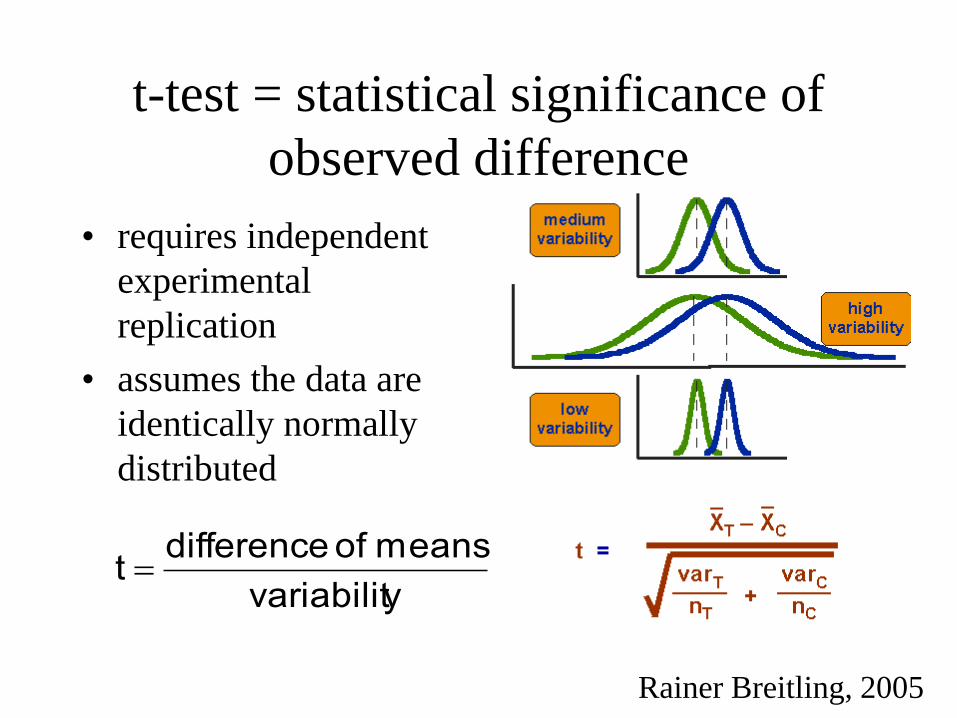
t-test = statistical significance of
observed difference
• requires independent
experimental
replication
• assumes the data are
identically normally
distributed
yvariabilit
means of differencet
Rainer Breitling, 2005

Testing an intrinsic
hypothesis
• Two samples with mean
expression that differ by
some amount d.
• If H0 : d = 0 is true, then
the expected distribution
of the test statistic t is
Fre
qu
en
cy
X1 X2
d | |X X1 2
Sample 2
Sample 1
-3 -2 -1 0 1 2 3
Pro
ba
bilit
y
tX X
sX X
1 2
1 2
Rainer Breitling, 2005

The result of “differential expression” statistical analysis
Fold-Change Gene Symbol Gene Title
1 26.45 TNFAIP6 tumor necrosis factor, alpha-induced protein 6
2 25.79 THBS1 thrombospondin 1
3 23.08 SERPINE2
serine (or cysteine) proteinase inhibitor, clade E (nexin, plasminogen activator inhibitor type
1), member 2
4 21.5 PTX3 pentaxin-related gene, rapidly induced by IL-1 beta
5 18.82 THBS1 thrombospondin 1
6 16.68 CXCL10 chemokine (C-X-C motif) ligand 10
7 18.23 CCL4 chemokine (C-C motif) ligand 4
8 14.85 SOD2 superoxide dismutase 2, mitochondrial
9 13.62 IL1B interleukin 1, beta
10 11.53 CCL20 chemokine (C-C motif) ligand 20
11 11.82 CCL3 chemokine (C-C motif) ligand 3
12 11.27 SOD2 superoxide dismutase 2, mitochondrial
13 10.89 GCH1 GTP cyclohydrolase 1 (dopa-responsive dystonia)
14 10.73 IL8 interleukin 8
15 9.98 ICAM1 intercellular adhesion molecule 1 (CD54), human rhinovirus receptor
16 9.97 SLC2A6 solute carrier family 2 (facilitated glucose transporter), member 6
17 8.36 BCL2A1 BCL2-related protein A1
18 7.33 TNFAIP2 tumor necrosis factor, alpha-induced protein 2
19 6.97 SERPINB2 serine (or cysteine) proteinase inhibitor, clade B (ovalbumin), member 2
20 6.69 MAFB v-maf musculoaponeurotic fibrosarcoma oncogene homolog B (avian)
Rainer Breitling, 2005

Outline
• Introduction to gene expression and DNA
microarray
• Data normalization
• Analysis of differential gene expression
• Clustering
• Classification
• Inference of gene regulatory networks
• Databases and software

Clustering Goals
• Identify gene classes / gene correlations / gene functions
• Support biological analysis / discovery (pathways, regulatory sites)
• Hierarchical clustering

Two Components of Clustering
Algorithms
• Similarity / Distance Measures
• Clustering Methods

Similarity / Distance Measures
Pearson correlation
(looks for similarity in
shape of the response
profile, not the absolute
values)
Euclidean distance
takes absolute expression
level into account
Manhattan (or city-
block) distance
Rainer Breitling, 2005

Hierarchical Clustering
• The first algorithm used in gene expression data
clustering (Eisen et al., 1998)
• Algorithm
– Assign each data point into its own cluster (node)
– Repeat
• Select two closest clusters are joined. Replace them with a new
parent node in the clustering tree.
• Update the distance matrix by computing the distances
between the new node with other nodes.
– Until there is only one node (root) left.

Hierarchical Clustering
Combine most similar genes into agglomerative clusters,
build tree of genes
Rainer Breitling, 2005


Two-way
clustering
of genes (y-axis)
and cell lines
(x-axis)
(Alizadeh et al.,
2000)
J. Pevsner, 2005

A Sample Classification Example
• Leukemia: Acute Lymphoblastic (ALL) vs
Acute Myeloid (AML), Golub et al, Science,
v.286, 1999
– 72 examples (38 train, 34 test), about 7,000 genes
– Gene expression values are features
ALL AML
Visually similar, but genetically very different Y. Guo, V. Curan, H. Morris, 2005

Results on the Test Data
• Select genes (Feature selection)
• Best neural net model used 10 genes per
class
• Evaluation on test data (34 samples) gives 1
or 2 errors (94-97% accuracy) using most
classification methods
Y. Guo, V. Curan, H. Morris, 2005

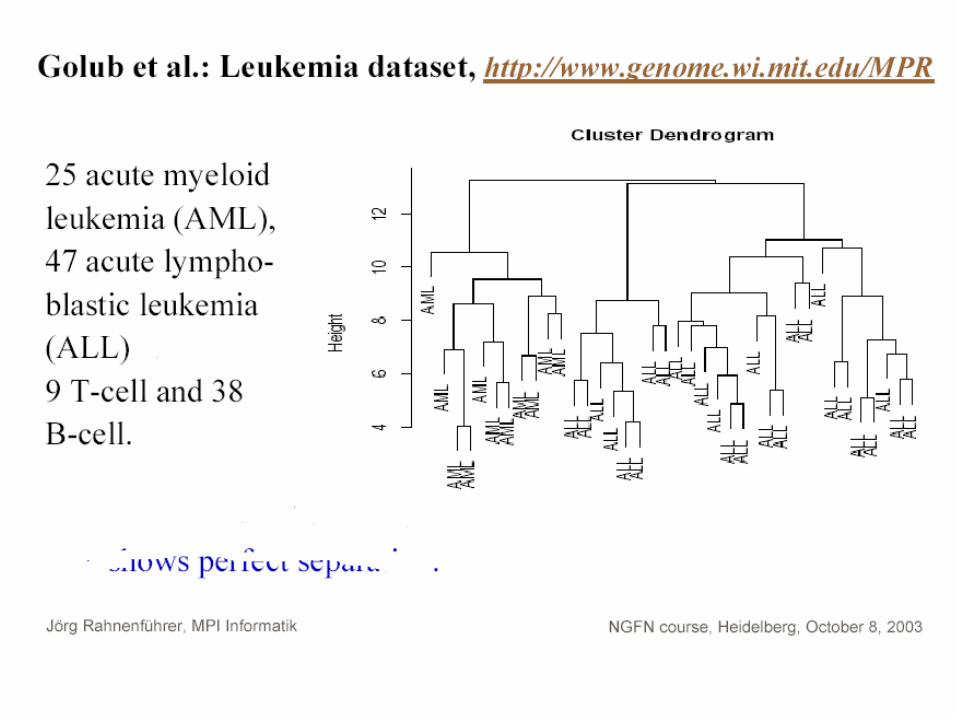
Classical study of cancer subtypes
Golub et al. (1999)
identification of diagnostic genes
Rainer Breitling, 2005
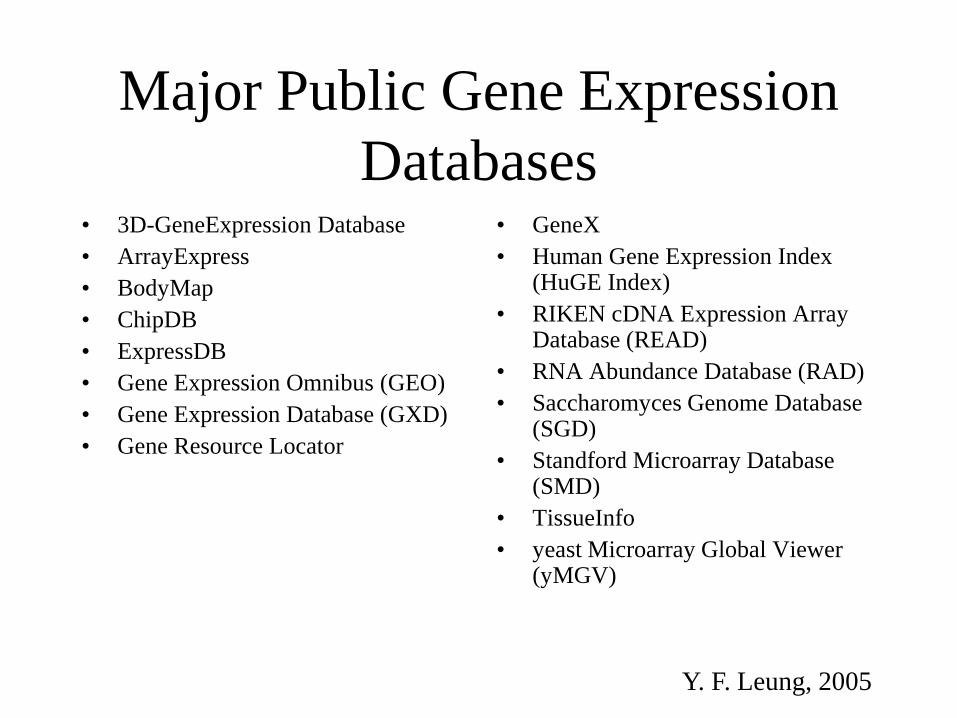
Major Public Gene Expression
Databases • 3D-GeneExpression Database
• ArrayExpress
• BodyMap
• ChipDB
• ExpressDB
• Gene Expression Omnibus (GEO)
• Gene Expression Database (GXD)
• Gene Resource Locator
• GeneX
• Human Gene Expression Index (HuGE Index)
• RIKEN cDNA Expression Array Database (READ)
• RNA Abundance Database (RAD)
• Saccharomyces Genome Database (SGD)
• Standford Microarray Database (SMD)
• TissueInfo
• yeast Microarray Global Viewer (yMGV)
Y. F. Leung, 2005

Comprehensive Software
• Definition: Software incorporate many
different analyses for different stage in a
single package.
• Examples
– Cluster (Mike Eisen, LBNL)
– GeneMaths (Applied Maths)
– GeneSight (Biodiscovery)
– GeneSpring (Silicon Genetics) Y. F. Leung, 2005

Specific Analysis Software
• Definition: Software performing a few/ one specific analysis
• Examples
– GeneCluster (Whitehead Institute Centre for genome research)
– INCLUSive - INtegrated CLustering, Upstream Sequence retrieval and motif Sampler (Katholieke Universiteit Leuven)
– SAM – Significance Analysis of Microarrays (Stanford University)
Y. F. Leung, 2005

GeneCluster
• GeneCluster – performing normalization,
filter and SOM
Y. F. Leung, 2005

Inclusive
• INCLUSive - INtegrated CLustering, Upstream Sequence
retrieval and motif Sampler
• SAM – finding statistical significant differentially
expressed gene
Y. F. Leung, 2005


