Analysis of Galaxy 15 Satellite Images from a Small ... · Analysis of Galaxy 15 Satellite Images...
9
Analysis of Galaxy 15 Satellite Images from a Small-Aperture Telescope Sergei Nikolaev, Don Phillion, Lance Simms, Alex Pertica, Scot S. Olivier Lawrence Livermore National Laboratory, 7000 East Ave, Livermore, CA 94550 Rita Cognion Oceanit, 590 Lipoa Parkway, Suite 154, Kihei, HI 96753 ABSTRACT Galaxy 15, a geostationary telecommunications satellite, ceased responding to ground operators commands on April 5, 2010. The satellite went into eastward longitudinal drift interfering with operation of other geostationary satellites. Before and after the control of Galaxy 15 was re-established on December 27, 2010, some optical observations of the satellite were conducted using a small-aperture telescope, at sidereal tracking rate, to derive more accurate orbital parameters for Galaxy 15. Here we present the optical imagery for Galaxy 15 satellite and analyze the data. Applying state-of-the-art streak extraction algorithm, and using batch/sequential least squares orbital fitting, we quantify the orbital improvement derived from these data. In addition, we study photometric signatures of Galaxy 15 in both attitude-controlled and uncontrolled regimes, comparing the light curves. This case study demonstrates the usefulness of optical observations by small- aperture telescopes for improving the orbits of GEO satellites. 1. INTRODUCTION In Space Situational Awareness (SSA) applications, observations are the main basis for inferring the state and the dynamics of the near-Earth space environment. The Space Surveillance Network (SSN) includes both radar and optical sensors, which are dynamically tasked to track various resident space objects (RSO) as required. For low- and medium-Earth orbits (LEO and MEO), radars are the preferred sensors because of their all-weather day/night performance, sensitivity to small objects (≤1cm), fast tracking capability, and the range information they provide. However, due to their signal r -4 dependence on the range to the target (due to active illumination), radars are not very suitable for tracking RSOs at geostationary orbits (GEO). Objects at GEO orbits are best tracked by optical sensors. To maintain the catalog of RSOs at GEO, the SSN employs a number of GEODSS (Ground-based Electro-Optical Deep Space Surveillance) telescopes, located at Maui, Socorro, and Diego Garcia. These 1-meter class systems are capable of tracking 30-cm objects at GEO, but depend on favorable visibility conditions, including solar illumination, flux, elevation over the horizon, weather, etc. Because of this, the gaps in coverage are quite common for any given GEO object; to maintain continuous coverage, other sensors outside of the SSN must fill those gaps. In this paper, we present optical observations of Galaxy 15 satellite (NORAD ID: 28884) by a small-aperture telescope (16-inch) in sidereal tracking mode and demonstrate the quantity and quality of information that can be extracted from such observations. The Galaxy 15 satellite, launched to geostationary orbit in October 2005, went through the period of several months (April-December 2010) during which it did not respond to commands from the ground. During this time period, the satellite drifted eastward causing interference with other GEO satellites and prompting reshuffling of other satellites by its operator, Intelsat. The observations we collected covered both the uncontrolled Galaxy 15 drift, and the normal operations after the control of the
Transcript of Analysis of Galaxy 15 Satellite Images from a Small ... · Analysis of Galaxy 15 Satellite Images...

Analysis of Galaxy 15 Satellite Images from a Small-Aperture Telescope
Sergei Nikolaev, Don Phillion, Lance Simms, Alex Pertica, Scot S. Olivier Lawrence Livermore National Laboratory, 7000 East Ave, Livermore, CA 94550
Rita Cognion
Oceanit,590 Lipoa Parkway, Suite 154, Kihei, HI 96753
ABSTRACT Galaxy 15, a geostationary telecommunications satellite, ceased responding to ground operators commands on April 5, 2010. The satellite went into eastward longitudinal drift interfering with operation of other geostationary satellites. Before and after the control of Galaxy 15 was re-established on December 27, 2010, some optical observations of the satellite were conducted using a small-aperture telescope, at sidereal tracking rate, to derive more accurate orbital parameters for Galaxy 15. Here we present the optical imagery for Galaxy 15 satellite and analyze the data. Applying state-of-the-art streak extraction algorithm, and using batch/sequential least squares orbital fitting, we quantify the orbital improvement derived from these data. In addition, we study photometric signatures of Galaxy 15 in both attitude-controlled and uncontrolled regimes, comparing the light curves. This case study demonstrates the usefulness of optical observations by small-aperture telescopes for improving the orbits of GEO satellites.
1. INTRODUCTION In Space Situational Awareness (SSA) applications, observations are the main basis for inferring the state and the dynamics of the near-Earth space environment. The Space Surveillance Network (SSN) includes both radar and optical sensors, which are dynamically tasked to track various resident space objects (RSO) as required. For low- and medium-Earth orbits (LEO and MEO), radars are the preferred sensors because of their all-weather day/night performance, sensitivity to small objects (≤1cm), fast tracking capability, and the range information they provide. However, due to their signal r-4 dependence on the range to the target (due to active illumination), radars are not very suitable for tracking RSOs at geostationary orbits (GEO). Objects at GEO orbits are best tracked by optical sensors. To maintain the catalog of RSOs at GEO, the SSN employs a number of GEODSS (Ground-based Electro-Optical Deep Space Surveillance) telescopes, located at Maui, Socorro, and Diego Garcia. These 1-meter class systems are capable of tracking 30-cm objects at GEO, but depend on favorable visibility conditions, including solar illumination, flux, elevation over the horizon, weather, etc. Because of this, the gaps in coverage are quite common for any given GEO object; to maintain continuous coverage, other sensors outside of the SSN must fill those gaps. In this paper, we present optical observations of Galaxy 15 satellite (NORAD ID: 28884) by a small-aperture telescope (16-inch) in sidereal tracking mode and demonstrate the quantity and quality of information that can be extracted from such observations. The Galaxy 15 satellite, launched to geostationary orbit in October 2005, went through the period of several months (April-December 2010) during which it did not respond to commands from the ground. During this time period, the satellite drifted eastward causing interference with other GEO satellites and prompting reshuffling of other satellites by its operator, Intelsat. The observations we collected covered both the uncontrolled Galaxy 15 drift, and the normal operations after the control of the

satellite has been restored, and thus allow comparing photometric signatures for possible attitude determination. The paper is organized as follows. In Section 2, we describe the data and initial reduction procedures. In Section 3, we describe the image reduction pipeline, including the WCS registering, streak extraction, and orbit determination. In Section 4, we present the results of the analysis, including quantitative measures for the orbit improvement compared with the concurrent Two-Line Element (TLE) catalogs, as well as the photometry analysis. We draw the conclusions in Section 5.
2. INSTRUMENTATION Galaxy 15 was observed on two different nights (1 December 2010 and 8 March 2011) with a human-tended, portable telescope system in the parking lot near the Oceanit office building in Kihei, Hawaii. The telescope itself is the Oceanit-designed MStar, a modified Cassegrain with a 16-inch aperture, focal length of 1.8 m and refractive optics after the secondary mirror to flatten the field from edge to edge (Fig. 1).
Fig. 1. MStar telescope used for observations described in this paper.

The images are acquired with an Apogee Alta U47 back-illuminated CCD camera with midband coating. The midband coating is optimized for the visible region; it provides the CCD with an absolute quantum efficiency of greater than 90% from 480 nm through 700 nm. The CCD has 1024 by 1024 pixels, each 13 µm wide. The plate scale of the resulting images is 1.43″/pixel and the field of view is 0.4°× 0.4°. Notably, the camera has a mechanical iris shutter; the time required to activate the shutter (to open or close it) is on the order of 10 milliseconds. This introduces a small position error for objects viewed with an exposure of several seconds. Most of the Galaxy 15 images were exposed for 4 seconds, although some of the December images were acquired with a 2-sec exposure. The images were read out at 2 MHz with 12-bit digitization. The portable system includes a filter wheel, but the Clear filter was used for these observations to maximize light gathering. The telescope is mounted on Software Bisque’s Paramount MME, which sits atop a mobile tripod pier. When used as a stand-alone sensor, as in this case, satellite tracking is accomplished through the use of Software Bisque’s TheSky6 software. TheSky6 ingests user-provided TLEs and propagates the satellite’s orbit to the current epoch. CCDSoft is then used to control the telescope, to slew it to the satellite’s position, to track the satellite at the specified rate (sidereal, in this case), and to acquire the images. Timing for the system is provided by a Symmetricon GPS receiver, model #BC637PCI-U. The timestamp accuracy is better than 5 µsec. Previously acquired images of a GPS satellite (Navstar 49) used for validating the processing pipeline were acquired in October 2009 with a 16-inch RC Optical Systems telescope (RC-16). Aside from its location in a dome in Kihei, and autonomous (untended) operation, the rest of the telescope system’s configuration is the same as described for the portable system, including the Apogee Alta camera. With the RC-16 and its 0.67× telecompressor, the images from the Apogee Alta CCD have plate scale of 1.08″/pixel, and a field of view 0.3°×0.3°. The images were acquired with an exposure of 2 seconds. All of the images analyzed in this investigation were acquired with the satellite being tracked at sidereal rate.
3. METHODS The optical images were processed by a custom image reduction pipeline, based on the optical modeling components of the TESSA (Testbed Environment for Space Situational Awareness) simulator, developed at LLNL [1]. The pipeline consisted of three major processing steps:
• Finding a World Coordinate System (WCS) solution for the image; • Extracting satellite streaks with accurate endpoints information; • Correcting for special relativistic aberration due to the observer’s motion with respect to
the solar barycenter. The primary contribution is the ~30 km/sec orbital motion of the earth about the sun. Also correcting for the light speed time delay.
• Running the streaks through Batch/Sequential Least Squares algorithm to derive the (improved) orbital parameters.
Each step of the process is detailed below. 3.1 WCS solution To derive the WCS for the images, we use the WCSTools software package [2]. Given the approximate WCS info in the header of the original FITS images, the pipeline first runs SExtractor software [3] on the images to find stellar positions. The 100 brightest stars in the image are then used to match to stars in USNO-A2.0 astrometric catalog [4]. The astrometric solution is found iteratively, by optimizing the rms error on matched stars as a function of the

parameters of WCS transformation (rotation, translation, scale). The typical rms error of the derived astrometric solution is 0.2″ (0.14 pixels). 3.2 Streak Extraction Algorithm Two custom streak extraction algorithms were evaluated, one based on Canny edge detector [5], and the other developed for STARE mission [6]. The latter algorithm consistently gave more accurate results (when compared on GPS-carrying satellite), and was used for the streak extraction. The details of the algorithm are shown in Fig. 2. The streak extraction consists of four primary sub-processes described below (for more details, see [6]).
Fig. 2. Streak extraction algorithm.
1. Image Correction: Raw images are cleaned using bad pixel masking and sky image subtraction (either the mode or a true sky image), and then interpolated using an algorithm that seeks to maintain continuity in the tracks. As a final step, they may be optionally smoothed.
2. Object Detection: Detecting an object consists of identifying a contiguous set of pixels with value above a threshold T (typically, T=3σ, where σ is the noise in the image). Each object is classified as a STAR, TRACK, or UNKNOWN based upon its ellipticity and the number of pixels it contains.
3. Iterative Local Fitting at Track Endpoints: An iterative, weighted linear fit is applied to the track to constrain the endpoints in the direction transverse to the track. While the algorithm allows for local fitting at each endpoint to accommodate potential curvature in the track due to rotation of the imaging system, in this case a global fit is used because the latter is not an issue.
4. Matched Filter at Track Endpoints: Once the track has been fit, the path the target took near each endpoint is well known. What remains is to find exactly where the track ends in the longitudinal direction. To do this, a region of interest (ROI) around the endpoint is chosen and an attempt to reproduce this ROI with a simulated one is made. The simulation process involves creating a line segment of length L with respect to the ROI border, convolving it with a filter that matches the PSF of the optical system, increasing L, and then repeating. At each step, the simulated ROI is subtracted from the real ROI to

form a residual. The minimum residual gives the best approximation of the true endpoint (L can be made smaller to increase the resolution).
The algorithm has been extensively tested on real images as well as simulated tracks and star fields, to determine the accuracy as a function of track length, orientation, brightness, etc. The typical endpoint accuracy is 0.12 pixels [5]. 3.3 Batch/Sequential Least Squares To process the observed streaks parameters (streak endpoints and time information), we use the sequential least squares algorithm to derive the improved orbital information. Sequential differential least squares orbit refinement is the best method to refine an initial estimated orbit when the effect of unknown or unmodeled forces over the observation time period is small. Our implementation of sequential least squares always uses all the observations to date, which is the most robust way. A crude estimate of the covariance matrix can be obtained from a set of different TLEs over a few days period. In our sequential least squares orbit refinements, we assumed a covariance matrix that was much worse than the actual covariance matrix in order to obtain a significant change in the orbit. The initial orbits were derived from TLEs within a few days after the observations and the orbit refinements are all SGP4 sequential least squares orbit refinements.
4. RESULTS 4.1 Testing the Pipeline: Navstar 49 The primary purpose of the Navstar 49 data was to verify the reduction pipeline. Navstar 49 (NORAD ID: 26605) carries on-board GPS unit, so its position is known very precisely. To decode the GPS signal, we used publically available GPS ephemerides [7], along with the PRN code for Navstar 49 (PRN 14). The Table 1 below shows the analysis of the astrometric data for the satellite.
Table 1. Astrometric data for Navstar 49 streaks. Six epochs in the table correspond to three images (each image has two streak measurements, for beginning and end of the streak). Corrected positions are adjusted for light speed and aberration (see text).
The measured astrometric data for the streaks must be corrected for two effects to get the actual positions: 1) the light speed correction, and 2) aberration. The light speed correction reflects the motion of the satellite along the orbit during the time Δt it takes for the signal to propagate to the
Measured Corrected Predicted Difference Epoch
RA Dec RA Dec RA Dec RA Dec
55132.235329 15.87929 37.54845 15.88621 37.55113 15.88628 37.55111 -0.00007 +0.00002
55132.235341 15.88807 37.55560 15.89499 37.55827 15.89498 37.55807 +0.00001 +0.00020
55132.235388 15.92355 37.58427 15.93048 37.58694 15.93069 37.58668 -0.00021 +0.00026
55132.235400 15.93235 37.59099 15.93928 37.59366 15.93939 37.59365 -0.00011 +0.00001
55132.235448 15.96860 37.62021 15.97553 37.62288 15.97544 37.62247 +0.00009 +0.00041
55132.235459 15.97730 37.62683 15.98423 37.62950 15.98415 37.62943 +0.00008 +0.00007

observer. The aberration correction takes into account the motion of the observer during the same time interval Δt. From Table 1, the rms position error is σ = 0.84″ (σα=0.32″, σδ=0.78″). At the Navstar 49 altitude (h=20000 km) this corresponds to positional uncertainty of 82 meters. The resulting rms error is a combination of WCS errors, time measurement errors, streak extraction algorithm errors, and is an indicator of the accuracy one can achieve with a small-aperture system. The same angular uncertainty at GEO distance results in the positional error of 175 meters. 4.2 Galaxy 15 Photometry In order to investigate possible variations in its attitude, we assessed the relative brightness of Galaxy 15 as function of time (or phase angle) with a separate photometric analysis performed at Oceanit. To obtain the photometry, we used AstroGraph software (Fig. 3).
Fig. 3. AstroGraph photometry pipeline.
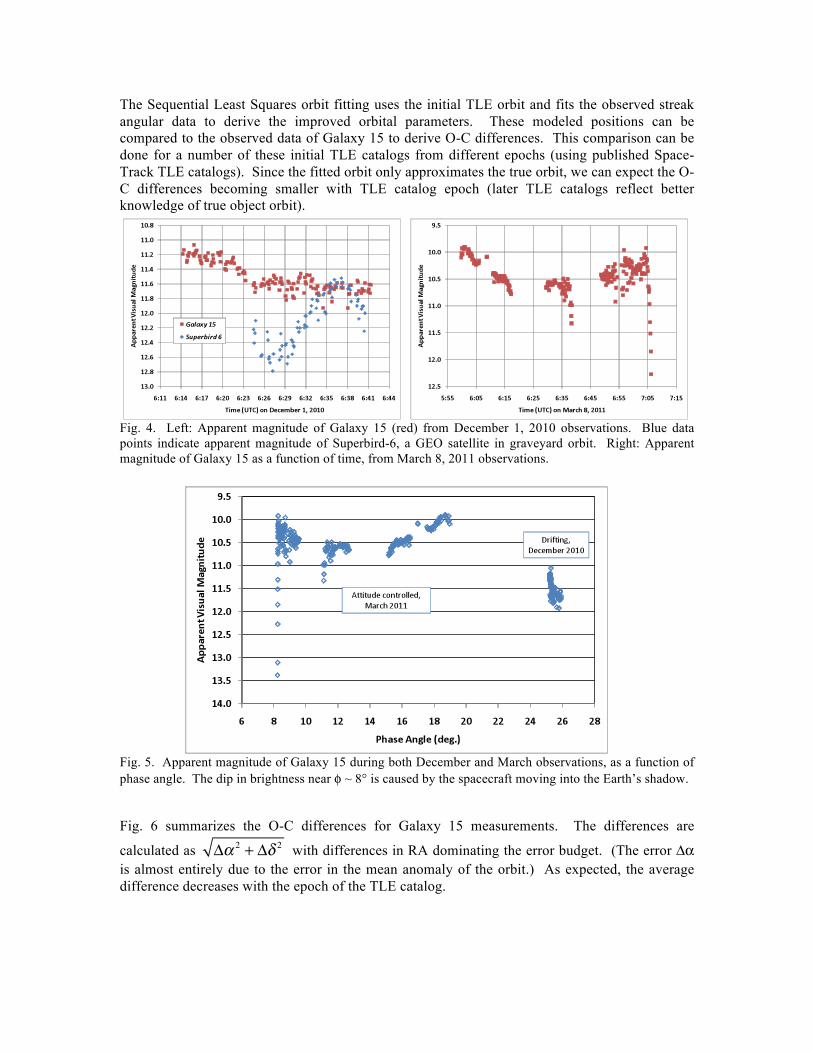
The background image is constructed as a bicubic spline fit to local values (calculated in 12×12 tiles of the original image) of 25-percentile of the pixel intensity distribution. The background image is subtracted from the target image to remove ambient sky and cloud values and produce the image to be used for star and satellite detection. The stars are detected in a threshold process that retains only the pixels whose values are more than 5σ above the median. The centroids for the detected stars are matched to a star catalog (a hybrid of Tycho-2 and USNO-B1 catalogs). The magnitudes of the matched catalog stars calibrate the flux levels on the CCD. The observations using the clear filter are calibrated using the V-filter magnitudes of the catalog stars. Fig. 4 shows the derived apparent magnitude of Galaxy 15 for December (uncontrolled regime) and March (attitude-controlled) observations. The behavior of photometric changes is similar for both data sets: the brightness typically varies by ~0.5 magnitudes in ~30 min of observations. The predicted apparent magnitude (using Lambertian sphere approximation with r = 2m and albedo A = 0.2 ) is virtually flat over the range of the phase angles at V=12. The figure also shows photometry of another GEO satellite, Superbird-6 (both satellites were in the same frames in December). The Superbird-6 (also known as Superbird A2) was damaged shortly after its launch in 2004 and was de-orbited to the supersynchronous (graveyard) orbit in 2007. The spacecraft is not attitude-controlled, and shows ~1.2 mag brightness variation during the observation window. Fig. 5 compares the photometry from both sets of observations (December and March), but as a function of the phase angle, rather than time. Fainter magnitudes during the March observations are due to clouds and due to satellite moving into the Earth shadow. 4.3 Orbit Fitting
The Sequential Least Squares orbit fitting uses the initial TLE orbit and fits the observed streak angular data to derive the improved orbital parameters. These modeled positions can be compared to the observed data of Galaxy 15 to derive O-C differences. This comparison can be done for a number of these initial TLE catalogs from different epochs (using published Space-Track TLE catalogs). Since the fitted orbit only approximates the true orbit, we can expect the O-C differences becoming smaller with TLE catalog epoch (later TLE catalogs reflect better knowledge of true object orbit).
Fig. 4. Left: Apparent magnitude of Galaxy 15 (red) from December 1, 2010 observations. Blue data points indicate apparent magnitude of Superbird-6, a GEO satellite in graveyard orbit. Right: Apparent magnitude of Galaxy 15 as a function of time, from March 8, 2011 observations.
Fig. 5. Apparent magnitude of Galaxy 15 during both December and March observations, as a function of phase angle. The dip in brightness near φ ~ 8° is caused by the spacecraft moving into the Earth’s shadow.
Fig. 6 summarizes the O-C differences for Galaxy 15 measurements. The differences are
calculated as Δα 2 + Δδ 2 with differences in RA dominating the error budget. (The error Δα is almost entirely due to the error in the mean anomaly of the orbit.) As expected, the average difference decreases with the epoch of the TLE catalog.

Fig. 6. O-C differences for the derived orbits of Galaxy 15. Left: December 1, 2010; Right: March 8, 2011. The top panel in each plot shows the difference between the observed Galaxy 15 position and the predicted position based on a TLE catalog and the Sequential Least Squares fitting. The color-coding corresponds to different TLE catalogs used for initial orbit approximation, and is explained in the bottom panel.
For both datasets, the average O-C difference decreases with time, which indicates that the official TLE catalogs approach the derived orbit of Galaxy 15, albeit several days later. This suggests that the astrometry derived from small-aperture observations can be useful for quick refinement of the GEO orbits: the observations could have been used to refine the orbit of Galaxy 15 several days before the SSN observations reached the same accuracy.1
5. CONCLUSIONS To summarize our findings, we conclude that the auxiliary optical observations of GEO satellites, even with small-aperture telescopes, are quite useful for improving the orbital parameters of GEO satellites. Most useful observations need to span a sufficiently long arc of the satellite’s orbit (2-4 hours), to lift the degeneracy between a and e parameters. The accuracy of the astrometric information extracted from the images is 0.84’’, corresponding to projected rms positional error of 175 meters at GEO. The photometry of Galaxy 15 in attitude-controlled and uncontrolled regimes shows similar behavior, changing by ~0.5 magnitudes in 30 min of observations. The data demonstrate the potential of small-aperture data for refining the orbits of GEO satellites. Acknowledgements. Part of this work performed under the auspices of the U.S. Department of Energy by Lawrence Livermore National Laboratory under Contract DE-AC52-07NA27344. The MStar, a wide field-of-view telescope optimized for astrometry, was designed and built by Oceanit under the High Accuracy Network Determination System (HANDS) Program (contract FA9451-04-C-0381). Cherilyn Faylogna and Marc Takamori were responsible for the initial integration the portable system. The observations outside the Oceanit office were also supported
1 The potential orbit improvement critically depends on the observation cadence. Mostuseful are observations over 2‐4 hour time window (sufficient orbit arc), to resolve thedegeneracybetweensemi‐majoraxisaandeccentricityewhenfittingtheorbit.

by Michael Bush, Clyde DeBell, Brooke Gibson, Curt Leonard, Michael Murai, Vicky Sensano, and Paul Weber.
References [1] S. Nikolaev, “Optical Modeling in Testbed Environment for Space Situational Awareness (TESSA)”, Applied Optics, accepted (2011) [2] D. J. Mink, “WCSTools: Image World Coordinate System Utilities”, ADASS VI, A.S.P. Conference Series, Vol. 125, Gareth Hunt and H. E. Payne, eds., p. 249 (1997) [3] E. Bertin, “SkyMaker: astronomical image simulations made easy”, Mem. S. A. It., 80, 422-428 (2009). [4] D. G. Monet, et al., USNO-A2.0 Catalog (Washington: US Nav. Obs.) (1998) [5] J. Canny, “A Computational Approach To Edge Detection”, IEEE Trans. Pattern Analysis and
Machine Intelligence, 8(6), 679–698 (1986). [6] L. M. Simms, et al. “Optical Payload for the STARE Mission”, AMOS 2011, submitted [7] http:///www.ngs.noaa.gov/orbits