Analysis of flow and energy aspects of Zero Liquid ... · UNITED NATIONS INDUSTRIAL DEVELOPMENT...
20
UNITED NATIONS INDUSTRIAL DEVELOPMENT ORGANIZATION Analysis of flow and energy aspects of Zero Liquid Discharge (ZLD) technology in treatment of tannery effluents in Tamil Nadu, India (Presented during the XXXIV IULTCS Congress Chennai/India 05-08 February 2017) J. Buljan, K.V. Emmanuel, M. Viswanathan, M. Bosnić, I. Král’
Transcript of Analysis of flow and energy aspects of Zero Liquid ... · UNITED NATIONS INDUSTRIAL DEVELOPMENT...

UNITED NATIONS
INDUSTRIAL DEVELOPMENT ORGANIZATION
Analysis of flow and energy aspects of Zero Liquid Discharge (ZLD) technology in treatment of tannery effluents in Tamil Nadu, India
(Presented during the XXXIV IULTCS Congress Chennai/India 05-08 February 2017)
J. Buljan, K.V. Emmanuel, M. Viswanathan, M. Bosnić, I. Král’

2
Copyright © 2017 by the United Nations Industrial Development Organization.
This paper was presented during the XXXIV IULTCS Congress Chennai/India 05 – 08 February 2017
Materials in this paper may be freely quoted or reprinted, but acknowledgement is required, together with a copy of publication containing the quotation or reprint.
The designations employed and the presentation of material in this publication do not imply the expression of any opinion whatsoever on the part of the Secretariat of the United Nations Industrial Development Organization (UNIDO) concerning the legal status of any country, territory, city or area, or of its authorities, or concerning the delimitation of its frontiers or boundaries. Designations such as “industrialized,” “developed” or “developing” countries are used for statistical convenience and do not necessarily express a judgment about the stage reached by a particular country or area in the development process. Mention of firm names or commercial products does not imply endorsement by UNIDO.
Acknowledgments:
The authors appreciate the cooperative spirit and the willingness of the managements of the CETPs to provide the basic data used for preparing the analyses presented in this paper. Views and comments by C. Money are also gratefully acknowledged.

3
Analysis of flow and energy aspects of Zero Liquid Discharge (ZLD) technology in treatment of tannery effluents in Tamil Nadu, India
J. Buljan1, K.V. Emmanuel2, M. Viswanathan3, M. Bosnić4, I. Král’5
Abstract
In the course of conventional treatment of tannery effluent the composition of Total Dissolved Solids (TDS) somewhat changes but its total level remains virtually constant and considerably exceeds typical discharge norms. The global trend of processing of fresh hides, i.e. salt-free raw material is continuously expanding; for a host of reasons this approach is non-existent in India. The precarious situation with water and soil pollution in the area of tannery clusters along the Palar River prompted the state environmental authorities to press for adherence to TDS discharge limits as well as to impose an approach not practiced in the tanning industry: a Zero Liquid Discharge (ZLD) concept. Essentially, the ZLD systems concentrate dissolved solids by Reverse Osmosis (RO) and some kind of Multi Effect Evaporation (MEE) until only damp solid waste remains. Solid waste is disposed and nearly all water is reclaimed and reused. Accordingly, some of the existing Common Effluent Treatment Plants (CETPs) have been supplemented by RO and MEE, together with auxiliary steps (tertiary treatment, water softening etc.). The analysis investigates and relates raw and equalized effluent inflows, RO feed, permeate and reject, evaporator feed and condensate and the yield of recovered, reusable water. Since the energy costs are critical for the viability of the entire concept, data about energy consumption (thermal, electrical main and Diesel) at key stages (RO, multistage evaporation) are consolidated, analysed and correlated. Additional energy needs and costs are compared with those for conventional (CETP) treatment and estimates made of the carbon footprint increase caused by the ZLD operations. Keywords: TDS, ZLD, effluent flows, evaporation heat, energy consumption, energy costs, carbon footprint 1 Mlinovi 62, 10000 Zagreb, Croatia; [email protected] 2 Indian Leather Industry Foundation, ILIFO, Chennai, India; www.ilifo.org 3UNIDO, Kanpur Leather Development Project, U.P., India; [email protected] 4 A. Starčevića 17a/IV, 23000 Zadar, Croatia; [email protected] 5 United Nations Industrial Development Organization, UNIDO Vienna, Austria; [email protected]

4
Introduction
In the tanning area of Ranipet, Vellore District there are about 200 tanneries grouped in three clusters, each serviced by a CETP with treated effluent ultimately ending in the Palar River which in the recent years is mostly dry with no flow. There are neither sewerage networks nor sewage treatment plants in the adjacent municipalities.
Total Dissolved Solids (TDS), mainly chlorides and sulphates in tannery effluent have become the major environmental concern in arid and semi-arid regions as they make the receiving water recipients unfit both for livestock watering and for irrigation. Although a certain percentage emanates from pickling, deliming, tanning and wet finishing, the main source of TDS, especially of sodium chloride, is salt from preservation. It is estimated that worldwide at least 3.0 million tons of common salt per year are discharged into water recipients. Whilst specific discharge limits for TDS vary, generally they cannot not be achieved by conventional treatment. Environmental damage caused by salting gradually prevails over its convenience aspects; the tanning industry in Europe has already largely switched to processing of salt-free raw material and this trend is continuously expanding (e.g. Brazil). For a host of reasons, while enforcing the TDS limit of 2100 mg/l, state environmental authorities and the tanning industry have chosen a different strategy: to adopt a Zero Liquid Discharge (ZLD) approach. The existing CETPs, following the usual treatment technology, have been supplemented by advanced, energy intensive methods like Reverse Osmosis (RO) and Multi Effect Evaporation (MEE) together with the necessary auxiliary steps (tertiary treatment, water softening etc.). This paper attempts to analyse effluent flows, energy aspects and the impact on carbon footprint of the ZLD segment at three CETP+ZLD system(s) in Vellore District after a few years of operations. In that context, experience from the CLRI - UNIDO project in 1998-2000 in operating a pilot two-stages RO plant of 1 m3/h capacity (albeit using solar pans instead of advanced evaporators) proved quite useful. The conclusion was that the system per se was technically viable but that O&M cost (only partly off-set by the price paid for fresh water) were quite prohibitive mainly due to high energy inputs.
Selection of plants for analysis
The plants selected cover the three main types of clusters: processing raw hides/skins to finished leather, (RANITEC), predominantly from raw to wet blue (VISHTEC) and from wet blue/EI to finished leather (SIDCO). The three plants basically follow the same technology, are operated by quite professional staff and the managements willing to cooperate. They are all connected to the Care AIR centre (server) of the TNPCB, the flow data are recorded in real time and counterchecks are possible.
Water consumption, effluent flows, yield
One claim is that addition of the ZLD stage has resulted in water consumption decrease from about 28 to only 11-12 l/kg of wet salted weight; increase in concentrations of pollutants support that claim. The opposing view is that local tanners already have long experience in economizing with water brought by tanks from considerable distances. To further halve
5
such low consumption within 3 – 5 years is does not look quite likely. In addition, according to some UNIDO studies, the theoretical minimum is about 12 l/kg and it requires sophisticated recycling equipment.
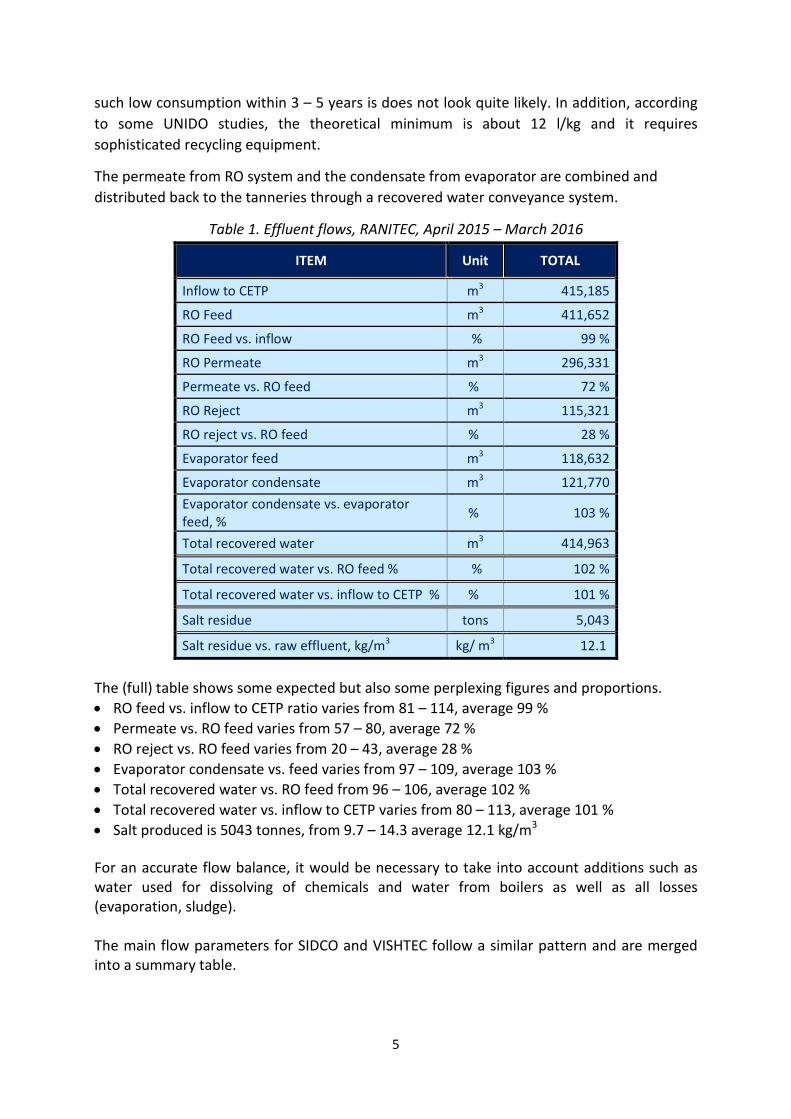
The permeate from RO system and the condensate from evaporator are combined and distributed back to the tanneries through a recovered water conveyance system.
Table 1. Effluent flows, RANITEC, April 2015 – March 2016
ITEM Unit TOTAL
Inflow to CETP m3 415,185
RO Feed m3 411,652
RO Feed vs. inflow % 99 %
RO Permeate m3 296,331
Permeate vs. RO feed % 72 %
RO Reject m3 115,321
RO reject vs. RO feed % 28 %
Evaporator feed m3 118,632
Evaporator condensate m3 121,770 Evaporator condensate vs. evaporator feed, % % 103 %
Total recovered water m3 414,963
Total recovered water vs. RO feed % % 102 %
Total recovered water vs. inflow to CETP % % 101 %
Salt residue tons 5,043
Salt residue vs. raw effluent, kg/m3 kg/ m3 12.1
The (full) table shows some expected but also some perplexing figures and proportions. • RO feed vs. inflow to CETP ratio varies from 81 – 114, average 99 % • Permeate vs. RO feed varies from 57 – 80, average 72 % • RO reject vs. RO feed varies from 20 – 43, average 28 % • Evaporator condensate vs. feed varies from 97 – 109, average 103 % • Total recovered water vs. RO feed from 96 – 106, average 102 % • Total recovered water vs. inflow to CETP varies from 80 – 113, average 101 % • Salt produced is 5043 tonnes, from 9.7 – 14.3 average 12.1 kg/m3 For an accurate flow balance, it would be necessary to take into account additions such as water used for dissolving of chemicals and water from boilers as well as all losses (evaporation, sludge). The main flow parameters for SIDCO and VISHTEC follow a similar pattern and are merged into a summary table.

6
Table 2. Comparison of flow rates in three ZLD plants in tannery clusters in Vellore District
ZLD RANITEC SIDCO VISHTEC
ITEM Apr 15 – Mar 16 Sep 15 – May 16 Apr 15 – Mar 16
Average flow rates and spans
RO feed vs. inflow to CETP 99 % (81 – 114)
99 % (97 – 101)
101 % (99 – 104)
Permeate vs. RO feed 72 % (57 – 80)
76 % (67 – 83)
75 % (71 – 81)
RO reject vs. RO feed 28 % (20 – 43)
24 % (17 – 33)
25 % (19 – 29)
Total recovered water vs. inflow 101 % (80 – 113)
98 % (94 – 101)
101 % (97 – 105)
Total recovered water vs. RO feed 102 % (96 – 106)
97 % (94 – 101)
100 % (98 – 101)
Salt residue vs. raw effluent, kg/m3 12.1 kg/m3
(10.6 – 14.3) 6.2 kg/m3 (4.7 – 8.5)
12.8 kg/m3 (11.0 – 13.9)
Note: In the case of SIDCO, the inflow to CETP is actually the flow measured at the outlet of the equalization tank. The overall flow balance is from the tanner’s viewpoint satisfactory: all losses due to evaporation (rather low due to high air humidity) and water removed with sludge are compensated by additions for dissolution of chemicals, water softening and washes. Ultimately, the effluent inflow coincides with the volume of water sent back to tanneries for reuse, its quality is superior to fresh water is due to low hardness; however, most likely due to absence of proper nitrification/denitrification during the biological treatment, there is strong presence of nitrogen in the condensate.
Figure 1. A simplified scheme of water adding & losses in the course of ZLD process

7
Figure 2. A simplified flow-chart of the ZLD treatment at RANITEC, Vellore District
The ZLD is not so much treatment but rather a salt removal and sequestration system. For good results, it should operate with constant chemistry and constant flow for which they were specifically designed and must be monitored continuously. Preparatory, post-CETP

8
“conditioning” steps, in particular water softening, often require dosing of different chemicals, including salts, which is quite a paradox for what is essentially a salt removal system. Figure 3. Pallavaram CETP, Aeration and clarifier tanks; Ultrafiltration units; Reverse osmosis;
Multiple evaporators
The permeate from the RO system and the condensate from evaporator are combined and as the recovered water and metered distributed back to one-day storage capacity tanks in individual tanneries. The salt-laden solid residue is stored in bags in a huge salt storage yard.
Norms, monitoring
Water used in tanneries in clusters in the Vellore District is in most cases a mixture of water from own drilled wells and (better) water drawn from the Palar River bed further upstream and brought by tankers; the supply and characteristics of fresh water are inconsistent and unpredictable and comprehensive analyses of fresh water apparently are not available. Reportedly, the TDS of fresh water is in the range of 800-1500 mg/l, hardness 200-800 mg/l (tankers) and 1000 - 3000 mg/l, hardness 800-2000 mg/l (own wells). Thus, the usual problem of TDS is compounded by the high TDS/hardness level of fresh water. To meet the TNPCB discharge norms for Dissolved solids (inorganic), 2100 mg/L, Chloride 1000 mg/L and Sulphates 1000 mg/L, a very different set up in the whole supply chain, mixing of treated effluent with municipal wastewater and/or advanced methods of decreasing the TDS level are required.

9
Unfortunately, differences in values found by CETP’s own laboratories and analyses carried out by independent laboratories (third parties) too often exceed normal and acceptable variations. Inevitably, this casts a kind of shadow of doubt and possibly undue reserve in considering the laboratory statistical data. The Computerized Operations Management System for the Ranipet CETP includes analytical data for key treatment units as well as sludge disposal record and sludge & leachate analysis.
Figure 4. Total Dissolved Solids (TDS), monthly averages, RANIPET, April 2015 – March 2016
Energy considerations
Energy consumption in tanneries depends on factors such as tannery location (geographic zone), production method, equipment, performance of electric motors, the ratio of manual vs. mechanical/automated handling (e.g. in moving the hides), drying methods, solid waste treatment, effluent treatment technology etc. Generally, water (float) heating and drying, almost equally, make about two thirds of the energy consumption for leather processing itself. The type of energy source is also very relevant: fossil fuel (natural gas, coal, Diesel), renewable (wood, biomass) or self-generated renewable (solar energy, wind). Optimisation of electric motors, use of electric motors with higher efficiency and reducing the level of reactive energy are an important part of (electric) energy savings measures. The use Diesel generators is limited to emergencies.
10
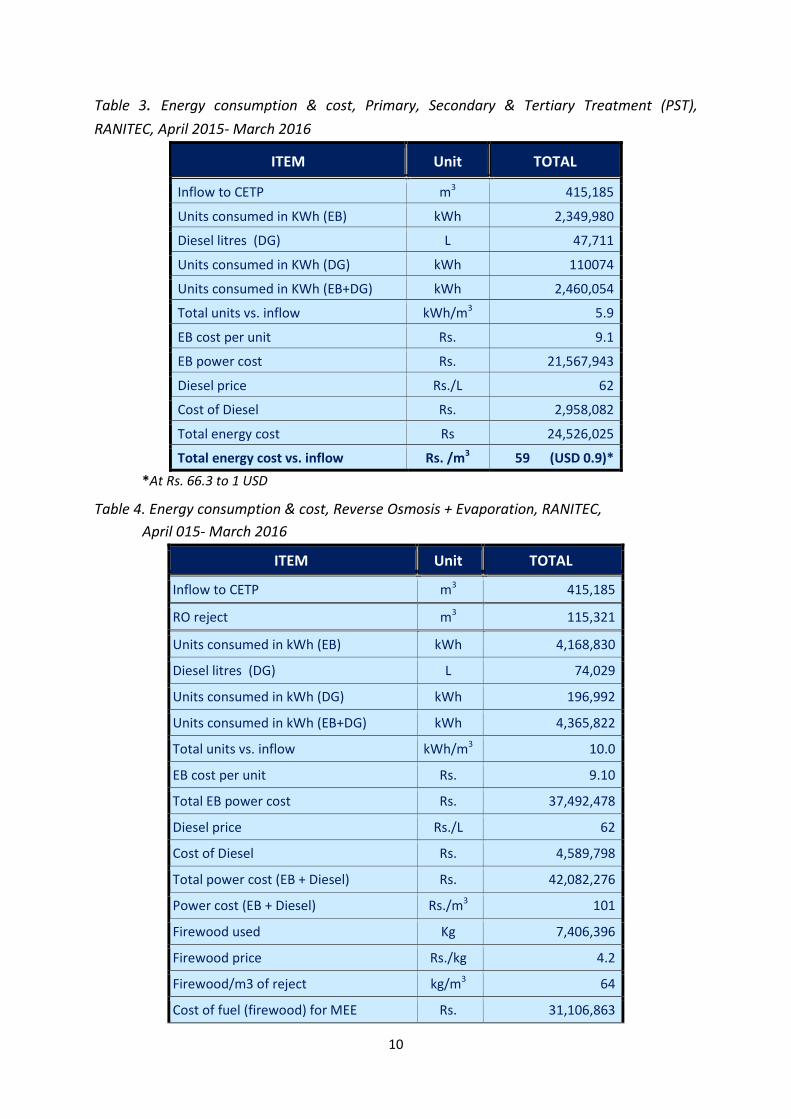
Table 3. Energy consumption & cost, Primary, Secondary & Tertiary Treatment (PST), RANITEC, April 2015- March 2016
ITEM Unit TOTAL
Inflow to CETP m3 415,185
Units consumed in KWh (EB) kWh 2,349,980
Diesel litres (DG) L 47,711
Units consumed in KWh (DG) kWh 110074
Units consumed in KWh (EB+DG) kWh 2,460,054
Total units vs. inflow kWh/m3 5.9
EB cost per unit Rs. 9.1
EB power cost Rs. 21,567,943
Diesel price Rs./L 62
Cost of Diesel Rs. 2,958,082
Total energy cost Rs 24,526,025
Total energy cost vs. inflow Rs. /m3 59 (USD 0.9)* *At Rs. 66.3 to 1 USD
Table 4. Energy consumption & cost, Reverse Osmosis + Evaporation, RANITEC, April 015- March 2016
ITEM Unit TOTAL
Inflow to CETP m3 415,185
RO reject m3 115,321
Units consumed in kWh (EB) kWh 4,168,830
Diesel litres (DG) L 74,029
Units consumed in kWh (DG) kWh 196,992
Units consumed in kWh (EB+DG) kWh 4,365,822
Total units vs. inflow kWh/m3 10.0
EB cost per unit Rs. 9.10
Total EB power cost Rs. 37,492,478
Diesel price Rs./L 62
Cost of Diesel Rs. 4,589,798
Total power cost (EB + Diesel) Rs. 42,082,276
Power cost (EB + Diesel) Rs./m3 101
Firewood used Kg 7,406,396
Firewood price Rs./kg 4.2
Firewood/m3 of reject kg/m3 64
Cost of fuel (firewood) for MEE Rs. 31,106,863

11
ITEM Unit TOTAL
Total energy cost Rs. 73,189,139
Total energy cost vs. inflow Rs./m3 176 (USD 2.7) The main energy parameters for SIDCO and VISHTEC generally follow a similar pattern and are merged into a summary table.
Table 5. Energy consumption & cost, Reverse Osmosis + Evaporation, RANITEC, SIDCO & VISHTEC 2015-2016
ITEM Average per month
Unit RANITEC SIDCO VISHTEC
Inflow to CETP m3 34,599 28,533 11,871 Units consumed in kWh (EB) kWh 347,403 227,004 9,5795
Units per inflow kWh 10.0 8.0 8.1 Total electricity cost (EB) Rs. 21,567,943 1,407,422 593,928
Diesel consumed L 6,169 1.193 732
Diesel cost Rs. 382,483 73,959 45,353 Cost of power (EB + Diesel)/m3 Rs./m3 101 52 54
Firewood used Kg 617,200 512,902 259,916
Firewood/m3 of reject kg/m3 64 77 88 Cost of fuel for evaporator Rs. 2,592,239 2,277,283 1,143,632
Total energy cost Rs. 6,099,095 3,756,618 1,833,784
Total energy cost vs. inflow Rs./m3 176 (USD 2.7) 132 (USD 2.0) 154 (USD 2.3)
Remark: Despite some variations, the price of firewood has been taken as Rs. 4.2/kg. Similarly, despite variations in Diesel prices during the year, its cost was calculated at Rs. 62/L as the yearly average; also, there are significant differences among plants in using Diesel as a source of energy.

12
Table 6. Comparison of energy consumption & cost, PST vs. ZLD stage (Reverse Osmosis + Evaporation), RANITEC, April 2015- March 2016
Item Unit PST ZLD Total Total vs. PST, %
1 2 3 (1+2) 4 (3/1)
Inflow m3/year 415,185
Electrical energy (EB) kWh/year 2,349,980 4,168,830 6,518,810 277%
Total electrical energy vs. inflow kWh/m3 5.7 10.0 15.7 277 %
Cost of electrical energy (EB) Rs./kWh 9.10
Cost of electrical energy (EB) Rs./year 21,384,818 37,936,353 59,321,171 277%
Cost of electrical energy (EB) vs. inflow Rs./m3 52 91 143 275%
Total electrical energy (EB) consumed in MJ MJ/year 8,459,928 15,007,788 23,467,716 277%
Consumption of Diesel fuel L/year 47,711 74,029 12,1740 255%
Diesel price Rs./L 62
Cost of Diesel Rs./year 2,958,082 4,589,798 7,547,880 255%
Consumption of fuel, Diesel in MJ MJ/year 1,860,729 2,887,131 4,747,860 255%
Consumption of firewood kg/year 7,406,396 7,406,396
Cost of firewood per kg Rs./kg 4.2 4.2
Total cost of firewood Rs./year 31,106,863 31,106,863
Total firewood consumption, MJ MJ/year 122,205,534 122,205,534
Overall energy consumption (EB+Diesel+ firewood) MJ/year 10,320,657 140,100,453 150,421,110 1457%
Total energy cost (EB+Diesel+ firewood) Rs./year 24,342,900 73,633,014 97,975,914 402%
Total energy in MJ vs. inflow MJ/m3 25 337 362 1457%
Total energy cost vs. inflow Rs./m3 59 177 236 ($ 3.6) 402%
Note: Minor discrepancies due to rounding up! The following table shows shares of the main components of energy consumption and costs.

13
Table 7. Energy consumption & cost comparisons, RANITEC, April 2015- March 2016
Item Rate %
Share of PST energy in Total energy consumed 7% Share of ZLD energy in Total energy consumed 93% Share of PST energy cost in Total energy cost 25%
Share of ZLD energy cost in Total energy cost 75%
Share of electrical energy in Total energy consumed, MJ 16%
Share of thermal (Diesel) energy in Total energy consumed. MJ 3%
Share of thermal (firewood) energy in Total energy consumed. MJ 81%
* including Diesel Values rounded up!
The impact of addition of the ZLD stage (RO + MEE) to the conventional treatment can be summarizedas follows: • The consumption of electrical energy went up nearly three times • The overall energy consumption (electrical and thermal) went up nearly 15 times • The cost of electrical energy, including its unit cost (Rs./m3 ) went up nearly three times • The total cost of energy (electrical and thermal) went up about 4.5 times • The share of ZLD energy in total energy consumed is about 93 % • The share of ZLD energy cost in total energy cost is about 78 %
Chemicals from the ZLD stage, O&M costs, salt residue
In addition to sodium chloride applied for preservation of hides and skins, chemicals used in the course of leather processing and usual chemicals used for during the primary treatment (lime, alum, polyelectrolytes), significant amounts of chemicals affecting the TDS content are added during tertiary treatment, water softening, RO and evaporation steps: hydrochloric acid, sodium metabisulphite, antiscalant, polyphosphates, caustic soda, sodium bicarbonate etc.
According to some local lab analysis, the salt residue produced contains, on dry basis, chlorides 54.10 %, sodium 35.03 %, calcium 0.86 %, magnesium 0.30 %, sulphates 1.45 %, silica 1.30 % etc. The moisture is about 11 % and loss on ignition (organic matter) about 5%. The reported, indicative O&M cost for the year 2015/2016 are between USD 6.9 – 8.7/m3, part of it assumingly offset by saving the cost of fresh water of about USD 1.4/m3. In absence of reliable data about raw material input, yields etc. it is not possible to relate the O & M cost to leather output, educated guesses put them from about Rs. 20/m2 (RANITEC), Rs. 23/m2 (SIDCO) to Rs. 40/m2 (VISHTEC), corresponding to USD 0.30, USD 0.35 and USD 0.60 per square metre.
The salt residue represents a very serious environmental challenge, quantities generated are impressive. Only in year 2015/2016, the RANITEC plant has produced 5043 tonnes, VISHTEC 1818 tonnes and SIDCO 1591 tonnes. Unfortunately, currently there are substantial differences between the theoretical values for the RO + Evaporation stage and the actual outputs of salt residue at three plants considered.

14
Table 8. Apparent gaps in TDS balance at RO stage, tonnes per year
Item Unit RANITEC VISHTEC SIDCO*
RO feed m3/year 411,652 143,753 254,955
TDS in RO feed mg/L 17,830 17,920 9,160
TDS in RO Feed t/year 7,340 2,576 2,335
Permeate m3/year 296,331 108,315 194,113
TDS in permeate mg/L 860 465 388
TDS in permeate t/year 255 50 75
Reject m3/year 115,321 35,438 60,842
TDS in Reject mg/L 39,210 39,420 36,100
TDS in Reject t/year 4,522 1,397 2,196
TDS in permeate + TDS in Reject t/year 4,777 1,447 2,271
Difference: TDS in RO Feed – (TDS in permeate + TDS in Reject) t/year 2,563 1,129 64
Difference % 35 % 44 % 3 %
*actually for nine months only
There are views and computations suggesting substantially lower figures. According to them, the unaccounted loss at RANITEC is 4.65 %, at SIDCO 3.72 % and only 0.15 % at VISHTEC. However, some logic and estimates in those computations such as the share of Volatile portion of salt lost in evaporation or in transportation and some other are very questionable. Obviously, the complexity of the issue requires extensive, independent monitoring and analysis over at least one year.
Carbon footprint - the impact of ZLD stage on CO2 emissions
Values used for computations: • Average CO2 emissions for electricity production in India: 0.9.kg CO2/kWh (2012)6 • Calorific value of Diesel used by DG: 39 MJ/L • CO2 emissions from Diesel: 74.1 kg CO2/GJ of thermal energy7 • CO2 emission/L of Diesel: (39 x 74,1)/1000 = 2.9 kg CO2/L of Diesel • Calorific value of firewood used by evaporation boilers: 16.5 MJ/kg • CO2 emissions from firewood burning: 109.6 kg CO2/GJ of thermal energy8 • CO2 emission/kg of firewood: (16.5 x 109.6)/1000 = 1.8 kg CO2/kg of firewood • COD of effluent before biological treatment: 2490 mg O2/L • COD of effluent after secondary clarifier: 260 mg O2/L • COD degraded during biological treatment: (2490 – 260)=2230 mg O2/L • Estimated COD : TOC ratio: 3 : 1 • CO2 : TOC ratio: 3.67 : 1
6 www.iea.org/statistics/statisticssearch 7 www.volker-quashning 8 www.volker-quashning

15
Table 9. Leather production, flow, electrical energy & firewood consumption at the CETP+ ZLD plant RANITEC, 2015-2016:
Item Unit CETP ZLD Total CETP & ZLD
Total estimated leather produced sq.ft 96,353,038 Total estimated leather produced m2 8,951,486 Flow m3/year 415,185 Consumption of electrical energy (EB) kWh/year 2,349,980 4,168,830 6,518,810 Consumption of Diesel L/year 47,711 74,029 12,1740 Consumption of firewood kg/year 7,406,396 7,406,396 Based on above values and data it is possible to derive figures for the CF pertaining to the RANITEC plant and relate them to the estimated leather output. Table 10. CO2 emissions from the CETP + ZLD plant RANITEC, March 2015 – April 2016
Item Unit CETP ZLD Total CETP & ZLD
Total estimated leather produced sq.ft 96,353,038
Total estimated leather produced m2 8,951,486 Flow m3/year 415,859 Consumption of electrical energy (EB) kWh/year 2,349,980 4,168,830 6,518,810 Consumption of Diesel L/year 47,711 74,029 121,740 Consumption of firewood kg/year 7,406,396 7,406,396 COD removed kg/year 927,366 - - TOC removed during biological treatment kg/year 309,122 - - CO2 emissions from consumption of electrical energy (EB) kg/year 2,114,982 3,751,947 5,866,929
CO2 emissions from Diesel kg/year 138,362 214,684 353,046 CO2 emissions from biological treatment kg/year 1,134,478 1,134,478 CO2 emissions from firewood for MEE boiler kg/year - 13,331,513 13,331,513
Total CO2e emissions, year kg/year 3,387,822 17,298,144 20,685,966
Total CO2e emissions, year tonnes/year 3,388 17,298 20,686
Total CO2e emissions, % % 16 84 100
CO2e est. emission vs. leather production kg/sq.ft 0.04 0.18 0.22 Note: The figures about CO2 emissions include neither leather processing nor sludge disposal, they pertain only to conventional effluent treatment (CETP) and RO and evaporation stage (ZLD) albeit without disposal of residual salt. In summary, the ZLD stage has increased the CO2e emissions of the RANITEC plant by about six times.

16
Figure 5. Shares of CETP & ZLD stages in the total CO2 emissions, RANITEC, 2015-16
Conclusions
The dramatic situation with water and soil pollution along the Palar River together with public and buyers’ pressure eventually prompted the TNPCB to enforce the discharge limit for Dissolved solids (inorganic) of 2100 mg/L; apparently, the ZLD system was imposed as the only approach to supplement the conventional treatment. Reportedly, this has resulted in water consumption close to the theoretical minimum (12 m3/tonne) and substantial underutilization of CETP & ZLD plants. A very strong opposing view is that i) the tanners from the area already had a long experience in economizing with water ii) rather complex water saving and float recycling system is required to achieve such low level iii) the necessary technology modifications take time and that iv) a close, independent scrutiny is needed to verify this claim. The average yearly flow rates along the treatment line in three ZLD plants considered are: RO feed vs. inflow from 99 - 101 % RO permeate vs. RO feed 72 – 76 % RO reject vs. RO feed 24 – 28 % Total recovered water vs. inflow 97 – 102 %
It means that various water additions virtually offset all losses and the volume of recovered (reusable) water coincides with the CETP inflow.
16%
84% CO2 emissions from the CETP
CO2 emissions from the ZLD

17
Figure 6. The energy impact of the ZLD stage in relation to the conventional treatment The consumption and costs of electrical energy went up nearly 3x
The overall energy consumption (electrical and thermal) went up nearly 15x
The total cost of energy (electrical and thermal) went up about 4x
CO2 emissions rise approximately 6x
Legend PST RO + MEE
The reported, indicative O&M cost for the year 2015/2016 are between USD 6.9 – 8.7/m3, part of it assumingly offset by saving the cost of fresh water of about USD 1.4/m3. The salt residue produced poses a very serious environmental challenge; in 2015/2016 it was 5043 t (RANITEC), 1816 t (VISHTEC) and 1591 t (SIDCO). Unfortunately, there are substantial differences between the theoretical values and the actual outputs; large quantities are “missing” without convincing explanation. Computing average CO2 emissions for electricity production in India, calorific value of firewood used by evaporation boilers, CO2 emissions/kg of firewood, COD degraded during biological treatment, estimated COD/TOC ratio and CO2/TOC ratio, it works out that the ZLD stage has increased the CO2e emissions at RANITEC by more than six times. There is no doubt that industrial scale ZLD in treatment of tannery effluents is technically feasible, advanced technologies applied impressive, recycling of the purified water is both logical and practical. However, the system is not robust and a viable solution for reutilization and/or safe disposal of solid residue is not in sight; moreover, within about three years O & M cost may exceed the installation cost. It is quite late but possibly not too late to thoroughly (re)consider potential alternatives, a combination of short- and long-term options such as construction of proper sewage systems & WWTW in the townships in the Vellore District allowing mixing of treated tannery effluents with urban waste water9, simultaneous strong support to organized slaughter of some
9 It seems that the CETP plant at the Pallavaram cluster near Chennai is already benefitting from the existence of the municipal wastewater works (WWW); reportedly, it is permitted to skip the evaporation stage.
65% 35%
93% 7%
75% 25%
84% 16%

18
livestock (buffaloes, goats/sheep) and salt-free preservation, concentration of wet blueing works etc. Finally, further work by a multidisciplinary ground team is needed to closer study issues such as detailed water mass balance, the exact impact of chemicals added and changes in the TDS composition along the process, optimization of auxiliary processes (ultrafiltration, water softening), possibly establish a more rigorous data recording etc.

19
References
Selected UNIDO documents 1. Bosnić M, Rajamani S, Sahasranaman A, Ultrafiltration application in tannery waste water
treatment, 1998 2. Bosnić M, Multiple stage evaporation system to recover salt from tannery effluent, 1998 3. Buljan J, Bosnić M, Sahasranaman A, Comparative evaluation of environmental priorities and
treatment costs in the tanning sector in industrialized and developing countries, Parallels: France – Italy – India, 2002
4. Buljan J, Costs of tannery waste treatment, 2005 5. Buljan J, Introduction to treatment of tannery effluents, 2011 6. Buljan J, Král I, Bosnić M, Daniels R, Pollutants in tannery effluents - Sources, description,
environmental impact, 2013 (Revised edition) 7. Emmanuel KV et al, Operation of pilot Reverse Osmosis (RO) unit at ATH Leder Fabrik,
Melvisharam, India, 2001 8. Sampathkumar S et al, Management of Total Dissolved Solids (TDS) in tannery effluent, 2000 9. Sampathkumar S, Viswanathan M, Desalting of raw hides/skins and reuse of dusted salt in
pickling operation, 2002
Other sources 10. Buljan J, Some considerations about the problem of salinity of tannery effluents, LGR Tagung
2004 11. Emmanuel KV, ILIFO & Personal communications, 2016 12. Money C.A. (1999), Clean technology challenges, Science and technology for leather into the next
millennium, Tata McGraw Hill Publishing Company, New Delhi, pp. 284-294. 13. Pfisterer H, Energieeinsatz in der Lederindustrie, Bibliothek des Leders, Band 9,1986 14. Subramanian S, et al. Green Solution for Salinity in Tannery Waste water: A Step Forward in
Leather Processing, JALCA 109, July 2014 15. Ranipet Tannery Effluent Treatment Co. Ltd., RANITEC brochure 2105, www.RANITEC.com 16. Performance evaluation/adequacy assessment of Pertec CETP, Indian Leather Industry
Foundation (ILIFO), August 2015 17. Performance evaluation/adequacy assessment of Amburtec Thuthipet CETP, Indian Leather
Industry Foundation (ILIFO), August 2015 18. Poncet T, et al., Eco-Design: Life Cycle analyses show that energy is a key factor for the
environmental impact of leather and might save money, IULTCS Congress, 2011 19. Rao JR at al. A Polymer-Based Preservation, www.aaqtic.org.ar/congresos/china2009 20. Ramos M A, Development of an alternative low salt hide preservation using dehydrating agent
(PEG), sanitizer and crude glycerol, ALCA Convention 2014 21. JALCA, several issues of the ezine version 22. World Leather, several issues 23. Various open sources (Wikipedia, etc.), http://www.physchem.co.za/Heat/Latent.htm

20