Analysis of Florida’s Benchmark Streams for Establishing ... 2/105… · Streams for Establishing...
19
Analysis of Florida’s Benchmark Streams for Establishing Numeric Nutrient Criteria Erik B. Schilling National Council for Air and Stream Improvement, Inc. Southern Regional Center Newberry, FL & M. Cohen, D. McLaughlin and J. Diamond University of Florida School of Forest Resources and Conservation Gainesville, FL
Transcript of Analysis of Florida’s Benchmark Streams for Establishing ... 2/105… · Streams for Establishing...
Analysis of Florida’s Benchmark Streams for Establishing Numeric
Nutrient CriteriaErik B. Schilling
National Council for Air and Stream Improvement, Inc.Southern Regional Center
Newberry, FL&
M. Cohen, D. McLaughlin and J. DiamondUniversity of Florida
School of Forest Resources and Conservation Gainesville, FL

Project Goals
• Enhance the analysis of FL ‘benchmark streams’ for stream nutrient criteria development to include:– Role of stream flow (which is currently not explicitly part
of the numeric standards) – Conduct a new data synthesis to better understand controls
on stream DO dynamics• Conduct a paired watershed monitoring to test FL
fertilization BMPs – Pre-fertilizer treatment baseline flow– WQ sampling using deployable sensors and discrete water
sampling
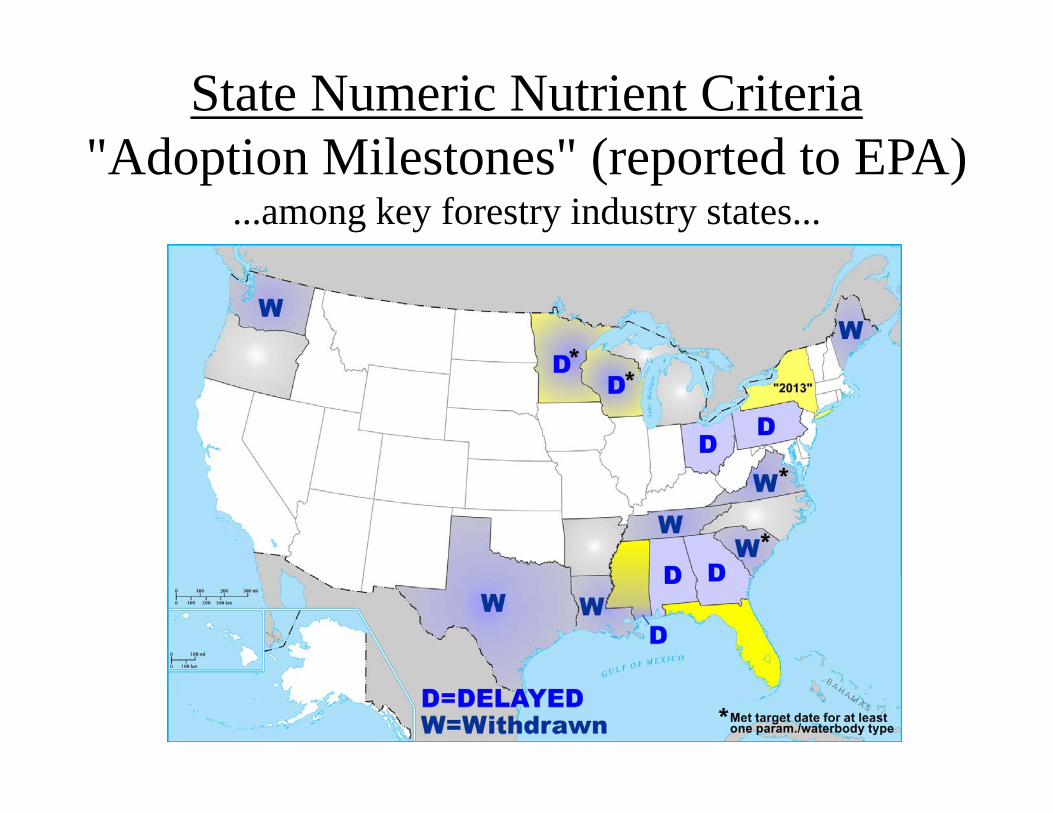
State Numeric Nutrient Criteria"Adoption Milestones" (reported to EPA)
...among key forestry industry states...
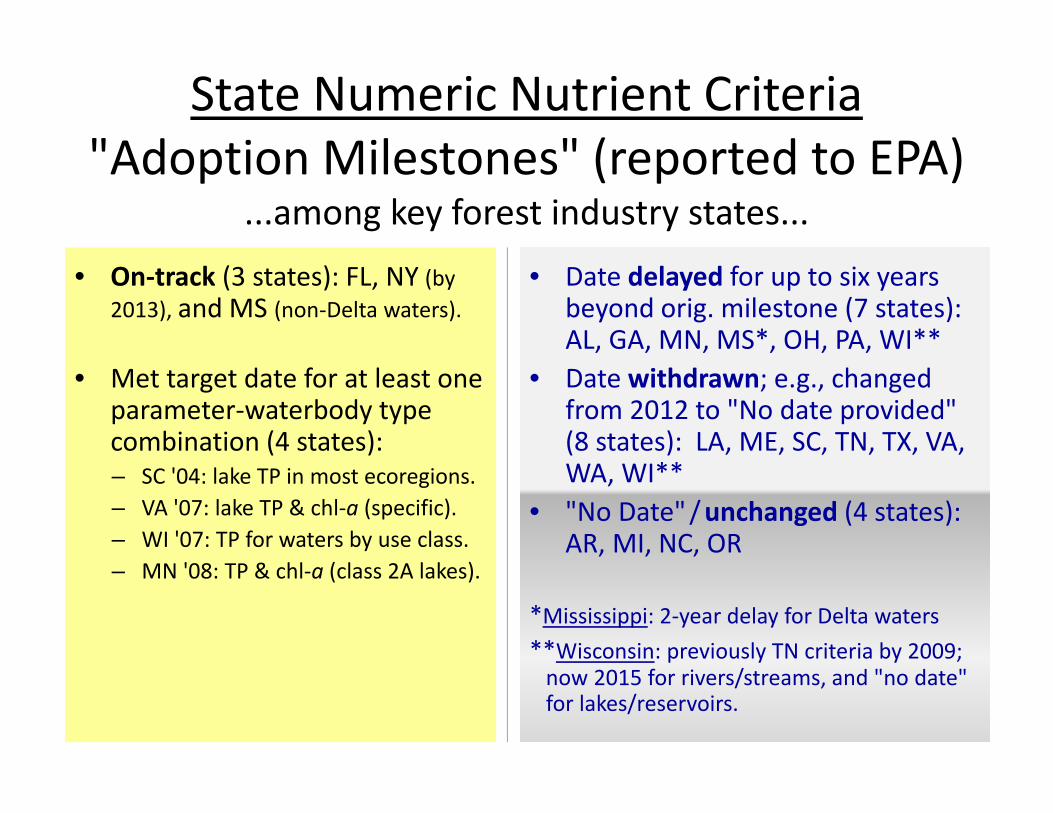
State Numeric Nutrient Criteria"Adoption Milestones" (reported to EPA)
...among key forest industry states...
• Date delayed for up to six years beyond orig. milestone (7 states): AL, GA, MN, MS*, OH, PA, WI**
• Date withdrawn; e.g., changed from 2012 to "No date provided" (8 states): LA, ME, SC, TN, TX, VA, WA, WI**
• "No Date"/unchanged (4 states): AR, MI, NC, OR
*Mississippi: 2‐year delay for Delta waters**Wisconsin: previously TN criteria by 2009;now 2015 for rivers/streams, and "no date"for lakes/reservoirs.
• On‐track (3 states): FL, NY (by 2013), and MS (non‐Delta waters).
• Met target date for at least one parameter‐waterbody type combination (4 states):– SC '04: lake TP in most ecoregions.– VA '07: lake TP & chl‐a (specific).– WI '07: TP for waters by use class.– MN '08: TP & chl‐a (class 2A lakes).
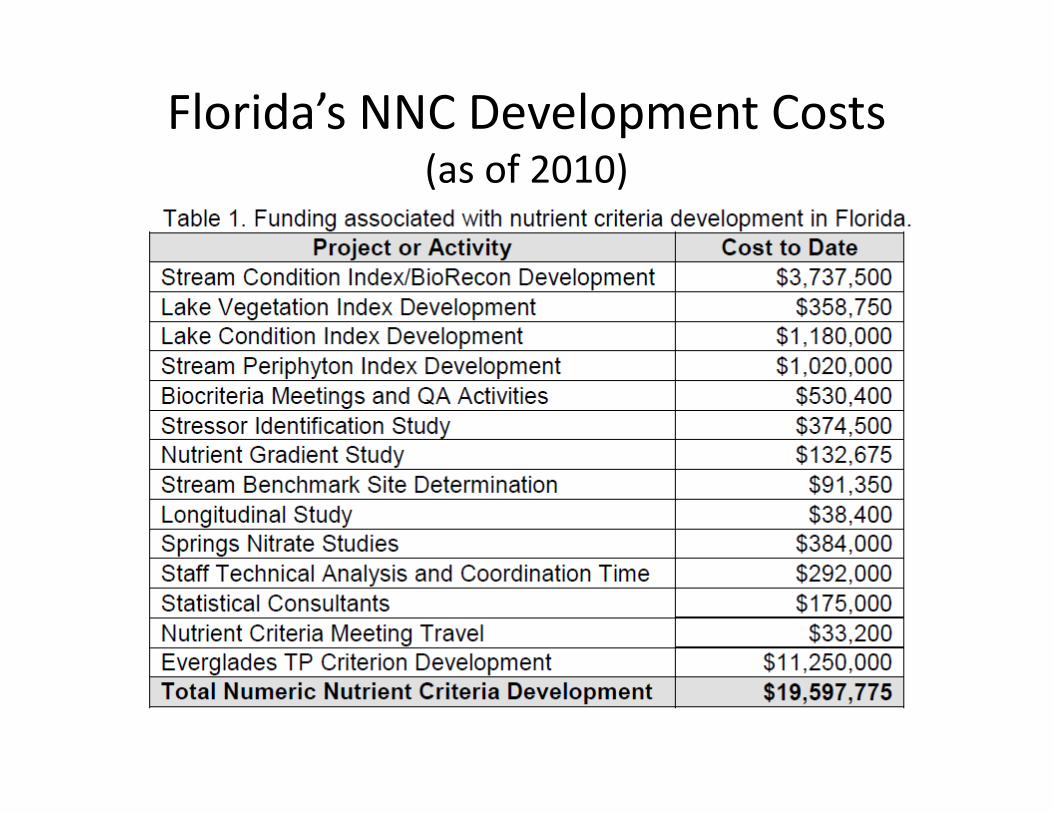
Florida’s NNC Development Costs(as of 2010)

Florida’s Proposed Numeric Nutrient Criteria
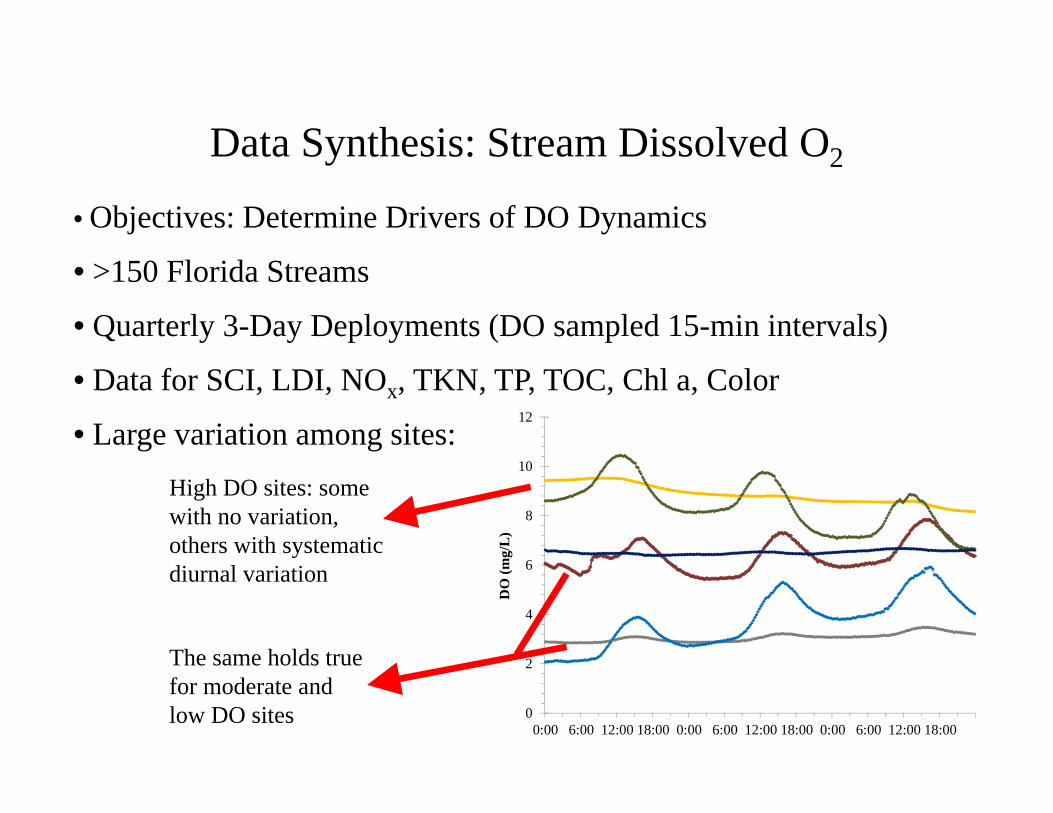
Data Synthesis: Stream Dissolved O2
• Objectives: Determine Drivers of DO Dynamics
• >150 Florida Streams
• Quarterly 3-Day Deployments (DO sampled 15-min intervals)
• Data for SCI, LDI, NOx, TKN, TP, TOC, Chl a, Color
• Large variation among sites:High DO sites: some with no variation, others with systematic diurnal variation
The same holds true for moderate and low DO sites 0
2
4
6
8
10
12
0:00 6:00 12:00 18:00 0:00 6:00 12:00 18:00 0:00 6:00 12:00 18:00
DO
(mg/
L)
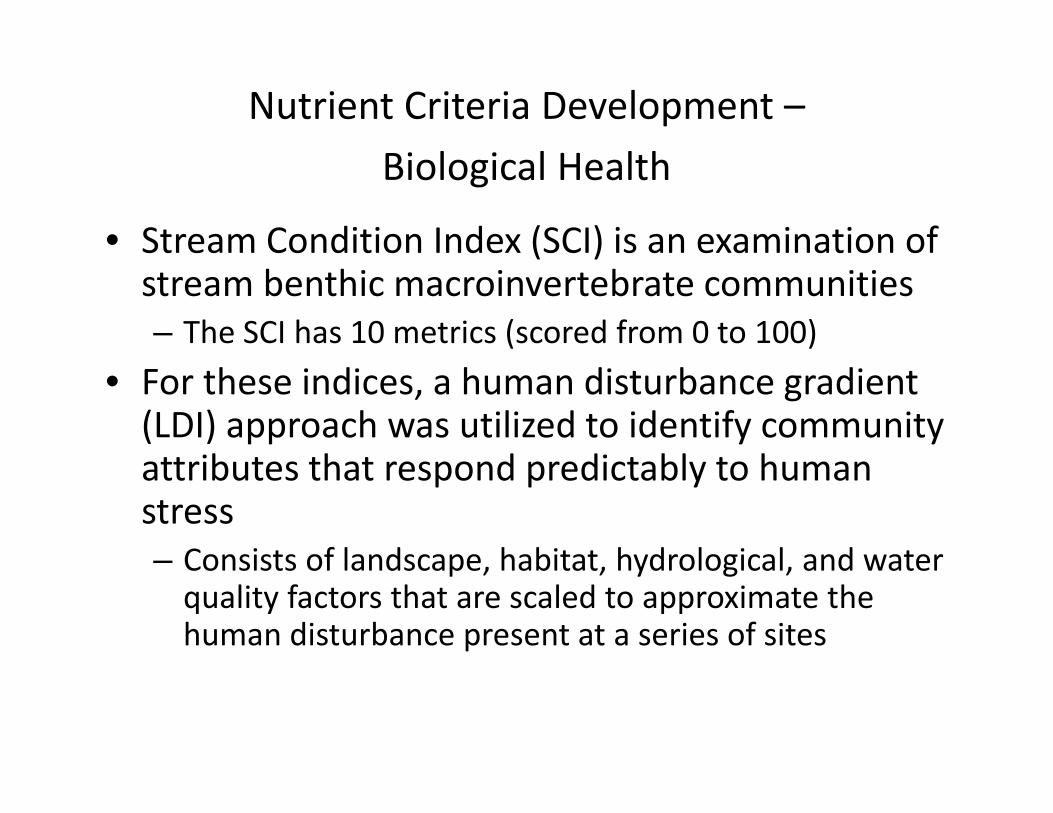
Nutrient Criteria Development –Biological Health
• Stream Condition Index (SCI) is an examination of stream benthic macroinvertebrate communities– The SCI has 10 metrics (scored from 0 to 100)
• For these indices, a human disturbance gradient (LDI) approach was utilized to identify community attributes that respond predictably to human stress – Consists of landscape, habitat, hydrological, and water quality factors that are scaled to approximate the human disturbance present at a series of sites
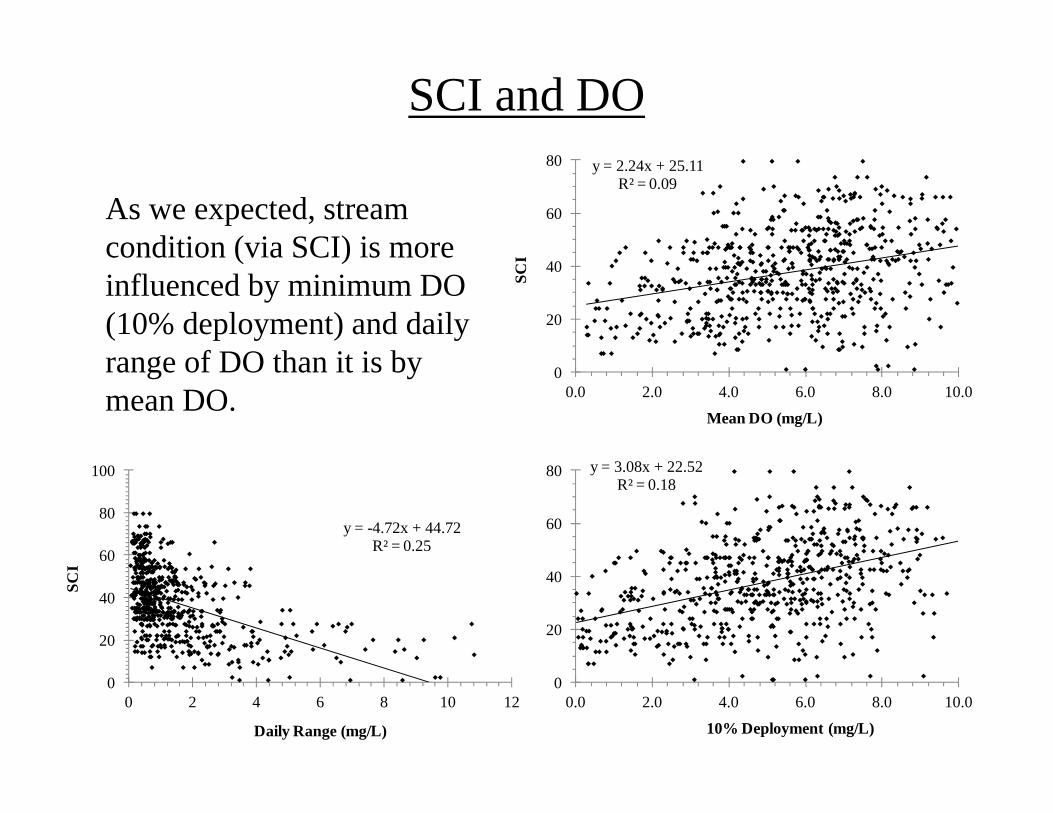
SCI and DOy = 2.24x + 25.11
R² = 0.09
0
20
40
60
80
0.0 2.0 4.0 6.0 8.0 10.0
SCI
Mean DO (mg/L)
y = 3.08x + 22.52R² = 0.18
0
20
40
60
80
0.0 2.0 4.0 6.0 8.0 10.0
SCI
10% Deployment (mg/L)
As we expected, stream condition (via SCI) is more influenced by minimum DO (10% deployment) and daily range of DO than it is by mean DO.
y = -4.72x + 44.72R² = 0.25
0
20
40
60
80
100
0 2 4 6 8 10 12
SCI
Daily Range (mg/L)

However, limited (if any) effects of nutrients on DO (Minimum and DO Daily Range)
y = -0.88x + 5.03R² = 0.01
0.0
2.0
4.0
6.0
8.0
10.0
0.00 0.50 1.00 1.50 2.00 2.50 3.00
10%
Dep
loym
ent (
mg/
L)
TP (mg/L)
y = 1.03x + 4.74R² = 0.02
0.0
2.0
4.0
6.0
8.0
10.0
0.00 0.50 1.00 1.50 2.00
10%
Dep
loym
ent (
mg/
L)
NOx (mg/L)
y = -0.11x + 1.51R² = 0.00
0
2
4
6
8
10
0.00 0.50 1.00 1.50
Dai
ly R
ange
(mg/
L)
NOx (mg/L)
y = 0.99x + 1.36R² = 0.01
0
2
4
6
8
10
0.00 0.20 0.40 0.60 0.80 1.00
Dai
ly R
ange
(mg/
L)
TP (mg/L)
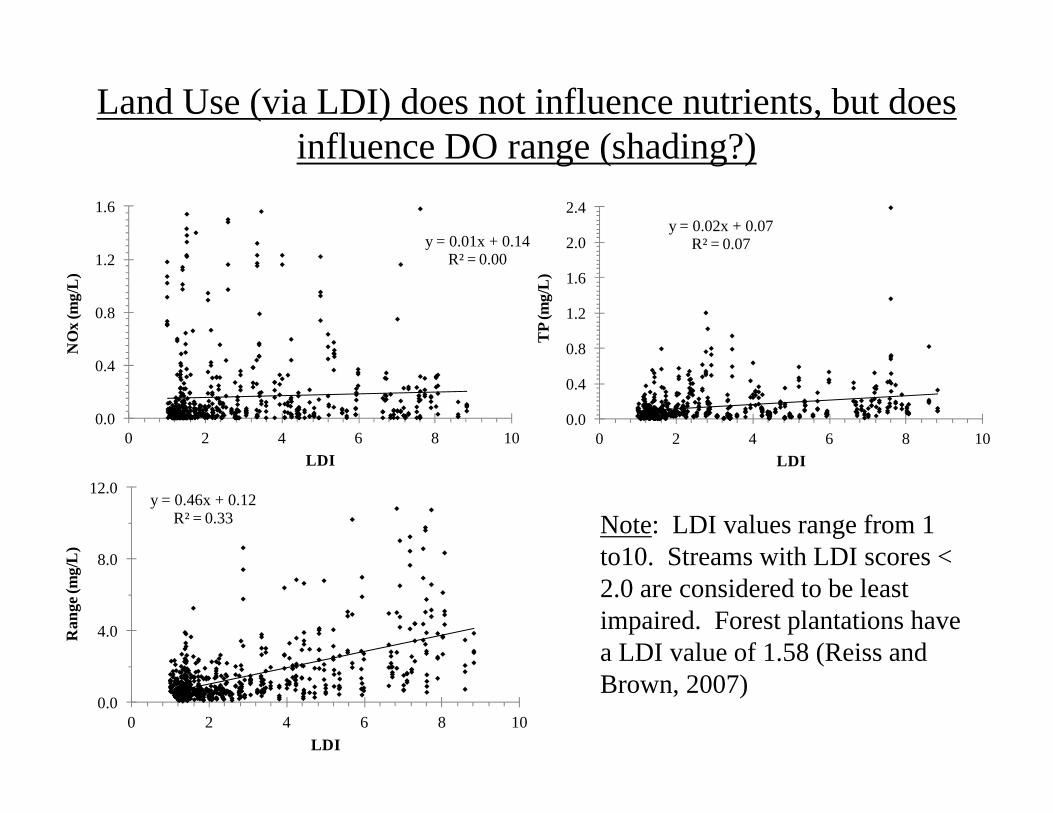
Land Use (via LDI) does not influence nutrients, but does influence DO range (shading?)
y = 0.46x + 0.12R² = 0.33
0.0
4.0
8.0
12.0
0 2 4 6 8 10
Ran
ge (m
g/L
)
LDI
y = 0.02x + 0.07R² = 0.07
0.0
0.4
0.8
1.2
1.6
2.0
2.4
0 2 4 6 8 10
TP
(mg/
L)
LDI
y = 0.01x + 0.14R² = 0.00
0.0
0.4
0.8
1.2
1.6
0 2 4 6 8 10
NO
x (m
g/L
)
LDI
Note: LDI values range from 1 to10. Streams with LDI scores < 2.0 are considered to be least impaired. Forest plantations have a LDI value of 1.58 (Reiss and Brown, 2007)
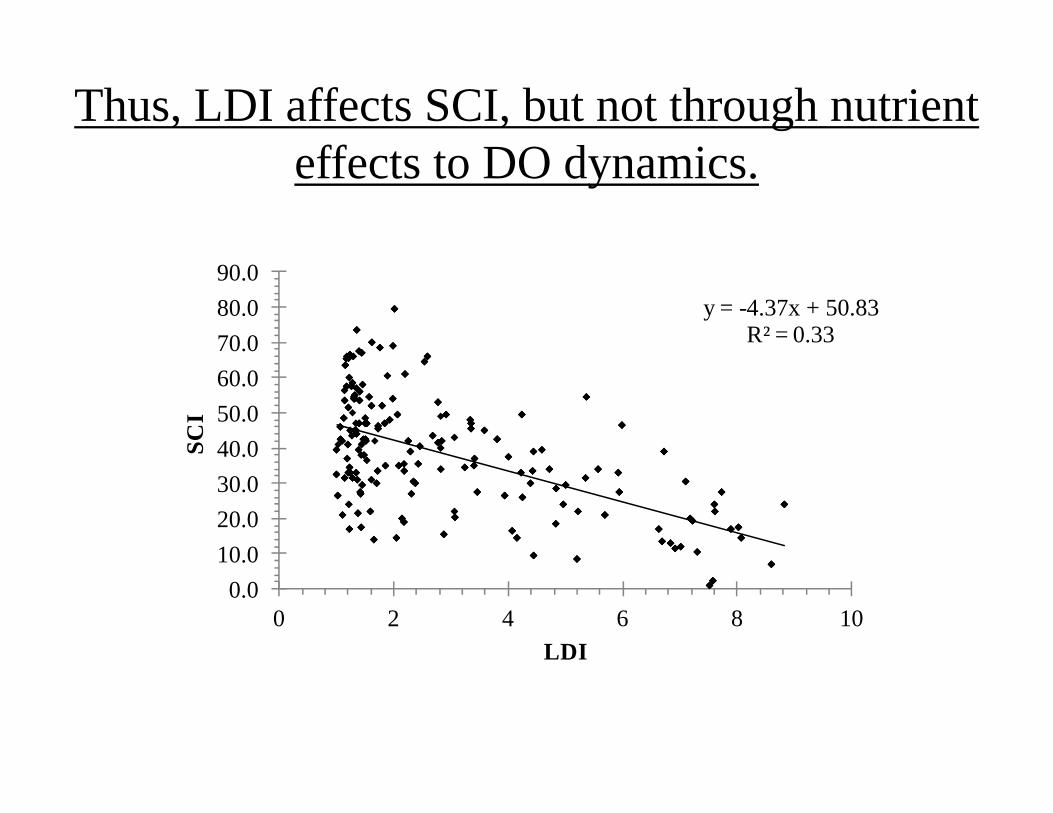
Thus, LDI affects SCI, but not through nutrient effects to DO dynamics.
y = -4.37x + 50.83R² = 0.33
0.010.020.030.040.050.060.070.080.090.0
0 2 4 6 8 10
SCI
LDI

Initial Conclusions
• DO dynamics of FL’s benchmark streams are influenced by climate, riparian vegetation, geomorphology, etc.– Streams can naturally have low DO regimes
• Continuing analyses to investigate the natural drivers of DO dynamics– Should be considered when relating nutrients to
DO dynamics and ultimately stream health

FL Fertilization BMP Effectiveness Study Watersheds

Simms Creek Watershed
Santa Fe Drain
Watersheds range between 5,500 to 7,500 ac. Plantations
make up >60% of the total area; wetlands comprise >30%.
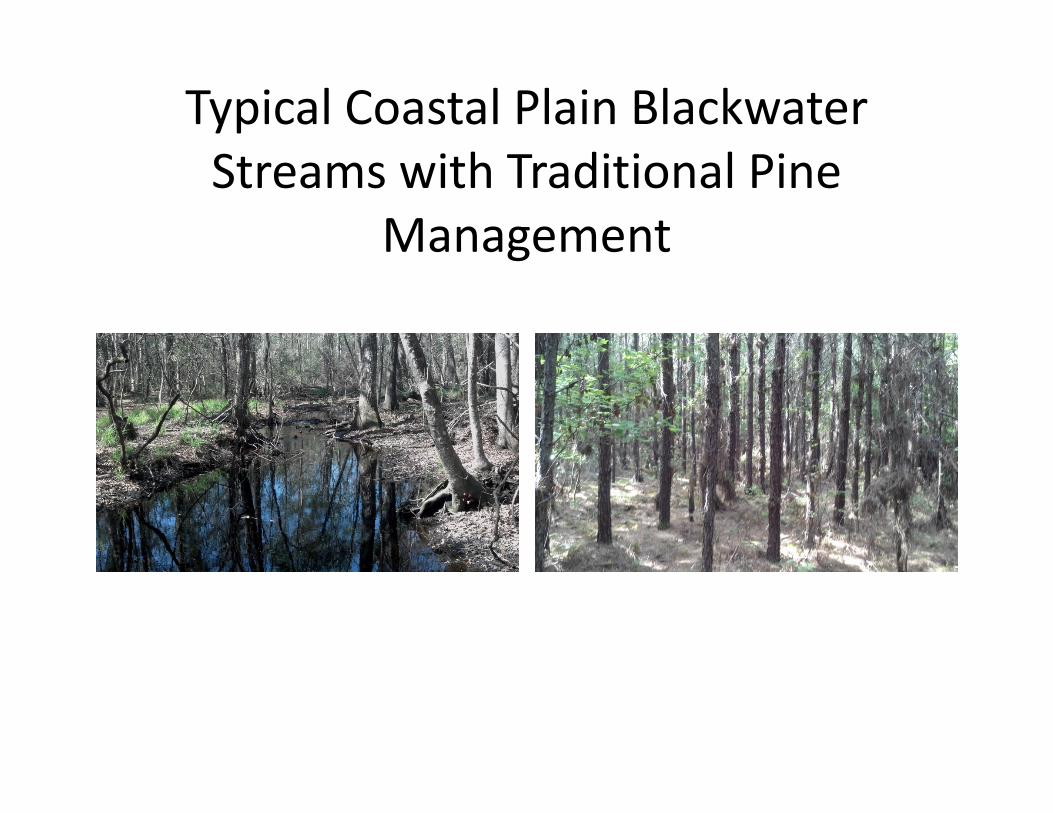
Typical Coastal Plain BlackwaterStreams with Traditional Pine
Management
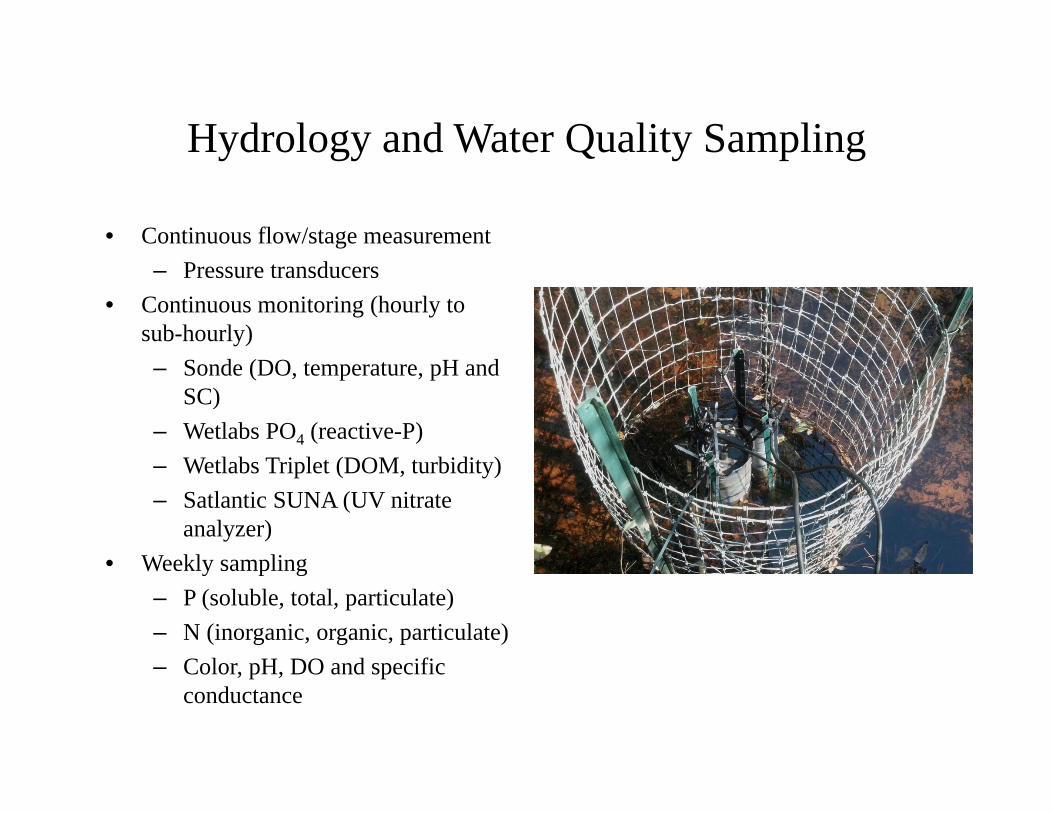
Hydrology and Water Quality Sampling
• Continuous flow/stage measurement– Pressure transducers
• Continuous monitoring (hourly to sub-hourly)– Sonde (DO, temperature, pH and
SC) – Wetlabs PO4 (reactive-P) – Wetlabs Triplet (DOM, turbidity)– Satlantic SUNA (UV nitrate
analyzer)• Weekly sampling
– P (soluble, total, particulate)– N (inorganic, organic, particulate)– Color, pH, DO and specific
conductance
0
0.02
0.04
0.06
0.08
10
15
20
25
1/18/13 12:00 1/19/13 12:00 1/20/13 12:00 1/21/13 12:00 1/22/13 12:00
Nitrate (ppm
)
Ort
ho-P
O4
(ppb
), Te
mpe
ratu
re (C
)
Ortho-PO4 (ppb)Temp (C)Nitrate (ppm)
50
55
60
65
70
75
80
170
174
178
182
186
190
Dissolved O
xygen (% sat)
CD
OM
(ppb
)
CDOM (ppb)DO (% sat)
0.000
0.005
0.010
0.015
0.020
0.025
0.30
0.31
0.32
0.33
0.34
0.35
0.36
0.37
0.38
0.39
0.40
1/18/13 12:00 1/19/13 12:00 1/20/13 12:00 1/21/13 12:00 1/22/13 12:00
Hydraulic G
radient (m)
Wat
er D
epth
(m)
Upstream Water DepthDownstream Water DepthHydraulic Gradient
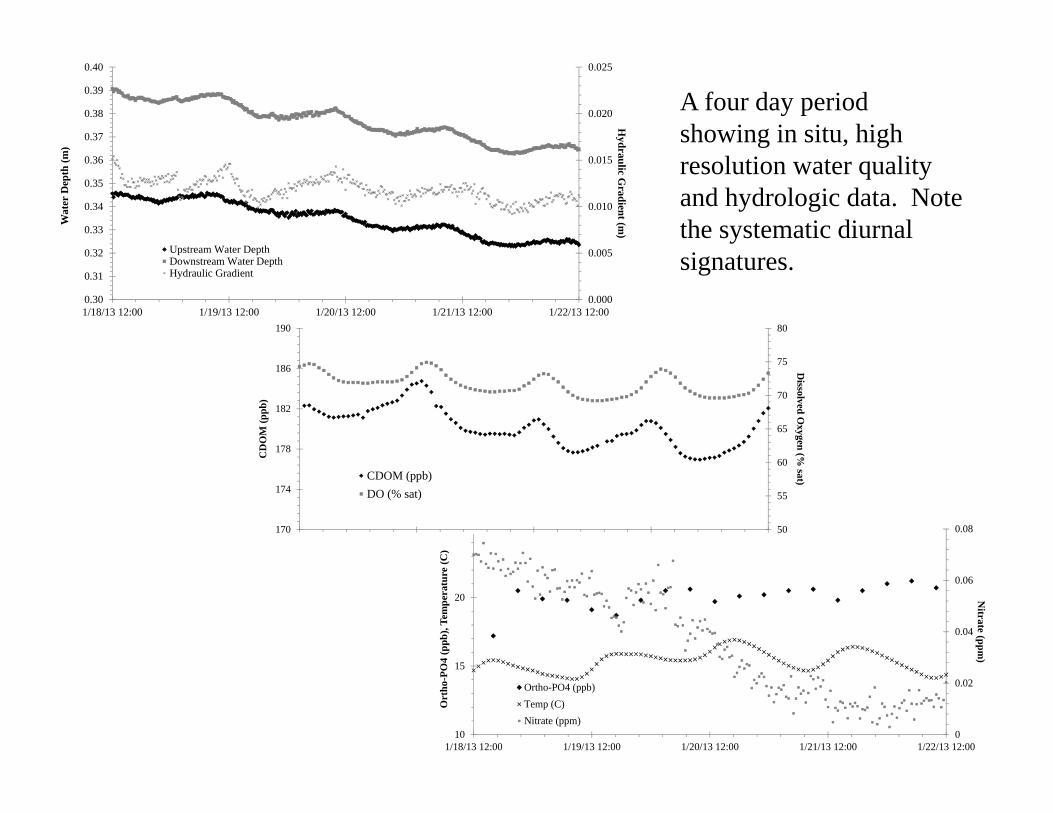
A four day period showing in situ, high resolution water quality and hydrologic data. Note the systematic diurnal signatures.
Questions?