Analysis of factors that impact on the consumer risk ... · markets for dairy products in the...
127
Copyright is owned by the Author of the thesis. Permission is given for a copy to be downloaded by an individual for the purpose of research and private study only. The thesis may not be reproduced elsewhere without the permission of the Author.
Transcript of Analysis of factors that impact on the consumer risk ... · markets for dairy products in the...

Copyright is owned by the Author of the thesis. Permission is given for a copy to be downloaded by an individual for the purpose of research and private study only. The thesis may not be reproduced elsewhere without the permission of the Author.
Analysis of Factors that Impact on the Consumer Risk
Perception of Dairy Product Safety in China
A thesis presented in partial fulfilment of the requirements of the
degree of Masters in Agricommerce
Massey University
Palmerston North
New Zealand
Fang Wang
2014
i
ABSTRACT
Food safety is an international challenge that is felt strongly in China. A series of foodborne
diseases and food fraud scandals around world have pushed concerns over food safety even
further. With its rapid social and economic transformation in past 60 years, China is shifting
its priority from food security to food safety. Melamine contaminated baby formula and
many other food safety incidents in China have shaken Chinese consumer confidence in the
food industry and even in regulatory institutions. China is one of the fastest growing
markets for dairy products in the world. To understand how Chinese consumers form their
perception of the safety of dairy products is critical for policy makers, regulatory institutions
and the dairy industry to communicate food safety information with the consumer and
establish food safety management with transparency and consistency.
The aim of this study was to explore and evaluate factors that influence the consumers‘ risk
perception of dairy product safety in Lanzhou, northwest of China. The literature review
helped to identify a set of factors that impact on the consumers’ perception of food safety.
A model of consumer risk perception in dairy food safety was developed to gain insight into
the underlying drivers of the consumer demand for food safety. The study helped gain an
understanding of how consumer social demographic information, reliance on extrinsic and
intrinsic attributes, trust in actors and regulators in the dairy industry, personal experience
and media use that impact on the risk perceptions of consumers.
A self-completion survey was used to collect the data and provide a big picture of consumer
risk perception in food safety in China. Factor analysis was used to refine the dependent
variables to produce a data set with less dimensions and more significant correlation, and
binary logistic regression analysis identified the three significant factors that influenced the

ii
consumers’ opinion relating to food safety. These were: family structure, reliance on third
party food safety assurance and reliance intrinsic attributes, listed in order of their
importance.
The results of this study contribute the perception of risk relating to dairy products in China.
The results will assist risk management and risk communication for policy makers and the
food industry to develop their strategies towards improving consumer confidence in food
safety.

iii
ACKNOWLEDGEMENTS
I would like to express my gratitude to my supervisory panel. I am very grateful to Professor
Steve Flint, Dr. Paul Perry and Associate Professor Blessing Maumbe for their invaluable
advice, enlighting thoughts and generous support throughout my masters study. I would like
to thank Mr. Encheng Chen and Mr. Shiwen Wang who worked on food safety for their PhD
study at Massey University for helping me in my study. I am grateful for the help from
Professor Nicola Shadbolt, project coordinator of Agricommerce. I would like to express
appreciation for the help and guidance Mr. Ross Davies offered me at beginning of my study.
He passed away in 2013. My thoughts are with him.
I wish to express my appreciation to the Ministry of Foreign Affairs and Trade of New
Zealand for the financial support through a New Zealand Development Scholarship. I would
like to thank my employer, Gansu Agricultural University for allowing me to take this long
study leave to pursue my Masters study in Agricommerce in New Zealand. In particular, I
would like to show my gratitude to Professor Gaobao Huang, former Chancellor of Gansu
Agricultural University. He provided continuous support during my study. Thanks also go to
the staff of International Student Support Office, Massey University (Ms. Sylvia Hooker, Mr.
Jamie Hooper and Ms. Leuaina Vaai-Hatier) for their kind support. I am grateful to Mrs.
Denise Stewart, Mrs. Kathy Hamilton for their hard work and kind help.
My deepest appreciation goes to my parents Thanks go to my family Bo Chen and Weiping
Wang for their help. I wish to thank Mr. Raymond Behm, for his support and
encouragement. I would like to thank my officemates Ms. Agneta Ghose, Ms.Briana Nelson
and Mr. Renzo Cuadros for sharing the pleasure and pain of my study. Thanks go to my
friends in New Zealand, Ms. Lynn Chen, Ms. Ruimin Jia, Ms. Thi Lan Anh Nguyen, Ms. Sayaki
Hiroki, Mr.Yuanheng Zheng and Mr.Aniketh HR. Their friendship and support made my life
and study so much more enjoyable and meaningful.

iv
Table of Content
ABSTRACT ................................................................................................................................... i
ACKNOWLEDGEMENTS ............................................................................................................ iii
ABBREVIATIONS ..................................................................................................................... viii
LIST OF FIGURES ....................................................................................................................... ix
LISTS OF TABLES......................................................................................................................... x
Introduction............................................................................................................ 1 CHAPTER 1
1.1 Global food safety challenges ............................................................................................. 1
1.2 Factors contributing to global food safety ........................................................................... 2
1.3 Food safety situation in China ............................................................................................. 4
1.3.1 Food safety supervision at the central government level ................................................ 6
1.3.2 Food safety supervision at local government level.......................................................... 8
1.4 Background information on the dairy market in China ......................................................... 9
1.4.1 Demand for dairy in China ............................................................................................ 9
1.4.2 Supply of dairy products in China ................................................................................ 11
1.5 Melamine contamination scandal ..................................................................................... 13
1.6 Problem statement and rationale for study ....................................................................... 16
1.7 Study aims and objectives................................................................................................. 18
1.7.1 Aim of the study ......................................................................................................... 18
1.7.2 Specific objectives ...................................................................................................... 18
1.8 Structure of the thesis ...................................................................................................... 18
Literature Review ................................................................................................. 20 CHAPTER 2
2.1 Introduction ..................................................................................................................... 20
v
2.2 Risk .................................................................................................................................. 20
2.2.1 What is risk ................................................................................................................ 20
2.3 Research approach of risk ................................................................................................. 21
2.4 Factors impacting risk perception ..................................................................................... 23
2.4.1 Socio-demographic factors.......................................................................................... 23
2.4.2 Information sources ................................................................................................... 25
2.4.3 Trust in the actors of the food chain and regulatory institutions.................................... 27
2.4.4 Food safety incident and media coverage of food risks ................................................. 29
2.4.5 Summary ................................................................................................................... 30
2.5 Research objectives .......................................................................................................... 32
2.6 Hypotheses Development ................................................................................................. 34
2.6.1 Hypotheses related to social-demographic factors ....................................................... 34
2.6.2 Hypotheses related to the source of information ......................................................... 35
2.6.3 Hypotheses related to the trust in actors in the food supply chain ................................ 35
2.6.4 Hypotheses related to experience with food safety incidents and media coverage ......... 35
Research Methodology ........................................................................................ 36 CHAPTER 3
3.1 Introduction ..................................................................................................................... 36
3.2 Research method ............................................................................................................. 36
3.2.1 Research instrument .................................................................................................. 36
3.2.2 Target population, research location sampling method ................................................ 37
3.2.3 Questionnaire development ....................................................................................... 38
3.2.4 Questionnaire format ................................................................................................. 40
3.2.5 Pre-testing procedure................................................................................................. 41
3.2.6 Survey administration................................................................................................. 41
3.3 Data analysis .................................................................................................................... 42
3.3.1 Frequencies ............................................................................................................... 42

vi
3.3.2 Cross-tabulations/correlation...................................................................................... 42
3.3.3 Factor analysis ........................................................................................................... 43
3.3.4 Binary logistic regression ............................................................................................ 43
3.4 Research ethics ................................................................................................................ 44
3.5 Research limitations ......................................................................................................... 45
Data Analysis ........................................................................................................ 46 CHAPTER 4
4.1 Introduction ..................................................................................................................... 46
4.1.1 Descriptive statistics ................................................................................................... 46
4.1.2 Overview of consumer risk perception of food safety in general food and dairy products47
4.2 Cross tabulation /correlation and association.................................................................... 54
4.2.1 The impact of social-demographic characteristics......................................................... 55
4.2.2 The impact of the extrinsic and intrinsic attributes of dairy products ............................. 57
4.2.3 The impact of trust in actors and regulators in the dairy industry .................................. 58
4.2.4 The impact of media exposure, direct experience and recall of food safety incidents ..... 60
4.2.5 Summary ................................................................................................................... 61
4.3 Factor analysis.................................................................................................................. 63
4.3.1 Factor interpretation .................................................................................................. 64
4.3.2 Factor analysis of demographic information and dependent variable ............................ 64
4.3.3 Factor analysis of intrinsic and extrinsic attributes and dependent variables .................. 65
4.3.4 Factor analysis of stakeholders in the dairy industry and dependent variable................. 66
4.3.5 Media exposure, personal experience and recall of incidents and dependent variable .. 67
4.3.6 Summary ................................................................................................................... 68
4.4 Results from the binary logistic regression ........................................................................ 70
Discussion ............................................................................................................. 75 CHAPTER 5
5.1 Introduction ..................................................................................................................... 75
vii
5.2 Summary of results........................................................................................................... 75
5.3 Discussion and interpretation ........................................................................................... 85
5.3.1 Hypotheses related to social demographic information ................................................ 85
5.3.2 Hypotheses related to extrinsic and intrinsic attributes ................................................ 87
5.3.3 Hypotheses related to trust in the control of stakeholders in the dairy industry ............. 88
5.3.4 Hypotheses related to media exposure, personal direct experience with unsafe food and
recall of food safety incidents in the past 6 months .............................................................. 89
5.4 Implications and contributions.......................................................................................... 92
5.4.1 Theoretical implications.............................................................................................. 92
5.4.2 Social contributions .................................................................................................... 92
5.5 Limitations and future research ........................................................................................ 93
5.5.1 Limitations of this study.............................................................................................. 93
5.5.2 Future research .......................................................................................................... 94
5.6 Conclusion........................................................................................................................ 94
REFERENCES ............................................................................................................................. 95
viii
ABBREVIATIONS
MOH Ministry of Health
MOA Ministry of Agriculture
AQSIQ Administration of Quality Supervision, Inspection and Quarantine
Department
IAC Industry and Commerce Department
SFDA State Food and Drug Administration Department
HACCP Hazard Analysis and Critical Control Point
ISO International Organisation for Standardization
QS Quality Scheme

ix
LIST OF FIGURES
FIGURE 1.1 FOOD SAFETY REGULATORY FRAMEWORK UNDER CHINA FOOD SAFETY LAW..................................................................7
FIGURE 1.2 STRUCTURE OF FOOD SAFETY CONTROL SYSTEM IN CHINA ..............................................................................................9
FIGURE 1.3 DOMESTIC DAIRY PRODUCTS STRUCTURE .................................................................................................................... 10
FIGURE 1.4 STRUCTURE OF DAIRY SUPPLY CHAIN IN CHINA ............................................................................................................ 12
FIGURE 1.5 STUDY RATIONALE ..................................................................................................................................................... 17
FIGURE 2.1 DIFFERNENT APPROACHES FOR STUDIES RISK............................................................................................................... 22
FIGURE 2.2 ROLE OF RISK PERCEPTION IN RISK STUDY.................................................................................................................... 22
FIGURE 2.3 CONCEPTUAL MODEL OF CONSUMER RISK PERCEPTION OF FOOD................................................................................. 31
FIGURE 3.1 GEOGRAPHIC LOCATION OF LANZHOU ........................................................................................................................ 38
FIGURE 4.1 THE FREQUENCY OF CONSUMING DAIRY PRODUCTS ..................................................................................................... 51
FIGURE 4.2 CONSUMER RELIANCE ON INTRINSIC AND EXTRISINC ATTRIBUTES OF DAIRY PRODUCTS .................................................. 52
FIGURE 4.3 CONSUMER TRUST IN THE CONTROL STAKEHOLDERS HAVE OVER SAFETY IN THE DAIRY INDUSTRY ................................... 52
FIGURE 4.4 CONSUMER DIRECT EXPERIENCE WITH UNSAFE FOOD .................................................................................................. 53
FIGURE 4.5 RECOLLECTION OF FOOD SAFETY INCIDENT IN PAST 6 MONTHS..................................................................................... 54

x
LISTS OF TABLES
TABLE 1.1 SELECTED ILLEGAL FOOD ADDITIVES INCIDENTS WHICH IN CHINA THAT HAD A MAJOR IMPACT ON CONSUMER CONFIDENCE
AND WERE EXTENSIVELY COVERED BY THE MEDIA ...................................................................................................................5
TABLE 1.2 PERCENTAGE OF RAW MILK SUPPLY BY DIFFERENT SIZE OF DAIRY FARM .......................................................................... 12
TABLE 1.3 RURAL AND URBAN INCOME OF THE FOUR PROVINCES MOST AFFECTED BY THE MELAMINE INCIDENTS .......................... 14
TABLE 1.4 MELAMINE OF THE DAIRY PRODUCTS OF COMPANIES INVOLVED IN MELAMINE INCIDENT AND THEIR INSPECTION
EXEMPTION SITUATION...................................................................................................................................................... 15
TABLE 2.1 PRODUCT ATTRIBUTES AND MEANS OF CONFIRMATION ................................................................................................. 26
TABLE 2.2 LIST OF DEFINITIONS OF TRUST..................................................................................................................................... 28
TABLE 3.1 DETAILED INFORMATION ABOUT THE VARIABLES ........................................................................................................... 39
TABLE 3.2VARIABLES, INFORMATION, QUESTION TYPES IN QUESTIONNAIRE ................................................................................... 40
TABLE 4.1 CHARACTERISTICS OF THE SAMPLE................................................................................................................................ 47
TABLE 4.2 SUMMARY OF THE CONFIDENCE LEVEL IN THE SAFETY OF FOOD IN GENERAL AND DAIRY PRODUCTS.................................. 48
TABLE 4.3 SUMMARY OF THE CONFIDENCE LEVEL IN FOOD SAFETY IN DIFFERENT FOOD GROUPS ..................................................... 48
TABLE 4.4 SUMMARY OF THE CONFIDENCE LEVEL OF FOOD SAFETY IN DIFFERENT TYPES OF DAIRY PRODUCTS ................................. 49
TABLE 4.5 SUMMARY OF CONCERN OVER DIFFERENT POTENTIAL FOOD SAFETY ISSUES ................................................................... 50
TABLE 4.6 PROFILE OF RESPONDENTS WITH DIFFERENT SOCIAL-DEMOGRAPHIC CHARACTERIST ........................................................ 56
TABLE 4.7 ASSOCIATION BETWEEN CONSUMER RISK PERCEPTION IN THE SAFETY OF DAIRY PRODUCTS AND SOCIAL DEMOGRAPHIC
VARIABLES ........................................................................................................................................................................ 57
TABLE 4.8 ASSOCIATION BETWEEN CONSUMER RISK PERCEPTION IN THE SAFETY OF DAIRY PRODUCTS AND EXTRINSIC AND INTRINSIC
ATTRIBUTES OF DAIRY PRODUCTS ....................................................................................................................................... 58
TABLE 4.9 ASSOCIATION BETWEEN CONSUMER RISK PERCEPTION IN THE SAFETY OF DAIRY PRODUCTS AND DEGREE OF CONTROL OF
ACTORS AND REGULATORS IN THE DAIRY INDUSTRY ............................................................................................................. 59
TABLE 4.10 NUMBER AND PERCENTAGE OF RESPONDENTS WITH DIFFERENT PERSONAL EXPERIENCE AND RECALL OF UNSAFE FOOD
INCIDENTS ........................................................................................................................................................................ 61
TABLE 4.11 ASSOCIATION BETWEEN CONSUMER RISK PERCEPTION IN FOOD SAFETY OF DAIRY PRODUCTS AND DIRECT EXPERIENCE AND
RECALL OF FOOD SAFETY INCIDENTS.................................................................................................................................... 61
xi
TABLE 4.12 ASSOCIATION BETWEEN CONSUMER RISK PERCEPTION IN FOOD SAFETY OF DAIRY PRODUCTS AND DIFFERENT CATEGORIES
OF MEDIA EXPOSURE ......................................................................................................................................................... 61
TABLE 4.13 THE DIFFERENT LEVELS OF ASSOCIATION BETWEEN INDEPENDENT VARIABLE AND DEPENDENT VARIABLES ...................... 62
TABLE 4.14 RESULT OF FACTOR ANALYSIS OF SOCIAL-DEMOGRAPHIC INFORMATION AND WITH THE DEPENDENT VARIABLE ADDED IN65
TABLE 4.15 RESULT OF FACTOR ANALYSIS BETWEEN EXTRINSIC AND INTRINSIC ATTRIBUTES AND LOADING OF THE DEPENDENT VARIABLE
ON THE FACTORS............................................................................................................................................................... 66
TABLE 4.16 RESULT OF FACTOR ANALYSIS OF CONSUMER TRUST IN STAKEHOLDERS IN DAIRY INDUSTRY WITH DEPENDENT VARIABLE
ADDED IN.......................................................................................................................................................................... 67
TABLE 4.17 FACTOR ANALYSIS OF CONSUMER MEDIA EXPOSURE, PERSONAL EXPERIENCE WITH UNSAFE FOOD, RECALL OF FOOD SAFETY
INCIDENTS AND WITH THE DEPENDENT VARIABLE ADDED IN. ............................................................................................... 68
TABLE 4.18 SUMMARY OF FACTORS WITH THE HIGHEST LOADING RESULTS OF FACTOR ANALYSIS..................................................... 69
TABLE 4.19 LIST OF VARIABLES FOR THE BINARY LOGISTIC REGRESSION .......................................................................................... 71
TABLE 4.20 RESULTS OF THE BINARY LOGISTIC REGRESSION........................................................................................................... 74
TABLE 5.1 RATING THE SAFETY OF DAIRY PRODUCTS FROM DIFFERENT COUNTRIES OR REGIONS...................................................... 77
TABLE 5.2 SUMMARY OF RESULTS OF THE DEGREE OF ASSOCIATION BETWEEN CONSUMER RISK PERCEPTION OF SAFETY IN DAIRY
PRODUCTS AND THE INDEPENDENT VARIABLES .................................................................................................................... 79
TABLE 5.3 FACTORS DETAILS ........................................................................................................................................................ 81
TABLE 5.4 SUMMARY OF FACTORS WHERE THE DEPENDENT VARIABLE, CONSUMER PERCEPTION OF SAFETY IN DAIRY PRODUCTS, HAVE
THE HIGHEST LOADING VARIABLES ...................................................................................................................................... 82
TABLE 5.5 RESULTS OF THE BINARY LOGISTIC REGRESSION ............................................................................................................ 83
TABLE 5.6 THE SUMMARY OF HYPOTHESES ................................................................................................................................... 91

1
Introduction CHAPTER 1
Food safety has become increasingly important with the development of the global
agri-food system and international trade. Outbreaks of a series of foodborne diseases
and food fraud scandals have eroded consumer confidence worldwide and have raised
concerns from governments, the public and stakeholders in the food industry. Food
safety issues are not only public health hazards, but also have a negative influence on
international trade and the global economy.
1.1 Global food safety challenges
Some recent examples of food safety incidents and food fraud include the outbreak of
the Escherichia coli O157:H7 in August 2013 in Arizona, USA, which sickened 79 people
and hospitalised 23 people and being the largest E. coli outbreak in the United States
(Foodborne Illness Outbreak Dtabase, 2013). Beef burgers contaminated with horse
meat were found in Britain and Ireland in January 2013 (O'Mahony, 2013). Fonterra’s
precautionary recall of whey protein in 2013 cost multimillions of dollars (Hussain &
Dawson, 2013). In 2012, a Salmonella outbreak in salmon products caused sickness in
950 people in the Netherlands and 100 in the United States (Foodborne Illness
Outbreak Database, 2013). The well-known melamine incident in China in 2008
affected 300,000 babies with 51,900 hospitalised and 6 deaths as a result of
consuming melamine contaminated baby formula (Xiu & Klein, 2010). From 1993 to
2010, more than 184,500 cases of BSE (bovine spongiform encephalopathy) had been
confirmed in the United Kingdom alone (Centers for Disease Control and Prevention,
2010). These foodborne illnesses and food fraud scandals around world remind us
that there is much to be done to protect the global food system.

2
1.2 Factors contributing to global food safety
There are a number of factors contributing to global food safety issues. Changes in
farming and husbandry practice, global food supply chain structure and agricultural
technology contributed to global food safety issues. The global food supply chain is
growing in volume and complexity yet food safety systems have not developed at
same scale and speed (DeWaal & Robert, 2005). Increased international trade means
the time between food being produced and being consumed is prolonged which
increases the likelihood of contamination or adulteration. Modern farming and
husbandry practices are driven by the need to maximise profits through reduced costs
and maximum outputs and have resulted in an over-reliance on pesticides, fertilizers,
antibiotics and growth regulators (DeWaal & Robert, 2005). The advancement of new
technology in food production, processing and distribution offer greater convenience
and variety of food to consumers. There are associated challenges that influence food
safety. Shelf-life stable food and ready-to-eat foods are a potential source of
microbiological contamination without proper handling (DeWaal & Robert, 2005).
Changes in world population structure, lifestyle and consumer demand also
contributed to the global food safety issues. The development of medical treatments
has resulted in an increase in the aging population (Sanderson, 2004). It is expected
that by 2025 the population of over 60 years olds will exceed one billion (DeWaal &
Robert, 2005). The aging population will increase the numbers people who are
vulnerable to foodborne disease. As disposable income increases, people tend to
spend more on dining out. Non-standard practices in restaurant kitchens may raise the
risk of food poisoning incidents.

3
Other than the global trends discussed above, there are some unique challenges to
food safety in developing countries, like China including the economic situation, diet,
and infrastructure. Farmers in China generally produce on a small scale, lack food
safety knowledge and lack uniform farming practices (DeWaal & Robert, 2005). Food
products are traded in traditional markets with large amounts of middle men
operating on a cash basis. Food traceability become very difficult. Food safety
regulations are often not in place or if they are, they are not followed (Lin, Zeng, Li, &
Ni, 2010).
In response to an increasing numbers of food safety incidents and concerns about food
safety , food safety regulating institutions and food industries around world endeavour
to improve food safety in order to protect public health, consumer confidence, the
domestic economy, and international trade. The European Union adapted Regulation
(EC) 178/2002 in January 2002 to provide a general framework and a set of
requirements for the development of food safety law in its member countries (Global
Food Safety Forum, 2011). The core concept of this regulation is to establish a trace
back system and an information sharing platform to monitor production, processing,
prevention and management of the risk, making sure there is coherent and mutual
recognition in its internal market and among its member countries (European Union,
2002).
In the United States, the Food Safety Modernization Act (FSMA) which replaces the
Food, Drug, and Cosmetic Act in 1938, was introduced in 2010, based on the principles
of scientific risk-based analysis and preventive control (Taylor, 2012). Under the FSMA,
risk-based analysis has been used efficiently by establishing a partnership between the

4
food safety regulators and actors in the food industry(Global Food Safety Forum, 2011).
The new law also strengthens the control on imported food.
In China, after the melamine incident in 2008, a new food safety law was introduced in
2009. The new law focuses on establishing a food safety system with a third party
using scientific risk-based analysis. A new food safety regulating institution was
established under the food safety law to coordinate the various authorities in food
safety regulation in the old food safety regulating system (Global Food Safety Forum,
2011).
1.3 Food safety situation in China
With its rapid economic development, China is experiencing great change. The change
from a command-oriented economy to a market-oriented economy after 1978 raised
many social and economic issues. Food safety is one of the prominent ones. The
Chinese Government has made a great effort to increase production and
diversification of its food sources. The priority of government effort is shifting from
food security to food safety. At the same time, consumers in China have been seeking
improved safety and quality of food. The Twelfth Five-Year Plan (2011-2015) clearly
recognizes that improving food safety is a critical national task, as a part of realizing a
vision of human-centred, science-based development (General Office of the State
Council, 2012).
Despite the effort of the Chinese government, food safety remains a serious problem
in China. Various food safety incidents covered by the media have shaken consumer
confidence in the food industry and public regulation. The media reported a total of
2489 food safety incidents during the period of 2004 to 2012 (Wu, 2012). That means

5
an average of 276 cases annually or two food safety incidents every three days. There
are some interesting findings can be concluded from these media reports : first, the
food processing sector is the most reported sector in the food supply chain. More than
64% of food safety incidents reported by media are related to the food processing
sector. Second, among all the food safety incidents that were reported, animal
products and dairy products are the most reported food groups (60.9%). Third, illegal
use of food additives was the most reported issues, being 34% of food safety incident
that were reported (Wu, 2012). Table 1.1 below lists selected food safety incidents
widely reported by the media in China.
Table 1.1 Selected illegal food additives incidents which in China that had a major impact on consumer confidence and were extensively covered by the media
Source:(Lam, Remais, Fung, Xu, & Sun, 2013)
Illegal chemical Food additives Year Detail
Suden VI Dye 2006 The dye Sudan IV has been banned from use as food addictive for its potential carcinogenic effects. Sudan IV has been illegally added to chill powder and poultry feed to enhance colour to attract consumers in China (Kwok & Yau, 2006).
Melamine contaminated baby formula
2008 In 2008, the industry chemical melamine was found to be used in baby formula to boost the apparent protein level. Melamine adulteration caused 6 deaths, with 13,000 hospitalized (Pei et al., 2011).
Lean meat agent
2009 Lean meat agent increase muscle to fat ratio, which can be used as a growth promoter to produce lean carcass. The overuse of the agent causes nausea and dizziness if consumed by humans. Lean meat powder was reported to have cause an outbreak of food poisoning in 2001, and was subsequently prohibited in animal husbandry in 2002. After discovering the use of Lean meat powder in pig rearing in Henan province in 2009, the government launched an extensive investigation to remove lean meat powder from animal feed (SZE, 2011).
Gutter oil 2011 Recycling waste oil from restaurant drainage pipes produces gutter oil. It has been shown that cause acute abdominal pain. There are reports that long-term consumption of the oil can lead to stomach and liver cancer. It is widely used by small restaurants and food stands to lower costs(Chung, 2013). In 2011, joint action by AQISA from Zhejiang, Shandong, and Henan provinces has tracked down 60000 tons of gutter oil.
6
1.3.1 Food safety supervision at the central government level
Chinese food safety supervision has experienced three stages (administrative
dependent style, administrative and legislative mix style, legislative style) from 1949
until now. From 1949 to 1982 food safety supervision in China was copied from the
Former Soviet Union of Socialist Republics, dominated by administrative orders,
ideological education, and mass campaigns against food adulteration (Tam & Yang,
2005). While a basic food hygiene law was put in place in 1982 and revised in 1993 and
2006, the law focused on the end-product and catering business checks by authorities
instead of applying traceability and supply chain management (United Nations in China
2008). Food safety supervision was undertaken by nine government authorities with
responsibilities overlapping and resources wasted (Skinner, Han, Luo, & Lou, 2004;
United Nations in China 2008; W. Zhou, 2012).
In the wake of an increase in the number and severity of food safety incidents in China,
especially after the 2008 melamine contaminated milk powder incident, the Chinese
government strengthened its control over the food industry. On February 28th, 2009,
the Chinese government passed the Food Safety Law of the People’s Republic of China
(“Food Safety Law”). The Food Safety Law came into effect on June 1, 2009 and
replaced the “Food Hygiene Law”(The Nationl People's Congress, 2009). New
Legislation in China has improved food safety supervision in some ways like
strengthening control over food additives, producing unified food standards and
establishing a politically important institute “The Office of State Council Food Safety
Commission” to oversee the ministries of food safety regulation (Jia & Jukes, 2013).
However some of the problems from previous legislation still remain. A preventive
traceability and recall system is still not in place under the new legislation (Pei, et al.,

7
2011). The new law improved administrative coordination by building a food safety
commission but a complex administrative body with fragmented and overlapping
functions still exists, as shown in figure 1.1 (Pei, et al., 2011; Tam & Yang, 2005; Yang,
2004).
Figure 1.1 Food Safety Regulatory Framework under China Food Safety Law
Source:(Pei, et al., 2011) In China, inspection and enforcement are limited by a lack of resources and an uneven
distribution of resources (Tam & Yang, 2005). The responsibility of food safety
supervision was shared by government, province and local authorities. Due to complex
administration arrangements at the government level, the public resources at the
provincial and local level were not used efficiently (Jia & Jukes, 2013). In order to
streamline the administration and coordinate resources, the SFDA (State Food and
Drug Administration) was established in 2003 (Jia & Jukes, 2013). With limited staff
and resources, the SFDA cannot fully fulfil its coordinating role.
State council
The office of state council food safety
commission
MoA
Agricultural product
AQSIQ
Food production Import and export
SAIC
Food Distribution
SFDA
Catering and distribution
MoH
Supervising & coodinating
8
1.3.2 Food safety supervision at local government level
In China, the administrative structure involves 33 provinces, autonomous reg ions or
municipalities directly under the central government, 333 regions, municipalities,
autonomous prefectures and 2861 counties and county level municipalities (Jia &
Jukes, 2013). Most of these provincial, regional and county level administrations are
directly responsible to their respective regional government body, but report to the
Ministry of Health (MOH), the Ministry of Agriculture (MOA), the Administration of
Quality Supervision, Inspection and Quarantine Department (AQSIQ), the Industry and
Commerce Department (IAC) and the State Food and Drug Administration Department
(SFDA) in their respective areas of competence, as shown in figure 1.2.
Food safety supervision at the local level compromises central government leg islation
by tolerating illegal activities that may cause food safety incidents (Jia & Jukes, 2013).
Local officials need enterprises to generate revenue and employment to improve their
career paths (Tam & Yang, 2005). Regulating agencies put emphasis on fee and penalty
collecting instead of regulating unsafe food production practices. Regulating agencies
compete with each other on revenue-generating regulating activities, which lead to
over enforcement in some areas and under enforcement in others. Official corruption
is another factor which contributes to lax enforcement of food safety legislation (Tam
& Yang, 2005; Yang, 2004).

9
At central
Level
At
local
level
Provinces(34) Cities(333)
Counties(2826)
Figure 1.2 Structure of food safety control system in China Source:(Jia & Jukes, 2013)
1.4 Background information on the dairy market in China
1.4.1 Demand for dairy in China
Until 1980, more than half of the expenditure in Chinese households was spent on
food (Gale & Huang, 2007). Dairy consumption in China was one of the lowest in the
world in 1996 with 8.18kg per capita. This number has tripled in last 16 years, reaching
Food Safety Commette in State council
MOA AQSIQ IAC SFDA
MOH
Government at provincial level
Provincial department of Agriculture
Provincial department of Quality Supervision
Provincial department of Inductry and commercial
Provincial department of Food and Drug Administration
Provincial Department of Health
Government at cityl level
Municipal Bureau of Agriculture
Municipal Bureau of Quality Supervision
Municipal Bureau of Inductry and commercial
Municipal Burea uof Food and Drug Administration
Municipal Bureau of Health
Government at county level
Bureau of Agricultureat county level
Bureau of Quality Supervision at county level
Bureau of Inductry and commercial at county level
Bureau of Food and Drug Administration at county level
Municipal Bureau of Health

10
34.1 kg in 2012 (China National Beareau of Statistics Various Years). Yet after
significant growth, dairy consumption per capita in China is still lower than the world
average. The major products of the domestic dairy industry are fluid milk (white milk
and flavoured milk), yogurt, milk powder and ice cream (Fuller & Beghin, 2004). Figure
1.3 shows the proportion of different dairy products manufactured in China.
Figure 1.3 Domestic dairy products structure Source:(Ing. J.W, 2012)
With the reforms of the market economy and opening up to the world in 1978, the
GDP in China has grown at a rate of 9% to 10 % per year; the income of Chinese has
risen dramatically but unevenly in the past 20 years (Fuller, Huang, Ma, & Rozelle,
2006). Personal income has climbed from 343.4 RMB to 24565 RMB from 1978 to
2012 (H. Chen, 2011; Scott & Jianping, 2012; Trading Economics, 2012). Along with the
rise of income, the diet of Chinese households has shifted from a carbohydrate-
dominated diet to a more diverse diet with more fresh fruit, meat, seafood, eggs and
dairy products (Gale & Huang, 2007).
Aside from an increase of income, increases in dairy consumption can also be
explained by the following factors: (1) Urbanization: It is expected that more than 1

11
billion people will be living in cities by 2030, compared with 600 million in 2008. This is
producing a strong drive in the growth of the consumer market; (2) Growing health
awareness: health enhancing functions of dairy products are widely publicised by the
health care and the dairy industry. Fluid milk and yogurt are regarded as a source of
calcium and protein instead of just a supplementary feed for babies, patients and the
elderly in China (Debham, 2008). Dairy products are becoming an integral part of the
Chinese household diet (Chanda Beckman, 2011; Gale & Huang, 2007); (3)
Improvement in the supply chain: a growing chilled product supply chain within China
has increased the availability and affordability of dairy products. The modern retail
chains with chilled storage facilities provides consumers with a great variety of
products (Debham, 2008).
1.4.2 Supply of dairy products in China
The domestic supply of dairy products falls short of meeting the rapidly growing dairy
market in China (Beijing Orient Agribusiness Consultants, 2012; Hunt, Moynihan, &
Voboorgen, 2010; Ing. J.W, 2012). The gap between the soaring demand for dairy
products and the domestic supply is caused by structural and temporary factors (Hunt,
Moynihan et al. 2010; Beijing Orient Agribusiness Consultants 2012).
The Chinese dairy supply chain is highly fragmented. As shown in Table1.2, more than
60% of small dairy farmers own less than 100 cows (Ing. J.W, 2012). A large number of
middle men in the supply chain increases the price of dairy products and poses a
challenge for traceability (Hunt, et al., 2010), (see Figure 1.4). A total of 80% of the
dairy market in China is dominated by domestic products, among which 60% are
sourced from dairy farms with less than 100 cows (Ing. J.W, 2012). Small scale dairy

12
farmers struggle to survive with strengthening regulations in food safety and the
surging cost of feed and labour. Large scale dairy farms in China emerged after 2008,
increasing from 17% in 2008 to 27% in 2011 (Bower, Daeschel, & McGuire, 1998; Qiao,
Guo, & Klein, 2012). But it will take years before the domestic supply meets the
demand of the Chinese population
Table 1.2 Percentage of raw milk supply by different size of dairy farm
Dairy Farm size (Number of cows)
1-5 6-20 21-100 101-200 201-500 501-1000 >1000
Percentage of raw milk supply
23% 24% 15% 6% 9% 10% 13%
Source:(Ing. J.W, 2012)
Figure 1.4 Structure of dairy supply chain in China Source: (Ing. J.W, 2012)
Private Farmer
State owned farms
Groups of
farmers
Milk station
Middle man
Cooperative
Own farms
Farming bases
Processors Retailor Food
Home
Distributor
Dairy
Imports
Individual Farmer

13
The dairy industry in China is going through a dramatic change in terms of its supply
chain structure. In the wake of a few food safety scandals in dairy products, the
government is investing in changes in the supply chain structure. Regulatory pressure
has put many small scale dairy farms out of business. The Chinese government
supports the development of large scale dairy farms by granting preferential policy on
agricultural subsidies, land and capital access. The processing companies are investing
in the development of large scale dairy farms to raise the proportion of controlled raw
milk sources (Beijing Orient Agribusiness Consultants 2012). As a result of the
transformation of the dairy industry in China, the supply of dairy products from small
scale dairy farms is shrinking. Yet the large scale dairy farm remains an emergent stage
(Dairy News, 2013 ). The rising cost of feed, fuel and labour have forced an increasing
number of small scale dairy farms out of business (Beijing Orient Agribusiness
Consultants, 2012).
1.5 Melamine contamination scandal
In 2008, 16 infants were diagnosed with kidney stones and other kidney damage in
Gansu Province China, after consuming baby formula produced by the Sanlu group,
one of the major players in the Chinese dairy market (Hilts & Pelletier, 2009). In
November 2008, it was reported that more than 13,000 had been hospitalized and six
infants died from kidney failure. Melamine is a chemical used to boost the apparent
level of protein (Hilts & Pelletier, 2009). The same problem was found in other
products from 21 other companies (Xiu & Klein, 2010). The melamine incidents reveal
the main issues that contribute to the current food safety situation in China. These
issues include: the increasing income gap, disproportionate supply chain structure of
the food industry and government regulatory failure (Pei, et al., 2011). The incident

14
itself also contributed to a restructure of the dairy industry and the enacting of new
food safety legislation in 2009.
The social and economic situation is also a factor that contributed to the melamine
incident. The income gap in China between urban and rural areas, and developed and
underdeveloped areas is huge. The four most affected provinces by the melamine
contamination scandal and their per capital incomes are listed in Table 1.3 .The four
provinces are in the less developed part of China. The net per capita income is below
the national average. The urban per capita income is three to five times higher than in
the rural areas (Lu, 2011).
This gap leads to the separation of consumer groups. High-income consumers focus on
the quality and safety of food products. They will pay a premium for food products
with a quality guarantee. The price of imported baby formula (135 to 280 RMB per
900g) is three to five times the price of the low-end Sanlu baby formula (25-20RMB
per 400g) (Lu, 2011). Consumers from rural underdeveloped areas are price sensitive.
They tend to choose products at the low end of the price scale when it comes to baby
formula. They were the major victims in the melamine incidents.
Table 1.3 Rural and urban income of the four Provinces most affected by the Melamine incidents Province by number of patients
Net income of rural residents
Disposable income of urban residence
Gansu Province 2724 10969
Hebei Province 4759 13441 Henan Province 4454 13231 Xin jiang Uygur Autonomous Regions
3175 11432
National Average 4761 15781
Source: The cause and effect analysis of Melamine incident in China (Lu 2011)
15
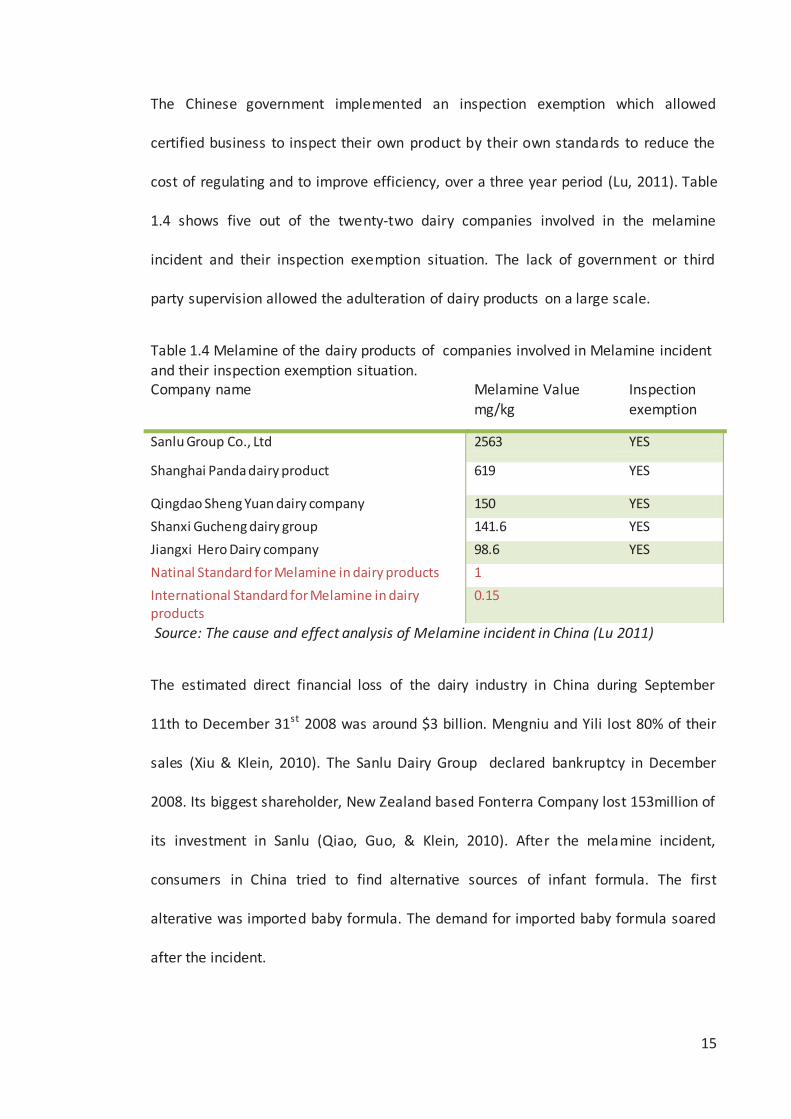
The Chinese government implemented an inspection exemption which allowed
certified business to inspect their own product by their own standards to reduce the
cost of regulating and to improve efficiency, over a three year period (Lu, 2011). Table
1.4 shows five out of the twenty-two dairy companies involved in the melamine
incident and their inspection exemption situation. The lack of government or third
party supervision allowed the adulteration of dairy products on a large scale.
Table 1.4 Melamine of the dairy products of companies involved in Melamine incident and their inspection exemption situation. Company name Melamine Value
mg/kg Inspection exemption
Sanlu Group Co., Ltd 2563 YES
Shanghai Panda dairy product 619 YES
Qingdao Sheng Yuan dairy company 150 YES Shanxi Gucheng dairy group 141.6 YES Jiangxi Hero Dairy company 98.6 YES Natinal Standard for Melamine in dairy products 1 International Standard for Melamine in dairy products
0.15
Source: The cause and effect analysis of Melamine incident in China (Lu 2011)
The estimated direct financial loss of the dairy industry in China during September
11th to December 31st 2008 was around $3 billion. Mengniu and Yili lost 80% of their
sales (Xiu & Klein, 2010). The Sanlu Dairy Group declared bankruptcy in December
2008. Its biggest shareholder, New Zealand based Fonterra Company lost 153million of
its investment in Sanlu (Qiao, Guo, & Klein, 2010). After the melamine incident,
consumers in China tried to find alternative sources of infant formula. The first
alterative was imported baby formula. The demand for imported baby formula soared
after the incident.

16
The melamine contamination scandal revealed the legislation deficiency in food safety
in China. The food safety law came into effect in June 2009 and contains 104 rules in
10 chapters (Qiao, et al., 2012). The national food commission was established to
overcome a lack of coordination between the different authorities under the previous
legislation. The inspection exemption system that was partly responsible for the
scandal was removed from the legislation (Xiu & Klein, 2010). Traceability and third
party certification were introduced to ensure the quality and safety of food along the
entire supply chain (Lu, 2011).
1.6 Problem statement and rationale for study
This study focuses on dairy products for three reasons: (1) a dairy supply shortage, a
growing population and increasing income make China one of the emerging markets in
global dairy products. A study of consumer perception of dairy products in China is
crucial for major dairy product exporting countries and major dairy companies to
understand their market and consumers; (2) due to the melamine adulteration
incident in 2008 and many other food safety incidents related to dairy products,
Chinese consumers are highly sensitive to the safety of dairy products. In spite of
various efforts that have been made to boost consumer confidence, a survey
conducted by WHO in 2010 shows more than 70% of consumers are not confident in
food safety (Global Food Safety Forum, 2011); (3) the safety of dairy products is
particularly important because many consumer are infants and young children in
China. Given China’s “one child policy”, the safety of dairy products is especially
important.
17
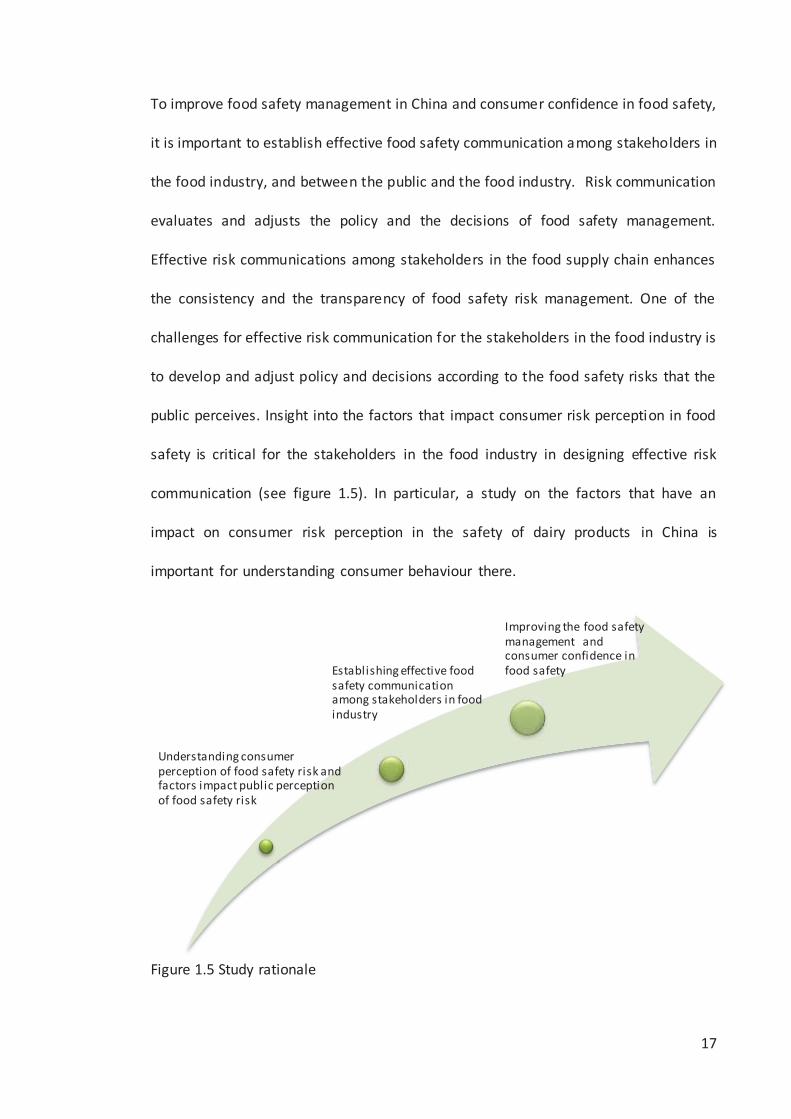
To improve food safety management in China and consumer confidence in food safety,
it is important to establish effective food safety communication among stakeholders in
the food industry, and between the public and the food industry. Risk communication
evaluates and adjusts the policy and the decisions of food safety management.
Effective risk communications among stakeholders in the food supply chain enhances
the consistency and the transparency of food safety risk management. One of the
challenges for effective risk communication for the stakeholders in the food industry is
to develop and adjust policy and decisions according to the food safety risks that the
public perceives. Insight into the factors that impact consumer risk perception in food
safety is critical for the stakeholders in the food industry in designing effective risk
communication (see figure 1.5). In particular, a study on the factors that have an
impact on consumer risk perception in the safety of dairy products in China is
important for understanding consumer behaviour there.
Figure 1.5 Study rationale
Understanding consumer perception of food safety risk and factors impact public perception of food safety risk
Establishing effective food safety communication among stakeholders in food industry
Improving the food safety management and consumer confidence in food safety

18
1.7 Study aims and objectives
1.7.1 Aim of the study
To identify and evaluate the factors that impact on the risk perception of food
safety, with a focus on dairy products in Lanzhou, China
1.7.2 Specific objectives
1. To identify the most important factors that impact on consumer risk perception
of food safety, particularly, dairy products
2. To evaluate the importance of each factor in a model and determine its
influence on consumer risk perception of safety in dairy products.
1.8 Structure of the thesis
The thesis is structured in five chapters. Chapter 1 is the introductory chapter,
providing background, motivation, aim and rational of the study and structure of the
thesis. Chapter 2 reviews the literature that is central to the study. A model with four
conceptual framework for investigating factors that impact on consumer‘s risk
perception in the safety of dairy products in China was developed based on the
literature. Twelve hypotheses were proposed based on the model. Chapter 3 details
the methods employed-that is a questionnaire survey used to collect research data.
Methods of analysing data (frequency distributions, cross tabulation, factor analysis,
binary logistic regression) and statistical concepts that were important to study are
explained. Chapter 4 focuses on the results of the data analysis. It investigates four
sets of conceptual frameworks: (1) social demographic information that potentially has
an impact on food safety perception; (2) level of reliance on extrinsic and intrinsic
attributes of the dairy products; (3) trust in actors and regulators of the dairy industry;
19
(4) Media exposure, personal direct experience with unsafe food and recall of food
safety incidents in the past six months. Chapter 5 summarises the results of the data
analysis. Sections ondiscussion, limitations, future study directions and a conclusion.
are presented.

20
Literature Review CHAPTER 2
2.1 Introduction
To get a better understanding of how consumers perceive food safety in China, this
research investigates the underlying factors affecting the consumer risk perception of
food safety in dairy products. This chapter reviews relevant literature on consumer risk
perception of food safety.
This chapter is structured as follows. First, the definitions, categories and research
approaches of risk are reviewed. Second, factors that have an impact on the consumer
risk perception of dairy products are identified from previous studies on consumer risk
perception internationally. Third, a model using a conceptual framework of four
underlying factors that impact on consumer risk perception is developed from factors
identified in the literature review. Some relevant studies that have been done in China
are reviewed in this section as well.
2.2 Risk
2.2.1 What is risk
The word “risk” has been defined many times in different contexts. One definition of
risk is the “possibility of suffering harm and loss from a factor, course or element
causing uncertain danger” (Houghton Miflin Co., 2006). Another similar yet more
detailed definition is given by the Royal Society - “a combination of probability or
frequency of occurrence of a defined hazard and the magnitude of the consequence of
the occurrence” (Royal Society, 1992). This definition implies that risk can be measured

21
quantitatively as a variable in terms of probability and magnitude (Yeung & Morris,
2001).
The definitions discussed above have one thing in common. They are objective
abstract explanations of risk. The social approach defines risk as a variable which is
related to public and individual perception. Risk in a social context is defined as risk
raised from public discourse about technology and political and economic conditions
that influence expert assessment (Sapp, 2003). Frewer, Jonge and Kleef (1995) et al
concluded that risk perception is socially constructed. People’s response to risk is
directed by psychological elements rather than technical assessment. The same idea
was found in the “The social amplification of risk” which investigates how social and
individual factors effect perception of risk and in turn create other social effects
(Pidgeon, Kasperson, & Slovic, 2003; Slovic, 1999). The social definition of risk includes
the perception and interaction of risk and behaviour.
2.3 Research approach of risk
The conventional approaches to the study of risk are risk assessment, risk
management and risk communication (A. Lobb, 2005; Sapp, 2003). Risk assessment is
the technical approach to investigating risk that can be objectively measured. In the
case of a technological hazard, like genetically modified food, risk assessment is
appropriate (Yeung & Morris, 2001). Risk management is a political and economic
process that develops a regulatory response to public risk concerns. Risk
communication is a social process of conveying information among the stakeholders of
risk (A. Lobb, 2005). The conventional approach to study risk is displayed in Figure 2.1
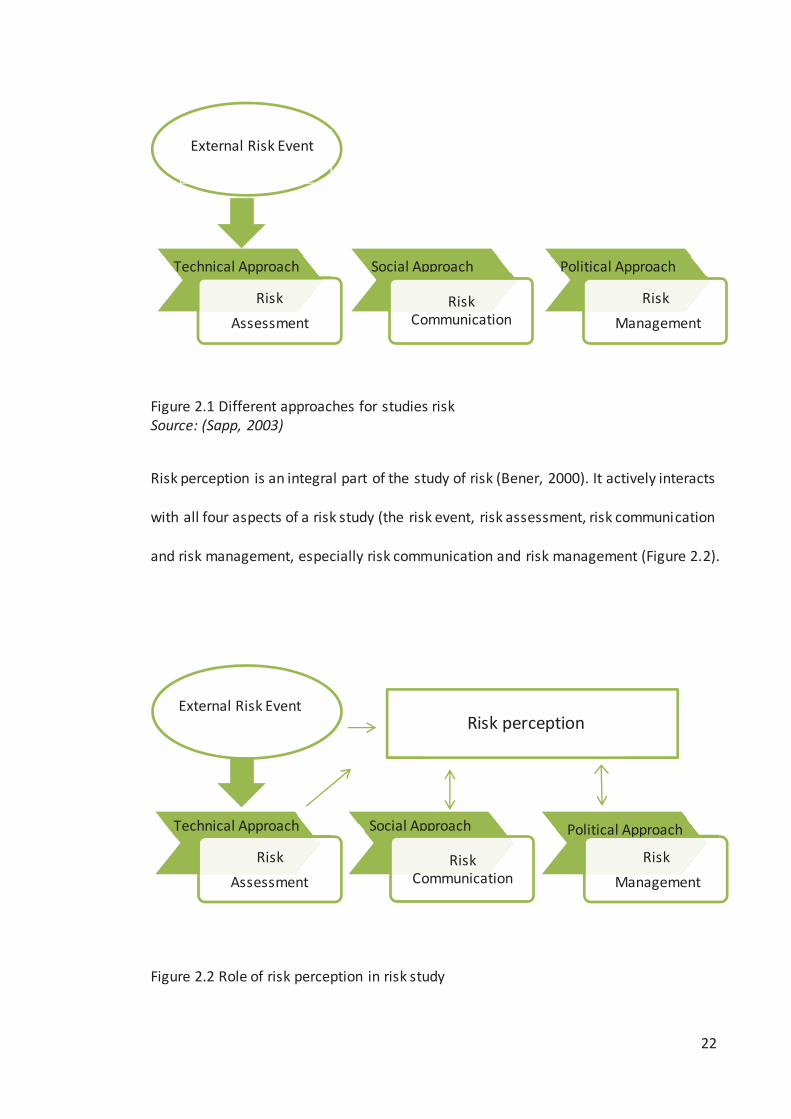
22
Figure 2.1 Different approaches for studies risk Source: (Sapp, 2003)
Risk perception is an integral part of the study of risk (Bener, 2000). It actively interacts
with all four aspects of a risk study (the risk event, risk assessment, risk communication
and risk management, especially risk communication and risk management (Figure 2.2).
Figure 2.2 Role of risk perception in risk study
Risk Assessment
Risk Communication
Risk Management
Risk Assessment
Risk Communication
Risk Management
External Risk Event
Technical Approach Social Approach Political Approach
External Risk Event
Technical Approach Social Approach Political Approach
Risk perception
23
2.4 Factors impacting risk perception
2.4.1 Socio-demographic factors
To identify important socio-demographic factors, it is necessary to examine previous
studies on the risk perception of food. A broad range of literature has been reviewed
to make sure that the set of factors is as complete as possible. In general the findings
regarding demographic factors indicate that gender, level of education, income and
family structure have an influence on risk perception (Dosman, Adamowicz, & Hrudey,
2001; Frewer, 2000b; Mariani et al., 2007; Tonsor, Schroeder, & Pennings, 2009;
Zepeda, Douthitt, & You, 2003).
One of the findings regarding demographic distinction is the gender difference.
Females tend to perceive more risk in a particular hazard than males (Baker, 2003;
Frewer, 2000b; Rosati & Saba, 2004). Women tend to take risk adverse action even in
situations where there is low probability of risk. Slovic (1999) and Frewer (2000) found
a difference in risk perception in Europe. A European female’s perception was more
similar to non-European females and males. Women and the non-European group are
less involved in social decision making and management than European men, which
makes them feel less in control when they face food safety issues like genetically
modified food (Frewer, 2000b; Slovic, 1999). The rationale behind this is more about
the socio-political situation rather than biological influence.
The level of education is another factor that is identified in the literature as important
in the perception of risk. Two contradictory findings illustrate the relationship between
the level of education and risk perception. First, the level of education is positively
related to the level of risk perception. Individuals with a high level of education can
24
better understand the potential risk of chemical residues in food, biological
contamination with bacteria and viruses, and the impact of a high-fat diet on the body.
So those with a high level of education are more conscious about food safety risk than
those with less education. Individuals with less education are less likely to realize the
existence of these potential risks and therefore will perceive less risk in food (Adu-
Nyako & Thomposon, 1999; Baker, 2003; Tonsor, et al., 2009).
Meanwhile, there are researchers that support the view that the level of education is
negatively related to risk perception. They argued that with a high level of education,
individuals gain a sense of control and power by understanding the potential hazard
(Dosman, et al., 2001; Muhammad, Sherif, & Gheblawi, 2010; Slovic, 1999).
Furthermore, a high education is positively related to high income. Higher income
offers more alternatives in food selection. They can therefore choose to purchase food
that they perceive is of low risk (Dosman, et al., 2001; Mariani, et al., 2007).
Income is important in shaping risk perception. As income increases, the overall level
of risk perception of food decreases. This can be explained as when income increases,
the willingness to pay to avoid risk increases. Such individuals can choose alternatives
to minimize the their exposure to a potential food hazard (Baker, 2003; Dosman, et al.,
2001). Furthermore, groups that have high income in society consider themselves as
having a high involvement and influence on social management and decision making.
(Frewer, 2000a). This contributes to their sense of control over every aspect of their
life, including food safety.
The household structure is another factor that influences risk perception. Dosman
(2001) and Baker (2003) found that individuals with young children have a high

25
concern for food safety. Another study which was conducted in China comparing the
risk attitude towards dairy products between households with young children and
without young children came to the same conclusion (Qiao, et al., 2012).
2.4.2 Information sources
In a market place with asymmetric information, the risk perception of consumers is
based on the information they receive from all indicators the products provide in
various ways (Bennett, Calman, Curtis, & Smith, 2010; Slovic, 2013; C. Zhang, Bai,
Lohmar, & Huang, 2010). Information on the package includes the best before date,
green/organic/natural food labels, food safety assurance (QS, HACCP), government
inspection, price, ingredients, nutrition facts and brands (Bernués, Olaizola, & Corcoran,
2003; FSANZ, 2008; Verbeke & Ward, 2006). Interestingly, government inspection is
especially important to consumers in Asia including Japan and China (R. Liu, Pieniak, &
Verbeke, 2013; Tonsor, et al., 2009). Information that is related to the consumers
experience such as appearance, smell and taste are also found to be important in
some recent studies (Schroeder, Tonsor, Pennings, & Mintert, 2007; Tonsor, et al.,
2009).
Becker (2000) explained in his study that the information could be obtained from the
product itself, which is referred to as a search and experience quality. These are
attributes consumers are looking for when they purchase and consume food (Becker,
2000). Other information which cannot be perceived before or after consumption of a
product is referred to as credence quality. Becker (2000) defined credence quality as
“concerns of the consumer where no cues are accessible in the process of buying or
26
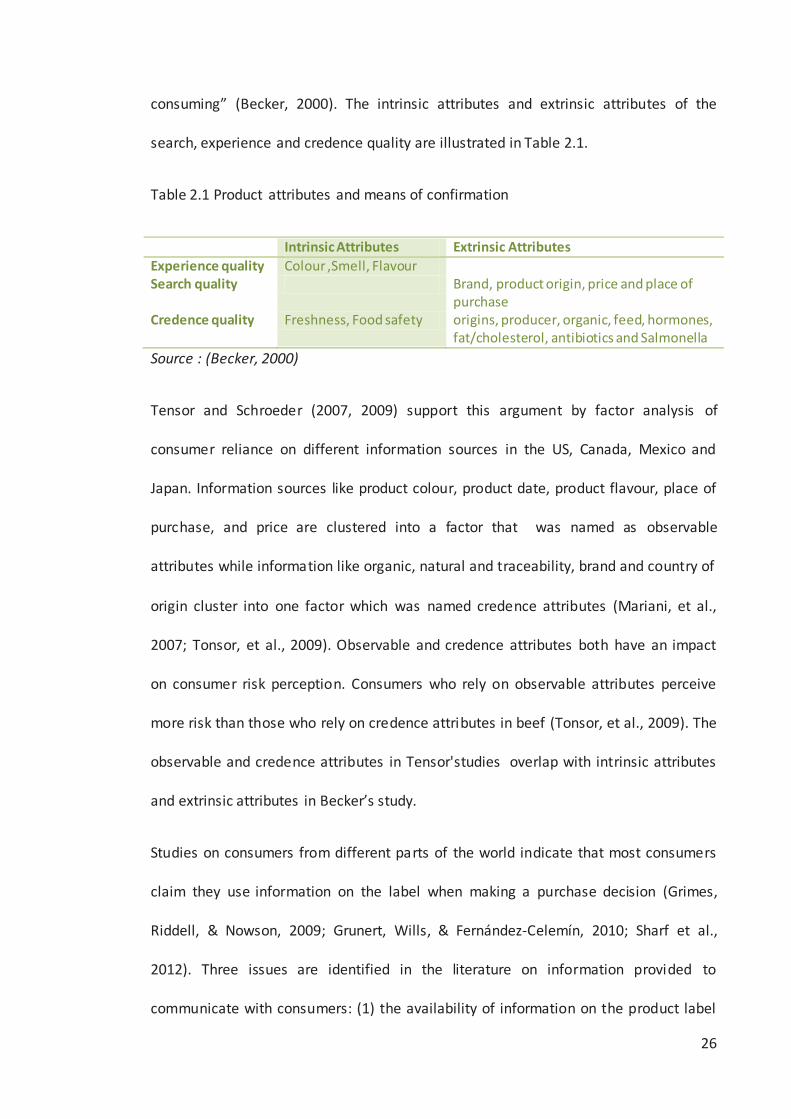
consuming” (Becker, 2000). The intrinsic attributes and extrinsic attributes of the
search, experience and credence quality are illustrated in Table 2.1.
Table 2.1 Product attributes and means of confirmation
Intrinsic Attributes Extrinsic Attributes Experience quality Colour ,Smell, Flavour Search quality Brand, product origin, price and place of
purchase Credence quality Freshness, Food safety origins, producer, organic, feed, hormones,
fat/cholesterol, antibiotics and Salmonella Source : (Becker, 2000)
Tensor and Schroeder (2007, 2009) support this argument by factor analysis of
consumer reliance on different information sources in the US, Canada, Mexico and
Japan. Information sources like product colour, product date, product flavour, place of
purchase, and price are clustered into a factor that was named as observable
attributes while information like organic, natural and traceability, brand and country of
origin cluster into one factor which was named credence attributes (Mariani, et al.,
2007; Tonsor, et al., 2009). Observable and credence attributes both have an impact
on consumer risk perception. Consumers who rely on observable attributes perceive
more risk than those who rely on credence attributes in beef (Tonsor, et al., 2009). The
observable and credence attributes in Tensor'studies overlap with intrinsic attributes
and extrinsic attributes in Becker’s study.
Studies on consumers from different parts of the world indicate that most consumers
claim they use information on the label when making a purchase decision (Grimes,
Riddell, & Nowson, 2009; Grunert, Wills, & Fernández-Celemín, 2010; Sharf et al.,
2012). Three issues are identified in the literature on information provided to
communicate with consumers: (1) the availability of information on the product label
27
does not imply those consumers are able to use information appropriately; (2)
increasing information on product labels might lead to information overload, which
decreases the effectiveness of communication (Epplera & Mengisa, 2004); (3)
credibility of information is based on the trust consumer have for the information
provider. Intuitively, consumers have a higher level of trust in the information that
offered by parties which they find to be trustworthy (A. E. Lobb, Mazzocchi, & Traill,
2007).
2.4.3 Trust in the actors of the food chain and regulatory institutions
Trust is an important factor in risk perception. Trust and risk are highly correlated. As
trust increases, risk perception decreases. That is to say trust acts to offset factors
influencing risk perception (Bener, 2000). Guinaliu and Tores (2006, p.409) pointed
out: “Trust facilitates the adoption of decisions in risky situations, and reduces the
number of possible alternatives, reduces the environmental complexity; facilitates
cooperation and coordination; improves conflict resolution; reduces the need for
control mechanisms; and helps to develop commercial exchanges in the long term.” .
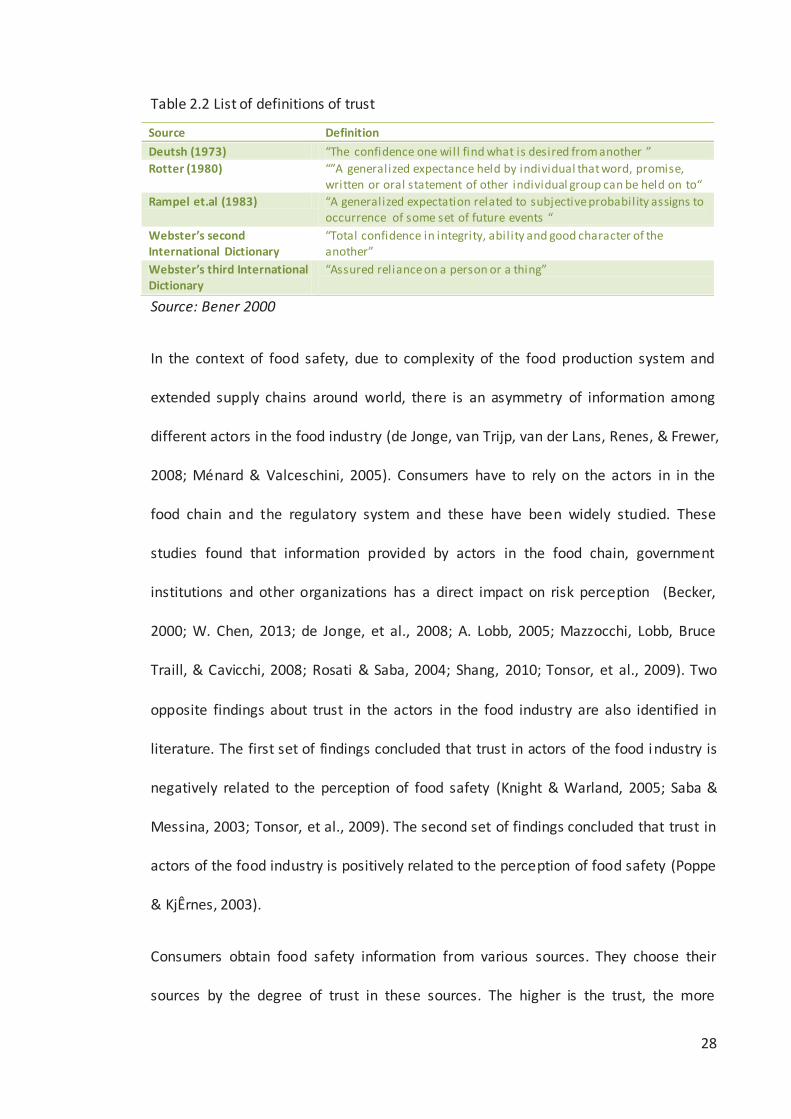
To better understand the definition of trust, a list of definitions is given by Bener (2000)
(see Table 2.2). The social definition of risk complements these definitions by including
the perception and interaction of risk and behaviour, food industry and regulatory
institutions to obtain safe food and information on food safety.
28
Table 2.2 List of definitions of trust
Source: Bener 2000
In the context of food safety, due to complexity of the food production system and
extended supply chains around world, there is an asymmetry of information among
different actors in the food industry (de Jonge, van Trijp, van der Lans, Renes, & Frewer,
2008; Ménard & Valceschini, 2005). Consumers have to rely on the actors in in the
food chain and the regulatory system and these have been widely studied. These
studies found that information provided by actors in the food chain, government
institutions and other organizations has a direct impact on risk perception (Becker,
2000; W. Chen, 2013; de Jonge, et al., 2008; A. Lobb, 2005; Mazzocchi, Lobb, Bruce
Traill, & Cavicchi, 2008; Rosati & Saba, 2004; Shang, 2010; Tonsor, et al., 2009). Two
opposite findings about trust in the actors in the food industry are also identified in
literature. The first set of findings concluded that trust in actors of the food industry is
negatively related to the perception of food safety (Knight & Warland, 2005; Saba &
Messina, 2003; Tonsor, et al., 2009). The second set of findings concluded that trust in
actors of the food industry is positively related to the perception of food safety (Poppe
& KjÊrnes, 2003).
Consumers obtain food safety information from various sources. They choose their
sources by the degree of trust in these sources. The higher is the trust, the more
Source Definition Deutsh (1973) “The confidence one will find what is desired from another ” Rotter (1980) “”A generalized expectance held by individual that word, promise,
written or oral statement of other individual group can be held on to“ Rampel et.al (1983) “A generalized expectation related to subjective probability assigns to
occurrence of some set of future events “ Webster’s second International Dictionary
“Total confidence in integrity, abil ity and good character of the another”
Webster’s third International Dictionary
“Assured reliance on a person or a thing”

29
reliance consumer has on the resource (Kornelis, De Jonge, Frewer, & Dagevos, 2007;
Tonsor, et al., 2009). Literature also suggests consumer from different parts of world
have different preference in trusting information providers. Consumers from Asia
place most trust in the government while consumers from western countries are more
likely to trust the consumer organizations (R. Liu, et al., 2013; Tonsor, et al., 2009).
Studies in the frequency of consumer use of the information on the label and how
consumers understand information on food products are effective in understanding
how the information on food products impacts on consumer risk perception of food
safety.
It has been found that the risk perception of food safety is lower for those who trust in
the government, experts and industry (de Jonge, et al., 2008; Siegrist, 2000). In a
nation-wide study, Japanese consumers who rely on industry, retailors and the
government perceive a low risk of food safety (Tonsor & Schroeder 2009), while
Canadian consumers trust researchers and consumer groups and perceive a low risk of
food safety (Mariani, et al., 2007; Tonsor, et al., 2009). These results are consistent
with the findings of Lobb’s study:information from food safety experts and food chain
actors reduces while information from alternative sources tends to increase risk
perception in (Mazzocchi, et al., 2008).
2.4.4 Food safety incident and media coverage of food risks
The public concerns about food safety issues are often aroused by food safety
incidents and media coverage (Pennings & Garcia, 2001; Verbeke, Frewer, Scholderer,
& De Brabander, 2007). Consumer experience with food safety incidents is found to be
a factor affecting risk perception as well (Mariani, et al., 2007; Tonsor, et al., 2009).
30
Direct experience with food safety incidents increased the risk perception of food
safety. Indirect experiences with food safety incidents also increased food safety risk
perception. The existence of indirect effects suggest the impact of food safety
incidents is transmitted and amplified. This is explained the BSE (Bovine spongiform
encephalopathy) outbreak in the UK which had an impact on the consumer risk
perception of beef consumption in most European countries (Setbon, Raude, Fischler,
& Flahault, 2005).
The relationship between mass media and risk perception is complex (S. Liu, Huang, &
Brown, 1998; Sjöberg, 2000). Mass media has more impact on the societal level of risk
perception rather on the personal level of risk perception (McComas, 2006; Wahlberg
& Sjoberg, 2000). Individual consumers rely on social networks to assess risk (Verbeke,
et al., 2007). Negative and positive media coverage is asymmetric in the degree of
acceptance at different stages of food safety incidents (S. Liu, et al., 1998). During food
safety incidents, negative media coverage tends to have an immediate impact in
increasing consumers’ risk perception due to negative shock from the incident while
the positive coverage will reduce risk perception in the long run (S. Liu, et al., 1998).
The studies on the impact of media type and media credibility on risk perception are
also explored (Wachinger, Renn, Begg, & Kuhlicke; Walter, Böhmer, Reiter, Krause, &
Wichmann, 2012).
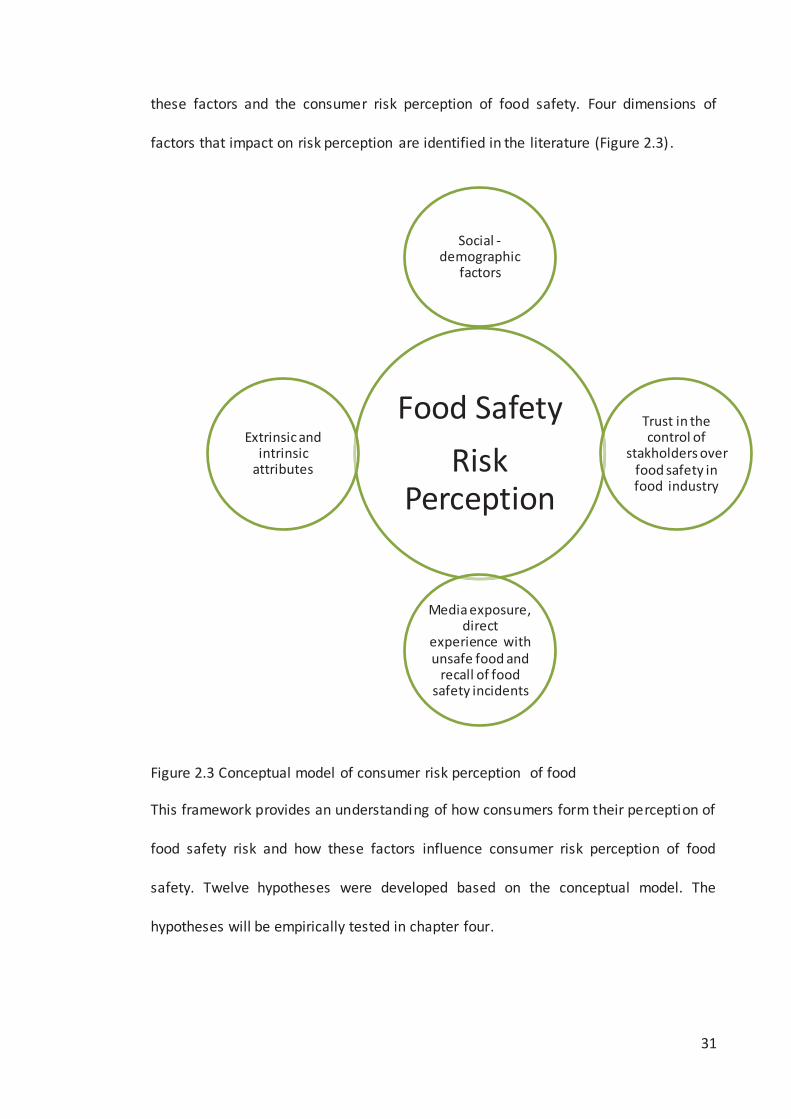
2.4.5 Summary
By identifying the factors that impact on consumer risk perception in four different
dimensions, a framework of consumer perception of food safety risk can be
established. The framework presents the key factors and the relationships between
31
these factors and the consumer risk perception of food safety. Four dimensions of
factors that impact on risk perception are identified in the literature (Figure 2.3) .
Figure 2.3 Conceptual model of consumer risk perception of food This framework provides an understanding of how consumers form their perception of
food safety risk and how these factors influence consumer risk perception of food
safety. Twelve hypotheses were developed based on the conceptual model. The
hypotheses will be empirically tested in chapter four.
Food Safety Risk
Perception
Social -demographic
factors
Trust in the control of
stakholders over food safety in food industry
Media exposure, direct
experience with unsafe food and
recall of food safety incidents
Extrinsic and intrinsic
attributes
32
2.5 Research objectives
Factors that impact on the consumer perception of food safety risk has received
relatively little research attention in Asia. A small number of the empirical studies have
focused on northwest part of China, where the melamine tainted milk scandal was first
disclosed and most influenced, see Table 2.3 below.
Selected studies of Chinese consumers and their attitudes/perception regarding food
safety in the past 10 years are summarised in the Table 2.3. These studies covered the
food groups of pork, chicken, beef, fish, dairy products and cooking oil. Shelf life,
government certification, brand and food safety certification are the most important
indicators for consumers for food safety across these studies. Knowledge and
awareness of food safety certification are generally low compared to the level of
concern over food safety. The willingness to pay a premium for food safety is evolving
with consumers moving from being price sensitive to safety sensitive. The higher
income groups have a greater willingness to pay a premium for food safety.

33
Table 2.3 Summary of selected studies on perception/attitude of food safety in China
Author /Year
Research Location
Sample size
Food Groups
Topic Conclusion
Qing Han Juan Qiao Ling-Yun He (Han, Qiao, & He, 2012)
Bei jing 611 Pork Consumer’s wi l lingness to pay for certi fied pork products ,
Consumers’ knowledge about certi fied agricultural products, income and family s ize are important factors in consumer’s wi l lingness to pay for certified pork products. Willingness to pay for certi fied pork is low compare to level of concern over safety of pork
Zhang, Caiping Bai, Junfei Wahl, Thomas I. (C. Zhang, Bai, & Wahl, 2012)
Nanjing 753 Pork, milk, and cooking oi l
Consumers' wi l lingness to pay for traceability
Consumer knowledge about food traceability and awareness of food quality- and safety-related certi fications are low. Income and age a lso have statistically significant impacts on the WTP.
David L. Ortega H. Holly Wang Nicole J. Olynk Laping Wu Junfei Bai (Ortega, Wang, Olynk, Wu, & Bai, 2011)
Bei jing Chengdu Hohhot Nanjing Shanghai Wuhan Xi ’an
420 UHT mi lk Consumers’ wi l lingness to pay for selected food safety attributes: price, shelf-life, government certi fication, third-party certi fication, and brand
Government certification and a national brand are most valued by consumers
Yingheng Zhou Erpeng Wang(Y. Zhou & Wang, 2011)
Nanjing 255 Food safety in general
Factors that influence urban consumers' atti tudes towards food safety after the melamine scandal.
Education level, consumers' awareness of food safety incidents and their opinion of governments' action after the incident.
Wang, Feng Zhang, Jian Mu, Weisong Fu, Zetian Zhang, Xiaoshuan (F. Wang, Zhang, Mu, Fu, & Zhang, 2009)
Bei jing 320 Fish products
Consumers’ knowledge about nutri tion, storage, production and processing, cooking, traceability, attention to quality and safety incidents, handling method for problematic products
There is a shortage of safety knowledge among customers including: processing, s torage, and the traceability system of fish products. Consumers a re willing to pay a 6% premium for safe, traceable fish products.
Wang, Zhigang Mao, Yanna Gale, Fred(Z. Wang, Mao, & Gale, 2008)
Bei jing 312 Dairy Products
Factors that influence the eva luation safety of food products Shelf l i fe, producer, food safety certification, reta il outlet, trademarks, colour and taste
Shel f life, producer, food safety certi fication are important. Knowledge of food certification is low The willingness to pay for certi fication is higher for those with higher income
Xiaoyong Zhang (X. Zhang, 2003)
Shanghai 298 Pork beef, fresh milk chicken
Important factors for consumer to decide frequency of consumption of selected food products
Purchase place, price, taste and income level are the factors that are relatively important and influence the frequency of consumers’ consumption of selected food products
34
A study of the factors that impact on the consumers’ perception of food safety risk in
northwest of China will help regulators to prioritise their resources and efforts to build
effective public risk communication and risk management in food safety. It will also
help actors in the food industry better to understand consumers and their food safety
needs, and how that is related to consumer choice for the perception of food safety
A conceptual model of the consumer perception of food safety risk is presented, and
the twelve hypotheses proposed in this study are discussed.
The testing of the hypotheses will also address the following two research objectives:
1. To identify the most important factors that impact consumers’ risk perception of
safety in dairy products in Lanzhou, China.
2. To the rank the factors that impact on consumers’ risk perception of safety in dairy
products in Lanzhou, China.
2.6 Hypotheses Development
The conceptual model (see Figure2.3) developed in this study was based on the review
of the literature. The research model suggests that consumers’ perception of food
safety risk is based on a number of factors: social demographic factors, intrinsic and
extrinsic attributes, trust in different actors in the food supply chain, food safety
incidents experience and media usage. Based on this four-fold conceptual framework,
the following hypotheses were developed.
2.6.1 Hypotheses related to social-demographic factors
H1 Females perceive more risk than males in the safety of dairy products
H2 Education level is positively related to the risk perception of dairy safety.
H3 Household income is negatively related to the risk perception of dairy safety.

35
H4 The household structure (presence of children under 18 years old) is positively
related to the risk perception of consumers in dairy safety.
2.6.2 Hypotheses related to the source of information
H5 The level of reliance on information of extrinsic attributes is positively related to
the risk perception of consumers in dairy safety.
H6 The level of reliance on information about intrinsic attributes is positively related to
the risk perception of consumers in dairy safety.
2.6.3 Hypotheses related to the trust in actors in the food supply chain
H7 Trust in actors in food industry is negatively related to the risk perception of dairy
safety.
H8 The trust in government regulators food safety regulatory agencies is negatively
related to risk perception of dairy safety.
H9 The trust in the retailers is negatively related to the risk perception of consumers in
dairy safety.
H10 Trust in the academic researcher is negatively related to the risk perception of
dairy safety.
2.6.4 Hypotheses related to experience with food safety incidents and media
coverage
H11 Direct experience of food safety incidents is negatively related to the risk
perception of consumers in dairy safety.
H12 Media use is positively related the risk perception in dairy safety.

36
Research Methodology CHAPTER 3
3.1 Introduction
The aim of this study is to examine consumer perceptions of the safety of dairy
products in China and the factors that may have an impact on this. These factors
include trust in the industry actors and regulators, direct experience with unsafe food,
media exposure, the reliance on extrinsic and intrinsic attributes and the social -
demographic characteristics of the individual.
The purpose of this chapter is to: (1) explain the methodology of the research used to
examine the research objectives and hypotheses, (2) provide details about the
questionnaire, including design, format and administration, (3) discuss sampling and
research ethics, (4) describe the methods of data analysis including frequencies, cross-
tabulations/correlation, factor analysis and binary logistic regression.
3.2 Research method
3.2.1 Research instrument
A survey is used as the primary research method. There are several ways to collect
survey data, including self-completion, face to face or telephone interviews and online
surveys. Each of these methods has its place in social research (Babbie, 2010). Given
the purpose of this study and in particular limited time and resource availability, the
most appropriate method for this research is a self-completion questionnaire.
Questionnaires are easy to administer. The cost of a self-completion questionnaire is
lower than an interview. Self-completion questionnaires can be sent out in large
quantities and this helps to ensure a sufficient response (Russell K Schutt, 2012). The

37
results of questionnaires can be easy to code, record, quantify and interpret by
statistical analysis (Marshall, 2005). The results of the analysis can be used to compare
with similar research or to test hypotheses.
One of the limitations of self-completion questionnaires can be a low response rate,
compared to face-to-face interviews. There is no help for the respondents if they have
difficulty in understanding a question and there is more likely to be unanswered
questions (Russell K Schutt, 2012). Self-completion questionnaires are unable to get
additional information, such as the observations made by interviewers (Babbie, 2010).
3.2.2 Target population, research location sampling method
This study used a population in Lanzhou as its target population. Lanzhou is the capital
city of Gansu Province, northwest China. The Yellow river, the second largest river in
China, runs through the city. According to the census in 2010, the population of
Lanzhou reached 3,616,163 (China National Beareau of Statistics Various Years). The
urban area covers 13,300 square kilometres (China National Beareau of Statistics
Various Years). It is a centre of regional transportation, connecting areas further west
with the eastern half of China by railway and telecommunication.

38
Figure 3.1 Geographic location of Lanzhou Source: http://sedac.ciesin.columbia.edu/data/collection/cddc
A convenience sample was used in this study because of limited time (approximately
one month) and resources (costs were born personally) for the project. Yet efforts
were made to diversify the range of respondents. A panel of college (tertiary) students,
family members (mainly parents) of a primary school and parents of high school
students, and hospital staff were recruited through the researcher’s social network.
The data was collected by a self-completed questionnaire from respondents from 16 to
82 years old.
3.2.3 Questionnaire development
For this study, a survey questionnaire was derived from the questionnaire “A monitor on
consumer confidence in food safety" developed by Janneke de Jorge (2008) and from a model
developed by Glynn Tonsor, Ted Schroeder & Joost Penning ,2009. Based on the existing
literature (Chapter2, section 2.3), the questionnaire was developed to allow the examination
of the relationship between the dependent variable, consumer risk perception in the safety of
dairy products and the four groups of independent variables: namely social -demographic
Lan zhou

39
information, trust in stakeholders of the food industry, reliance on intrinsic and extrinsic
attributes and personal experience, recall of unsafe food incidents and exposure to the media.
In addition, there were food safety related issues which provide information that may affect
the correlation between the dependent and independent variables.
The type of data collected was primary data. Two types of variables, ordinal and numerical
were used. The detailed information of variables is listed in Table 3.1
Table 3.1 Detailed information about the variables Broad category of variables Groups Variables name Type of Question
Independent Variables
Consumer risk perception of dairy products in food safety
Scaled questions
Dependent Variables
Social-demographic information
Gender Dichotomous question Monthly income Multiple choice Education level Multiple choice Family Structure Multiple choice
Consumer’s level of reliance on extrinsic and intrinsic attributes of dairy products
Government inspection Scaled questions
Food safety assurance Scaled questions Products ingredients Scaled questions Best before date Scaled questions Country of origin Scaled questions Ladled organic/green/natural food Scaled questions Place of purchase Scaled questions Brand name Scaled questions Price Scaled questions Government inspection Scaled questions Food safety assurance Scaled questions Products ingredients Scaled questions Best before date Scaled questions Country of origin Scaled questions Ladled organic/green/natural food Scaled questions Place you buy it Scaled questions Brand name Scaled questions Taste Scaled questions Smell Scaled questions Appearance Scaled questions
Consumer trust in the stakeholder of dairy industry
Dairy farmer Scaled questions Milk station Scaled questions Processing company Scaled questions Retailor Scaled questions Government inspector Scaled questions Academic Researcher Scaled questions
Exposure to media ,recall of the incident Personal experience with unsafe food
TV/Radio Scaled questions Newspaper Magazine Scaled questions Online social website Scaled questions Online news Scaled questions Family/Friend/Colleague Scaled questions Personal experience with unsafe food Dichotomous question Recall of food safety incident in past six months Dichotomous question

40
3.2.4 Questionnaire format
The questionnaire consisted 28 questions (see Appendix A for details). The
questionnaire consisted of three parts. The first part asked about social-demographic
information and the media use of respondents. The second part consisted of questions
regarding consumer risk perception in the general area of food safety, including
potential food safety issues and with different food groups. The third part contained
questions regarding consumer risk perception in dairy products, and factors that may
impact on the risk perception.
The questionnaire contained various types of questions, which are shown in table 3.1.
A cover letter accompanied the questionnaire to explain the purpose and nature of the
study and encourage participation (see Appendix A for details). The cover letter and
questionnaire were translated into Chinese (simplified) for the respondents (see
Appendix B for details). Table 3.2 presents the information obtained and question
numbers and variable type in the questionnaire.
Table 3.2Variables, information, question types in questionnaire
Type of Variable Information obtained Question no.
Dependent Variables Consumer risk perception in food safety of dairy products
Q14
Independent Variables Trust in actors and regulators Q18
Independent Variables Reliance on extricate and intricate attributes of dairy products
Q15, Q16, Q17
Independent Variables Use and exposure to media Q8
Independent Variables Experience and recall of unsafe food Q20,21,22,23,24,25,26.27
Independent Variables Social–demongraphic factors Q1,2,3,4,5,6,7,9
Background information Consumer risk perception in different food groups ,different dairy products groups and in dairy products from different countries
Q10,11, 12,13 ,19
41
3.2.5 Pre-testing procedure
Before conducting the survey in China, a pre-testing procedure was carried out to
evaluate the validity and relevance of the questionnaire. After the questionnaire was
translated into Chinese, 20 copies of questionnaire were distributed to Chinese
students studying at Massey University, New Zealand. Comments on the content or
layout of the questionnaire were encouraged. The process ensured the respondents
understood the questions being asked and had the ability to answer them in an
appropriate manner. Based on the respondents’ feedback, some ambiguities and
wording translation problems were identified. Some minor modifications were made
as a result of this process, such as giving an explanation or using less technical terms.
3.2.6 Survey administration
The questionnaires were handed out from the 26th September to 1st October, 2013
and were collected on the 18th and 19th of October 2013. The questionnaires were
handed out by the researcher and local assistants. A total of 300 copies were handed
out to college students who study at the Gansu Agricultural University in Lanzhou,
China. Another 300 copies were handed out to the headmasters of a primary school
and a high school. The students of the primary school and high school were asked to
take the questionnaires back home to their parents. Another 200 copies were handed
out by the researcher to the medical stuff and patients in a local hospital in Lanzhou. A
total of 566 copies of the questionnaires were collected. The response rate was 70.8%.
After the collection of the questionnaires, the completeness and consistency of the
raw data was checked before data entry. Of the questionnaires collected, 35 copies of
the questionnaires were found to be seriously incomplete and hence not useful for

42
analysis. After this process, the total number of valid questionnaires was 531. The
characteristics of the sample respondents are displayed in Table 4.1.
3.3 Data analysis
SPSS version 21 was used to analyse the data. Microsoft Excel 2010 was used to draw
charts which were used in the analysis and discussion. A cleaning process was
performed to ensure the completeness and validity of data, which includes checking
the data for logically inconsistencies, out of range values and treating missing data by
assigning a neutral value. After the cleaning process, each variable was given a variable
name and a more detailed label. A value was assigned to each variable according to
the content of each question. Once all the data was entered, the data was checked for
entry errors.
3.3.1 Frequencies
The first thing to be examined were the frequency distributions for each variable as
well as measures of central tendency and variability. Some of the variables were
recoded into new variables with fewer categories to help with interpretation (Healey,
2012).
3.3.2 Cross-tabulations/correlation
Cross tabulations were run between the dependent variable, which was the consumer
risk perception in the safety of dairy products (Question No.14), and the independent
variables which included the trust in industry actors and regulators (Question No.18),
reliance on extrinsic and intrinsic attributes for dairy products (Question No.15,16,17),
direct experience with unsafe food (Question No.21,25), exposure to the media
(Question No.8) and social demographic information (Question No.3,4,5).

43
3.3.3 Factor analysis
Factor analysis was conducted for two purposes: the first purpose was to create a data
set with relatively unrelated variables for the binary logistic regression by loading the
variables that are highly related to each other into a smaller number of factors . The
second purpose was to understand the underlying relationship between variables. The
loading of the dependent variable onto the new factors was used to better understand
the association between the dependent variable and independent variables. From the
factor analysis, factor scores were used to create new variables for use in binary
logistic regression1.
3.3.4 Binary logistic regression
Logistic regression was used to examine the quantitative impact and the significance
level of each independent variable against the dependent variable. It identifies the
strength of each independent variable associated with the probability that the binary
variable falls in a particular category (Cramer, 2003).
The empirical model for this is:
Binary Logistic regression gives each independent variable (social-demographic
information, extrinsic and intrinsic attributes, trust in s takeholders in the dairy industry,
media exposure, personal experience, recall of incidents) a coefficient which measures
1 Rotate conponent table in the output of SPSS was used in the results of factor analysis. The rotate method is varimax

44
its contribution to the variation in the dependent variables (consumer risk perception
in the food safety of dairy products). The dependent variables are binary or
dichotomous, which means they can only take one of two values: 0 or 1. Therefore the
dependent variable (consumer risk perception in the food safety of dairy products) has
been recoded into two groups: not safe (0) or safe (1). The coefficient is the
probability (p) of belonging to one group rather than the other. Instead of using least-
squares deviations criterion for the best fit, it uses a maximum likelihood method,
maximizing the probability of getting observed results given the fitted regression
coefficients result (Burns & A.Burns, 2008). The b coefficient stands for the slope value.
The slope can be interpreted as the change in the average value of Y (consumer risk
perception in the food safety of dairy products) from one unit change of X (social -
demographic information, extrinsic and intrinsic attributes, trust in stakeholder in dairy
industry, media exposure,personal experience) (Burns & A.Burns, 2008).
3.4 Research ethics
This research was conducted in accordance with” the Code of Ethical Conduct for
Research, Teaching and Evaluations involving Human Participant” (Massey University).
Peer review of the research proposal determined that this was a low risk project. A low
risk notification for this research was submitted to the Human Ethics Committee of
Massey University. Each participant was informed about this research: the objective,
significance, benefits and potential risks to the participants, the rights for participants
(including voluntary participation), confidentiality issues and how their rights will be
protected. It was not expected that there would be any risk to the participants
undertaking this research. The results from each participant were to be shared only
with that person, while the final aggregate results of the research will be available to
45
the public. Agreements were signed by all participants to make sure that each
participant was fully informed and consenting to this research.
3.5 Research limitations
There are several limitations to this study, mostly centred on the sample. A probability
sample of the population of Lanzhou was not possible for the researcher, largely
because of limited time and resources. The respondents were recruited through the
researcher’s social network. About half of the respondents were college students, and
many of the others were parents of school-age children. The interpretation of all
results must be read with these limitations in mind; a sample in one mid-size Chinese
city, with a sample heavily comprised of tertiary age students and people with school
age children.

46
Data Analysis CHAPTER 4
4.1 Introduction
This chapter analyses the data using the methods reported in Chapter Three. Results
from the frequencies, cross tabulations, correlations, factor analysis and binary logistic
regression are presented and discussed. Variables that are significant to consumer risk
perception of safety in dairy products are identified.
4.1.1 Descriptive statistics
The descriptive statistics were obtained using SPSS version 21.0. After the collection of
the questionnaires, the completeness and consistency of the data were checked
before entering the data into a spread-sheet. The total number of valid questionnaires
was 531 representing a response rate of 70.6%.
Among all respondents of the survey, 55.4% were male and 44.6% were female. The
percentage of male respondents was 5% higher than that of the population 2. The
sample of respondents was predominantly between 16 and 49 (96%). Respondents
had a relatively high level of education, with 43.3% in tertiary education. The majority
of respondents (80%) had a monthly income of less than ¥ 4000.
2Figures refer to population on 1st November, 2010, the sixth national census of China
(Nation Statistic Bureau, 2010)

47
Table 4.1 Characteristics of the sample Sample (%) N=531 Population* (%)
Gender Male 55.4% 51.15 % Female 44.6% 48.85% Age 16-19 19.2%
78.09%
20-29 40.1% 30-39 17.3% 40-49 19.4% 50-59 2.7% ≥60 1.2% 8.77% Education Level3 Low 21.5% no data available for the
population Medium 63.3% High 15.2% Income( /Per capita) ≤2000 51.2% no data available for the
population 2001-4000 28.8% 4001-6000 13.3% ≥600 6.7%
4.1.2 Overview of consumer risk perception of food safety in general food and dairy
products
Of the total respondents, 17.3% had a substantial degree of confidence (categories 4+5)
(Appendix A,Q10) in the general food safety situation in China, while many (30.6%) of
the respondents perceived consuming dairy products as safe (categories 4+5)
(Appendix A,Q14). Overall, the data suggest consumers surveyed in China were
3 Education Level: Low (No formal schooling to high school), Medium (Poly technical
school, junior college and Bachelor degree), High (Master degree and above)

48
generally worried about food safety, but it appears that there was somewhat less
concern with dairy products than there was food in general (see Table 4.2).
Table 4.2 Summary of the confidence level in the safety of food in general and dairy products. In general how confident are you in the safety of food you consume?
I consider consuming dairy products
1 Not Confident at all 12.9% 1Not safe at all 9.1% 2 23.7% 2 20.5% 3 46% 3 39.8% 4 14.6% 4 22.3% 5 Very Confident 2.8% 5 Very Safe 8.3% Total (N=100%) (528) Total (N=100%) (512)
Table 4.3 portrays consumer risk perception for different food groups. The type of
food with the least perceived food safety risk (having the most confidence) was fresh
fruit and vegetables (72.9%, somewhat and very much confidence). Processed meat
had the highest perceived food safety risk (69.3%, not at all or a little confidence)
(Table 4.2). More than half of respondents had a low level of confidence in dairy
products (51.6% not at all or a little confidence). It is clear that respondents perceived
more risk (less confidence) in processed food than fresh food. Meat products were
considered to carry more risk than any other food group.
Table 4.3 Summary of the confidence level in food safety in different food groups How much confidence do you have in the safety of each of the following kinds of foods? Processed
meat Fresh meat
Cooking oil
Dairy products
Fresh vegetables and Fruits
Not at all 10.8% 6.9% 17.5% 7.8% 2.5%
A little 58.5% 51.4% 38.3% 43.8% 24.4% Somewhat 26.8% 36.2% 36.4% 41.8% 52.1% Very Much 3.9% 5.4% 7.8% 7.0% 20.8% Total(N =100%) (511) (519) (514) (512) (520) (N, Don’t know) (17) (12) (17) (19) (11)

49
Table 4.4 shows the degree of confidence that respondents have in the safety of
different dairy products. The questionnaire asked about six groups of dairy products
and the responses fell into two broad clusters. Baby formula, flavoured milk and ice
cream were in the “high risk” category, with more than 60% of the respondents having
little or no confidence in the safety of these three dairy foods. This compares with
yogurt, fresh milk and UHT milk with a much lower risk perception, where less than 32%
of respondents had little or no confidence in the safety of these three products.
Table 4.4 Summary of the confidence level of food safety in different types of dairy products
The product perceived as having the highest risk was infant formula (76.6% of
respondents with little or no confidence). The dairy product perceived as having the
lowest risk was UHT milk (23.4 with little or no confidence). It seems clear that dairy
foods with a higher the degree of processing have more perceived safety risk.
How much confidence do you have in the safety of each of the following kinds of dairy products? Baby
Formula Flavoured Milk
Ice Cream
Yogurt Fresh milk
UHT milk
Not at all 24.2% 15.2% 13% 2.1% 3.3% 1.7%
A little 52.4% 51.8% 46.3% 29.0% 24.9% 21.7%
Somewhat 18.8% 29.6% 30.5% 51.5% 51.5% 52.7%
Very Much 4.6% 3.4% 10.2% 17.4% 17.4% 23.8%
Total(N=100%) (500) (494) (501) (518) (515) (516) (N, Don’t know) (28) (37) (28) (11) (13) (13) “High risk” category “Low risk” category

50
Table 4.5 Summary of concern over different potential food safety issues
Table 4.5 summarises concerns about different potential food safety issues. The level
of concern (“somewhat” and “very much”) is generally over 60%, suggesting a low
degree of general consumer confidence in food safety in China. The highest level of
concern was for “misuse and over use of food additives” (93.3%). This could help
explain what was found in Table 4.4 where consumers perceive more risk with dairy
products that are more highly processed. The next highest level was hormones and
antibiotics in meat (88.1%), followed by animal disease (84.4%), suggesting a higher
concern about the safety of animal products than other food groups. Interestingly, the
food safety issue with the lowest level of concern is the risk in GMO food, although it is
still high at about 60%.
Listed below are various issues that some people feel are related to food safety. How concerned are you about each of these issues ? Overuse/
Misuse of food additives
Residue of hormones and antibiotics in meat
Animal disease (mad cow, avian flu etc.)
Bacteria and virus contamination
Residue of pesticides and fertilizer in fruit and vegetables
Genetically Modified Food
Not at all 1.0% 1.4% 1.9% 1.7% 1.5% 9.2% A little 5.7% 10.6% 13.6% 16.5% 19.3% 31.3%
Somewhat 38.9% 37.1% 29.5% 33.1% 41.0% 30.1%
Very Much 54.4% 51.0% 55% 48.7% 38.1% 29.3%
Total (N=100%)
(524) (518) (515) (520) (522) (498)
(N, Don’t know)
(6) (12) (15) (9) (9) (33)
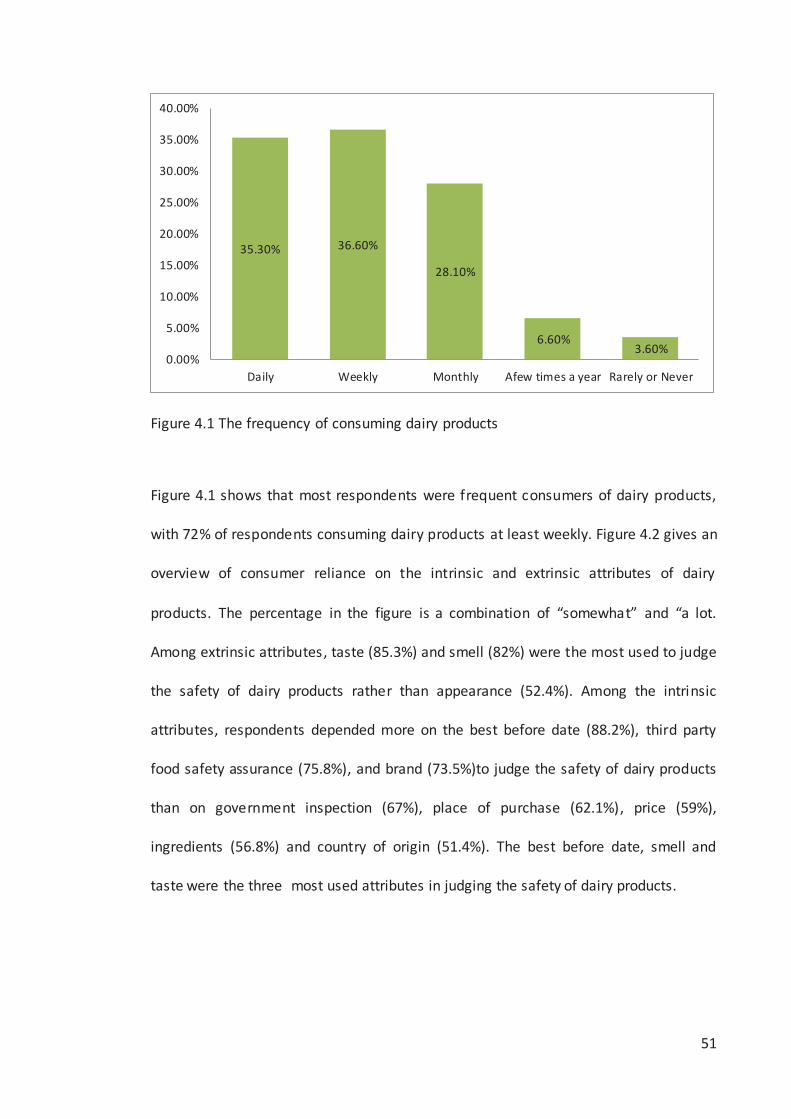
51
Figure 4.1 The frequency of consuming dairy products
Figure 4.1 shows that most respondents were frequent consumers of dairy products,
with 72% of respondents consuming dairy products at least weekly. Figure 4.2 gives an
overview of consumer reliance on the intrinsic and extrinsic attributes of dairy
products. The percentage in the figure is a combination of “somewhat” and “a lot.
Among extrinsic attributes, taste (85.3%) and smell (82%) were the most used to judge
the safety of dairy products rather than appearance (52.4%). Among the intrinsic
attributes, respondents depended more on the best before date (88.2%), third party
food safety assurance (75.8%), and brand (73.5%)to judge the safety of dairy products
than on government inspection (67%), place of purchase (62.1%), price (59%),
ingredients (56.8%) and country of origin (51.4%). The best before date, smell and
taste were the three most used attributes in judging the safety of dairy products.
35.30% 36.60%
28.10%
6.60% 3.60%
0.00%
5.00%
10.00%
15.00%
20.00%
25.00%
30.00%
35.00%
40.00%
Daily Weekly Monthly Afew times a year Rarely or Never
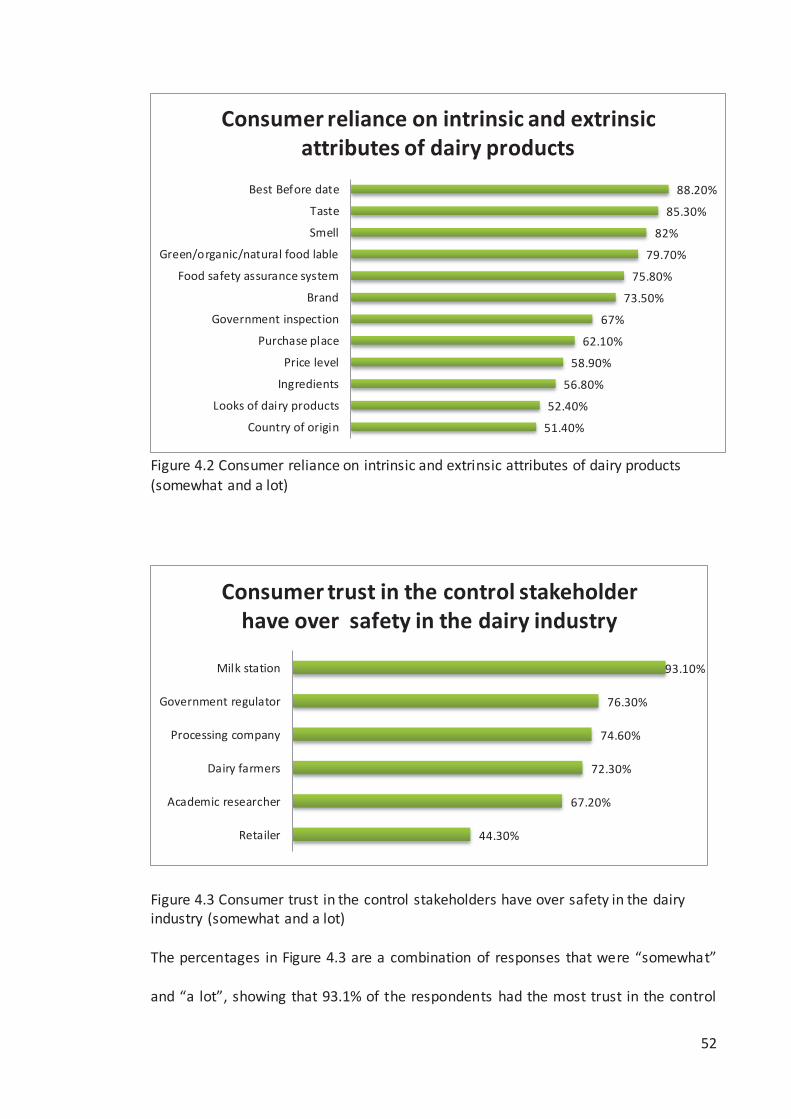
52
Figure 4.2 Consumer reliance on intrinsic and extrinsic attributes of dairy products (somewhat and a lot)
Figure 4.3 Consumer trust in the control stakeholders have over safety in the dairy industry (somewhat and a lot) The percentages in Figure 4.3 are a combination of responses that were “somewhat”
and “a lot”, showing that 93.1% of the respondents had the most trust in the control
51.40%
52.40%
56.80%
58.90%
62.10%
67%
73.50%
75.80%
79.70%
82%
85.30%
88.20%
Country of origin
Looks of dairy products
Ingredients
Price level
Purchase place
Government inspection
Brand
Food safety assurance system
Green/organic/natural food lable
Smell
Taste
Best Before date
Consumer reliance on intrinsic and extrinsic attributes of dairy products
44.30%
67.20%
72.30%
74.60%
76.30%
93.10%
Retailer
Academic researcher
Dairy farmers
Processing company
Government regulator
Milk station
Consumer trust in the control stakeholder have over safety in the dairy industry
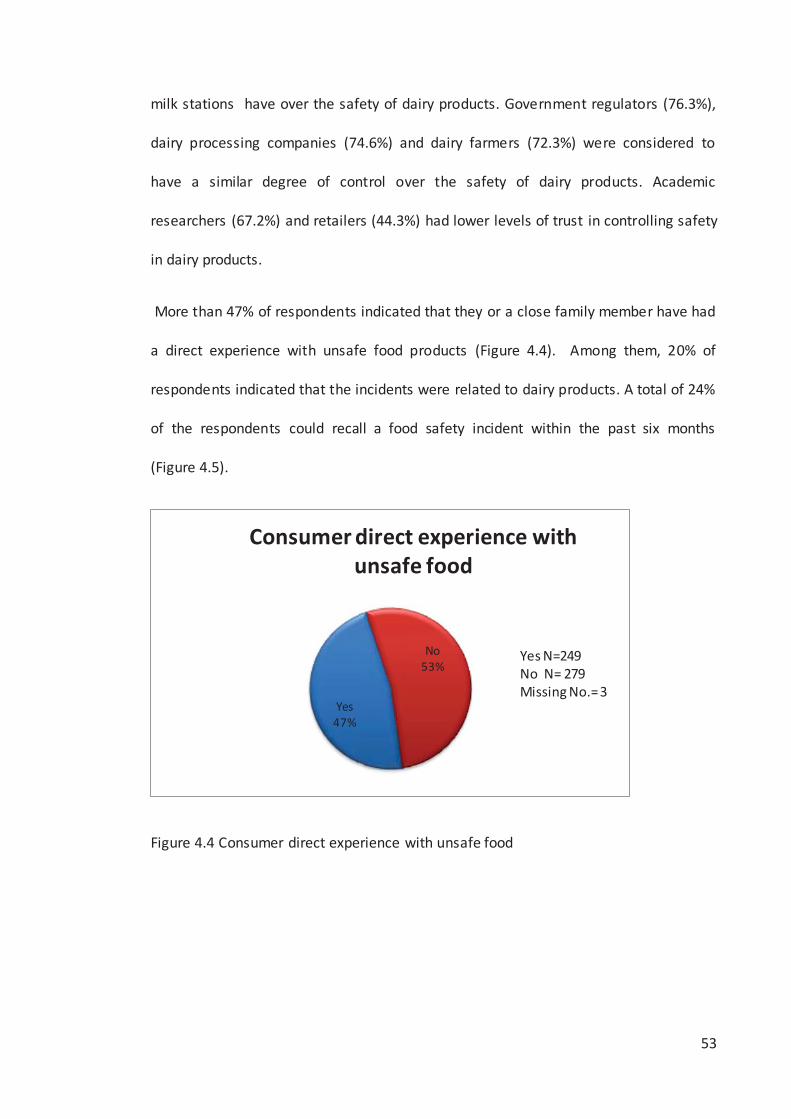
53
milk stations have over the safety of dairy products. Government regulators (76.3%),
dairy processing companies (74.6%) and dairy farmers (72.3%) were considered to
have a similar degree of control over the safety of dairy products. Academic
researchers (67.2%) and retailers (44.3%) had lower levels of trust in controlling safety
in dairy products.
More than 47% of respondents indicated that they or a close family member have had
a direct experience with unsafe food products (Figure 4.4). Among them, 20% of
respondents indicated that the incidents were related to dairy products. A total of 24%
of the respondents could recall a food safety incident within the past six months
(Figure 4.5).
Figure 4.4 Consumer direct experience with unsafe food
Yes 47%
No 53%
Consumer direct experience with unsafe food
Yes N=249 No N= 279 Missing No.= 3
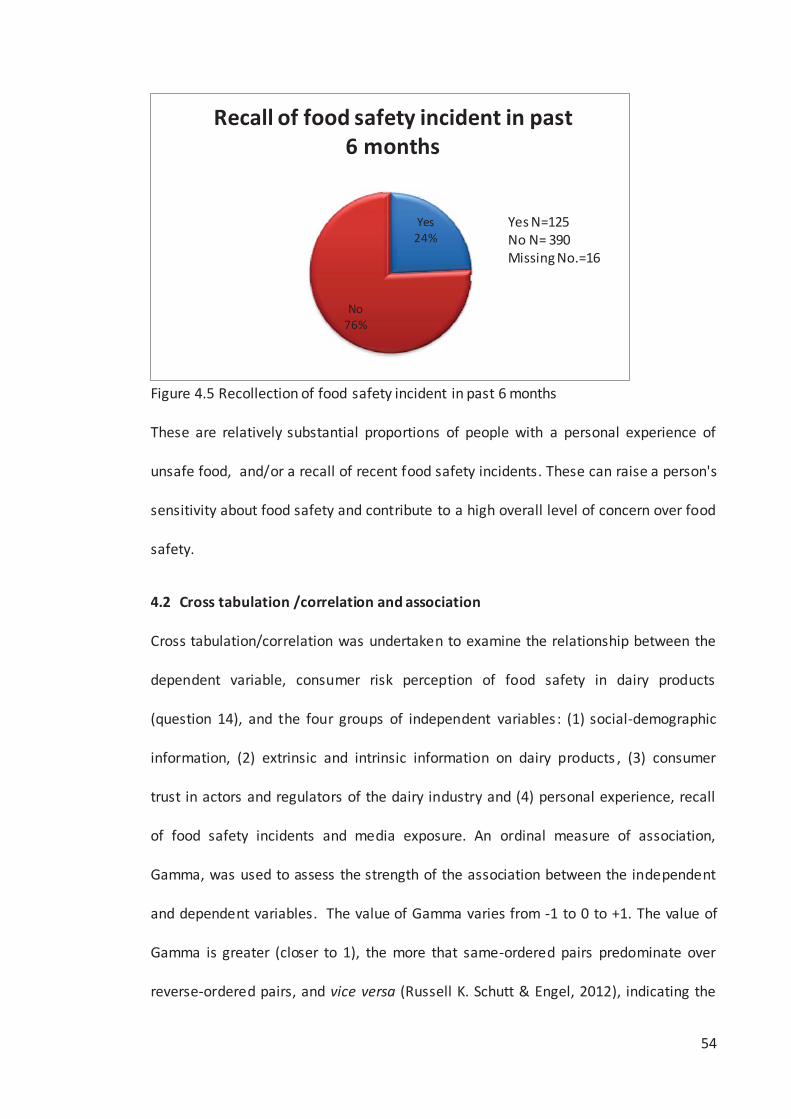
54
Figure 4.5 Recollection of food safety incident in past 6 months These are relatively substantial proportions of people with a personal experience of
unsafe food, and/or a recall of recent food safety incidents. These can raise a person's
sensitivity about food safety and contribute to a high overall level of concern over food
safety.
4.2 Cross tabulation /correlation and association
Cross tabulation/correlation was undertaken to examine the relationship between the
dependent variable, consumer risk perception of food safety in dairy products
(question 14), and the four groups of independent variables: (1) social-demographic
information, (2) extrinsic and intrinsic information on dairy products , (3) consumer
trust in actors and regulators of the dairy industry and (4) personal experience, recall
of food safety incidents and media exposure. An ordinal measure of association,
Gamma, was used to assess the strength of the association between the independent
and dependent variables. The value of Gamma varies from -1 to 0 to +1. The value of
Gamma is greater (closer to 1), the more that same-ordered pairs predominate over
reverse-ordered pairs, and vice versa (Russell K. Schutt & Engel, 2012), indicating the
Yes 24%
No 76%
Recall of food safety incident in past 6 months
Yes N=125 No N= 390 Missing No.=16

55
relative strength of the association. Also examined, was the level of significance (the P
value) of each association. Using the results from SPSS, the degree of association
between the independent variable and dependent variables were grouped into 3 levels:
relatively high, medium and low. The associations were also grouped as to whether
they were positive or negative according to the Gamma values.
In the questionnaire, the consumer risk perception of safety in dairy products was
measured by asking the respondents to react to “I consider consuming dairy products:
Not safe at all 1 2 3 4 5 Very safe” (See Appendix B, question no.14). Thus all the
correlations in following discussion need to be interpreted with this structure in mind.
A negative correlation with an independent variable suggests consumer risk perception
of safety in dairy products is high (less safe), a positive correlation with an independent
variable shows a low consumer risk perception of safety in dairy products (more safe).
4.2.1 The impact of social-demographic characteristics
The characteristics of respondents in terms of different social -demographic variables
are shown in Table 4.6. The percentage of male respondents (55.4%) was slightly
higher than female respondents (44.6%) . Most respondents had a monthly income of
less than 4000 (US$ 640) (80%). The education level of respondents is was primarily
in tertiary education (63.3%). A high proportion (41.6%) of respondents were married
and had children. This likely reflects the nature of the sample used in Lanzhou.
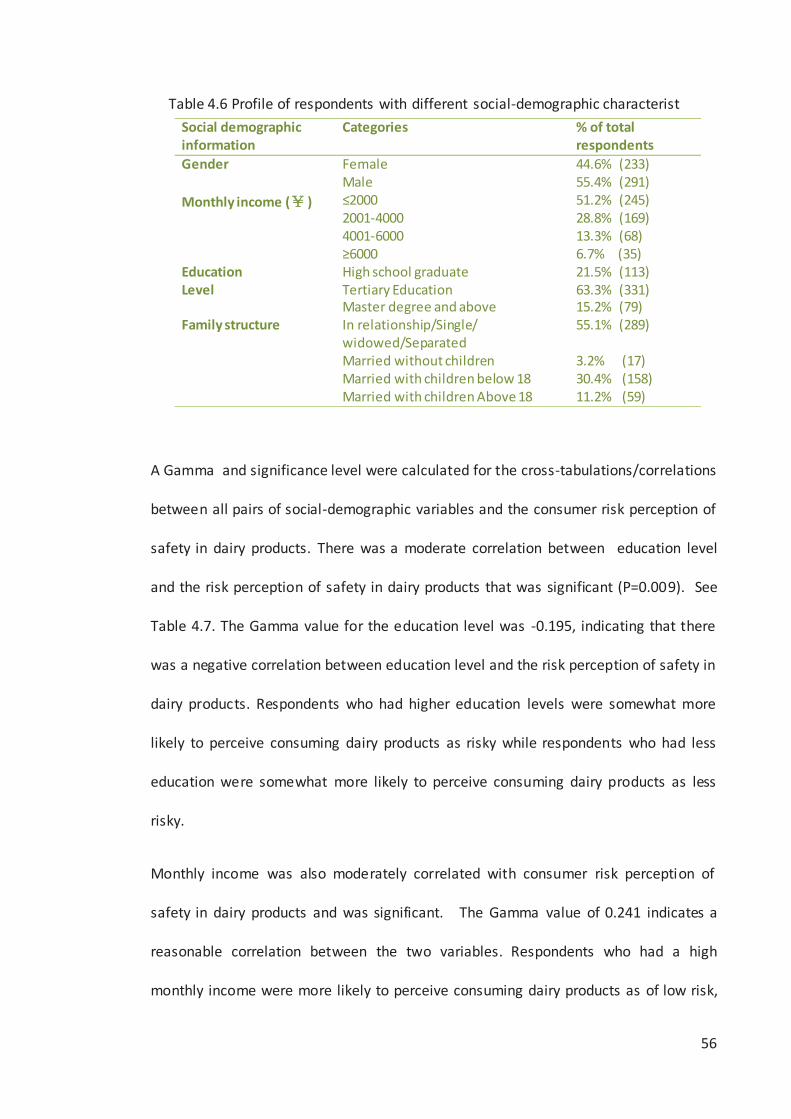
56
Table 4.6 Profile of respondents with different social-demographic characterist
A Gamma and significance level were calculated for the cross-tabulations/correlations
between all pairs of social-demographic variables and the consumer risk perception of
safety in dairy products. There was a moderate correlation between education level
and the risk perception of safety in dairy products that was significant (P=0.009). See
Table 4.7. The Gamma value for the education level was -0.195, indicating that there
was a negative correlation between education level and the risk perception of safety in
dairy products. Respondents who had higher education levels were somewhat more
likely to perceive consuming dairy products as risky while respondents who had less
education were somewhat more likely to perceive consuming dairy products as less
risky.
Monthly income was also moderately correlated with consumer risk perception of
safety in dairy products and was significant. The Gamma value of 0.241 indicates a
reasonable correlation between the two variables. Respondents who had a high
monthly income were more likely to perceive consuming dairy products as of low risk,
Social demographic information
Categories % of total respondents
Gender Female 44.6% (233) Male 55.4% (291)
Monthly income ( ) ≤2000 51.2% (245) 2001-4000 28.8% (169) 4001-6000 13.3% (68) ≥6000 6.7% (35)
Education Level
High school graduate 21.5% (113) Tertiary Education 63.3% (331) Master degree and above 15.2% (79)
Family structure In relationship/Single/ widowed/Separated
55.1% (289)
Married without children 3.2% (17) Married with children below 18 30.4% (158) Married with children Above 18 11.2% (59)

57
while respondents who had a low monthly income were more likely to perceive a high
risk in consuming dairy products, contrary to common belief that the education level
tends to be positively correlated to monthly income (Adu-Nyako & Thomposon, 1999;
Baker, 2003; Tonsor, et al., 2009). A possible explanation is the sample used in this
survey. Half of the respondents were college students, with little or no income. This
could be the reason that results regarding monthly income and education level were
going in different directions. Family structure was significantly correlated with the
consumer risk perception of safety in dairy products (Gamma =0.330). Consumers who
were married with children under 18 years old tended to perceive less risk in
consuming dairy products, compared to consumers not in this category. Gender made
very little difference in the consumer risk perception of safety in dairy products, with a
low correlation (Gamma=0.061) and p-value of 0.35.
Table 4.7 Association between consumer risk perception in the safety of dairy products and social demographic variables Social demographic Information
Gamma Value P
Gender 0.061 0.35 Monthly income 0.241 0.00 Education level -0.195 0.009 Family structure 0.330 0.00 Note: This is a summary of four sets of cross-tabulations/correlations analysis 4.2.2 The impact of the extrinsic and intrinsic attributes of dairy products
Among the three extrinsic attributes, taste, smell and appearance of dairy products,
taste and smell had a very modest correlation with consumer risk perception in safety
of dairy products. See Table 4.8. For the appearance of dairy products, there was a
more substantial correlation with consumer risk perception in the safety of dairy
products. The Gamma value was negative, -0.155, for the appearance of dairy
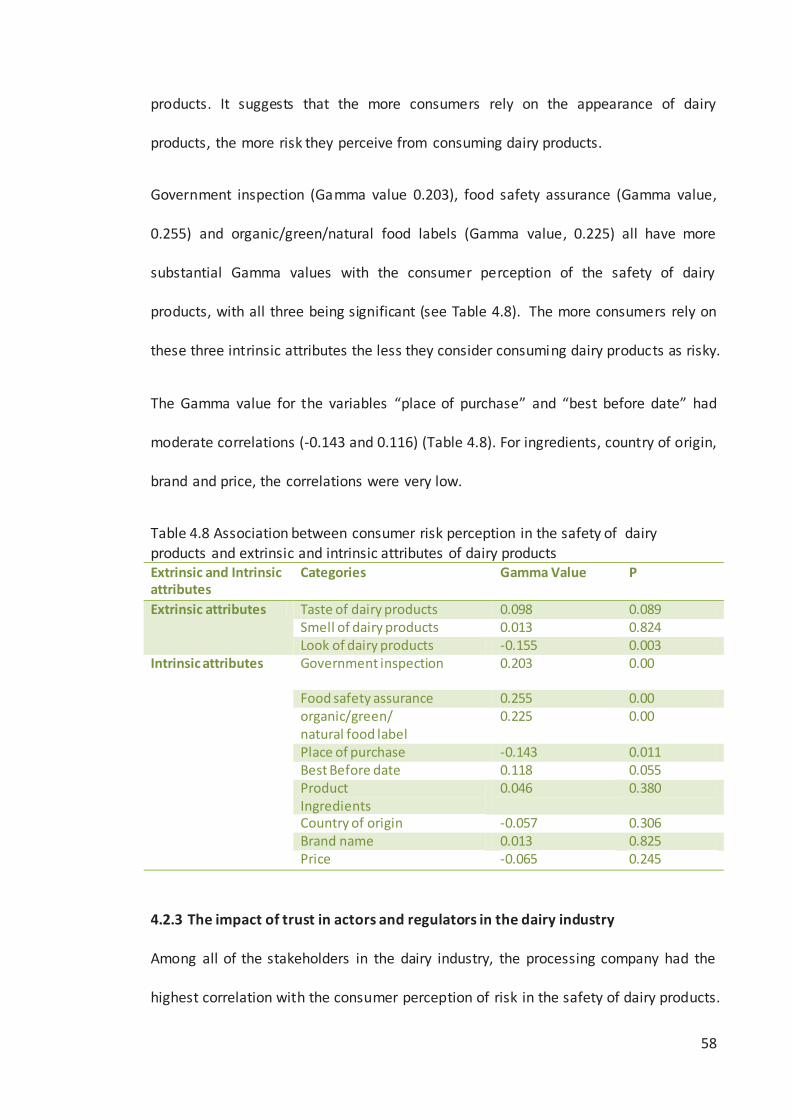
58
products. It suggests that the more consumers rely on the appearance of dairy
products, the more risk they perceive from consuming dairy products.
Government inspection (Gamma value 0.203), food safety assurance (Gamma value,
0.255) and organic/green/natural food labels (Gamma value, 0.225) all have more
substantial Gamma values with the consumer perception of the safety of dairy
products, with all three being significant (see Table 4.8). The more consumers rely on
these three intrinsic attributes the less they consider consuming dairy products as risky.
The Gamma value for the variables “place of purchase” and “best before date” had
moderate correlations (-0.143 and 0.116) (Table 4.8). For ingredients, country of origin,
brand and price, the correlations were very low.
Table 4.8 Association between consumer risk perception in the safety of dairy products and extrinsic and intrinsic attributes of dairy products Extrinsic and Intrinsic attributes
Categories Gamma Value P
Extrinsic attributes Taste of dairy products 0.098 0.089 Smell of dairy products 0.013 0.824 Look of dairy products -0.155 0.003
Intrinsic attributes
Government inspection 0.203 0.00
Food safety assurance 0.255 0.00 organic/green/ natural food label
0.225 0.00
Place of purchase -0.143 0.011 Best Before date 0.118 0.055 Product Ingredients
0.046 0.380
Country of origin -0.057 0.306 Brand name 0.013 0.825 Price -0.065 0.245
4.2.3 The impact of trust in actors and regulators in the dairy industry
Among all of the stakeholders in the dairy industry, the processing company had the
highest correlation with the consumer perception of risk in the safety of dairy products.
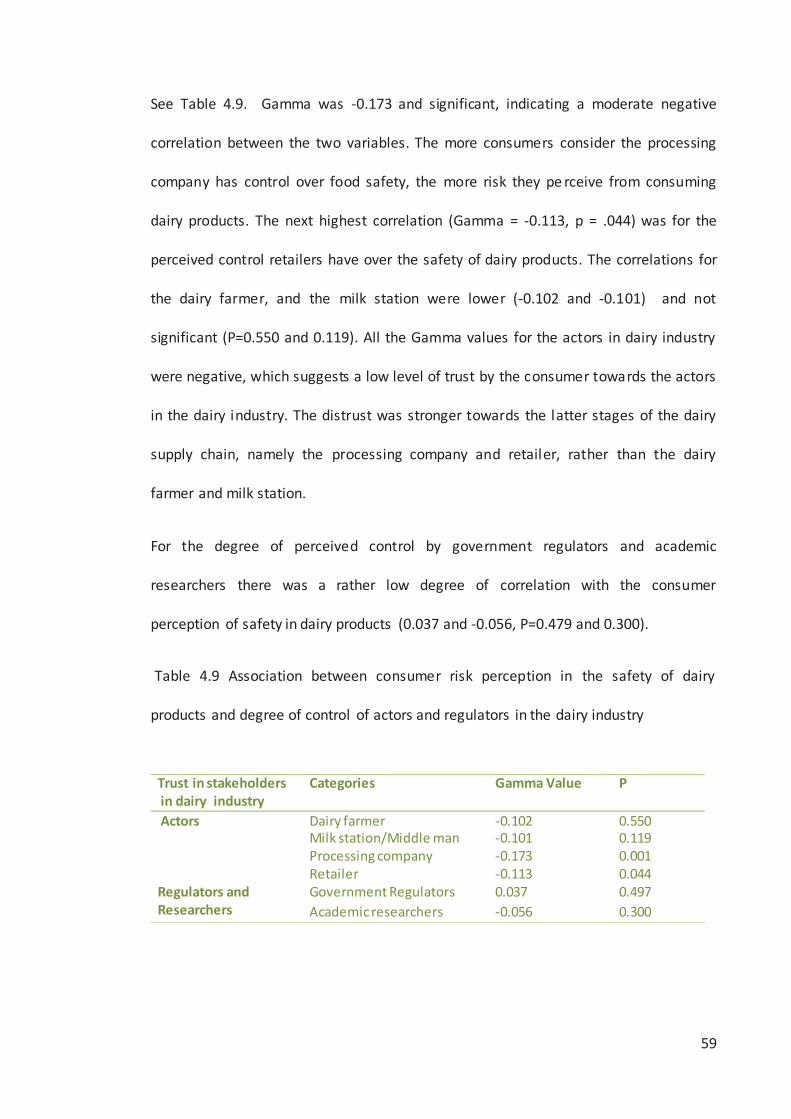
59
See Table 4.9. Gamma was -0.173 and significant, indicating a moderate negative
correlation between the two variables. The more consumers consider the processing
company has control over food safety, the more risk they pe rceive from consuming
dairy products. The next highest correlation (Gamma = -0.113, p = .044) was for the
perceived control retailers have over the safety of dairy products. The correlations for
the dairy farmer, and the milk station were lower (-0.102 and -0.101) and not
significant (P=0.550 and 0.119). All the Gamma values for the actors in dairy industry
were negative, which suggests a low level of trust by the consumer towards the actors
in the dairy industry. The distrust was stronger towards the latter stages of the dairy
supply chain, namely the processing company and retailer, rather than the dairy
farmer and milk station.
For the degree of perceived control by government regulators and academic
researchers there was a rather low degree of correlation with the consumer
perception of safety in dairy products (0.037 and -0.056, P=0.479 and 0.300).
Table 4.9 Association between consumer risk perception in the safety of dairy
products and degree of control of actors and regulators in the dairy industry
Trust in stakeholders in dairy industry
Categories Gamma Value P
Actors Dairy farmer -0.102 0.550 Milk station/Middle man -0.101 0.119 Processing company -0.173 0.001 Retailer -0.113 0.044
Regulators and Researchers
Government Regulators 0.037 0.497 Academic researchers -0.056 0.300
60
4.2.4 The impact of media exposure, direct experience and recall of food safety
incidents
Almost half of those surveyed have had a personal experience of being sick from
unsafe food. Almost one-quarter could recall food safety incidents in the past six
months. See Table 4.10. The correlation (Table 4.11) for personal experience was
substantial (Gamma = -0.209, P =0.001) with consumer risk perception of dairy
products. This suggests that consumers who have direct experience with unsafe food
tend to perceive more risk in consuming dairy products. The correlation between the
recall of incidents in which food safety was compromised and the perception of the
safety of dairy products was lower (-.085) and not significant (P=.209), suggesting that
the recall of food safety incidents is of less importance.
Consumer exposure to traditional media (newspapers/magazines, TV /radio) did not
have a significant correlation with the risk perception of the safety of dairy products.
See Table 4.12. The emerging media like online news and online social websites had
more substantial correlations with the consumer perception of food safety in dairy
products. The Gamma for online news was 0.118 (P=0.036) while for online social
websites Gamma was -0.207 (P=0.000). It appears that emerging media have more
impact on the consumer perception of safety in dairy products, although this may
related to the nature of the sample. Online news was positively associated with the
perception of the safety of dairy products, which means the more consumers accessed
online news, the less risk they perceived with the consumption of dairy products.
Online social websites was negatively correlated with the consumer perception of the
safety of dairy products, which means the more consumers access ed the information

61
from online social websites the more risk they perceived from consuming dairy
products.
Personal social networks like family, friends and colleagues were moderately
correlated with the consumer perception of safety in dairy products (-.161, P=.02).
The more consumers are exposed to information from their social network, the more
risk they perceive from consuming dairy products as shown in Table 4.12.
Table 4.10 Number and percentage of respondents with different personal experience and recall of unsafe food incidents
Table 4.11 Association between consumer risk perception in food safety of dairy products and direct experience and recall of food safety incidents Personal experience/Recall of incidents Gamma Value P
Personal experience with unsafe food -0.209 0.001
Recall of food safety incidents -0.085 0.209
Table 4.12 Association between consumer risk perception in food safety of dairy products and different categories of media exposure Media exposure Categories Gamma Value P
Newspaper/Magazine -0.08 0.83 TV/Radio -0.017 0.739 Online news 0.118 0.036 Online social website -0.207 0.00 Family/Friends/Colleague -0.161 0.02
4.2.5 Summary
In this section, the summarised results from the relationships between the dependent
variable (perception of safety of dairy products) and the four groups of independent
Personal experience/Recall of incidents Categories % of total respondents Personal experience With unsafe food
Yes 47.2% (248) No 52.8%(277)
Recall of food safety incidents
Yes 24.4%(125) No 75.6%(388)

62
variables, are examined. The independent variables can be divided into three groups
according to the their Gamma value with the dependent variable: a relatively high level
of association (a Gamma value of 0.200 or higher), a medium level of association (a
Gamma value between 0.100 and 0.199) and a relatively low level of association (a
Gamma values less than 0.100) (See table 4.13).
Table 4.13 The different levels of association between independent variable and dependent variables
Independent variables Gamma value Group of undependent variables
High (|Gamma|≥0.200)
Family Structure 0.330 Social-demographic Information Food safety assurance 0.255 Intrinsic attributes Monthly income 0.241 Social-demographic Information Organic/Green/Natural food label 0.225 Intrinsic attributes Direct Experience -0.209 Consumer experience Use of online social website 0.207 Media Exposure Government Inspection 0.203 Intrinsic attributes Education 0.195 Social-demographic Information The control of processing company
-0.173 Trust in actors and regulators of dairy industry
Medium (0.100≥|Gamma|≥0.199)
Family /Friends/Colleague -0.161 Media exposure Appearance of diary products -0.155 Extrins ic attributes Purchase place -0.143 Intrinsic attributes Control of milk s tation have over safety of dairy products
0.119 Trust in actors and regulators of dairy industry
Best before date 0.118 Intrinsic attributes
Use of online news 0.118 Media exposure Control of retailors have over safety of dairy products
-0.113 Trust in actors and regulators of dairy industry
Control of milk s tation have over safety of dairy farmers
-0.102 Trust in actors and regulators of dairy industry
Gender 0.061 Social-demographic Information Low (|Gamma| less than 0.100)
Taste 0.098 Extrins ic attributes
Newspaper/Magazine 0.088 Media exposure
Recall of food safety incidents -0.085 Recall of incidents
Price -0.065 Intrinsic attributes Country of origin -0.057 Extrins ic attributes Control of academic researcher have over safety of dairy products
-0.054 Trust in actors and regulators of dairy industry
Product ingredients -0.046 Intrinsic attributes Control of government regulators have over safety of dairy products
-0.037 Trust in actors and regulators of dairy industry
Smel l 0.013 Intrinsic attributes Brand name 0.013 Extrins ic attributes TV/Radio -0.017 Media exposure

63
4.3 Factor analysis
This section discusses the factor analyses that were conducted among the
independent variables and between the dependent variable (consumer risk
perception of safety of dairy products) and the independent variables. The first
purpose of the factor analyses was to see how the independent variables within
several conceptual groups clustered together, or otherwise, allowing the creation of a
set of composite variables (factors), each of which contained clusters of highly related
variables that were relatively unrelated to the other clusters of variables. These
factors were to be used as independent variables in the bivariate logistic regression.
The second purpose of the factor analyses provides another way of examining the
underlying relationships between the independent variables and the dependent
variable. This was achieved by taking the variables in each of the sets of created factors,
adding in the dependent variable, and rerunning the factor analysis to see how the
dependent variable loaded on each factor. Twenty nine variables were divided into
four groups based on the established conceptual frameworks.
Two factors emerged from the four variables in the conceptual framework of social-
demographic information submitted for factor analysis (see Table 4.14). The two
factors explained 68.09% of the variation in the data. Four factors were extracted from
the twelve variables in the conceptual framework of extrinsic and intrinsic attributes.
These four factors explained 55.56% of the variance (see Table 4.15). Two factors were
extracted from six variables in the conceptual framework of trust in the control of
actors and regulators of dairy industry (see Table 4.16). The two factors explained 54.2%
of the variance. Three factors were extracted from seven variables in the conceptual
64
framework of media exposure, personal experience with unsafe food, and recall of
food incidents (see Table 4.17). These three factors explained 62.42% of the variance.
4.3.1 Factor interpretation
Each factor was subsequently named according to the construct they represented. The
nine factors were named: (1) SD1 (education level, monthly income, family structure),
SD2 (Gender); (2) RA1 (Reliance on place of purchase/brand na me/ country of origin/
product ingredients/ price); RA2 (Reliance on products food safety
assurance/government inspection/labeled organic, green, natural food); RA3 (Reliance
on taste/smell/appearance of dairy products); RA4 (Reliance on best before date); (3)
TC1 (Trust in the control of dairy farmer/milk station/processing company/retailor);
TC2 (Trust in government inspection/academic researcher); (4) M/E1 (use of online
social website/use of online news/information from family, friends and colleague)
M/E2 (use of newspaper and magazine/use of TV and radio) M/E3 (direct experience
with unsafe food/recall of food safety incidents in last 6 months). SD stands for social-
demographic information. RA stands for reliance on attributes. TC stands for trust in
the control. M/E stands for media and experience.
4.3.2 Factor analysis of demographic information and dependent variable
The loading of the dependent variable on SD1 (family structure, income, education)
was larger than its loading on SD2 (gender), which suggests that factor SD1 has a more
notable relationship with the dependent variable than factor SD2. The loading of the
dependent variable on either factor was less than 0.5, which suggests the relationship
with the consumer perception of safety in dairy products is moderate at best (see
Table4.14).
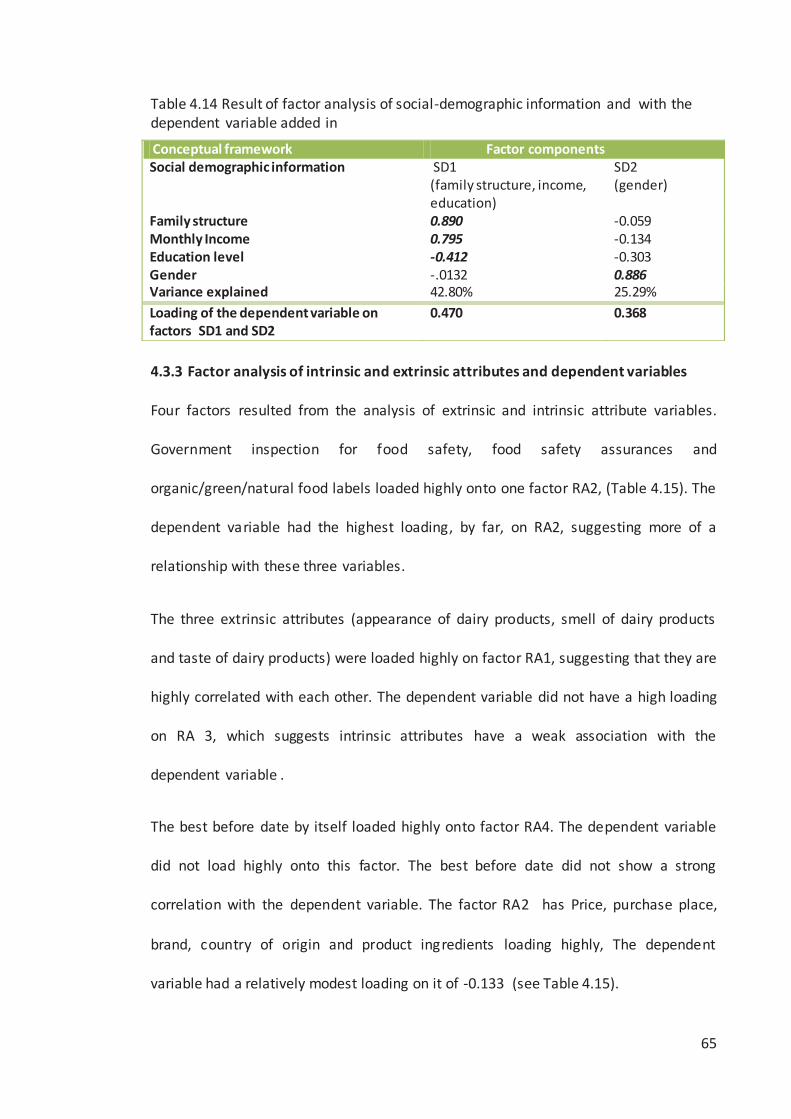
65
Table 4.14 Result of factor analysis of social-demographic information and with the dependent variable added in
4.3.3 Factor analysis of intrinsic and extrinsic attributes and dependent variables
Four factors resulted from the analysis of extrinsic and intrinsic attribute variables.
Government inspection for food safety, food safety assurances and
organic/green/natural food labels loaded highly onto one factor RA2, (Table 4.15). The
dependent variable had the highest loading, by far, on RA2, suggesting more of a
relationship with these three variables.
The three extrinsic attributes (appearance of dairy products, smell of dairy products
and taste of dairy products) were loaded highly on factor RA1, suggesting that they are
highly correlated with each other. The dependent variable did not have a high loading
on RA 3, which suggests intrinsic attributes have a weak association with the
dependent variable .
The best before date by itself loaded highly onto factor RA4. The dependent variable
did not load highly onto this factor. The best before date did not show a strong
correlation with the dependent variable. The factor RA2 has Price, purchase place,
brand, country of origin and product ingredients loading highly, The dependent
variable had a relatively modest loading on it of -0.133 (see Table 4.15).
Conceptual framework Factor components Social demographic information SD1
(family structure, income, education)
SD2 (gender)
Family structure 0.890 -0.059 Monthly Income 0.795 -0.134 Education level -0.412 -0.303 Gender -.0132 0.886 Variance explained 42.80% 25.29% Loading of the dependent variable on factors SD1 and SD2
0.470 0.368
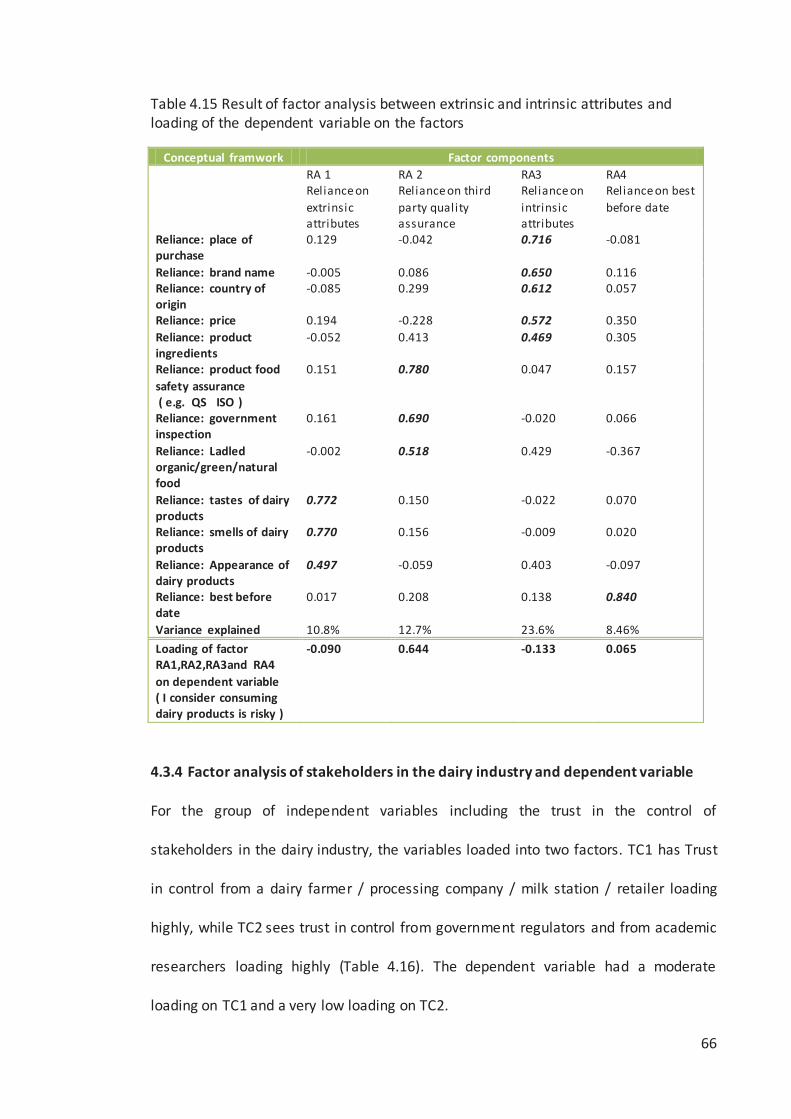
66
Table 4.15 Result of factor analysis between extrinsic and intrinsic attributes and loading of the dependent variable on the factors
4.3.4 Factor analysis of stakeholders in the dairy industry and dependent variable
For the group of independent variables including the trust in the control of
stakeholders in the dairy industry, the variables loaded into two factors. TC1 has Trust
in control from a dairy farmer / processing company / milk station / retailer loading
highly, while TC2 sees trust in control from government regulators and from academic
researchers loading highly (Table 4.16). The dependent variable had a moderate
loading on TC1 and a very low loading on TC2.
Conceptual framwork Factor components RA 1
Reliance on extrinsic attributes
RA 2 Reliance on third party quality assurance
RA3 Reliance on intrinsic attributes
RA4 Reliance on best before date
Reliance: place of purchase
0.129 -0.042 0.716 -0.081
Reliance: brand name -0.005 0.086 0.650 0.116 Reliance: country of origin
-0.085 0.299 0.612 0.057
Reliance: price 0.194 -0.228 0.572 0.350 Reliance: product ingredients
-0.052 0.413 0.469 0.305
Reliance: product food safety assurance ( e.g. QS ISO )
0.151 0.780 0.047 0.157
Reliance: government inspection
0.161 0.690 -0.020 0.066
Reliance: Ladled organic/green/natural food
-0.002 0.518 0.429 -0.367
Reliance: tastes of dairy products
0.772 0.150 -0.022 0.070
Reliance: smells of dairy products
0.770 0.156 -0.009 0.020
Reliance: Appearance of dairy products
0.497 -0.059 0.403 -0.097
Reliance: best before date
0.017 0.208 0.138 0.840
Variance explained 10.8% 12.7% 23.6% 8.46% Loading of factor RA1,RA2,RA3and RA4 on dependent variable ( I consider consuming dairy products is risky )
-0.090 0.644 -0.133 0.065

67
Table 4.16 Result of factor analysis of consumer trust in stakeholders in dairy industry with dependent variable added in
4.3.5 Media exposure, personal experience and recall of incidents and dependent
variable
The factor analysis of media exposure, experience with unsafe food,and recall of food
incidents produced three factors: M/E1 with the use of online social website, online
news and family /friend /colleagues loading highly; M/E2 with use of TV/Radio and the
use of newspaper and magazine loading highly and M/E3 with personal experience and
recall of food safety incidents having high loadings. M/E1 explained the most variance
and the dependent variable had a moderate loading (-0.327). The loading of the
dependent variable on M/E2 was very low. The dependent variable had the highest
loading on M/E 3 (-0.555), which indicates that personal experience with unsafe food
and the recall of a food safety incident were of more importance in relation to
consumer risk perception of safety of dairy products (see Table 4.17).
Conceptual framework Factor components TC1
Trust in the control of actors of dairy industry
TC2 Trust in the control of regulators and researchers of dairy industry
Trust: dairy farmer 0.768 -.0.085 Trust: processing company 0.752 0.110 Trust: milk station 0.524 0.418 Trust: retailors 0.515 0.125 Trust: government regulators 0.080 0.837 Trust: academic research 0.067 0.798 Variance explained 34.24% 19.97% Loading of the dependent variable on factors TC1 and TC2
-0.383 -0.024

68
Table 4.17 Factor analysis of consumer media exposure, personal experience with
unsafe food, recall of food safety incidents and with the dependent variable added in. Conceptual Framework Factor Component
M/E1 Use of Internet Media and social network
M/E2 Use of traditional media
M/E 3 Personal Experience and recall of food safety incidence
Use of online social website 0.869 -0.118 0.090 Use of online News 0.849 0.149 0.008 Information from Family/Friends/Colleague
0.474 0.427 0.066
Use of Newspaper/Magazine 0.011 0.799 0.040 Use of TV/Radio 0.059 0.778 0.025 Personal Experience with unsafe food 0.050 -0.069 0.777 Recall of food safety incidents 0.046 0.141 0.697 Variance explained 28.48% 18.97% 14.97% Loading of the dependent variable on factors M/E1,M/E2 and M/E3
-0.327 -0.075 -0.555
4.3.6 Summary
By using factor analysis, new factors (composite variables) were created. The new
factors are each comprised of variables that are highly correlated, suggesting they
share common underlying traits. The dependent variable was included in a series of
factor analyses for each group of variables to see which of the created factors of
independent variables were most related to the dependent variable. This can be seen
by examining the loading of the dependent variable on each factor. It can be
concluded from the above analysis that a high loading of the dependent variable on
particular factors suggests a substantial association between the dependent variable
and the independent variables that comprise the factor. Among demographic variables
the factor representing family structure, monthly income and education level had a
more substantial relationship with the dependent variable than did the factor
representing gender. In the conceptual framework of extrinsic and intrinsic attributes
the factor representing government inspection, food safety assurance and green

69
/organic/natural food labels had a stronger association with the dependent variable
than any of the other factors representing intrinsic and extrinsic attributes. In the
group that included trust in the stakeholders in the dairy industry, neither of the
factors representing these independent variables indicated a particularly strong
relationship with the dependent variable. Note, however, that the factor (TC1) with
trust in dairy farmers, the processing company, the milk station and the retailer was
substantially more important to the dependent variable, than the factor with trust in
government regulators and researchers. In the group that included media exposure,
personal experience with unsafe food and recall of incidents the loading of the
dependent variable on the factor (M/E3) with personal experience and recall of food
safety incidents was the most substantial, more so than the loading on M/E1 (online
sources) or especially M/E2 (traditional media) (see Table 4.18).
Table 4.18 Summary of factors with the highest loading results of factor analysis Groups Variables Factors Loading of dependent
variable on the factor
Social-demographic information
Monthly income SD1 0.470 Family structure Education level
Reliance on extrinsic and intrinsic attributes
government inspection RA2 0.644 food safety assurance green /organic/natural food label
Trust in control of stakeholder in dairy industry
Processing company,dairy farmer,retailor,milke station
TC1 -0.383
media use, personal experience and recall of incidents
Personal experience and recall of incidents
M/E3 -0.555

70
4.4 Results from the binary logistic regression
Binary Logistic Regression was used to examine the impact of four conceptual groups
of variables: (1) the social-demographic information of respondents, (2) consumer
reliance on extrinsic and intrinsic attributes, (3) trust in the control of stakeholders
over food safety in the dairy industry, (4) media exposure, personal experience with
unsafe food and recall of food safety incidents. A dichotomous dependent variable
takes a value of 0 when the respondents consider consuming dairy products is not safe
all, not safe or neither and 1 when the respondents consider consuming dairy products
as safe or very safe.
The outliers were examined and removed from the analysis to reduce the effects of
their influence. The Pearson correlation matrix was inspected for the correlations
between the independent variables. No correlations exceeded 0.90. As a result, the
assumption of multi-collinearity was satisfied.
To conduct the binary logistic regression, factors were created by conducting three
different factor analyses with three conceptual groups of variables according to their
underlying traits. Factor scores were used to create new variables for the binary
logistic regression. Nine factors were extracted from the three groups of independent
variables: (1) consumer reliance on extrinsic and intrinsic attributes, (2) trust in the
control of stakeholders over food safety in dairy industry, (3) media exposure, personal
experience with unsafe food and recall of food safety incidents (Table 4.19). Note that
the social-demographic variables were used in the regression as separate variables,
rather than as composite variables based on factors.

71
Table 4.19 List of variables for the binary logistic regression
The outliers were examined and removed from the analysis to reduce the effects of
their influence. The Pearson correlation matrix was inspected for the correlations
between the independent variables. No correlations exceeded 0.90. As a result, the
assumption of multi-collinearity was satisfied.
To conduct a binary logistic regression, factors were created by conducting three
different factor analyses with the three groups of variables according to their
underlying traits. Factor scores were used to create new variables for the binary
logistic regression. Nine factors were extracted from three groups of independent
variables: (1) consumer reliance on extrinsic and intrinsic attributes, (2) trust in the
Variables Description Dependent variable Consumer risk perception of food safety in dairy products
Y=1, the respondents consider consuming dairy products as safe or very safe Y=0, the respondents consider consuming dairy products not safe all, not safe or neither
Independent variables Social demographic information Monthly income
Family Structure Education level Gender
Reliance on Extrinsic and Intrinsic attributes of dairy products
RA 1 Reliance on extrinsic attributes RA 2 Reliance on third party quality assurance RA 3 Reliance on intrinsic attributes RA 4 Reliance on best before date
Trust in the control of stakeholder in dairy industry
TC 1 Trust in actors of dairy industry TC 2 Trust in regulators and researcher of dairy
industry
Media Exposure Personal Experience and recall of food safety incidence
M/E 1 Use of internet media M/E 2 Use of traditional media M/E 3 Personal Experience and recall of food
safety incidence

72
control of stakeholders over food safety in dairy industry, (3) media exposure, personal
experience and recall of food safety incidents.
The results from the Omnibus Test of Model Coefficients was used to suggest that the
full model significantly increased the ability to predict the risk perception of
respondents, compared to a model with an intercept only, χ2(13,N=531)=63.33,
p<0.000. The model is capable of correctly classifying 91.1% of those who consider
consuming dairy products as very safe, safe and neither safe or not safe and 32.0% of
those who consider consuming dairy products as very safe, for an overall correct rate
of 72.7%. The p-value of the Homers and Lemes-how Test was 0.459 and indicated that
it was non-significant. Hence, the model fits the data well.
Table 4.20 lists the Binary Logistic Regression coefficients, p-values, and odds ratios for
each of the independent variables. Family structure, RA2 (Reliance on third party
quality assurance) and RA3 (Reliance on intrinsic attributes) had significant partial
effects (p<0.05). The odds ratio for “Family structure” indicated that when keeping all
other independent variables constant, a respondent with children under 18 years old is
5.13 times more likely to consider consuming dairy products as safe compared to the
respondents with children above 18 years old or having no children. The odds ratio for
RA3“Reliance on intrinsic attributes” indicates that that when keeping all other
independent variables constant, a respondent who relies on intrinsic attributes is 1.3
times more likely to consider consuming dairy products as not risky than respondents
that do not rely on intrinsic attributes. The coefficient B for RA2“Reliance on third
party quality assurance” was negative. Inverting the odds ratio for “Reliance on third
party quality assurance” suggested that the odds of respondents considering the
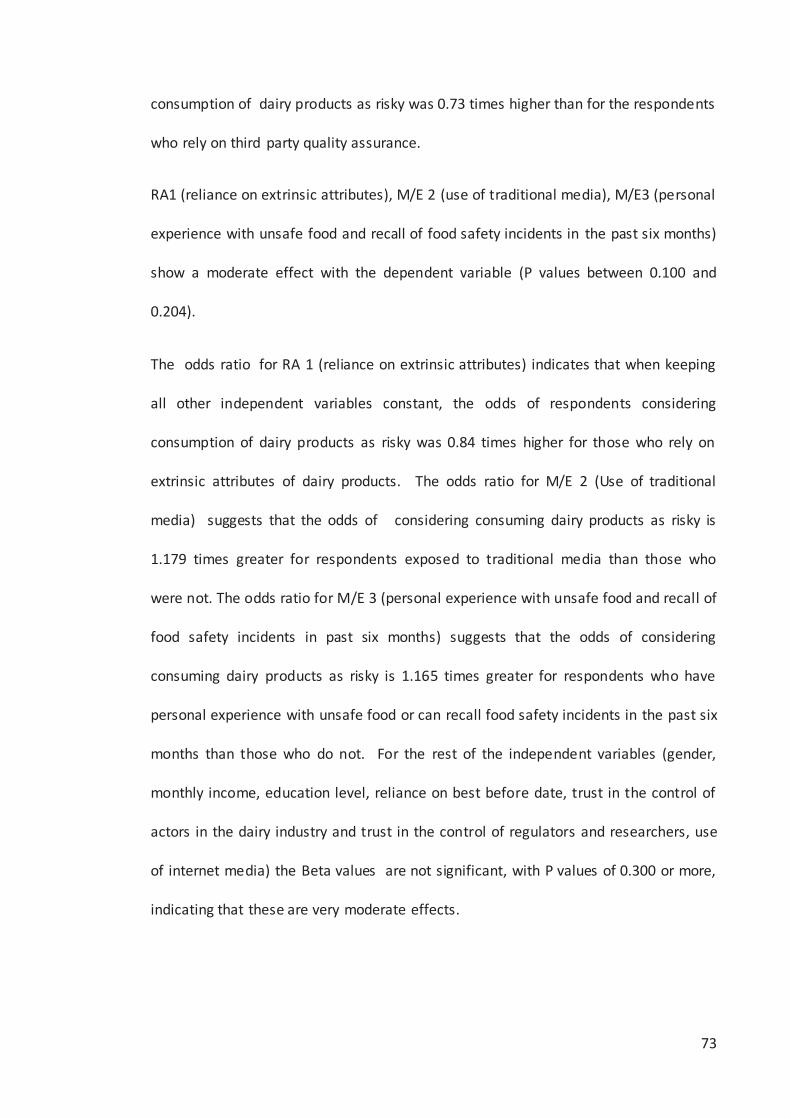
73
consumption of dairy products as risky was 0.73 times higher than for the respondents
who rely on third party quality assurance.
RA1 (reliance on extrinsic attributes), M/E 2 (use of traditional media), M/E3 (personal
experience with unsafe food and recall of food safety incidents in the past six months)
show a moderate effect with the dependent variable (P values between 0.100 and
0.204).
The odds ratio for RA 1 (reliance on extrinsic attributes) indicates that when keeping
all other independent variables constant, the odds of respondents considering
consumption of dairy products as risky was 0.84 times higher for those who rely on
extrinsic attributes of dairy products. The odds ratio for M/E 2 (Use of traditional
media) suggests that the odds of considering consuming dairy products as risky is
1.179 times greater for respondents exposed to traditional media than those who
were not. The odds ratio for M/E 3 (personal experience with unsafe food and recall of
food safety incidents in past six months) suggests that the odds of considering
consuming dairy products as risky is 1.165 times greater for respondents who have
personal experience with unsafe food or can recall food safety incidents in the past six
months than those who do not. For the rest of the independent variables (gender,
monthly income, education level, reliance on best before date, trust in the control of
actors in the dairy industry and trust in the control of regulators and researchers, use
of internet media) the Beta values are not significant, with P values of 0.300 or more,
indicating that these are very moderate effects.
74
Table 4.20 Results of the binary logistic regressionIndependent variable B P value Exp B
(Odds ratio ) Social demographic information Monthly income -0.034 0.828 0.967 Family Structure 1.635 0.000 5.132 Education level 0.021 0.875 1.021 Gender 0.105 0.660 1.111 Reliance on Extrinsic and Intrinsic attributes of dairy products
RA 3 Reliance on intrinsic attributes 0.262 0.032 1.300 RA 2 Reliance on third party quality
assurance -0.306 0.015 0.737
RA1 Reliance on extrinsic attributes -0.174 0.121 0.840 RA 4 Reliance on best before date -0.117 0.323 0.889 Trust in stakeholder of dairy industry
TC 1 Trust in the control of actors of dairy industry
0.115 0.358 1.122
TC 2 Trust in the control of government regulators and researchers
-0.022 0.861 0.978
Media Exposure
M/E 1 Use of internet media and social network
0.129 0.415 1.138
M/E 2 Use of traditional media 0.164 0.204 1.179 M/E 3 Personal Experience with unsafe
food Recall of food safety incidents
0.153 0.181 1.165

75
Discussion CHAPTER 5
5.1 Introduction
This study investigated what consumers consider to be risky in food safety and the
factors that impact on consumer risk perception in the safety of dairy products in
China. These factors include social-demographic characteristics of the individual (e.g.
gender, education level , income level, family structure), consumer trust in the control
of the stakeholders over safety in the dairy industry, the reliance on extrinsic and
intrinsic attributes, direct experience with unsafe food, media exposure and recall of
food safety incidents. A general summary of the results is presented first in this
chapter, followed by a discussion and interpretation of those results. Finally, the
implications, recommendations, limitations, poss ible direction for future study and
conclusions of the study are presented.
5.2 Summary of results
The results and findings of this study present a picture of the consumer risk perception
of dairy products in China. The results showed the confidence level of consumers in
China and their perception of different food groups, different dairy products, dairy
products from different countries of origin and potential food safety issues. While the
majority of the respondents (69.7%) indicated they do not have sufficient confidence
in the food safety of dairy products in China, the confidence level toward food safety in
general in China was even lower, with only 17.4% of respondents indicating that they
have confidence in general food safety .

76
Among all the food groups listed in the questionnaire (processed meat, fresh meat,
cooking oil, dairy products and fresh fruit and vegetables) processed meat was
considered as the most risky in terms of food safety. Fresh fruit and vegetables were
considered the least risky group. Dairy products were considered less risky than
processed meat, fresh meat and cooking oil in terms of food safety. The results suggest
that respondents have a higher concern over the safety of animal products than plant
products in terms of food safety. Among all the dairy product groups listed in the
questionnaire (baby formula, flavoured milk, ice cream, yogurt, fresh milk and UHT
milk), baby formula, flavoured milk and ice cream were considered to have a higher
risk of food safety than groups of less processed dairy products like UHT milk, fresh
milk and yogurt. This suggests that respondents considered more highly processed
dairy products to have a higher risk of food safety than the less processed products.
Among potential food safety issues (overuse or misuse of food additives, hormones
and antibiotics, animal disease, bacteria and viruses, pesticides and fertilisers in fruits
and vegetables, genetically modified food) overuse and misuse food additives was the
highest on the list in terms of the risk of food safety perceived by consumers with
93.3% of the respondents indicating they were concerned. This result explains
respondents’ concerns about processed meat and processed dairy products. GMO
food was perceived as being one of the least concerning potential food safety issues,
yet the percentage of respondents concerned about GMO food was still over 59%.
The results point to the overall consumer confidence level in food safety in China as
being rather low.
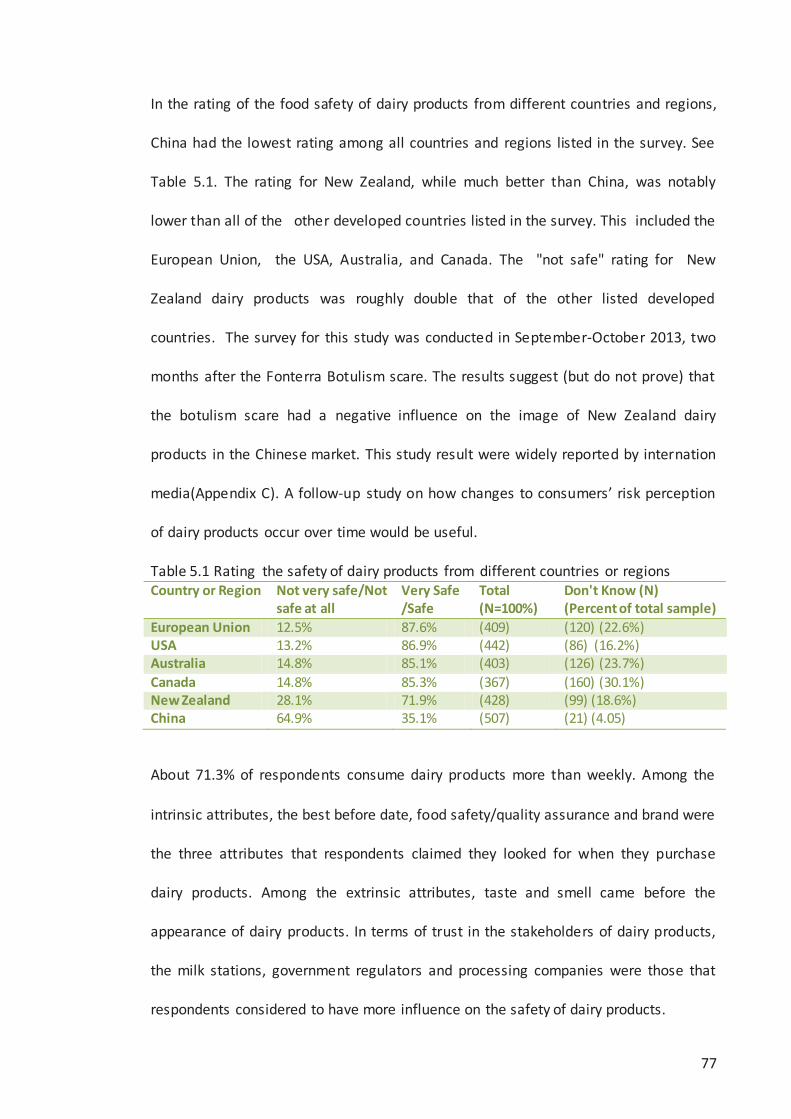
77
In the rating of the food safety of dairy products from different countries and regions,
China had the lowest rating among all countries and regions listed in the survey. See
Table 5.1. The rating for New Zealand, while much better than China, was notably
lower than all of the other developed countries listed in the survey. This included the
European Union, the USA, Australia, and Canada. The "not safe" rating for New
Zealand dairy products was roughly double that of the other listed developed
countries. The survey for this study was conducted in September-October 2013, two
months after the Fonterra Botulism scare. The results suggest (but do not prove) that
the botulism scare had a negative influence on the image of New Zealand dairy
products in the Chinese market. This study result were widely reported by internation
media(Appendix C). A follow-up study on how changes to consumers’ risk perception
of dairy products occur over time would be useful.
Table 5.1 Rating the safety of dairy products from different countries or regions Country or Region Not very safe/Not
safe at all Very Safe /Safe
Total (N=100%)
Don't Know (N) (Percent of total sample)
European Union 12.5% 87.6% (409) (120) (22.6%) USA 13.2% 86.9% (442) (86) (16.2%) Australia 14.8% 85.1% (403) (126) (23.7%) Canada 14.8% 85.3% (367) (160) (30.1%) New Zealand 28.1% 71.9% (428) (99) (18.6%) China 64.9% 35.1% (507) (21) (4.05)
About 71.3% of respondents consume dairy products more than weekly. Among the
intrinsic attributes, the best before date, food safety/quality assurance and brand were
the three attributes that respondents claimed they looked for when they purchase
dairy products. Among the extrinsic attributes, taste and smell came before the
appearance of dairy products. In terms of trust in the stakeholders of dairy products,
the milk stations, government regulators and processing companies were those that
respondents considered to have more influence on the safety of dairy products.

78
About 24% of respondents indicated that they or a close family member had direct
experience with unsafe food. Over 47% of respondents could recall food safety
incidents in the past six months.
Results from the cross-tabulations/correlations gave a picture of the interrelationship
between variables that impact on consumer risk perception in food safety (the
independent variables) and consumer risk perception in dairy food safety (dependent
variable). Gamma (an ordinal measure of association) and its associated measure of
significance were used to determine the magnitude of importance of the independent
variables in relation to dairy food safety. The independent variables were divided into
three groups according to their Gamma value: a relatively high level of association
(Gamma 0.200 or more), a medium level of association (Gamma between 0.100 and
0.199) and a relatively low level of association (Gamma less than 0.100) with the
dependent variable. The results indicated that the following variables have a relatively
high association with the dependent variable, consumer risk perception of safety in
dairy products,: education level, family structure, food safety assurance, organic/green
/natural food labels, government inspection, direct experience with unsafe food and
the use of online social websites. The results are presented in Table 5.2

79
Table 5.2 Summary of results of the degree of association between consumer risk perception of safety in dairy products and the independent variables
Independent variables Gamma value
Group of independent variables
High (|Gamma|≥0.200)
Family Structure 0.330 Social-demographic Information Monthly income 0.241 Social-demographic
Information Food safety assurance 0.255 Extrinsic attributes Organic/Green/Natural food labels
0.225 Extrinsic attributes
Direct Experience -0.209 Consumer experience Use of online social website 0.207 Media Exposure Government Inspection 0.203 Extrinsic attributes
Medium (0.100≥|Gamma|≥0.199
Education level 0.195 Social-demographic Information
The control of processing company
-0.173 Trust in actors and regulators of dairy industry
Family /Friends/Colleagues -0.161 Media exposure
Appearance of dairy products
-0.155 Intrinsic attributes
Purchase place -0.143 Extrinsic attributes
Control milk station has over safety of dairy products
0.119 Trust in actors and regulators of dairy industry
Best before date 0.118 Extrinsic attributes
Use of online news 0.118 Media exposure
Control retailers have over safety of dairy products
-0.113 Trust in actors and regulators of dairy industry
Control of milk station over safety of dairy farmers
-0.102 Trust in actors and regulators of dairy industry
Low (|Gamma|≤0.099)
Gender 0.061 Social-demographic Information
Taste 0.098 Intrinsic attributes
Newspaper/Magazine 0.088 Media exposure
Recall of food safety incidents
-0.085 Recall of incidents
Price -0.065 Extrinsic attributes Country of origin -0.057 Extrinsic attributes Control academic researcher has over safety of dairy products
-0.054 Trust in actors and regulators of dairy industry
Product ingredients -0.046 Extrinsic attributes Control of government over safety of dairy products
-0.037 Trust in actors and regulators of dairy industry
Smell 0.013 Intrinsic attributes Brand name 0.013 Extrinsic attributes TV/Radio -0.017 Media exposure

80
Factor analyses were conducted for two purposes: (1) to create new composite
variables (factors) within each of four conceptual frameworks of independent
variables, ultimately for use (via factor scores) in a binary logistic regression; (2) to
examine how much the dependent variable loaded on each of these factors. A factor
analysis was conducted in each conceptual group of independent variables. Eleven
factors were extracted from the four conceptual frameworks. Two factors were
extracted from the variables of social demographic information. Four factors were
extracted from the variables of extrinsic and intrinsic attributes of dairy products. Two
factors were extracted from trust in the control of stakeholders in dairy products.
Three factors were extracted from the variables of media exposure, personal direct
experience with unsafe food and recall of food associated with food safety incidents in
the past six months. The details of factors abstracted from the four groups of variables
are listed in Table 5.3 below.
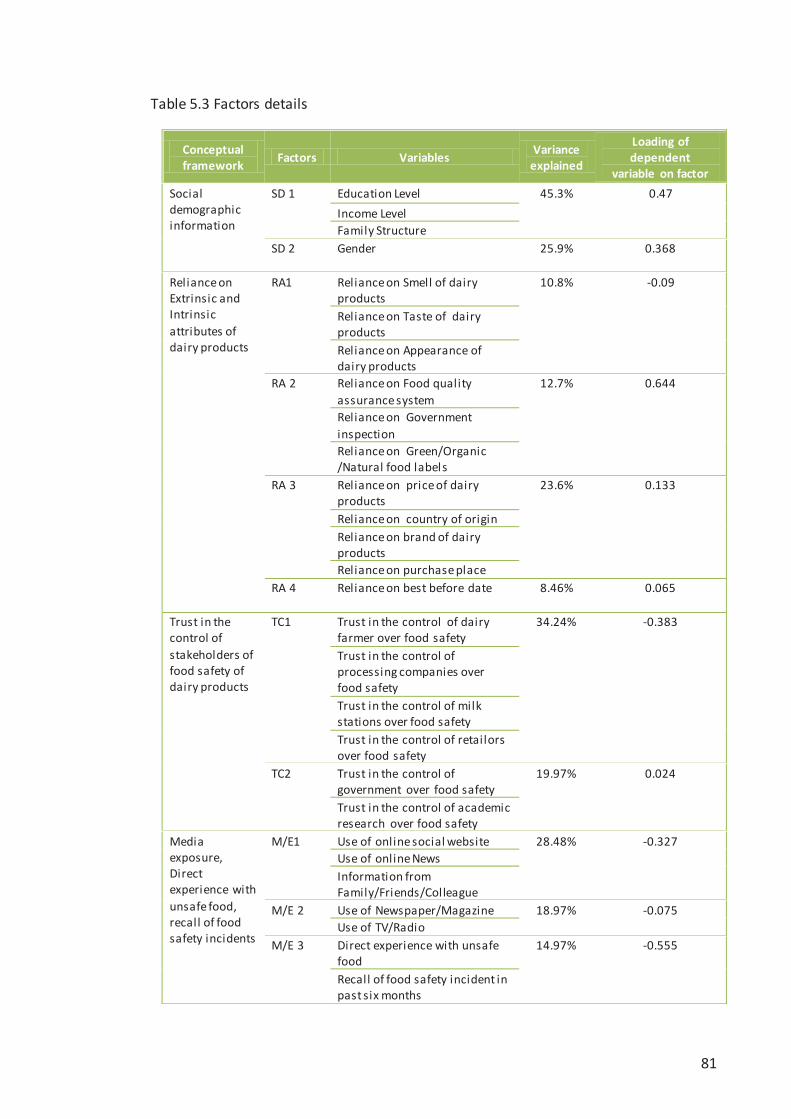
81
Table 5.3 Factors details
Conceptual framework Factors Variables Variance
explained
Loading of dependent
variable on factor Social demographic information
SD 1 Education Level 45.3% 0.47 Income Level Family Structure
SD 2 Gender 25.9% 0.368
Reliance on Extrinsic and Intrinsic attributes of dairy products
RA1 Reliance on Smell of dairy products
10.8% -0.09
Reliance on Taste of dairy products Reliance on Appearance of dairy products
RA 2 Reliance on Food quality assurance system
12.7% 0.644
Reliance on Government inspection Reliance on Green/Organic /Natural food labels
RA 3 Reliance on price of dairy products
23.6% 0.133
Reliance on country of origin Reliance on brand of dairy products Reliance on purchase place
RA 4 Reliance on best before date 8.46% 0.065
Trust in the control of stakeholders of food safety of dairy products
TC1 Trust in the control of dairy farmer over food safety
34.24% -0.383
Trust in the control of processing companies over food safety Trust in the control of milk stations over food safety Trust in the control of retailors over food safety
TC2 Trust in the control of government over food safety
19.97% 0.024
Trust in the control of academic research over food safety
Media exposure, Direct experience with unsafe food, recall of food safety incidents
M/E1 Use of online social website 28.48% -0.327 Use of online News Information from Family/Friends/Colleague
M/E 2 Use of Newspaper/Magazine 18.97% -0.075 Use of TV/Radio
M/E 3 Direct experience with unsafe food
14.97% -0.555
Recall of food safety incident in past six months
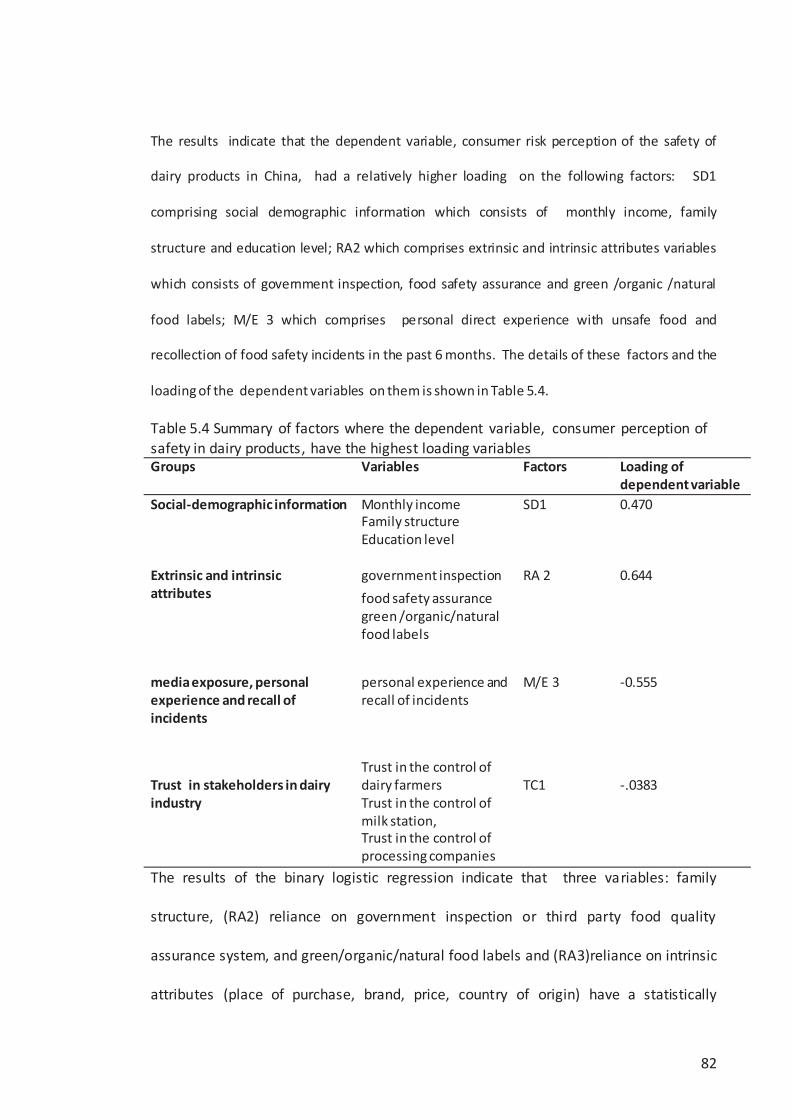
82
The results indicate that the dependent variable, consumer risk perception of the safety of
dairy products in China, had a relatively higher loading on the following factors: SD1
comprising social demographic information which consists of monthly income, family
structure and education level; RA2 which comprises extrinsic and intrinsic attributes variables
which consists of government inspection, food safety assurance and green /organic /natural
food labels; M/E 3 which comprises personal direct experience with unsafe food and
recollection of food safety incidents in the past 6 months. The details of these factors and the
loading of the dependent variables on them is shown in Table 5.4.
Table 5.4 Summary of factors where the dependent variable, consumer perception of safety in dairy products, have the highest loading variables Groups Variables Factors Loading of
dependent variable Social-demographic information Monthly income SD1 0.470
Family structure Education level
Extrinsic and intrinsic attributes
government inspection RA 2 0.644 food safety assurance green /organic/natural food labels
media exposure, personal experience and recall of incidents
personal experience and recall of incidents
M/E 3 -0.555
Trust in stakeholders in dairy industry
Trust in the control of dairy farmers
TC1
-.0383
Trust in the control of milk station, Trust in the control of processing companies
The results of the binary logistic regression indicate that three variables: family
structure, (RA2) reliance on government inspection or third party food quality
assurance system, and green/organic/natural food labels and (RA3)reliance on intrinsic
attributes (place of purchase, brand, price, country of origin) have a statistically

83
significant effect (p<0.05), and have a greater impact on consumers’ risk perception of
safety in dairy products than the other independent variables. The detail of the results
of the binary logistic regression are shown in Table 5.5 (the variables that are more
important are in bold).
Table 5.5 Results of the binary logistic regression
Note: The numbers highlighted in bold and italic are the factors that have more substantial correlation with independent variables
In conclusion, cross tabulation/correlation, factor analysis and binary logistic
regression were used to identify the variables that have an influence on the consumer
risk perception of safety in dairy products. Family structure, reliance on government
inspection, reliance on food safety assurance (ISO, QS, and HACCP) and reliance on
organic/green/natural food labels are the variables that came out of all three methods
of analysis as variables having the strongest influence on the consumer perception of
Independent variable B Wald χ2 P Odds ratio Social demographic information Monthly income -0.034 0.047 0.828 0.967 Family Structure 1.635 19.579 0.000 5.132 Education level 0.021 0.025 0.875 1.021 Gender 0.105 0.194 0.660 1.111 Reliance on Extrinsic and Intrinsic attributes of dairy products
RA 1 Reliance on intrinsic attributes 0.262 4.593 0.032 1.300 RA 2 Reliance on third party quality
insurance -0.306 5.968 0.015 0.737
RA 3 Reliance on extrinsic attributes -0.174 2.411 0.121 0.840 RA 4 Reliance on best before date -0.117 0.979 0.323 0.889 Trust in stakeholder of dairy industy TC 1 Trust in actors of dairy industry 0.115 0.845 0.358 1.122 TC 2 Trust in government regulators
and researcher -0.022 0.030 0.861 0.978
Media Exposure M/E 1 Use of internet media 0.129 0.665 0.415 1.138 M/E 2 Use of traditional media 0.164 1.616 0.204 1.179 M/E 3 Personal Experience Recall of
food safety incidence 0.153 1.791 0.181 1.165

84
safety in dairy products. Monthly income, education level and direct experience of
unsafe food are the variables that came out of the cross tabulation/correlation and
factor analysis as variables that influence consumer perception of safety in dairy
products. Recall of food safety incidents is the variable the came out only in the factor
analysis when it was included with direct experience with unsafe food.
Table5.6 The summary of the results from three different methods of analysis
Independent Variables
Cross tabulation /correlation
Factor analysis
Binary logistic regression
Monthly income √ √ Education level √ Family Structure √ √ √ Gender Reliance on Smell of dairy products Reliance on Taste of dairy products Reliance on Appearance of dairy products Reliance on Food quality assurance system √ √ √
Reliance on Government inspection √ √ √
Reliance on Green/Organic /Natural food labels √ √ √ Reliance on price of dairy products √ Reliance on country of origin √ Reliance on brand of dairy products √ Reliance on purchase place √ Reliance on best before date The control of processing company over the food safety
√
Trust in the control of dairy farmer over food safety
Trust in the control of processing companies over food safety
Trust in the control of milk stations over food safety
Trust in the control of retailers over food safety Trust in the control of government over food safety
Trust in the control of academic research over food safety
Use of online social website √ Use of online News Information from Family/Friends/Colleagues Use of Newspaper/Magazine Use of TV/Radio Direct experience with unsafe food √ √ Recall of food safety incidents √
85
5.3 Discussion and interpretation
5.3.1 Hypotheses related to social demographic information
Hypothesis 1: “Females perceive more risk than males in the safety of dairy products”,
was not supported by the results of the three methods of analysis. According to the
results from all three methods of analysis, gender difference does not have much
impact on consumer risk perception of safety in dairy products. This finding differs
from what Fewrer (2000) found in previous research done in the UK on the risk
perception of food and environment which concluded that females perceive more risk
than males from food and the environment due to their social involvement and roles in
the family. It also different from the finding of Dosman and Adamowicz (2003) in
Canada.
Hypothesis 2: “Education Level is positively related to the risk perception of dairy
safety” was partially supported, by the results of the factor analysis. The results from
the binary logistic regression and cross tabulation/correlation did not support
hypothesis 2. This result partially supports the findings of Dosman and Adamowicz
(2003) relating to the consumer perception of food safety risk. The higher the
education level of respondents, the more information they can find regarding food
hazards and the potential impact on food safety and human health. The reason that
education level was more robust in the factor analysis could be that education level
was loaded together with two other variables: family structure and monthly income
into one factor. The factor loading of SD1 is not only for education level but also for
family structure and monthly income.

86
Hypothesis 3: ” Household income is negatively related to the risk perception of dairy
safety” was partially supported, by the results of cross tabulation/correlation and
factor analysis. The results suggest the higher one’s income, the less risk they perceive
from consuming dairy products. Respondents with a higher income have more
disposable income. Thus they have more choice when they purchase dairy products.
They can avoid potential food safety risks in dairy products by paying more. This result
is similar to what Dosman and Adamowicz (2001) and Baker (2003) found in their
research.
Contrary to common belief that education level and income are supposed to move in
same direction, the results of this research found that education level and monthly
income went in the opposite direction. This can, perhaps, be explained by the
structure of sampling in this research. Half of the respondents were college students,
which means half of the respondents were obtaining tertiary education, but had a
monthly income of less than ¥ 2000.
Hypothesis 4: “The household structure (the presence of Children under 18 years) is
positively related to the risk perception of dairy safety” was not supported through all
three methods of analysis. Family structure (presence of young children in family) is a
strong predicator for consumer risk perception of safety in dairy products. The results
of all three analysis indicated that if there are children under 18 years of age, the
perceived risk in those families from consuming dairy products is less than for families
with children older than 18 years of age. This finding is contradictory to what has been
found in the research by Dosman in 2001 in Alberta, Canada and what Baker (2003)
found in his research in United States. One possible explanation is that the parents of
young children are willing to spend more than they would otherwise spend on the

87
dairy products for their children to consume to avoid a potential food safety risk. The
risk of unsafe dairy products is avoided by the willingness to paying more to get safer
and better dairy products. Another possible explanation is that families with children
less than 18 years of age may include a majority with children in primary school and
middle school. They may not be as sensitive to the safety of dairy products as parents
of new bourns or infants, who would likely make up a minority of this sampling group.
5.3.2 Hypotheses related to extrinsic and intrinsic attributes
Hypothesis 5: “The level of reliance on information of extrinsic attributes is positively
related to the risk perception of dairy safety” was not supported by any of the three
methods of analysis. That is to say taste, smell and appearance of dairy products are
the variables that show less of an association with consumer risk perception of safety
in dairy products. This result is different from that of Tensor and Schroeder (2007,
2009) in their research on factors that impact on risk perception in beef in Canada,
Mexico and Japan, in which consumers rely on the extrinsic attributes to judge the
safety of beef products.
Hypothesis 6: “The level of reliance on information of intrinsic attributes is positively
related to the risk perception of dairy safety”. This hypothesis was partially supported.
The credence attributes were divided into two groups of variables by the factor
analysis: (1) reliance on government inspection, reliance on food safety assurance
standard system (QS, ISO), reliance on green/organic/natural food labels; (2) reliance
on the best before date, reliance on place of purchase, reliance on product
ingredients, reliance on country of origin, reliance on brand name, reliance on price
level by factor analysis. In the results from the cross tabulation correlation of data, the
first group of intrinsic attributes had a high association with the perceived risk of food

88
safety. The second group of intrinsic attributes had a medium or low association with
the perceived risk of food safety. The results from factor analysis also separated the
intrinsic attributes into two groups. RA 1 includes reliance on government inspection,
reliance on food quality assurance systems and reliance on organic/green/natural food
labels. RA2 includes reliance on place of purchase, reliance on product ingredients,
reliance on country of origin, reliance on brand name and reliance on price level. The
loading of RA1 on the consumer perception of safety in dairy products is highest in the
concept framework of extrinsic and intrinsic attributes. This suggests that reliance on
government inspection, reliance on food quality assurance systems and reliance on
organic/green/natural food labels have a strong correlation with consumer perception
of safety in dairy products. The results from binary logistic regression support this
result as well. The coefficient for RA1: Reliance on third party quality insurance was
0.306. The coefficient for the factor 1: reliance on place of purchase, reliance on
products ingredients, reliance on country of origin, reliance on brand name and
reliance on price level was 0.262. Both factors in the binary logistic regression were
significant (P<0.05). In summary, in all the information sources (extrinsic and intrinsic
attributes) relating to dairy products, the third party food quality assurance
information, government inspection and green natural/organic food labels were what
respondents appeared to rely on the most to judge the safety of dairy products. This
result is similar to Tensor and Schroeder (2009) in their research on factors that impact
on the risk perception of beef in Canada, Mexico and Japan.
5.3.3 Hypotheses related to trust in the control of stakeholders in the dairy industry
Hypothesis 7 “The trust in food industry source is negatively related to the risk
perception of dairy safety” is not supported by the three methods of analysis;
89
Hypothesis 8 “The trust in government food safety regulatory agencies is negatively
related to the risk perception of dairy safety is not supported by the three method of
analysis; Hypothesis 9 “The trust in retailer is negatively related to the risk perception
of dairy safety” is not supported by the three method of analysis; Hypothesis 10 “The
trust in academic researchers is negatively related to the risk perception of dairy
safety” is not supported by the three method of analysis.
Among the variables relating to trust of the stakeholders in the dairy industry, none of
the variables were significant by any of the three methods of analysis, except for trust
in the control of the processing company where there was a medium level of
association with consumer risk perception of safety in dairy products using analysis by
cross tabulation/correlation. The results indicate that trust in the control of
stakeholder's with respect to safety in the dairy industry does not have much impact
on the consumer perception of safety in dairy products. This result differs from
previous research by Tensor and Schroeder (2007, 2009) on the factors impacting on
the risk perception in beef in Canada, Mexico and Japan and the study of Janneke de
Jonge (2009) which focuses on European consumers and the factors that impact on
their confidence in food safety. This can be explained by the current situation
regarding food safety in China where the public has a low level of confidence in food
safety, particularly relating to the dairy industry.
5.3.4 Hypotheses related to media exposure, personal direct experience with unsafe
food and recall of food safety incidents in the past 6 months
Hypothesis 11 “Direct experience of food safety incidents is positively related to the
risk perception of dairy safety” is partially supported by the analysis. The results from
cross tabulation and factor analysis suggest that experience with unsafe food is the
90
variable that has a strong correlation with consumer risk perception in food safety of
dairy products. The variable “the recall of food safety incidents in the past six months”
does not have a strong correlation with consumer risk perception in the safety of dairy
products except when it was combined with the variable “direct experience with
unsafe food” as one factor.
Hypothesis 12 “Media exposure of food safety incidents is negatively related to the risk
perception of dairy safety” is partially supported by the analysis. The results for the
variable “media usage” was split in two directions by cross tabulation: (1) The use of
traditional media like newspaper /magazine, TV /Radio which was negatively
associated with consumer risk perception of safety of dairy products, which means the
more respondents use tradition media, the less risk they perceived . (2) The use of
internet media like online social websites and online news was positively associated
with consumer risk perception of safety of dairy products which means the more
respondents use internet media, the more risk they perceived from the consumption
of dairy products. The results of factor analysis and binary logistic regression both
indicate that media usage was not a significant factor in consumers risk perception of
safety of dairy products.

91
Table 5.6 The summary of hypotheses Hypotheses
Supported4 Partially supported5
Not
supported6
H1 Females perceive more risk in dairy safety than males. √
H2 Education Level is positively related to the risk perception of dairy safety. √
H3 Household income is negatively related to the risk perception of dairy safety. √
H4 The household structure (the presence of Children under 18 years) is positively related to the risk perception of dairy safety.
√
H5 The level of reliance on information of extrinsic attributes is positively related to the risk perception of dairy safety.
√
H6 The level of reliance on information of intrinsic attributes is positively related to the risk perception of dairy safety.
√
H7 The trust in food industry source is negatively related to the risk perception of dairy safety. √
H8 The trust in government food safety regulatory agencies is negatively related to the risk perception of dairy safety.
√
H9 The trust in retailer is negatively related to the risk perception of dairy safety. √
H10 The trust in academic researchers is negatively rel related to the risk perception of dairy safety. √
H11 Direct experience of food safety incidents is positively related to the risk perception of dairy safety. √
H12 Media exposure of food safety incidents is negatively related to the risk perception of dairy safety. √
4 “Supported” means the hypothesis is supported by the resultes of all three methods of analysis that were employed in this research . 5 “Partially supported” means the hypothesis is supported by the resultes of one or two of methods of analysis that were employed in this research including : Hypothses 2,3,5, 8,11,12 or only part of the hypothesis is s upported by the resultes of all three methods of analysis that were employed in this research inclding hypothesis 6. 6 “Not supported” means the hypothesis is supported by the resultes of none of the methods of analysis that were employed in this research including hypotheses 1,4,5,7,9,10.

92
5.4 Implications and contributions
5.4.1 Theoretical implications
This study has contributed to the existing knowledge about the Chinese consumers’
risk perception of the safety of dairy products. There are limited empirical studies on
consumers risk perception of food safety in China, especially in a northwest China
context. The study offers insight into the consumers’ risk perception of safety of dairy
products by empirically identifying the factors that influence consumers’ risk
perception.
Secondly, the research model examined in this study provides a framework for future
research. Future researchers can use the model applied in this study and the results to
inform further studies about consumer risk perception in food safety, especially in
dairy products.
Thirdly, this research has analysed and ranked the factors in China that have been
previously identified as important to consumers risk perception in food safety in the
world. These factors are family structures, reliance on government inspection, reliance
on third party food quality assurance and reliance on organic/green/natural food
labels. It provides some empirical support for the results of other international studies
(see for example Tensor &Schroeder 2007, 2009, Janneke de Jonge 2009, Dosman &
Adamowicz 2001 and Baker 2003).
5.4.2 Social contributions
The results of the study provide an understanding of consumers for risk
communication and management. Factors identified by the study will help food safety
regulators make decisions on policies, options and strategies with respect to

93
communication with the public in the case of food safety incidents and help address
public concerns over food safety and food safety management. Information on the
characteristics of consumers who may perceive a greater risk in food safety than
others, can help risk communication focus on the appropriate population.
According to the results, intrinsic qualities such as third party certification,
government inspection and food quality assurance schemes are the most effective way
to communicate food safety information to consumers. The social-demographic
characteristics identified by the study can help food safety regulators and the food
industry to better allocate the resources and efforts of risk communication. The study
also gives information on the food groups that concern consumers as potential food
safety issues. This will assist sectors of the food industry to effectively communicate
with consumers.
5.5 Limitations and future research
5.5.1 Limitations of this study
While this study provides some contribution to the study of consumer perception of
food safety, there are also some limitations. As this research focuses only on dairy
products, the results of this study may not apply to other food groups or food in
general. Consumers may take different factors into account when considering
purchasing other foods. The samples for this study were drawn from a limited group of
consumers who were living in Lanzhou, China. The profile of consumers may vary if the
survey were conducted in other cities, or with different sampling methods.

94
5.5.2 Future research
Future studies could explore food safety and factors that impact on the consumer
perception of food safety in other food groups and in other segments of the food
industry. Further studies also could explore food safety in general food instead of a
specific food group. A similar study could be done in different cities or different
countries or use a different data collection approach such as face-to-face interviews.
A comparative study between consumers from different countries would be
interesting. In addition, future research may extend the study to include other
influential factors that were not included in this study such as consumers’
psychological traits and attitudes. Future research may examine the viewpoints of
other stakeholders in the food industry. Moreover, in the ever changing food industry,
the factors that influence consumers’ risk perception will change over time. A time
sequence study to compare changes in the factors that influence consumers’ risk
perception in food safety would be an interesting topic for future study.
5.6 Conclusion
In summary, this thesis contributed to a better understanding of the factors that
impact on Chinese consumer's perception of the safety of dairy products. The factors
identified by the research: family structure, the reliance on government inspection, the
reliance on third party quality assurance and the reliance on green/organic/natural
food labels are variables that have a more significant impact on the risk perception of
consumers of dairy safety than other variables that were studied in this research. The
results show the importance t build up a science-based, transparent and participatory
food safety management system.

95
REFERENCES
Adu-Nyako, Kofi, & Thomposon, Alton. (1999). Food safety risk perception and Behavior of consumer in the Southern Black Belt Region of US. Paper presented at the aaea Annual Meeting.
Babbie, Earl. (2010). The Practice of Social Research (12th ed.). California: Wadsworth. Baker, Gregory A. (2003). Food safety andFear:Factors Affecting consumer response to food
safety International Farm and Afribusiness Management Review, 6(1). Becker, Tilman. (2000). Consuemer perception of fresh meat quality: a frame work for analysis.
British Food Jounal, 103(3), 158-176. Beijing Orient Agribusiness Consultants. (2012). Review and Outlook of China’s Dairy Industry
2012/2013: Beijing Orient Agribusiness Consultants Limited. Bener, Ayse Basar. (2000). Risk perception ,trust and credibility: a case in internet banking.
(Phd), London School of Economics and Political Science, London. Bennett, Peter, Calman, Kenneth, Curtis, Sarah, & Smith, Denis. (2010). Risk Communication
and Public Health (2 edition ed.): Oxford University PressISBN-10: 0199562849. Burns, Robert B., & A.Burns, Robert. (2008). Business Research Methods and Statistics Using
SPSS. London: SAGE. Centers for Disease Control and Prevention. (2010). BSE (Bovine Spongiform Encephalopathy,
or Mad Cow Disease). from http://www.cdc.gov/ncidod/dvrd/bse/ Chanda Beckman, Jianping Zhang, Susan Zhang, and Shiliang Xu. (2011). China - Peoples
Republic of Dairy product and annual GAIN Report: USDA. Chen, Hong. (2011). Milk Consumption and Dairy Industry in China. Chen, Weiping. (2013). The effects of different types of trust on consumer perceptions of food
safety: An empirical study of consumers in Beijing Municipality, China. China Agricultural Economic Review, 5(1), 43 - 65.
The China melamine milk scandal and its implications for food safety regulation. China National Beareau of Statistics (Various Years). China Statistic Yearbook. Beijing,China:
China Statistical Press. Chung, Ho-yan. (2013). Benzo[a]pyrene and Gutter Oil. Food Safety Focus – Incident in Focus,
78. Cramer, Ducan. (2003). Advanced Quantitative Data Analysis. New York: Open University Press. Dairy News. ( 2013 ). China milk demand will continue Retrieved 01/07, 2014, from
http://www.ruralnewsgroup.co.nz/dairy-news/trending/china-milk-demand-will-continue
de Jonge, J., van Trijp, J. C. M., van der Lans, I. A., Renes, R. J., & Frewer, L. J. (2008). How trust in institutions and organizations builds general consumer confidence in the safety of food: A decomposition of effects. Appetite, 51(2), 311-317. doi: http://dx.doi.org/10.1016/j.appet.2008.03.008
Debham, NIck. (2008). The milk and dairy market in China. HONG KONG: KPMG. DeWaal, Caroline Smith, & Robert, Nadine. (2005). Global and Local: Food Safety Around the
World. Washington, D.C: The Center for Science in the Public Interest (CSPI). Dosman, Donna , Adamowicz, Wiktor, & Hrudey, Steve (2001). Socioeconomic Determinants
of Health- and Food Safety-Related Risk Perceptions. Risk Analysis, 21(2), 307-318. doi: 10.1111/0272-4332.212113
Epplera, Martin , & Mengisa, Jeanne. (2004). The Concept of Information Overload: A Review of Literature from Organization Science, Accounting, Marketing, MIS, and Re lated
96
Disciplines. The Information Society: An International Journal Volume 20, Issue 5, 2004, 20(5), 325-344.
Regulation (EC) No 178/2002 of the European Parliament (2002). Foodborne Illness Outbreak Database. (2013). 2013 Outbreak of E. coli O157:H7 from
http://www.outbreakdatabase.com/site/search/?tag=e.+coli+o157%3Ah7 Frewer, Lynn. (2000a). Risk perception and risk communication about food safety issue. British
Nutrition Bulleitin(25), 31-33. Frewer, Lynn. (2000b). Risk perception and risk communication about food safety issues.
Nutrition Bulletin, 25(1), 31-33. doi: 10.1046/j.1467-3010.2000.00015.x Frewer, Lynn, Jonge, Janneke de, & Kleef, Ellen van. (1995). Cosumer perception of food safety.
Medical Sciences, 22. FSANZ. (2008). Consumer attitudes survey 2007: a benchmark survey of consumers’ attitudes
to food issues from http://www.foodstandards.gov.au/ scienceandeducation/publications/consumerattitiudes/
Fuller, Frank, & Beghin, John. (2004). China’s Growing Market for Dairy Products. Iowa Ag Review, 10(3), 10-11.
Fuller, Frank, Huang, JiJun, Ma, Hengyun, & Rozelle, Scott. (2006). Got milk? The rapid rise of China’s dairy sector and its future prospects. Food Policy, 31(3), 201-215. doi: http://dx.doi.org/10.1016/j.foodpol.2006.03.002
Gale, Fred, & Huang, Kuo. (2007). Demand for Food Quantity and Quality in China Economic Research Report Number 32: USDA.
General Office of the State Council. (2012). National plan for the food safety regulation system during the period of the twelfth five-year plan (in Chinese). Beijing: Chinese State Council.
Global Food Safety Forum. (2011). The China Path to Global Food Safety: Global Food Safety Forum (GFSF).
Grimes, Carley A., Riddell, Lynn J., & Nowson, Caryl A. (2009). Consumer knowledge and attitudes to salt intake and labelled salt information. Appetite, 53(2), 189-194. doi: http://dx.doi.org/10.1016/j.appet.2009.06.007
Grunert, Klaus , Wills, Josephine , & Fernández-Celemín, Laura. (2010). Nutrition knowledge, and use and understanding of nutrition information on food labels among consumers in the UK. Appetite, 55(2), 177-189. doi: http://dx.doi.org/10.1016/j.appet.2010.05.045
Hair, Joseph , Black, William , Babin, Barry J., & Anderson, Rolph (2009). Multivariate Data Analysis Prentice Hall; 7 edition.
Han, Qing, Qiao, Juan, & He, Ling-Yun. (2012). Impacts of purchase preference of urban resident on safe-certified pork in Beijing of China. African Journal of Business Management, 6(39), 10408-10416. doi: DOI: 10.5897/AJBM11.1970
Healey, J.F. (2012). Statistics: A Tool for Social Research (9th ed.): Wadsworth Cengage Learning.
Hilts, Carla, & Pelletier, Luc. (2009). Background Paper onOccurrence of Melamine in Foods and Feed. Paper presented at the WHO Expert Meeting onToxicological and Health Aspects of Melamine and Cyanuric Acid.
Houghton Miflin Co. (Ed.) (2006) The American Heritage Dictionary of English Language (4th ed.). Houghton Mifflin Harcourt.
Hunt, Tim, Moynihan, Hayley, & Voboorgen, Mark. (2010). Global dairy outlook: Rabobank International food and agribusiness research and advisory.
Hussain, Malik Altaf, & Dawson, Christopher O. (2013). Economic Impact of Food Safety Outbreaks on Food Businesses. Foods, 2, 585-589.
Ing. J.W, Tolkamp (2012). China's diary chain. Wageningen University Wageningen UR. The Netherlands.
97
Jia, Chenhao, & Jukes, David. (2013). The national food safety control system of China – A systematic review. Food Control, 32(1), 236-245. doi: http://dx.doi.org/10.1016/j.foodcont.2012.11.042
Knight, Andrew , & Warland, Rex. (2005). Determinants of Food Safety Risks: A Multi -disciplinary Approach. Rural Sociology, 70(2).
Kornelis, Marcel, De Jonge, Janneke, Frewer, Lynn, & Dagevos, Hans. (2007). Consumer Selection of Food-Safety Information Sources. Risk Analysis, 27(2), 327-335. doi: 10.1111/j.1539-6924.2007.00885.x
Kwok, Joey, & Yau, Arthur. (2006). Sudan Dyes in Food. Food Safety Focus – Incident in Focus. Lam, Hon-Ming, Remais, Justin, Fung, Ming-Chiu, Xu, Liqing, & Sun, Samuel Sai-Ming. (2013).
Food supply and food safety issues in China. Lancet 381, 2044–2053. Lin, Yao-Yu, Zeng, Hui, Li, Gui-Cai, & Ni, Hong-Gang. (2010). Economic development is ultimate
determinant of food safety: A case study of China. Environmental Pollution, 158(5), 1185-1188. doi: http://dx.doi.org/10.1016/j.envpol.2009.11.014
Liu, Rongduo, Pieniak, Zuzanna, & Verbeke, Wim. (2013). Consumers' attitudes and behaviour towards safe food in China: A review. Food Control, 33(1), 93-104. doi: http://dx.doi.org/10.1016/j.foodcont.2013.01.051
Liu, Shiping, Huang, Ju-Chin, & Brown, GregoryL. (1998). Information and Risk Perception: A Dynamic Adjustment Process. Risk Analysis, 18(6), 689-699. doi: 10.1023/b:rian.0000005916.78181.95
Lobb, Alexandra, Mazzocchi, M., & Traill, W. B. (2007). Modelling risk perception and trust in food safety information within the theory of planned behaviour. Food Quality and Preference, 18(2), 384-395. doi: http://dx.doi.org/10.1016/j.foodqual.2006.04.004
Lobb, Alexandra. (2005). Consumer trust, risk and food safety: A review, Food Economics. Acta Agriculturae Scandinavica Section C, 2( 1), 3-12.
Lu, Xiaojing. (2011). The Cause and Effect Analysis of the Melamine Incident in China. Asian Journal of Agricultural Research, 5(176-185).
Marshall, Gill. (2005). The purpose, design and administration of a questionnaire for data collection. Radiography, 11(2), 131-136. doi: http://dx.doi.org/10.1016/j.radi.2004.09.002
Massey University CODE OF ETHICAL CONDUCTFOR RESEARCH, TEACHING AND EVALUATIONS INVOLVING HUMAN PARTICIPANTS. 2013, from http://www.massey.ac.nz/massey/fms/Human Ethics/Documents/MUHEC Code 2013.pdf
Mazzocchi, Mario, Lobb, Alexandra, Bruce Traill, W., & Cavicchi, Alessio. (2008). Food Scares and Trust: A European Study. Journal of Agricultural Economics, 59(1), 2-24. doi: 10.1111/j.1477-9552.2007.00142.x
McComas, Katherine A. (2006). Defining Moments in Risk Communication Research: 1996–2005. Journal of Health Communication, 11(1), 75-91. doi: 10.1080/10810730500461091
Ménard, Claude, & Valceschini, Egizio. (2005). New institutions for governing the agri -food industry. Eur Rev Agric Econ, 32(3), 421-440. doi: 10.1093/eurrag/jbi013
Muhammad, Safdar, Sherif, Sherin, & Gheblawi, Mohamed. (2010). Consumers' attitudes and perceptions of food safety in the United Arab Emirates. Journal of food distribution research., 41(2), 73-85.
Nation Statistic Bureau. (2010). The sixth natinal census from tjj.lanzhou.gov.cn/...112/t20111213_100844.htm - 2011-6-3
O'Mahony, P.J. (2013). Finding horse meat in beef products-a global problem. QJM: An International Journal of Medicine, 106(6), 595-597.

98
Ortega, David L., Wang, H. Holly, Olynk, Nicole J., Wu, Laping, & Bai, Junfei. (2011). Chinese Consumers' Demand for Food Safety Attributes: A Push for Government and Industry Regulations. American J. of Agricultural Economics, 94(2), 489-495.
Pei, Xiaofang, Tandon, Annuradha, Alldrick, Anton, Giorgi, Liana, Huang, Wei, & Yang, Ruijia. (2011). The China melamine milk scandal and its implications for food safety regulation. Food Policy, 36(3), 412-420. doi: http://dx.doi.org/10.1016/j.foodpol.2011.03.008
Pennings, Joost M.E., & Garcia, Philip. (2001). Measuring Producers' Risk Preferences: A Global Risk-Attitude Construct. American Journal of Agricultural Economics, 83(4), 993-1009. doi: 10.1111/0002-9092.00225
Pidgeon, Nick, Kasperson, Roger, & Slovic, Paul. (2003). The social amplification of risk. Cambridge Cambridge University Press.
Poppe, Christian, & KjÊrnes, Unni. (2003). Trust in food in Europe: a comparative analysis", National Institute for Consumer Research (Vol. 5-2003). Oslo: SIFO.
Qiao, Guanghua, Guo, Ting, & Klein, K. K. (2010). Melamine in Chinese milk products and consumer confidence. Appetite, 55(2), 190-195. doi: http://dx.doi.org/10.1016/j.appet.2010.05.047
Qiao, Guanghua, Guo, Ting, & Klein, K.K. (2012). Melamine and other food safety and health scares in China: Comparing households with and without young children. Food Control, l26 (2012) 378-386.
Rosati, Simona, & Saba, Anna. (2004). The perception of risks associated with food-related hazards and the perceived reliability of sources of information. International Journal of Food Science & Technology, 39(5), 491-500. doi: 10.1111/j.1365-2621.2004.00808.x
Royal Society. (1992). Risk: Analysis,Perception and Management. London. Saba, Anna, & Messina, Federico. (2003). Attitudes towards organic foods and risk/benefit
perception associated with pesticides. Food Quality and Preference, 14(8), 637-645. doi: http://dx.doi.org/10.1016/S0950-3293(02)00188-X
Sanderson, Warren C. (2004). The End of World Population Growth in the 21st Century: New Challenges for Human Capital Formation and Sustainable Development.
Sapp, Stephen G. (2003). A comparison of alternative theoretical explanations of consumer food safety assessments. International Journal of Consumer Studies, 27(1), 34-39. doi: 10.1046/j.1470-6431.2003.00263.x
Schroeder, Ted C., Tonsor, Glynn T., Pennings, Joost M.E., & Mintert, James. (2007). Consumer Food Safety Risk Perceptions and Attitudes: Impacts on Beef Consumption across Countries. The B.E. Journal of Economic Analysis & Policy, 7(1), 65.
Schutt, Russell K (2012). Investigating the social world : the process and practice of research. Califonia: Sage Publications.
Schutt, Russell K., & Engel, Rafael J. (2012). The Practice of Research in Social Work (Third Edition edition ed.): SAGE Publications, Inc.
Scott, Ryan, & Jianping, Zhang. (2012). China-People Republic of Dairy and Product Annual. In M. Meador (Ed.), GAIN Report: USDA.
Setbon, Michel, Raude, Jocelyn, Fischler, Claude, & Flahault, Antoine. (2005). Risk Perception of the “Mad Cow Disease” in France: Determinants and Consequences. Risk Analysis, 25(4), 813-826. doi: 10.1111/j.1539-6924.2005.00634.x
Shang, Zhou. (2010). Does Denial Drive Distrust?--An Analysis of Responses to Product-harm Crises in New Zealand. (Master of Commerce & Management), Lincoln University, Christchurch.
Sharf, Miri, Sela, Ruti, Zentner, Gary, Shoob, Hanna, Shai, Iris, & Stein-Zamir, Chen. (2012). Figuring out food labels. Young adults’ understanding of nutritional information presented on food labels is inadequate. Appetite, 58(2), 531-534. doi: http://dx.doi.org/10.1016/j.appet.2011.12.010

99
Siegrist, Michael. (2000). The Influence of Trust and Perceptions of Risks and Benefits on the Acceptance of Gene Technology. Risk Analysis, 20(2), 195-204. doi: 10.1111/0272-4332.202020
Sjöberg, Lennart. (2000). Factors in Risk Perception. Risk Analysis, 20(1), 1-12. doi: 10.1111/0272-4332.00001
Skinner, Roger, Han, Jun, Luo, Dan, & Lou, Yunbo. (2004). Regulatary and Strategic Framework for Food Safety in the People's republic of China: SFDAADBWHO.
Slovic, Paul. (1999). Trust, Emotion, Sex, Politics, and Science: Surveying the Risk-Assessment Battlefield. Risk Analysis, 19(4), 689-701. doi: 10.1023/a:1007041821623
Slovic, Paul. (2013). The Feeling of Risk: New Perspectives on Risk Perception: Routledge SZE, Tommy. (2011). Lean Meat Agents in Meat Products. Food Safety Focus – Incident in Focus. Tam, WaiKeung, & Yang, Dali. (2005). Food safety and the development of regulatory
institutions in China. Asian Perspective. Taylor, Michael R. (2012). Food Safety and Consumer Confidence in the Global Food System .
Paper presented at the China International Food Safety and Quality Conference and Expo, Shanghai,China.
The Food Safety Law of the People’s Republic of China ( 2009). Tonsor, Glynn T., Schroeder, Ted C., & Pennings, Joost M. E. (2009). Factors Impacting Food
Safety Risk Perceptions. Journal of Agricultural Economics, 60(3), 625-644. doi: 10.1111/j.1477-9552.2009.00209.x
Trading Economics. (2012). China Disposable Income per Capita. from http://www.tradingeconomics.com/china/disposable-personal-income
United Nations in China (2008). Advancing Food Safety In China United Nations. Verbeke, Wim, Frewer, Lynn J., Scholderer, Joachim, & De Brabander, Hubert F. (2007). Why
consumers behave as they do with respect to food safety and risk information. Analytica Chimica Acta, 586(1–2), 2-7. doi: http://dx.doi.org/10.1016/j.aca.2006.07.065
Verbeke, Wim, & Ward, Ronald W. (2006). Consumer interest in information cues denoting quality, traceability and origin: An application of ordered probit models to beef labels. Food Quality and Preference, 17(6), 453-467. doi: http://dx.doi.org/10.1016/j.foodqual.2005.05.010
Wachinger, Gisela, Renn, Ortwin, Begg, Chloe, & Kuhlicke, Christian. The Risk Perception Paradox—Implications for Governance and Communication of Natural Hazards. Risk Analysis, 33(1), 1049-1065.
Wahlberg, Anders A. F., & Sjoberg, Lennart. (2000). Risk perception and the media. Journal of Risk Research, 3(1), 31-50. doi: 10.1080/136698700376699
Walter, Dietmar, Böhmer, Merle, Reiter, Sabine, Krause, Gérard, & Wichmann, Ole. (2012). Risk perception and information-seeking behaviour during the 2009/10 influenza A(H1N1)pdm09 pandemic in Germany. EuroSurveillance, 17(13), 1-8.
Wang, Feng, Zhang, Jian, Mu, Weisong, Fu, Zetian, & Zhang, Xiaoshuan. (2009). Consumers’ perception toward quality and safety of fishery products, Beijing, China. Food Control, 20(10), 918-922. doi: http://dx.doi.org/10.1016/j.foodcont.2009.01.008
Wang, Zhigang, Mao, Yanna, & Gale, Fred. (2008). Chinese consumer demand for food safety attributes in milk products. Food Policy, 33(1), 27-36. doi: http://dx.doi.org/10.1016/j.foodpol.2007.05.006
Wu, Heng. (2012). . Xiu, Changbai, & Klein, K. K. (2010). Melamine in milk products in China: Examining the factors
that led to deliberate use of the contaminant. Food Policy, 35(5), 463-470. doi: http://dx.doi.org/10.1016/j.foodpol.2010.05.001
Yang, Da Li (2004). Remaking the Chinese Leviathan:Market Transition and the Politics of Governance in China: Stanford University Press.
100
Yeung, Ruth M.W., & Morris, Joe. (2001). Food safety risk Consumer perception and purchase behaviour. British Food Journal, 103(3), 170-186.
Zepeda, Lydia, Douthitt, Robin, & You, So-Ye. (2003). Consumer Risk Perceptions Toward Agricultural Biotechnology, Self-Protection, and Food Demand: The Case of Milk in the United States. Risk Analysis, 23(5), 973-984. doi: 10.1111/1539-6924.00374
Zhang, Caiping, Bai, Junfei, Lohmar, Bryan T., & Huang, Jikun. (2010). How do consumers determine the safety of milk in Beijing, China? China Economic Review, 21, Supplement 1(0), S45-S54. doi: http://dx.doi.org/10.1016/j.chieco.2010.05.008
Zhang, Caiping, Bai, Junfei, & Wahl, Thomas I. (2012). Consumers' willingness to pay for traceable pork, milk, and cooking oil in Nanjing, China. Food Control, 27(1), 21-28. doi: http://dx.doi.org/10.1016/j.foodcont.2012.03.001
Zhang, Xiaoyong. (2003). The Dynamics of Chinese Consumers A Case of Shanghai Food Consumption. Journal of International Food & Agribusiness Marketing, 14(1), 47-66.
Zhou, Wei. (2012). Food Safety in China. In W. Zhou (Ed.): EU- China Civil Society Dialogue. Zhou, Yingheng, & Wang, Erpeng. (2011). Urban consumers' attitudes towards the safety of
milk powder after the melamine scandal in 2008 and the factors influencing the attitudes. China Agricultural Economic Review, 3(1), 101-111.
101
Adu-Nyako, K., & Thomposon, A. (1999). Fodd safety risk perception and Behavior of consumer in the Southern Black Belt Region of US. Paper presented at the aaea Annual Meeting.
Babbie, E. (2010). The Practice of Social Research (12th ed.). California: Wadsworth. Baker, G. A. (2003). Food safety andFear:Factors Affecting consumer response to food safety
International Farm and Afribusiness Management Review, 6(1). Becker, T. (2000). Consuemer perception of fresh meat quality: a frame work for analysis.
British Food Jounal, 103(3), 158-176. Beijing Orient Agribusiness Consultants. (2012). Review and Outlook of China’s Dairy Industry
2012/2013: Beijing Orient Agribusiness Consultants Limited. Bener, A. B. (2000). Risk perception ,trust and credibility: a case in internet banking. Phd,
London School of Economics and Political Science, London. Bennett, P., Calman, K., Curtis, S., & Smith, D. (2010). Risk Communication and Public Health (2
edition ed.): Oxford University PressISBN-10: 0199562849. Bernués, A., Olaizola, A., & Corcoran, K. (2003). Labelling information demanded by European
consumers and relationships with purchasing motives, quality and safety of meat. Meat Science, 65(3), 1095-1106. doi: http://dx.doi.org/10.1016/S0309-1740(02)00327-3
Bower, C. K., Daeschel, M. A., & McGuire, J. (1998). Protein antimicrobial barriers to bacterial adhesion. Journal of Dairy Science, 81(10), 2771-2778.
Burns, R. B., & A.Burns, R. (2008). Business Research Methods and Statistics Using SPSS. London: SAGE.
Centers for Disease Control and Prevention. (2010). BSE (Bovine Spongiform Encephalopathy, or Mad Cow Disease), from http://www.cdc.gov/ncidod/dvrd/bse/
Chanda Beckman, J. Z., Susan Zhang, and Shiliang Xu. (2011). China - Peoples Republic of Dairy product and annual GAIN Report: USDA.
Chen, H. (2011). Milk Consumption and Dairy Industry in China. Chen, W. (2013). The effects of different types of trust on consumer perceptions of food safety:
An empirical study of consumers in Beijing Municipality, China. China Agricultural Economic Review, 5(1), 43 - 65.
China National Beareau of Statistics (Various Years). China Statistic Yearbook. Beijing,China: China Statistical Press.
Chung, H.-y. (2013). Benzo[a]pyrene and Gutter Oil. Food Safety Focus – Incident in Focus, 78. Cramer, D. (2003). Advanced Quantitative Data Analysis. New York: Open University Press. Dairy News. ( 2013 ). China milk demand will continue Retrieved 01/07, 2014, from
http://www.ruralnewsgroup.co.nz/dairy-news/trending/china-milk-demand-will-continue
de Jonge, J., van Trijp, J. C. M., van der Lans, I. A., Renes, R. J., & Frewer, L. J. (2008). How trust in institutions and organizations builds general consumer confidence in the safety of food: A decomposition of effects. Appetite, 51(2), 311-317. doi: http://dx.doi.org/10.1016/j.appet.2008.03.008
Debham, N. (2008). The milk and dairy market in China. HONG KONG: KPMG. DeWaal, C. S., & Robert, N. (2005). Global and Local: Food Safety Around the World.
Washington, D.C: The Center for Science in the Public Interest (CSPI). Dosman, D. M., Adamowicz, W. L., & Hrudey, S. E. (2001). Socioeconomic Determinants of
Health- and Food Safety-Related Risk Perceptions. Risk Analysis, 21(2), 307-318. doi: 10.1111/0272-4332.212113
Epplera, M. J., & Mengisa, J. (2004). The Concept of Information Overload: A Review of Literature from Organization Science, Accounting, Marketing, MIS, and Related Disciplines. The Information Society: An International Journal
102
Volume 20, Issue 5, 2004, 20(5), 325-344. Regulation (EC) No 178/2002 of the European Parliament (2002). Foodborne Illness Outbreak Database. (2013). 2013 Outbreak of E. coli O157:H7 from
http://www.outbreakdatabase.com/site/search/?tag=e.+coli+o157%3Ah7 Foodborne Illness Outbreak Dtabase. (2013). 2013 Outbreak of E. coli O157:H7 from
http://www.outbreakdatabase.com/site/search/?tag=e.+coli+o157%3Ah7 Frewer, L. (2000a). Risk perception and risk communication about food safety issue. British
Nutrition Bulleitin(25), 31-33. Frewer, L. (2000b). Risk perception and risk communication about food safety issues. Nutrition
Bulletin, 25(1), 31-33. doi: 10.1046/j.1467-3010.2000.00015.x FSANZ. (2008). Consumer attitudes survey 2007: a benchmark survey of consumers’ attitudes
to food issues from http://www.foodstandards.gov.au/ scienceandeducation/publications/consumerattitiudes/
Fuller, F., & Beghin, J. (2004). China’s Growing Market for Dairy Products. Iowa Ag Review, 10(3), 10-11.
Fuller, F., Huang, J., Ma, H., & Rozelle, S. (2006). Got milk? The rapid rise of China’s dairy sector and its future prospects. Food Policy, 31(3), 201-215. doi: http://dx.doi.org/10.1016/j.foodpol.2006.03.002
Gale, F., & Huang, K. (2007). Demand for Food Quantity and Quality in China Economic Research Report Number 32: USDA.
General Office of the State Council. (2012). National plan for the food
safety regulation system during the period of the twelfth five-year plan (in Chinese). Beijing: Chinese State Council.
Global Food Safety Forum. (2011). The China Path to Global Food Safety: Global Food Safety Forum (GFSF).
Grimes, C. A., Riddell, L. J., & Nowson, C. A. (2009). Consumer knowledge and attitudes to salt intake and labelled salt information. Appetite, 53(2), 189-194. doi: http://dx.doi.org/10.1016/j.appet.2009.06.007
Grunert, K. G., Wills, J. M., & Fernández-Celemín, L. (2010). Nutrition knowledge, and use and understanding of nutrition information on food labels among consumers in the UK. Appetite, 55(2), 177-189. doi: http://dx.doi.org/10.1016/j.appet.2010.05.045
Han, Q., Qiao, J., & He, L.-Y. (2012). Impacts of purchase preference of urban resident on safe -certified pork in Beijing of China. African Journal of Business Management 6(39), 10408-10416. doi: DOI: 10.5897/AJBM11.1970
Healey, J. F. (2012). Statistics: A Tool for Social Research (9th ed.): Wadsworth Cengage Learning.
Hilts, C., & Pelletier, L. (2009). Background Paper onOccurrence of Melamine in Foods and Feed. Paper presented at the WHO Expert Meeting onToxicological and Health Aspects of Melamine and Cyanuric Acid.
Houghton Miflin Co. (Ed.) (2006) The American Heritage Dictionary of English Language (4th ed.). Houghton Mifflin Harcourt.
Hunt, T., Moynihan, H., & Voboorgen, M. (2010). Global dairy outlook: Rabobank International food and agribusiness research and advisory.
Hussain, M. A., & Dawson, C. O. (2013). Economic Impact of Food Safety Outbreaks on Food Businesses. Foods, 2, 585-589.
Ing. J.W, T. (2012). China's diary chain. Wageningen University Wageningen UR. The Netherlands.
Jia, C., & Jukes, D. (2013). The national food safety control system of China – A systematic review. Food Control, 32(1), 236-245. doi: http://dx.doi.org/10.1016/j.foodcont.2012.11.042
103
Knight, A. J., & Warland, R. (2005). Determinants of Food Safety Risks: A Multi -disciplinary Approach. Rural Sociology, 70(2).
Kornelis, M., De Jonge, J., Frewer, L., & Dagevos, H. (2007). Consumer Selection of Food-Safety Information Sources. Risk Analysis, 27(2), 327-335. doi: 10.1111/j.1539-6924.2007.00885.x
Kwok, J., & Yau, A. (2006). Sudan Dyes in Food. Food Safety Focus – Incident in Focus. Lam, H.-M., Remais, J., Fung, M.-C., Xu, L., & Sun, S. S.-M. (2013). Food supply and food safety
issues in China. Lancet 381, 2044–2053. Lin, Y.-Y., Zeng, H., Li, G.-C., & Ni, H.-G. (2010). Economic development is ultimate determinant
of food safety: A case study of China. Environmental Pollution, 158(5), 1185-1188. doi: http://dx.doi.org/10.1016/j.envpol.2009.11.014
Liu, R., Pieniak, Z., & Verbeke, W. (2013). Consumers' attitudes and behaviour towards safe food in China: A review. Food Control, 33(1), 93-104. doi: http://dx.doi.org/10.1016/j.foodcont.2013.01.051
Liu, S., Huang, J.-C., & Brown, G. (1998). Information and Risk Perception: A Dynamic Adjustment Process. Risk Analysis, 18(6), 689-699. doi: 10.1023/b:rian.0000005916.78181.95
Lobb, A. (2005). Consumer trust, risk and food safety: A review, Food Economics. Acta Agriculturae Scandinavica Section C, 2( 1), 3-12.
Lobb, A. E., Mazzocchi, M., & Traill, W. B. (2007). Modelling risk perception and trust in food safety information within the theory of planned behaviour. Food Quality and Preference, 18(2), 384-395. doi: http://dx.doi.org/10.1016/j.foodqual.2006.04.004
Lu, X. (2011). The Cause and Effect Analysis of the Melamine Incident in China. Asian Journal of Agricultural Research, 5(176-185).
Mariani, C., Briandet, R., Chamba, J. F., Notz, E., Carnet-Pantiez, A., Eyoug, R. N., & Oulahal, N. (2007). Biofilm ecology of wooden shelves used in ripening the French raw milk smear cheese Reblochon de Savoie. Journal of Dairy Science, 90(4), 1653-1661. doi: 10.3168/jds.2006-190
Marshall, G. (2005). The purpose, design and administration of a questionnaire for data collection. Radiography, 11(2), 131-136. doi: http://dx.doi.org/10.1016/j.radi.2004.09.002
Massey University. CODE OF ETHICAL CONDUCTFOR RESEARCH, TEACHING AND EVALUATIONS INVOLVING HUMAN PARTICIPANTS, 2013, from http://www.massey.ac.nz/massey/fms/Human%20Ethics/Documents/MUHEC%20Code%202013.pdf
Mazzocchi, M., Lobb, A., Bruce Traill, W., & Cavicchi, A. (2008). Food Scares and Trust: A European Study. Journal of Agricultural Economics, 59(1), 2-24. doi: 10.1111/j.1477-9552.2007.00142.x
McComas, K. A. (2006). Defining Moments in Risk Communication Research: 1996–2005. Journal of Health Communication, 11(1), 75-91. doi: 10.1080/10810730500461091
Ménard, C., & Valceschini, E. (2005). New institutions for governing the agri -food industry. Eur Rev Agric Econ 32(3), 421-440. doi: 10.1093/eurrag/jbi013
Muhammad, S., Sherif, S., & Gheblawi, M. (2010). Consumers' attitudes and perceptions of food safety in the United Arab Emirates. Journal of food distribution research., 41(2), 73-85.
Nation Statistic Bureau. (2010). The sixth natinal census from tjj.lanzhou.gov.cn/...112/t20111213_100844.htm - 2011-6-3
O'Mahony, P. J. (2013). Finding horse meat in beef products-a global problem. QJM: An International Journal of Medicine, 106(6), 595-597.
Ortega, D. L., Wang, H. H., Olynk, N. J., Wu, L., & Bai, J. (2011). Chinese Consumers' Demand for Food Safety Attributes: A Push for Government and Industry Regulations. American J. of Agricultural Economics 94(2), 489-495.

104
Pei, X., Tandon, A., Alldrick, A., Giorgi, L., Huang, W., & Yang, R. (2011). The China melamine milk scandal and its implications for food safety regulation. Food Policy, 36(3), 412-420. doi: http://dx.doi.org/10.1016/j.foodpol.2011.03.008
Pennings, J. M. E., & Garcia, P. (2001). Measuring Producers' Risk Preferences: A Global Risk-Attitude Construct. American Journal of Agricultural Economics, 83(4), 993-1009. doi: 10.1111/0002-9092.00225
Pidgeon, N., Kasperson, R., & Slovic, P. (2003). The social amplification of risk. Cambridge Cambridge University Press.
Poppe, C., & KjÊrnes, U. (2003). Trust in food in Europe: a comparative analysis", National Institute for Consumer Research (Vol. 5-2003). Oslo: SIFO.
Qiao, G., Guo, T., & Klein, K. K. (2010). Melamine in Chinese milk products and consumer confidence. Appetite, 55(2), 190-195. doi: http://dx.doi.org/10.1016/j.appet.2010.05.047
Qiao, G., Guo, T., & Klein, K. K. (2012). Melamine and other food safety and health scares in China: Comparing households with and without young children. Food Control, l26 (2012) 378-386.
Rosati, S., & Saba, A. (2004). The perception of risks associated with food-related hazards and the perceived reliability of sources of information. International Journal of Food Science & Technology, 39(5), 491-500. doi: 10.1111/j.1365-2621.2004.00808.x
Royal Society. (1992). Risk: Analysis,Perception and Management. London. Saba, A., & Messina, F. (2003). Attitudes towards organic foods and risk/benefit perception
associated with pesticides. Food Quality and Preference, 14(8), 637-645. doi: http://dx.doi.org/10.1016/S0950-3293(02)00188-X
Sanderson, W. C. (2004). The End of World Population Growth in the 21st Century: New Challenges for Human Capital Formation and Sustainable Development.
Sapp, S. G. (2003). A comparison of alternative theoretical explanations of consumer food safety assessments. International Journal of Consumer Studies, 27(1), 34-39. doi: 10.1046/j.1470-6431.2003.00263.x
Schroeder, T. C., Tonsor, G. T., Pennings, J. M. E., & Mintert, J. (2007). Consumer Food Safety Risk Perceptions and Attitudes: Impacts on Beef Consumption across Countries. The B.E. Journal of Economic Analysis & Policy, 7(1), 65.
Schutt, R. K. (2012). Investigating the social world : the process and practice of research . Califonia: Sage Publications.
Schutt, R. K., & Engel, R. J. (2012). The Practice of Research in Social Work (Third Edition edition ed.): SAGE Publications, Inc.
Scott, R., & Jianping, Z. (2012). China-People Republic of Dairy and Product Annual. In M. Meador (Ed.), GAIN Report: USDA.
Setbon, M., Raude, J., Fischler, C., & Flahault, A. (2005). Risk Perception of the “Mad Cow Disease” in France: Determinants and Consequences. Risk Analysis, 25(4), 813-826. doi: 10.1111/j.1539-6924.2005.00634.x
Shang, Z. (2010). Does Denial Drive Distrust?--An Analysis of Responses to Product-harm Crises in New Zealand. Master of Commerce & Management
Lincoln University, Christchurch. Sharf, M., Sela, R., Zentner, G., Shoob, H., Shai, I., & Stein-Zamir, C. (2012). Figuring out food
labels. Young adults’ understanding of nutritional information presented on food labels is inadequate. Appetite, 58(2), 531-534. doi: http://dx.doi.org/10.1016/j.appet.2011.12.010
Siegrist, M. (2000). The Influence of Trust and Perceptions of Risks and Benefits on the Acceptance of Gene Technology. Risk Analysis, 20(2), 195-204. doi: 10.1111/0272-4332.202020
105
Sjöberg, L. (2000). Factors in Risk Perception. Risk Analysis, 20(1), 1-12. doi: 10.1111/0272-4332.00001
Skinner, R., Han, J., Luo, D., & Lou, Y. (2004). Regulatary and Strategic Framework for Food Safety in the People's republic of China: SFDA
ADB
WHO. Slovic, P. (1999). Trust, Emotion, Sex, Politics, and Science: Surveying the Risk-Assessment
Battlefield. Risk Analysis, 19(4), 689-701. doi: 10.1023/a:1007041821623 Slovic, P. (2013). The Feeling of Risk: New Perspectives on Risk Perception: Routledge
SZE, T. (2011). Lean Meat Agents in Meat Products. Food Safety Focus – Incident in Focus. Tam, W., & Yang, D. (2005). Food safety and the development of regulatory institutions in
China. Asian Perspective. Taylor, M. R. (2012). Food Safety and Consumer Confidence in the Global Food System . Paper
presented at the China International Food Safety and Quality Conference and Expo, Shanghai,China.
The Food Safety Law of the People’s Republic of China ( 2009). Tonsor, G. T., Schroeder, T. C., & Pennings, J. M. E. (2009). Factors Impacting Food Safety Risk
Perceptions. Journal of Agricultural Economics, 60(3), 625-644. doi: 10.1111/j.1477-9552.2009.00209.x
Trading Economics. (2012). China Disposable Income per Capita, from http://www.tradingeconomics.com/china/disposable-personal-income
United Nations in China (2008). Advancing Food Safety In China United Nations. Verbeke, W., Frewer, L. J., Scholderer, J., & De Brabander, H. F. (2007). Why consumers behave
as they do with respect to food safety and risk information. Analytica Chimica Acta, 586(1–2), 2-7. doi: http://dx.doi.org/10.1016/j.aca.2006.07.065
Verbeke, W., & Ward, R. W. (2006). Consumer interest in information cues denoting quality, traceability and origin: An application of ordered probit models to beef labels. Food Quality and Preference, 17(6), 453-467. doi: http://dx.doi.org/10.1016/j.foodqual.2005.05.010
Wachinger, G., Renn, O., Begg, C., & Kuhlicke, C. The Risk Perception Paradox—Implications for Governance and Communication of Natural Hazards. Risk Analysis, 33(1), 1049-1065.
Wahlberg, A. A. F., & Sjoberg, L. (2000). Risk perception and the media. Journal of Risk Research, 3(1), 31-50. doi: 10.1080/136698700376699
Walter, D., Böhmer, M., Reiter, S., Krause, G., & Wichmann, O. (2012). Risk perception and information-seeking behaviour during the 2009/10 influenza A(H1N1)pdm09 pandemic in Germany. EuroSurveillance, 17(13), 1-8.
Wang, F., Zhang, J., Mu, W., Fu, Z., & Zhang, X. (2009). Consumers’ perception toward quality and safety of fishery products, Beijing, China. Food Control, 20(10), 918-922. doi: http://dx.doi.org/10.1016/j.foodcont.2009.01.008
Wang, Z., Mao, Y., & Gale, F. (2008). Chinese consumer demand for food safety attributes in milk products. Food Policy, 33(1), 27-36. doi: http://dx.doi.org/10.1016/j.foodpol.2007.05.006
Wu, H. (2012). . Xiu, C., & Klein, K. K. (2010). Melamine in milk products in China: Examining the factors that led
to deliberate use of the contaminant. Food Policy, 35(5), 463-470. doi: http://dx.doi.org/10.1016/j.foodpol.2010.05.001
106
Yang, D. L. (2004). Remaking the Chinese Leviathan:Market Transition and the Politics of Governance in China: Stanford University Press.
Yeung, R. M. W., & Morris, J. (2001). Food safety risk Consumer perception and purchase behaviour. British Food Journal, 103(3), 170-186.
Zepeda, L., Douthitt, R., & You, S.-Y. (2003). Consumer Risk Perceptions Toward Agricultural Biotechnology, Self-Protection, and Food Demand: The Case of Milk in the United States. Risk Analysis, 23(5), 973-984. doi: 10.1111/1539-6924.00374
Zhang, C., Bai, J., Lohmar, B. T., & Huang, J. (2010). How do consumers determine the safety of milk in Beijing, China? China Economic Review, 21, Supplement 1(0), S45-S54. doi: http://dx.doi.org/10.1016/j.chieco.2010.05.008
Zhang, C., Bai, J., & Wahl, T. I. (2012). Consumers' willingness to pay for traceable pork, milk, and cooking oil in Nanjing, China. Food Control, 27(1), 21-28. doi: http://dx.doi.org/10.1016/j.foodcont.2012.03.001
Zhang, X. (2003). The Dynamics of Chinese Consumers A Case of Shanghai Food Consumption. Journal of International Food & Agribusiness Marketing, 14(1), 47-66.
Zhou, W. (2012). Food Safety in China. In W. Zhou (Ed.): EU- China Civil Society Dialogue. Zhou, Y., & Wang, E. (2011). Urban consumers' attitudes towards the safety of milk powder
after the melamine scandal in 2008 and the factors influencing the attitudes. China Agricultural Economic Review, 3(1), 101-111.

107
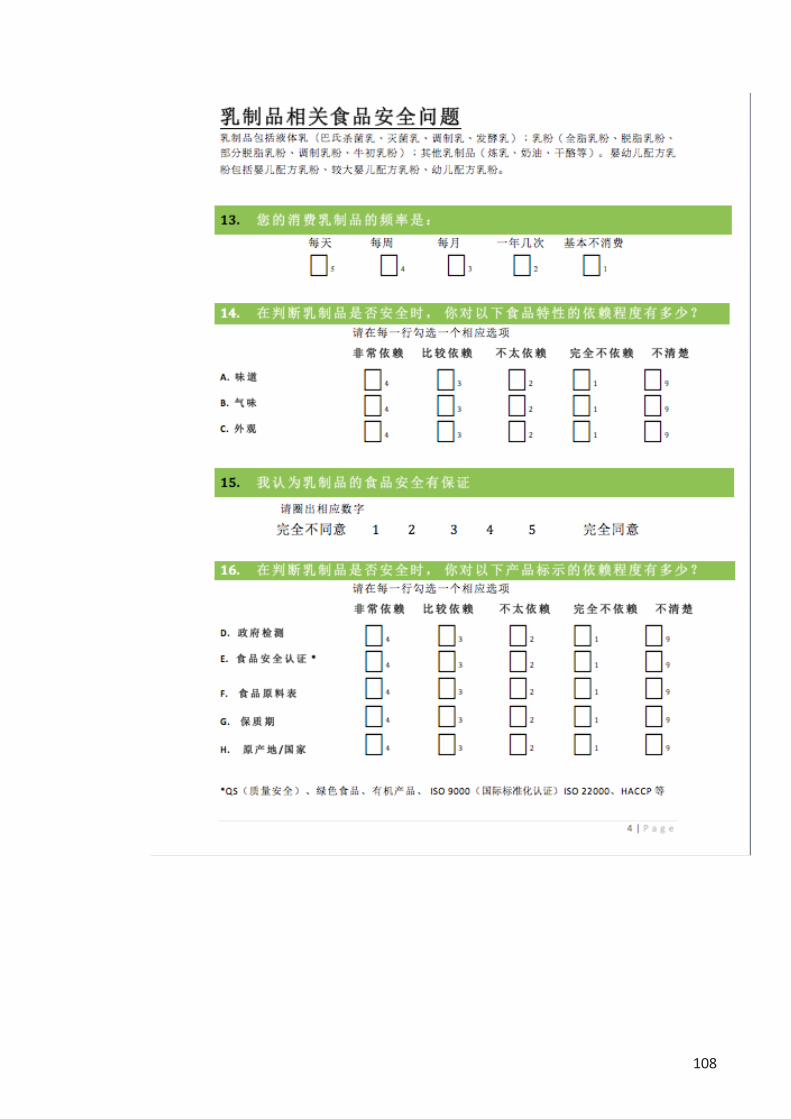
108

109
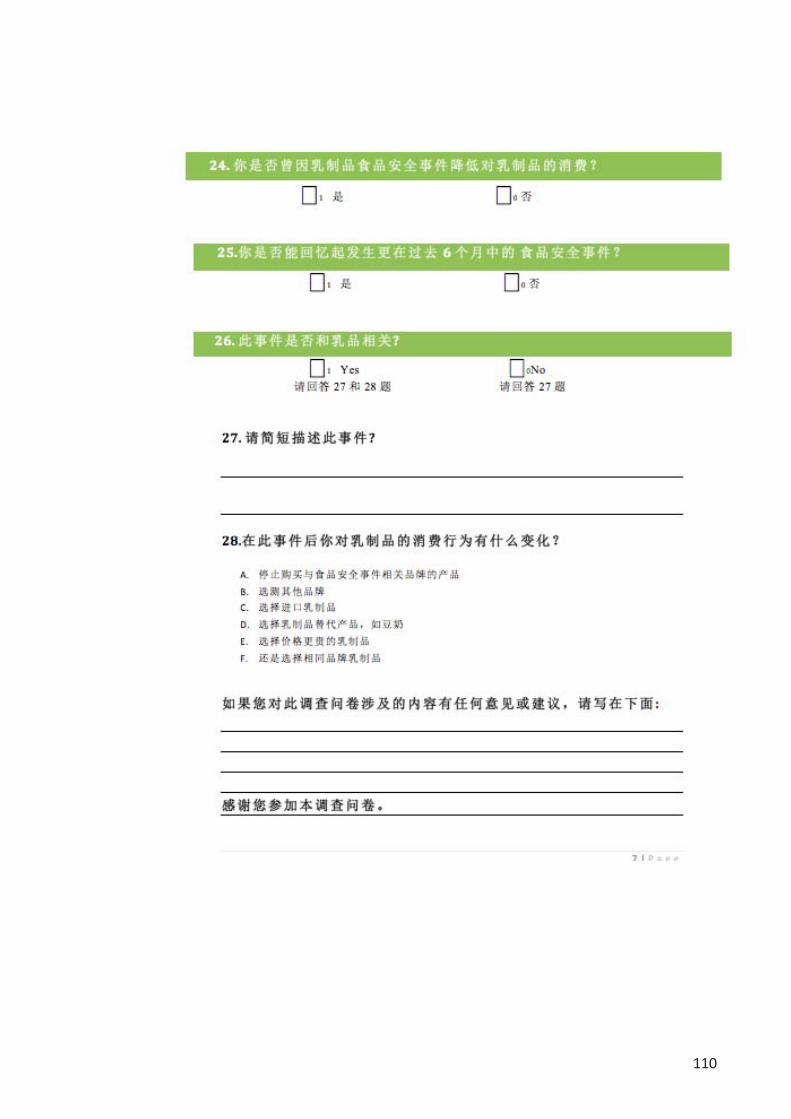
110
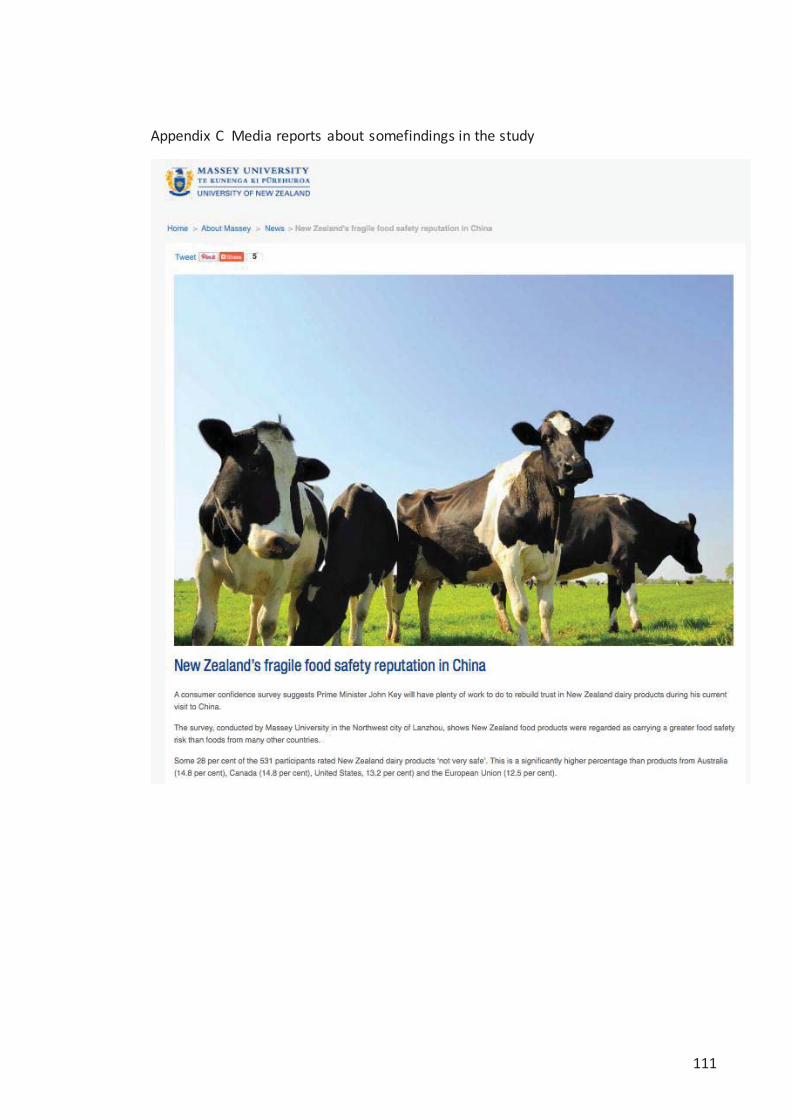
111
Appendix C Media reports about somefindings in the study
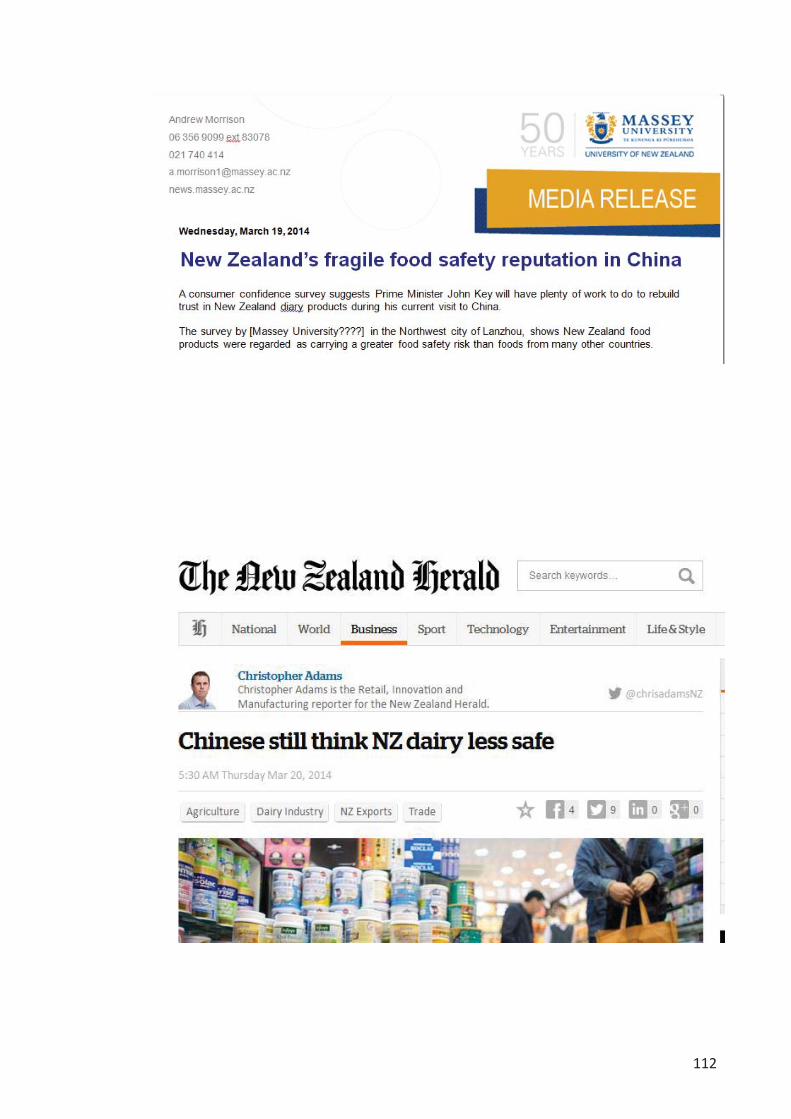
112

113

114