Analysis of factors affecting the performance of retinal ... · Keywords: Simulation Framework,...
171
POUR L'OBTENTION DU GRADE DE DOCTEUR ÈS SCIENCES acceptée sur proposition du jury: Prof. J. Brugger, président du jury Prof. Ph. Renaud, directeur de thèse Dr G. Cosendai, rapporteur Prof. N. de Rooij, rapporteur Prof. M. Giugliano, rapporteur Analysis of Factors Affecting the Performance of Retinal Prostheses Using Finite Element Modelling of Electric Field Distribution in the Retina THÈSE N O 5048 (2011) ÉCOLE POLYTECHNIQUE FÉDÉRALE DE LAUSANNE PRÉSENTÉE LE 1 ER JUILLET 2011 À LA FACULTÉ SCIENCES ET TECHNIQUES DE L'INGÉNIEUR LABORATOIRE DE MICROSYSTÈMES 4 PROGRAMME DOCTORAL EN MICROSYSTÈMES ET MICROÉLECTRONIQUE Suisse 2011 PAR Sri Harsha KASI RAJ
Transcript of Analysis of factors affecting the performance of retinal ... · Keywords: Simulation Framework,...

POUR L'OBTENTION DU GRADE DE DOCTEUR ÈS SCIENCES
acceptée sur proposition du jury:
Prof. J. Brugger, président du juryProf. Ph. Renaud, directeur de thèse
Dr G. Cosendai, rapporteur Prof. N. de Rooij, rapporteur
Prof. M. Giugliano, rapporteur
Analysis of Factors Affecting the Performance of Retinal Prostheses Using Finite Element Modelling of Electric Field
Distribution in the Retina
THÈSE NO 5048 (2011)
ÉCOLE POLYTECHNIQUE FÉDÉRALE DE LAUSANNE
PRÉSENTÉE LE 1ER JUILLET 2011
À LA FACULTÉ SCIENCES ET TECHNIQUES DE L'INGÉNIEURLABORATOIRE DE MICROSYSTÈMES 4
PROGRAMME DOCTORAL EN MICROSYSTÈMES ET MICROÉLECTRONIQUE
Suisse2011
PAR
Sri Harsha KASI RAJ

Harsha Kasi: Analysis of factors affecting the performance of retinal prostheses using finite
element modelling of electric field distribution in the retina, PhD Thesis, © June 2011

From ignorance, lead me to truth; from darkness, lead me to light;
From death, lead me into immortality; Oh, let there be peace.
- Bruhadaranyak Upanishad 1.3.28
With love
to amma, daddy, sindhu
and eternally beautiful urmila
In the loving memory of
Elsa Siegrist Henri Riedweg
1923 – 2010 1920 – 2011


A B S T R A C T
This dissertation proposes a computational framework targeted at improving the design
of currently employed retinal prostheses. The framework was used for analysing
factors impacting the performance of prostheses in terms of electrical stimulation for
retinal neurons, which might lead to a perception of pixelated vision. Despite their
demonstrated effectiveness, the chronic and safe usage of these retinal prostheses in
human and animal trials is jeopardised due to high stimulation thresholds. This is
related to the distance between the stimulating electrodes and the retinal neurons
resulting from the implantation procedure. The major goal of this dissertation was to
evaluate the stimulation efficacy in current implantable planar microelectrode-based
retinal prostheses and consequently demonstrate their weakness, thereby providing
scope for the development of future implants.
The effect of geometrical factors i.e., electrode-retina distance and electrode size on
stimulation applied to the retina by retinal prostheses was studied. To this end, a finite
element method based simulation framework to compute electric field distribution
in the retina was constructed. An electrical model of the retina was an integral part
of the framework, essentially represented by a resistivity profile of the multi-layered
retina. The elements of a retinal prosthesis were modelled by incorporating realistic
electrode sizes, an anatomical and electrical model of the retina, a precise positioning of
stimulation and return electrodes and the location of the implant with respect to the
retina representing the epiretinal and subretinal stimulation schemes.
The simulations were carried out both in quasi-static and direct current (DC) modes.
It was observed that electrode-electrolyte interface and tissue capacitance could be
safely neglected in our model based on the magnitude of the applied voltage stimulus
and frequencies under consideration. Therefore, , all simulations were conducted in DC
mode. Thresholds and lateral extents of the stimulation were computed for electrode
sizes corresponding to existing and self-fabricated implants. The values and trends
obtained were in agreement with experiments from literature and our collaborators at
the les Hôpitaux Universitaires de Genève (HUG). In the subretinal stimulation scheme,
the computed variation of impedance with electrode-retina distance correlated well
with time varying in vivo impedance measurements in rats conducted in collaboration
v
with the Institut de la Vision, INSERM, Paris. Finally, it was also reiterated that the
currently employed retinal prostheses are not very efficient due to a significant distance
between the stimulation electrode and the retinal cells.
In addition, I present a new experimental technique for measuring the absolute and
local resistivity profile in high-resolution along the retinal depth, based on impedance
spectroscopy using a bipolar microprobe. This experiment was devised to extract the
resistivity profile of an embryonic chick retina to construct an electrical model for the
simulation framework to simulate in vitro retinal stimulation experiments conducted by
HUG collaborators. We validated the capability of the technique in rat and embryonic
chick retinas.
In conclusion, the computational framework presented in this dissertation is more
realistic than those found in literature, but represents only a preliminary step towards
an accurate model of a real implantation scenario in vivo. The simulation results are
in agreement with results from clinical trials in humans for epiretinal configuration
(literature) and with in vitro results for epiretinal and subretinal stimulation applied to
chick retinas (HUG).
The developed simulation framework computes quantities that can form a reference
for quality control during surgery while inserting implants in the eye and functionality
checks by electrophysiologists. Furthermore, this framework is useful in deciding the
specifications of stimulation electrodes such as optimal size, shape, material, array
density, and the position of the reference electrode to name a few. The work presented
here offers to aid in optimising retinal prostheses and implantation procedures for
patients and eventually contribute towards improving their quality of life.
Keywords: Simulation Framework, Finite Element Method, Electrode-retina Distance,
Retinal Prosthesis, Microelectrodes, Tissue Resistivity Profiling
vi

V E R S I O N A B R É G É E
Ce travail de thèse cherche à améliorer la conception d’implants rétiniens par la
modélisation et la vérification des paramètres influant sur l’efficacité de la stimulation
électrique nécessaire pour stimuler les neurones de la rétine, et ainsi promouvoir la
sensation d’une vision pixellisée. En effet, les implants rétiniens actuellement utilisés
lors des tests in vivo sur des animaux ainsi que sur l’homme ont pour désavantage de
présenter, une fois inséré, une distance entre les électrodes de stimulation et les neurones
de la rétine. Ceci entraine un seuil de stimulation requis élevé et par conséquent une
efficacité réduite, ainsi qu’un risque de dégradation des cellules de la rétine liée à
ces implants. L’étude d’intégration numérique présentée dans ce travail permet de
caractériser l’efficacité d’implants rétiniens, d’en démontrer les points faibles, et ainsi
d’améliorer le développement de futurs implants.
Le modèle utilisé dans cette étude évalue l’effet de facteurs géométriques, la distance
entre l’électrode et la rétine ainsi que la taille des électrodes, sur la stimulation appliquée
à la rétine par les implants. Pour cela, une simulation par éléments finis a été réalisée
pour calculer la distribution du champ électrique, suivant un modèle électrique de
la rétine établi durant cette étude, qui tient compte du profile de résistivité de la
rétine multicouche. Ainsi, les implants ont été modélisés en intégrant une dimension
d’électrodes réaliste, un modèle électrique de la rétine anatomiquement correct, un
arrangement précis des électrodes de stimulation et de la masse, ainsi que l’emplacement
de l’implant par rapport à la rétine dans les cas d’implants épirétiniens et sous-rétiniens.
Les simulations ont été effectuées en mode quasi statique et courant direct (DC). Il a
été observé que, considérant les amplitudes du potentiel de stimulation et les fréquences
appliquées, l’interface électrode/électrolyte et la capacité du tissu peuvent être négligés
dans notre modèle. De ce fait, toutes les simulations ultérieures ont été effectuées en
mode DC. Les valeurs seuils et l’extension latérale de la stimulation ont été calculées
pour des tailles d’électrodes correspondant aux implants existants et fabriquée au cours
de ce travail. Les valeurs et les tendances obtenues correspondent à celles trouvées dans
la littérature et par nos collaborateurs aux Hôpitaux Universitaires de Genève (HUG).
En condition de stimulation sous-rétinien, les variations d’impédance calculées selon
la distance électrode/rétine correspondent bien aux mesures d’impédance in vivo en
vii

fonction du temps effectuées sur des rétines de rats dans le cadre d’une collaboration
avec l’Institut de la Vision, INSERM, Paris. Enfin, il a été démontré que les prothèses
rétiniennes planes basé sur des microélectrodes actuellement employées sont peu
efficace due à une distance significative entre l’électrode de stimulation et les cellules
excitable de la rétine.
Une nouvelle technique expérimentale de haute résolution pour mesurer le profil
de résistivité en fonction de la profondeur dans la rétine basée sur les mesures de
spectroscopie d’impédance bipolaire par une microsonde a été utilisée pour construire
le modèle de simulation correspondant aux expériences conduites au HUG. La
performance de cette méthode a été validée par des mesures sur des rétines de rat et
d’embryon de poussin.
En conclusion, le modèle de simulation de la rétine et de l’implant développé dans ce
travail est un modèle plus complet que ceux trouvé généralement dans la littérature,
mais représente qu’une étape préliminaire envers un modèle précis du comportement
complet d’un implant rétinien in vivo. Les résultats de simulation obtenus sont en accord
avec des résultats d’essais cliniques chez l’humain dans la configuration épirétinienne
(littérature) et avec des résultats in vitro pour les configurations épirétinien et sous-
rétinien pour le poussin (HUG).
Au niveau de la conception d’implants rétiniens, cette étude permet lors de la
phase préliminaire de conception de prendre des décisions quant aux spécifications des
électrodes de stimulation telles que la taille optimale, la forme, le matériau, la densité du
réseau d’électrodes, la position de l’électrode de référence, etc. Le modèle de simulation
développé permet d’obtenir des résultats quantitatifs utilisables en tant que référence
pour le contrôle de la qualité de l’insertion des implants rétiniens dans l’œil par chirurgie
ainsi que le contrôle du fonctionnement de l’implant par les électrophysiologistes. Ce
travail permettra d’optimiser dans le futur l’implantation des implants rétiniens pour
les patients et ainsi d’améliorer leur qualité de vie.
Mots-clés: Méthodes de simulation, simulations par éléments finis, distance electrode/rétine,
implants rétinienne, microélectrodes, resistivité tissulaire
viii

P U B L I C AT I O N S
Some ideas and figures have appeared previously in the following publications:
Simulation of epiretinal prostheses – Evaluation of geometrical factors affecting stimulation
thresholds - Kasi H., Hasenkamp W., Cosendai G., Bertsch A., Renaud P., Accepted by
Journal of Neuroengineering and Rehabilitation, 2011 (provided basis for Chapter 5)
Simulation of spatial extent of stimulation and effect of electrode-tissue gap in subretinal implants
- Kasi H., Bertsch A., Guyomard J.-L., Kolomiets B., Picaud S., Pelizzone M., Renaud P.,
In Press, Medical Engineering & Physics, 2011 (provided basis for Chapter 6)
Direct localised measurement of electrical resistivity profile in rat and embryonic chick retinas
using a microprobe - Kasi H., Meissner R., Babalian A., van Lintel H., Bertsch A., Renaud
P., Journal of Electrical Bioimpedance, 2010 (provided basis for Chapter 3)
ix


A C K N O W L E D G M E N T S
I owe my deepest gratitude to a great teacher in all walks of life, Professor Philippe
Renaud. He believed and provided me with the opportunity to succeed by offering
unlimited expert advice and most appreciated support throughout my stay in his
laboratory. I can never forget his informally declared motto: “My students’ success, is
my success”.
I sincerely thank Professor Michele Giugliano from University of Antwerp, Prof. Nico
de Rooij from EPFL, and Dr. Gregoire Cosendai from Second Sight for accepting to be
members of the jury and deeply criticising my work. Their constructive comments and
suggestions were invaluable for this dissertation to attain its current form. Undoubtedly,
Professor Jürgen Brugger was commendable for his task to preside over the jury and
carry out the examination in a fair and pleasant manner.
The impact of any doctoral work can generally be rated by the quality of peer
reviewed and published manuscripts. On this account and throughout my thesis, I am
grateful to the priceless criticism and the meticulous scientific communication skills
of Dr. Arnaud Bertsch towards this achievement. My special token of appreciation to
Robert Meissner, Willyan Hasenkamp, Dr. Bogdan Kolomiets, Dr. Alexandre Babalian,
Dr. Serge Picaud, Jean-Laurent Guyomard, Harald van Lintel and Dr. Gregoire Cosendai
for their guidance and significant contribution to the articles. Not to forget, the informal
reviews and excellent suggestions offered by Pontus Linderholm, Prof. Sujit Sikdar, Dr.
Robert Wilke, Prof. Michele Giugliano and the very generous Dr. Ashish Ahuja. I wish
to warmly thank them one and all.
I am extremely pleased to have shared an unforgettable learning experience with
my colleagues at the Microsystems Laboratory, LMIS4. Of particular pertinence to this
work, my heartfelt thanks to Andre Mercanzini for his advice on experiments with
microelectrodes, mentorship and friendship, Thomas Braschler for his brilliance and
mind-boggling conversations on just about anything, Sebastien Jiguet for his expert
guidance on microfabrication and presentation skills, Marc Heuschkel for sharing his
invaluable experience with microelectrodes and the rest of the LMIS4 team for their
creativity.
xi

I truly enjoyed the precious company and friendship that I experienced with my
office mates: Lynda Metref for her multidisciplinary conversations, Nicolas Durand
for his immaculate sense of punctuality and organisation and Robert Meissner for the
relaxing and stimulating discussions on any topic – thank them all so much. I relished
sharing an office, as well as many off-work hours together with them.
I feel humble to have a long list of collaborators of highest quality imaginable. In
the framework of the artificial retina project, I had the immense pleasure to work
with collaborators from Hôpital Universitaire de Genève (HUG). I personally thank Dr.
Marzia Lecchi, Dr. Angelica Perez-Fornos, Dr. Jörg Sommerhalder and especially Dr.
Joel Salzmann for making the long hours during in vivo trials in Geneva, a stimulating
and useful learning experience. In addition, I am grateful to Prof. Marco Pelizzone for
guiding me on the right path when I was off track. Furthermore, I had the exciting
opportunity to be able to work in collaboration with the immensely talented and very
competent group of Dr. Serge Picaud at INSERM. A special mention of thanks to
the warmth and affectionate nature of Dr. Bogdan Kolomiets who was of great help
scientifically and personally motivating. I feel more confident after my interaction of a
multidisciplinary nature with you all.
Facilities and resources are key aspects in conducting scientific experiments of highest
quality. In this respect, I would like to express my sincere gratitude to:
Jean-Pierre Rougnon, Mechanical Engineering workshop (ATME), EPFL for his kind,
patient and hard-working nature. All parts fabricated by him were like masterpieces for
me.
Prof. Anne Grapin-Botton, EPFL for her guidance and kindly allowing me to use the
excellent incubation facility at her lab.
Dr. J. Patterson for the generous and timely supply of chick eggs complemented by
useful tips.
Shruthi Muralidhar and Vincent Delattre for their expert advice on neuroscience,
tissue slicing and experimental protocols. Rajnish Ranjan on his expert suggestions and
discussions on modelling neuronal dynamics using NEURON in particular. Srikanth
Ramaswamy for his constructive criticism on manuscripts, scientific approach and using
his flair for scientific writing in reviewing major parts of my dissertation report. All of
them were from the Neural Microcircuitry Laboratory (LNMC), EPFL and more than
their above-mentioned contribution, was indeed their friendship.
xii

Peter Brühlmeier and Georges Vaucher at ACI (EPFL) for sharing their circuit design
expertise and generous supply of basic electric and electronic components for free.
Comsol international support team for patiently and efficiently resolving many of the
problems I faced during modelling and simulation.
EPFL library services for their timely and prompt assistance with the literature that I
desired.
Centre of MicroNanoTechnology (CMI), EPFL for their cooperation, knowledge and
the very helpful nature.
There are so many people who contributed to various parts of this work; if I neglect
to mention your name, rest assured that I greatly appreciated your assistance.
I would fail in my endeavour if I forget to convey my special appreciation to Marie
Halm, Sylvie Clavel, Rose-Mary Apotheloz, Kathlyn Mayor and Sandra Roux for all
their relentless support, a big smile, in all administrative issues. They eased the pressure
on me and helped me focus on my research.
“All work and no play makes Jack a dull boy” was always on my mind. I thank my
colleagues and friends at the EPFL for the lighter moments and escapades. It really was
refreshing and inspirational for a fresh start at work after those events.
I sincerely thank the Indian community in EPFL, Lausanne and Switzerland. I have
taken part in numerous social gatherings organised by many of these families, which
always helped me to feel home in spite of being away from India.
My wholehearted gratitude to two very important people for hosting and sharing
their living space with me during this doctoral thesis: late Mrs. Elsa Siegrist for her
motherly care and Venkat Sivagnanam for his motivation and inspiration. I thank them
both from the bottom of my heart for bearing with me.
Finally, my heartfelt love and appreciation is due to my mother, father and sister for
their invaluable support through all phases of my life. I take this opportunity also to
kindly thank all my teachers for the perseverance and effort they put in training me to
bring me up to this level. Last but not least, I would like to express my warmest love
and earnest gratitude to Urmila for having persisted with me during the most difficult
phases of my life. Without her loving support and understanding, I would not have
achieved my goals.
xiii


C O N T E N T S
i dissertation 1
1 introduction 3
1.1 Scope 9
1.2 Modelling problem and its significance 10
1.2.1 Positioning of electrodes 11
1.2.2 Geometrical factors 12
1.2.3 Electric model of the retina 13
1.3 Literature review 13
1.3.1 Retinal implants 14
1.3.2 Optogenetics - replacing electrode with light stimulation 21
1.3.3 Modelling strategies 24
1.4 Dissertation position with respect to the state of the art 32
1.5 Research objectives 34
1.6 Limitations 34
1.7 Dissertation layout 35
2 electrical stimulation of retina : from electrophysiology to modelling 39
2.1 Introduction 39
2.2 Physiological basis for neurostimulation 40
2.3 Electric fields in volume conductors 41
2.3.1 Quasi-static formulation 42
2.3.2 Potential from a monopolar disc 42
2.3.3 Inhomogeneous volume conductors 43
2.4 Stimulus characteristics affecting retinal stimulation 43
2.4.1 Cathodic and anodic stimulation 44
2.4.2 Monopolar and dipolar configuration 44
2.4.3 Current-controlled versus voltage-controlled stimulation 45
2.4.4 Strength-duration relationship 46
2.4.5 Selective stimulation of retinal cells 47
2.5 Safe stimulation of neural tissue 47
2.5.1 Mechanism 48
xv

xvi Contents
2.5.2 Parameters for safe stimulation 49
2.5.3 Induced retinal injury by stimulation 51
2.6 Direct and indirect stimulation 51
2.7 Modelling retinal stimulation 52
2.8 Summary 53
3 determining resistivity profile of the retina 55
3.1 Introduction 55
3.2 Materials and methods 56
3.2.1 Animals 56
3.2.2 Electrode design and fabrication 56
3.2.3 Measurement method and modelling 57
3.2.4 Measurement apparatus and protocol 60
3.3 Results 62
3.3.1 Electrode characterisation and PRF shift 62
3.3.2 Resistivity profiling in rat and embryonic chick retinas 64
3.4 Discussion 65
3.5 Conclusion and outlook 68
4 fem-based integrated simulation framework 71
4.1 Introduction 71
4.2 Geometrical factors 71
4.2.1 Electrode-retina gap model 71
4.2.2 Electrode size 72
4.3 Simulation framework 75
4.3.1 Constituents of the framework 75
4.3.2 Hypotheses for RGC activation 79
4.4 Integrated FEM model 81
4.5 Extracted parameters 83
4.5.1 Current 84
4.5.2 Impedance 84
4.5.3 Lateral extent 84
4.6 Conclusion and Outlook 84
5 simulation of epiretinal prostheses 87
5.1 Background 87
5.2 Methods 89

Contents xvii
5.3 Results and Discussion 89
5.3.1 Stimulation thresholds as a function of electrode-retina distance 89
5.3.2 Stimulation thresholds as a function of electrode sizes 91
5.3.3 Impedance variation based on electrode-retina distance 93
5.3.4 Estimation of resolution based on spatial extent of stimulation 94
5.3.5 Simulation vs. in vitro epiretinal stimulation - Our implant 95
5.4 Conclusions 96
6 simulation of subretinal prostheses 99
6.1 Introduction 99
6.2 Methods 101
6.2.1 Hypotheses for retinal stimulation 101
6.2.2 FEM modelling 101
6.2.3 Animal model and impedance spectroscopy 101
6.3 Results 102
6.3.1 Spatial extent of the threshold current 102
6.3.2 Effect of a gap between the electrode and the retinal tissue 103
6.4 Discussion 106
6.4.1 Threshold current 106
6.4.2 Spatial extent of stimulation 107
6.4.3 Effect of electrode size 107
6.4.4 Effect of electrode-tissue gap 108
6.4.5 Simulation vs. in vitro subretinal stimulation - Our implant 110
6.5 Conclusion 111
7 conclusion 113
7.1 Summary of main results 113
7.2 Significance of contribution to knowledge 114
7.3 Future outlook 115
7.3.1 Comsol-NEURON integration 115
7.3.2 Electrode array 115
7.3.3 Pulse dependent stimulation 116
7.4 Verdict 116
ii appendices 117
a microfabrication protocol for the microprobe 119
b supplementary information on resistivity profiling experiment 121

xviii Contents
b.1 Electric field penetration depth 121
b.2 Computed cell constant 122
b.3 Impedance stabilisation with time 123
b.4 Simulation on reduction of fringing effects 124
c miscellaneous simulations and calculations 125
c.1 Validation for neglecting electrode interface 125
c.1.1 Electrode-Electrolyte Interface 125
c.1.2 Calculations 127
c.2 Validation for neglecting capacitive tissue impedance 128
c.2.1 Model 128
c.2.2 Calculations 129
bibliography 131

L I S T O F F I G U R E S
Figure 1.1 Vision simulations for retinal degenerative diseases 4
Figure 1.2 Visual prostheses development worldwide 8
Figure 1.3 Placement scheme for subretinal and epiretinal prostheses 14
Figure 1.4 Subretinal prosthesis placement 15
Figure 1.5 Epiretinal prosthesis system 16
Figure 1.6 Artificial silicon chip (ASR) 17
Figure 1.7 Retina Implant AG subretinal implant 18
Figure 1.8 Boston retinal implant 18
Figure 1.9 Various generations of Argus implants 20
Figure 1.10 Our retinal implant 21
Figure 1.11 Sensors and actuators - Optogenetics 22
Figure 2.1 Cable model for the axon 41
Figure 2.2 Dipolar stimulation of the nerve fibre 45
Figure 2.3 Strength-duration relationship 48
Figure 2.4 Response-stimulus curve 49
Figure 3.1 Electrodes schematic 57
Figure 3.2 Photograph of the microprobe 57
Figure 3.3 Electrical equivalent for measured impedance 58
Figure 3.4 Bode plot and fit at 80 μm depth 59
Figure 3.5 Experimental apparatus 61
Figure 3.6 Bode plot in Ringer’s solution 63
Figure 3.7 Bode plot at various depths in a rat retina 63
Figure 3.8 Data comparison between rats and embryonic chicks 69
Figure 4.1 Schematic to exhibit electric field lines in case of electrode-retina
gap or no gap 72
Figure 4.2 SEM image of the EPFL implant 74
Figure 4.3 Argus I implant with both electrode variants 75
Figure 4.4 Extrapolated retina model from Heynen and Norren’s data on
macaque retina 77
xix

Figure 4.5 Simulation model with explanation on placement and RGC depth
79
Figure 4.6 Voltage and electric field plots in subretinal mode 86
Figure 4.7 Graphical representation of the lateral extent 86
Figure 5.1 Threshold current vs. electrode-retina distance (Epiretinal) 90
Figure 5.2 Threshold current vs. electrode diameter/area (Epiretinal) 92
Figure 5.3 Impedance vs. electrode distance (Epiretinal) 94
Figure 5.4 Lateral extent of stimulation (Epiretinal) 95
Figure 5.5 Lateral extent of stimulation for our implant (epiretinal configuration) 96
Figure 6.1 Spatial extent of various threshold stimulation currents (Subretinal) 103
Figure 6.2 Threshold currents vs. Lateral displacement (Subretinal) 104
Figure 6.3 Threshold currents vs. electrode distance (Subretinal) 105
Figure 6.4 Impedance vs. electrode distance (Subretinal) 106
Figure 6.5 Impedance vs. time (Subretinal) 106
Figure 6.6 Threshold vs. impedance (Subretinal) 109
Figure 6.7 Lateral extent of stimulation for our implant (subretinal configuration)
110
Figure B.1 Quasistatic simulation of electric field distribution for bipolar
electrodes during recording phase 121
Figure B.2 Determining the duration after which resistivity measurements
were stable 123
Figure B.3 Finite element simulations to demonstrate the reduction of
fringing effects by rounding electrode corners 124
Figure B.4 A zoomed version of the previous figure to show evidence of
reduction in fringing effects by rounding electrode corners 124
Figure C.1 Circuit model and quasistatic equations representing boundary
conditions 126
Figure C.2 Overpotential vs. charge transfer current 128
Figure C.3 Tissue voltage and overpotential for all values of applied electrode
voltage 128
xx

Figure C.4 Circuit equivalent (Cole model) of the simulation model between
the electrode and ground 129
L I S T O F TA B L E S
Table 4.1 Thresholds and lateral extents for different electrode sizes 73
Table 4.2 Positioning of ground electrodes 76
Table 4.3 Boundary conditions and equations in DC 83
Table 4.4 Constants employed for the quasistatic and/or DC simulations
84
Table 4.5 Solver parameters for simulations 85
Table 6.1 Thresholds and lateral extents for different electrode sizes 108
Table C.1 Relation between the overpotential and the charge transfer
current 127
A C R O N Y M S
AAVs adeno-associated viruses
AMD Age-related Macular Degeneration
ASR Artificial Silicone Retina
ChR2 Channelrhodopsin-2
CPE constant phase element
DC direct current
eNpHR enhanced Natronomonas pharaonis Halorhodopsin
FEM Finite Element Method
FCM Fohlmeister-Coleman-Miller
xxi

xxii acronyms
PRF Peak Resistance Frequency
PF physiological fluid
RD Retinal Degeneration
RF radio frequency
RGC retinal ganglion cell
RP Retinitis Pigmentosa
RPE Retinal Pigment Epithelium
SSMP Second Sight Medical Products
SD standard deviation
WHO World Health Organisation

Part I
D I S S E RTAT I O N


1I N T R O D U C T I O N
Most of the intractable blindness conditions originate from the retina, the most common
being the age-related or inherited retinal degenerations. The most vital part in the eye
contributing to vision is the retina even though other parts are equally important for
perceiving a good image. The retina is basically a piece of brain tissue that receives
direct stimulation from the outside world’s lights and images. Retinal degenerations
form a broad, heterogeneous family of eye diseases that primarily target the retinal
photoreceptor cells. They are broadly classified into two groups: (1) degenerations
like Retinitis Pigmentosa (RP) that begin by primarily affecting rod photoreceptor
cells; and (2) macular degenerations that mainly affect cone photoreceptors. Age-
related Macular Degeneration (AMD) constitutes the most common non-avoidable
cause of visual disability, affecting approximately 8 million people worldwide (World
Health Organisation (WHO), 1997), a number that continues to increase with the ageing
population [Congdon et al. 2004]. RP is the principal cause of inherited blindness. It
has an overall prevalence of 1:3000 to 1:5000 [Haim 2002] and affects approximately
1.5 million people worldwide [Boughman et al. 1980, Haim et al. 1992, Humphries
et al. 1992]. Other important unavoidable causes of blindness are glaucoma, diabetic
retinopathy, and trauma [Thylefors et al. 1992, Congdon et al. 2003, Margalit and Sadda
2003]. The prevalence of these diseases, mainly age related, is expected to increase with
the current ageing of the population. These diseases generally have a negative impact
on the otherwise healthy individuals subjecting them to social and economic hardships
bringing down their quality of life drastically. The affected individuals often are in need
of substantial specialised attention from governmental agencies for the rest of their lives
incurring costs on both the individual and the government.
Treatment for these retinal degenerative diseases can be summarised below:
• Medical treatment: AMD can occur in two forms - dry and wet. While there is
no effective treatment for dry AMD which comprises 90% of AMD patients, an
advancement of the disease may be reduced by frequent supplements of specific
vitamins and zinc [AREDS Study Research Group 2001]. Anti-angiogenic therapy
3

4 introduction
(a) Normal vision.
(b) A scene as it might be viewed by
a person with age-related macular
degeneration.
(c) A scene as it might be viewed by a
person with retinitis pigmentosa.
Figure 1.1: Retinal degenerative disease simulations that demonstrate impaired vision (fromwikimedia under public domain).
(injectable drug treatment - ranibizumab [Lucentis®] or bevacizumab [Avastin®])
and laser photocoagulation [Pauleikhoff 2005] are routine therapies available for
wet AMD and benefits only a limited number of patients. Other experimental
treatments for this disease like photodynamic therapy, pharmacological inhibition,
surgical intervention, and radiation therapy are being explored [Ciulla et al. 1998].
Periodic screening and early laser treatment have proven to be helpful tools
for preventing blindness in patients suffering from diabetic retinopathy, and
alternative therapies are currently being studied [Harding 2003]. In hereditary
degenerations with known biochemical alterations, research has focused on
non-specific “antidegenerative” approaches, including the use of growth factors,
apoptosis control, and antioxidants (see e. g. [Dufier 2003, Zeiss et al. 2006]).
• Genetic treatment: It is expected to be the best alternative for RP [Hims et al.
2003, McFarland et al. 2004] in cases where the patient’s retina has some viable
photoreceptor cells. The basic principle of these therapies is to introduce normal
copies of defective genes into affected retinal neurons. It has been suggested that
gene vectors could be injected close to the photoreceptors, because the sub-retinal

introduction 5
space can be easily accessed. The gene transfer into post-mitotic cells appears
however to be difficult.
One of the promising gene therapy approaches involves Channelrhodopsin-2
(ChR2). It is derived from the green alga Chlamydomonas reinhardtii, and is a
microbial-type rhodopsin. Its speciality is that it functions as a light-driven cation-
selective channel. It has recently been reported [Doroudchi et al. 2011] that the
specific and stable expression of ChR2 in light-insensitive retinal neurons called the
bipolar cells using a recombinant adeno-associated viral vector (rAAV). Targeted
expression led to ChR2-driven electrophysiological ON responses in postsynaptic
retinal ganglion cells and significant improvement in visually guided behaviour
for multiple mice models of blindness up to 10 months post-injection. Light levels
to elicit visually guided behavioural responses were within the physiological range
of cone photoreceptors. The in vivo results demonstrated that virally delivered
ChR2 can provide a viable and efficacious clinical therapy for photoreceptor
disease-related blindness.
• Stem cell transplantation: When all photoreceptors are dead or otherwise not
functioning, photoreceptor cell transplantation and stem cell therapy would be
ideal. Transplantation of Retinal Pigment Epithelium (RPE) has proven to rescue
degenerating photoreceptors by phagocytic action and probably also by the
release of various trophic factors (see e. g. [Saigo 2004]). Transplantation of normal
photoreceptor rods to the Retinal Degeneration (RD) mouse (mutated retinal
degeneration species) retina seems to prevent and even reverse cone degeneration
[Mohand-Said et al. 2000]. Moreover, visual evoked responses have been obtained
on dystrophic rodents after transplantation of healthy retina into the subretinal
space [Woch et al. 2001, Klassen et al. 2004]. Stem cell therapy on an animal mode
of RP resulted in some functional photoreceptor replacement [MacLaren et al.
2006] but significant safety and functional difficulties need to be addressed before
the technique is used on a large scale. In conclusion, there is no treatment yet that
demonstrates long-term improvements in visual function on RP or AMD patients.
Cure for RP or AMD patients through medical and genetic treatment is a far fetched
goal. Over the last three decades an alternative approach is creating a niche in an
attempt to impart partial vision to such patients: visual prostheses. It all started as
early as 1755, when LeRoy discovered that electricity applied to a blind patient’s eye
with cataract resulted in a perception of light [Clausen 1955]. The relation between

6 introduction
electricity and vision were not discussed again until early 20th century when a group of
researchers described phosphenes1 elicited by direct electrical stimulation of the cortex
during surgery [Löwenstein and Borchart 1918, Krause 1924, Foerster 1929, Urban 1937,
Penfield and Jasper 1954]. These findings led Giles Brindley and his colleagues to the
first human trial2 of a “visual prosthetic implant” [Brindley and Lewin 1968a;b, Brindley
1973]. A few years later, Dobelle followed in Brindley’s footsteps and performed several
experiments with acute electrode configurations before implanting permanent devices
[Dobelle and Mladejovsky 1974, Dobelle et al. 1974, Klomp et al. 1977] in human subjects.
Several volunteers participated in these trials, and two have kept the implant for more
than 20 years [Dobelle 2000]. Thus, both Brindley and Dobelle with their pioneering
efforts in demonstrating feasibility of the approach, opened doors to the promising field
of visual prostheses.
During last three decades, there has been immense progress in development of
electronic visual prostheses. Even though optical [Banghart et al. 2004, Bi et al. 2006],
hybrid [Yagi et al. 1999, Wu et al. 2003] and chemical or physiological [Peterman
et al. 2003, Zibek et al. 2010] stimulation of retinal neurons are envisioned, electronic
prostheses are considered more feasible and promising. This can be associated with the
recent progress in microtechnology making it possible to envision extremely small and
densely integrated neurostimulators. These small neurostimulators or electrodes can
activate well defined volumes in the tissue enabling a resolution sufficient for useful
vision. Moreover, the success of cochlear implants influenced the early visual prosthesis
researchers to explore stimulation of secondary neurons to pass sensory information
and examine proper functioning of retino-cortical connections in profoundly blind
people [Dagnelie 2008]. Morphometric results from the studies on eyes from patients
with AMD or RP revealed the partial preservation of inner retinal cells [Stone et al. 1992]
e. g. ganglion cells. Post-mortem studies on profoundly blind people demonstrated
that 80% of inner nuclear layer and about 30% of the ganglion cell layer was retained
[Stone et al. 1992]. Simultaneously, in degenerated retinal models of human and animals,
abnormalities in the neuronal network within the retina were observed in the form of
neurite sprouting [Fariss et al. 2000] and neural remodelling [Marc et al. 2003]. Therefore,
the numerous pathological changes occurring within the degenerated retina may seem
to have serious implications on the ultimate success of visual prostheses. However,
1 phosphene: a sensation of a ring or spot of light produced by pressure on the eyeball or direct stimulationof the visual system other than by light. (Oxford Reference Online, 2010)
2 in 1956 an Australian researcher Tassicker [Tassicker 1956] was the first to patent a method of implanting alight-sensitive selenium photodiode behind a blind person’s retina to restore intermittent light sensations.

introduction 7
careful investigations and varied approaches [Humayun et al. 1996; 1999, Weiland et al.
1999] revealed that the brain can indeed respond to electric retinal stimulation [Chader
et al. 2009]: (1) even after long years of little or no formed sight or even light perception.
(2) in a damaged retina with the inner retinal neurons being the target of stimulation.
Presently, various teams are working towards the development of a visual prosthesis,
each of them with an approach to restore visual functionality at different stages of the
visual pathway. They can be categorised based on electric stimulation applied at cortex
[Schmidt et al. 1996, Maynard et al. 1999, Dobelle 2000], optic nerve [Veraart et al. 1998,
Lambert et al. 2003] and retinal stages [Rizzo et al. 2003, Hornig et al. 2005, Palanker
et al. 2005, Fujikado et al. 2007, Gerding et al. 2007, Yanai et al. 2007, Zhou et al. 2008,
Dommel et al. 2009, Zrenner et al. 2010]. Retinal implants seem to be the most elegant
and promising way to approach artificial vision [Perez Fornos 2006]. They could benefit
from the natural processing in the still intact key structures of the visual system. Surgery
is less invasive in comparison with other stimulation sites, which forms an important
clinical advantage. Finally, intuitions and conjectures about which approach might be
most suitable will have to be concluded based on the results of chronic implantation
in humans. Until sufficient data becomes available to draw concrete conclusions, it is
advisable to remain open-minded as to which approach might prove to be the best.
The growing popularity of retinal prostheses has currently influenced more
than 20 different groups (see Figure 1.2) examining the evolution of intraocular
(subretinal3, epiretinal4 and suprachoroidal5) and extraocular (trans- and episcleral6)
retinal prostheses (for schematic illustration on implant placement refer to paper by
Gerding2007 [Gerding 2007]). These retinal prostheses have evolved on two main
concepts, one where the viable optic path within the eye is still used to transmit visual
information. In the second concept, visual information is obtained by a camera system.
This information is then further processed depending on the stage of the visual pathway
where the stimulation is intended. However, common features [Ameri et al. 2008] of
almost all retinal prostheses are: (1) a light-sensitive device for capturing image data, (2)
implanted microelectronics for converting image data into a stimulus pattern, and (3)
a microelectrode array interface for delivering the stimulus current to the retina. Both
3 the implant is located on the outer retinal surface (behind the photoreceptor layer and in front of the RPE).4 the implant is placed on the inner retinal surface (against the retinal ganglion cell layer)5 the implant is placed between the choroid and the sclera6 the implant is placed on the sclera

8 introduction
epiretinal and subretinal implants have undergone chronic testing in humans while the
extraocular approaches have been limited to in vitro7 studies and animal models.
Figure 1.2: Some research teams and industrial groups worldwide that are developingimplantable visual prostheses (modified from Figure 5 of Chapter 1 in [Zhou andGreenberg 2009]). Bio-Retina from Nano Retina, Israel is a new initiative included inthis map.
Performance and usefulness of retinal prostheses depends on many aspects,
primarily categorised into electrical, surgical, biocompatibility and psychophysical8.
Psychophysical studies suggest that more than 1000 electrodes are needed for subjects to
feel safe in unpredictable environments including moving, eventually hazardous objects
[Perez Fornos 2006]. The electric current injected by these electrodes flows into the retinal
tissue and follows a certain path terminating at the return (ground) electrode located in
the eye. The consequent electric field distribution formed within the retina is the major
cause of activation in excitable cells [Palanker et al. 2005] that eventually contributes
to a visual sensation. In a conventional intraocular retinal prosthesis (subretinal and
epiretinal only) setup - the stimulation and return electrodes, retina and the vitreous
medium surrounding them are arranged in a specific arrangement. In such a complex
arrangement, it is experimentally tedious to determine the electric current or field
distribution originating from delivered stimulus on the electrodes. Moreover, an essential
7 in vitro (latin: “in glass”), refers to the measurements on cells cultured outside the body, i. e. in a test tubeor a culture dish.
8 Psychophysics: the branch of psychology that deals with the relations between physical stimuli and mentalphenomena (Oxford Reference Online, 2010). Psychophysical experiments adopting simulated prostheticvision can provide the minimum specifications of visual prostheses to realise certain tasks.

1.1 scope 9
condition for effective stimulation of the retina is its close proximity with the electrodes.
This is based upon the clinical demonstration that close proximity of electrodes to the
retina is key to safe and chronic retinal stimulation [de Balthasar et al. 2008]. In addition,
all clinical trials of retinal implants until now have utilised disc electrodes [Wilke et al.
2010b]. This is the major reason as to why either novel electrode geometries (protruding
or three-dimensional electrodes) or a way to let the retinal neurons migrate towards
the electrodes are being examined [Palanker et al. 2005]. An analytic interpretation of
such complex electrode-retina bioelectric interface is either tedious or impossible. A
computational approach is a promising candidate to investigate the electrical quantities
that are in question.
Ultimately, the success of a retinal prosthesis in clinical use relies on its longevity
and ability to provide safe and high resolution stimulation. There are various levels
of complexity involved before current injected from an electrode results in an image
perception [Wilke et al. 2010b]. A good understanding of these levels has not yet been
established. The initial level of complexity is the electrochemical effects that take place
during stimulation, when charge is injected into a sophisticated and anisotropic retinal
tissue. Other levels of complexity are related to how the neurophysiological processes
within and outside the retinal network in the visual pathway are influenced by the
extracellular currents and how the transduced information is eventually perceived.
Biophysical modelling in combination with simulation methods, supported with
experimental evidence, can be used to bridge the gap in understanding the processes
involved in the operation of a retinal prosthesis. In addition, they can contribute in pre-
determination of the stimulation efficacy of new electrode designs for retinal prostheses.
During the design phase of these electrode arrays, an early knowledge of current
densities and potentials in various layers of the retina induced by the electrodes would
be beneficial. It is hoped that the models, simulation framework and experiments
presented in this work, targeted at understanding important phenomena in in vitro
retina stimulation experiments and currently implantable retinal prostheses, will be
administered as a building block for new retinal prostheses.
1.1 scope
This dissertation involves the development of preliminary steps to an integrated
simulation framework that can estimate the efficacy of current implantable retinal
prostheses for humans. More precisely, a Finite Element Method (FEM) based simulation

10 introduction
framework to estimate the effect of geometrical factors on the stimulation efficacy
of clinical epiretinal and subretinal prostheses is presented. The framework was
constructed based on a representation of the retinal prosthesis during an implantation
scenario with realistic dimensions. The dimensions for the epiretinal case was similar to
Argus I clinical trials (Second Sight® Medical Products, Inc.) and for subretinal, it was
based on customised implant design meant for in vitro retinal stimulation experiments.
The retina was purely based on an electric model with its layer inhomogeneity
represented as a varying resistivity profile. The electric models of the retina were:
(1) extrapolated from in vivo9 resistivity measurements in macaque made by Heynen
and Norren [Heynen and van Norren 1985] and applied for simulating current
implantable epiretinal and subretinal prostheses; and (2) extrapolated from resistivity
profiling in isolated retinal tissue samples and employed for simulating epiretinal
and subretinal in vitro stimulation in chick retinas. The biological characteristics of
the retinal network was not considered as a part of the simulation framework. A
hypothesis for stimulation threshold to activate a ganglion cell was constructed from
an experimentally validated analytical model recently demonstrated by Boinagrov
et al. [Boinagrov et al. 2010]. The inferences drawn from the simulation framework
described the major aspects of currently employed implantable epiretinal and subretinal
prostheses’ efficacy and safe usage. A less significant but important portion of this
dissertation was dedicated to design, characterisation and implementation of electrodes
for in vitro resistivity profiling, subretinal and epiretinal stimulation experiments in
chick retinas. All simulations presented in this dissertation were based on monopolar
stimulation10. Comsol Multiphysics®, Inc.11 software was used for finite element based
computations to solve the electric field distribution in the entire volume conductor12
and especially in the retina.
1.2 modelling problem and its significance
Currently implantable retinal prostheses will need to be upgraded with more
stimulating electrodes to improve spatial resolution. The development of such high
density planar electrode arrays are faced with a serious problem of not being able
9 in vivo (latin: “within the living”), refers to experiments on a whole, living organism.10 an electrode of an array serves as a current source with a current sink in the form of a distant large return
electrode11 Comsol Multiphysics is a partial differential equation software to create 1D, 2D and 3D spatial models and
to simulate their static or time-dependent behaviour. It is possible to couple multiple problems based ondifferent physical models.
12 Trivial definition suggests a volume conductor to be the contiguous passive conducting medium thatsurrounds the region occupied by the excitable tissue (retina here) itself.

1.2 modelling problem and its significance 11
to stimulate the retina safely and efficiently [Dowling 2009]. This can be primarily
attributed to the distance between the target cells in the retina and the stimulating
electrodes themselves [Palanker et al. 2005]. The threshold current needed to activate
target retinal neurons depends on physical, electrical and biological aspects influencing
them. Physical aspects involve the electrode geometries, position of these electrodes,
natural curvature of the retina, etc. Electrical aspects consist of stimulus parameters
(width, duration, polarity of the pulse), conductivity and permittivity parameters
defining the volume conductor, retina, etc. Biological aspects are related to the
electrophysiological properties of the retinal neurons, neuronal cell density, neuronal
shape, retinal network behaviour, etc.
In order to understand functioning of current implantable retinal prostheses and
build new designs optimised for enabling a good degree of vision in affected patients -
a complete, integrated simulation framework addressing all above mentioned aspects is
indispensable. The significance of such a framework includes estimation and evaluation
of factors affecting performance of retinal prostheses such as stimulation thresholds,
spatial resolution, electrical (electroporation) and thermal (heat generated by the
implant) damage to the retina, power consumption, mechanical damage to the retina
and information on retinal network processing. As early modelling steps, taking into
account some of the critical physical and electrical aspects influencing activation of
retinal neurons, the simulation framework computes the electric fields in the electrode-
retina interface. Furthermore, knowledge of current densities in the retinal tissue can
resolve significant questions which include: design of implantable electrode arrays, a
proper location for the implant to be placed, optimal electrode geometry and ground
position, efficiency of different shapes and sizes of electrodes, optimal inter-electrode
spacing, maximum amount of current injected safely for a given configuration, efficiency
of current injection and current circulation in a tissue for a particular scenario (epiretinal
or subretinal). The following sections describe the model parameters that were included
in the simulation framework described in this dissertation.
1.2.1 Positioning of electrodes
Extracellular stimulation of the retina is employed by retinal prostheses through their
electrode arrays. This stimulation results in an application of electric field to the
medium surrounding the excitable retinal neurons. A retinal neuron is activated when
a change in the cross-membrane potential reaches a threshold value. The electric

12 introduction
field distribution and current spread within the retina is strongly dependent on the
position of the stimulation and the return electrodes. Depending on the positioning of
these two electrodes, stimulation schemes can be classified as three types: monopolar,
dipolar and multipolar13. Electrode arrays used in current clinical trials are designed
for monopolar stimulation [Wilke et al. 2010b]. A monopolar design is the most effective
in terms of number of electrodes needed to create a single phosphene ignoring time
multiplexing occurring in high electrode density arrays. Moreover, in large number
electrode arrays, the number of electrodes that can be activated without temporal
overlap is based on the stimulus pulse duration. Thus, monopolar schemes does not
support sequential activation in high resolution implants [Palanker et al. 2007]. Dipolar
or multipolar electrode configurations, while being less economic in terms of space and
power consumption, can deliver localised and closely confined stimulation to a certain
target volume. This is made possible because there exists a current source and sink for
each pixel of the retinal prosthesis and is consequently believed to decrease cross-talk
between electrodes. Hence, it is essential to consider the physical location of electrodes
in the model contributing to the correctness of retinal prosthesis simulation.
1.2.2 Geometrical factors
The proximity of the retina to the stimulation electrodes is crucial for safe and
efficient retina stimulation. Any distance between electrodes and the target neurons
will increase charge density, power and the spatial extent of supra-threshold electric
fields necessary for retinal stimulation [Palanker et al. 2005]. The higher charge
injection, in turn, causes increased cross-talk between electrodes, electrochemical
erosion of stimulating electrodes and probably even damage to the retina due to
excessive heating. Further, variation in distance between electrodes across the implant
surface and the retina leads to associated fluctuations in stimulation thresholds.
These uncertainties in the stimulation thresholds have been observed in basic clinical
studies on functioning of an epiretinal implant in patients receiving the Argus I (16
electrode) device [de Balthasar et al. 2008]. Interestingly, these researchers found a strong
correlation between stimulation thresholds and implant-retina distance but not with
other parameters. Therefore, proximity of electrodes to the target cells along with the
volume (occupied by interstitial medium) between the retina and implant are important
issues to consider in modelling and design of high-resolution retinal prosthetic devices.
13 two (dipolar) or more (multipolar) electrodes in close proximity forming one functional unit of stimulationand return electrodes to generate a phosphene

1.3 literature review 13
1.2.3 Electric model of the retina
The retina contains various layers comprising different types of neuronal cells (e. g.
horizontal, on- and off- bipolar, amacrine, and ganglion cells) with a complex array
of interneurons forming synapses between the photoreceptors and optic nerve [Kolb
1994]. Each of these multiple layers, characterised by different cell types and densities
[Rodieck 1973], render the retina electrically inhomogeneous in a transverse (radial)
direction. Neural tissue inhomogeneity is an important parameter affecting neural
stimulation [Lee and Grill 2005, Miranda et al. 2007]. By constructing an electric model
based on inhomogeneity, it is feasible to compute the electric field distribution in the
retina and consequently estimate parameters such as stimulation extents and threshold
for a retinal prosthesis. For a successful simulation, the framework should include
anatomically correct retina model describing electrical characteristics of the retinal
layers [Schmidt et al. 2008] with due attention to the size of the retina corresponding
to an actual implantation scenario. Recent modelling results [Minnikanti et al. 2010]
indicate that electric fields of high intensities (formed close to the electrode) are also
formed deep in the tissue when modelled as an anisotropic resistivity model. The
significance and relevance of an anisotropic electric model of a retina is justified in
modelling and simulation of a retinal prosthesis.
1.3 literature review
A brief record of retinal implants employed in ongoing clinical trials is presented
in the first part of this section. Subsequently, a short description of a parallel but
rapidly advancing field of Optogenetics14 is presented and its potential to replace
electric stimulation as a tool for retinal prostheses and in general neuroprostheses is
explored. In the last part, a review of the modelling strategies proposed by various
researchers which can act as building blocks for an integrated simulation framework is
discussed. With these two separate sections, it is hoped that the reader will appreciate
the need for formulating an integrated simulation framework that can estimate useful
parameters necessary for understanding and predicting the behaviour of implantable
retinal prostheses.
14 Optogenetics is the combination of genetic and optical methods to control specific events in targeted cellsof living tissue, even within freely moving mammals and other animals, with the temporal precision(millisecond-timescale) needed to keep pace with functioning intact biological systems. Source: Wikipedia

14 introduction
1.3.1 Retinal implants
Current retinal implants used in clinical trials consist of conventional planar electrodes
placed directly in contact with the retina using either a subretinal or epiretinal approach.
In the subretinal approach, the implant is placed in the subretinal space between the
pigment epithelial cells and the dead/dying photoreceptors. In the epiretinal approach,
the implant is placed on the surface of the retina that is in contact with the vitreous, i. e.,
the ganglion cell layer. Both approaches are illustrated in Figure 1.3.
Figure 1.3: Schematic of the retina with two possible types of implants. An epiretinal implantdevice consists of a photodiode array that receives signals from a camera, and sendspreprocessed information to the electrode array sitting directly on the retina. Thesubretinal implant uses similar signal processing with the advantage of being closeto the natural situation, that is, the network of retina cells is directly involved (from[Resatz and Rattay 2004]).
The subretinal implant is a single device implanted in the subretinal space [Chow
et al. 2004, Besch et al. 2008], between the outer retina and the RPE, activated by ambient
light incident on an array of photodiodes integrated in the device. An illustration of
a subretinal prosthesis system is presented in Figure 1.4. Hypothetically, the device
activates remaining intact neurons of the degenerate retina (predominantly bipolar
cells) present in the middle layers of the retina, utilising its inherent ability to encode
information. The whole implantation of a single device would use the eye’s existing
optics and its motility, and deter the need for externally supported electronic equipment.
These are some factors which may render the subretinal approach advantageous over
epiretinal prostheses.
1.3 literature review 15
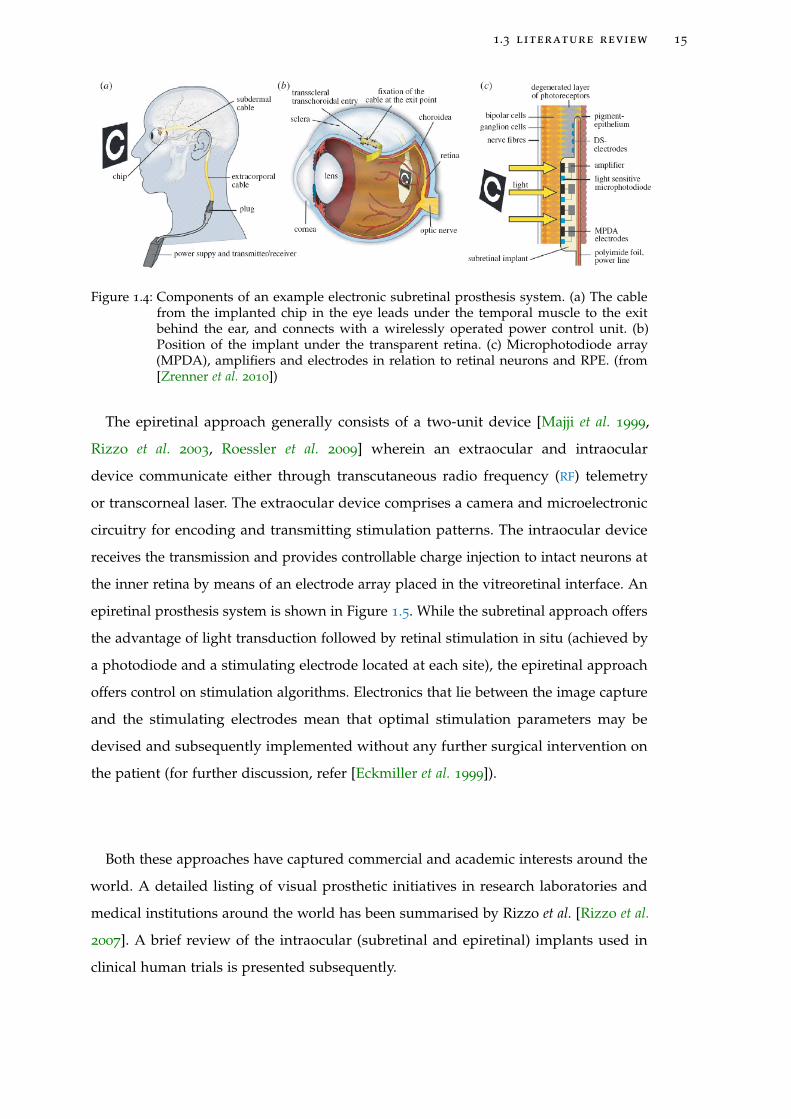
Figure 1.4: Components of an example electronic subretinal prosthesis system. (a) The cablefrom the implanted chip in the eye leads under the temporal muscle to the exitbehind the ear, and connects with a wirelessly operated power control unit. (b)Position of the implant under the transparent retina. (c) Microphotodiode array(MPDA), amplifiers and electrodes in relation to retinal neurons and RPE. (from[Zrenner et al. 2010])
The epiretinal approach generally consists of a two-unit device [Majji et al. 1999,
Rizzo et al. 2003, Roessler et al. 2009] wherein an extraocular and intraocular
device communicate either through transcutaneous radio frequency (RF) telemetry
or transcorneal laser. The extraocular device comprises a camera and microelectronic
circuitry for encoding and transmitting stimulation patterns. The intraocular device
receives the transmission and provides controllable charge injection to intact neurons at
the inner retina by means of an electrode array placed in the vitreoretinal interface. An
epiretinal prosthesis system is shown in Figure 1.5. While the subretinal approach offers
the advantage of light transduction followed by retinal stimulation in situ (achieved by
a photodiode and a stimulating electrode located at each site), the epiretinal approach
offers control on stimulation algorithms. Electronics that lie between the image capture
and the stimulating electrodes mean that optimal stimulation parameters may be
devised and subsequently implemented without any further surgical intervention on
the patient (for further discussion, refer [Eckmiller et al. 1999]).
Both these approaches have captured commercial and academic interests around the
world. A detailed listing of visual prosthetic initiatives in research laboratories and
medical institutions around the world has been summarised by Rizzo et al. [Rizzo et al.
2007]. A brief review of the intraocular (subretinal and epiretinal) implants used in
clinical human trials is presented subsequently.

16 introduction
Figure 1.5: Components of an example electronic epiretinal prosthesis system. (Left top) Aminiature camera mounted behind the eyeglasses of the patient captures externalimages such as from an eye chart. (Right top) These signals are sent to amicroprocessor that converts the data into an electronic signal, then to a receiverin the eye, and finally to a microelectrode implant tacked to the retina. The arraystimulates underlying retinal cells and this biological signal is sent through the opticnerve to the brain for the creation of a visual image. (Bottom) The enlarged areaof the retina shows a theoretical microelectrode array tacked to the front, vitreal(ganglion cell) side of the retina (from [Chader et al. 2009]).
Optobionics was the first company to attempt a clinical trial in the USA using a
subretinal implantation approach with a semiconductor-based microphotodiode array
[Peachey and Chow 1999] presented in Figure 1.6. Their device apart from surgical
complications suffered from the fact that it generated current only from light energy,
i. e., it is passive without any external power supply. In spite of these problems, initial
results of their Artificial Silicone Retina (ASR) indicated that it was both safe and
efficacious [Chow et al. 2004]. In fact, the implanted six RP patients demonstrated
unexpected improvements in visual function. Interestingly, this improvement included
areas relatively far from the implants, suggesting a ‘‘possible generalised neurotrophic-
like rescue effect on the damaged retina caused by the presence of the ASR’’ [Chow et al.
2004]. Since Optobionics did not meet the endpoints in the human trial, the company is
now inoperative.
A more successful hybrid subretinal device with integrated microphotodiodes and
microelectrodes has been developed by Retina Implant AG (Reutlingen, Germany)
and a team headed by Dr. E. Zrenner, Eye Clinic, University of Tuebingen [40]. The

1.3 literature review 17
Figure 1.6: Artificial silicon retina (ASR). The model used here is 2 mm in diameter and25 μm thick and contains approximately 5000 negative intrinsic layer–positivemicrophotodiode pixels electrically isolated from each other and separated by 5
μm. Each pixel is 20×20 μm square and is fabricated with a 99 μm iridium oxideelectrode deposited and electrically bonded to each pixel. Pixel current was 8 to 12
nA with approximately 800 foot-candles of illumination. The ASR microchip wasplaced within a fabricated Teflon sleeve and secured intra-operatively to a saline-filled syringe injector; it was then deposited within the retina by fluid flow. (a) TheASR’s size relative to a penny. (b) The ASR microchip with at 36X original (from[Chow et al. 2004]).
device consists of an active chip (3×3.1×0.1 mm) with 1500 microphotodiodes and
an additional 16 Titanium Nitride electrode (diameter 50 μm) array of 4×4 layout
with a 280 μm intra-electrode space for direct stimulation powered externally. Each
microphotodiode cell has an area of 72×72 μm. Unlike the Optobionics device, it has an
external power source. A photograph of the implant with description is shown in Figure
1.7. With a pilot study involving three subjects, they recently demonstrated for the first
time that subretinal microelectrode arrays with 1500 photodiodes can create detailed
meaningful visual perception in previously blind individuals allowing localisation and
recognition of objects up to reading capability [Zrenner et al. 2010]. Follow-up studies
are on-going to improve the capability of the implant and the wireless transmission of
power between the implant and the external power supplying unit.
A long-time leader in implant science has also been the Boston Retinal Implant
Project, a prototype presented in Figure 1.8, led by Drs. Joseph Rizzo and John Wyatt Jr.
They have developed novel strategies in engineering, surgical approaches, functional
neuroimaging and human testing, for example, studying the perceptual efficacy of array
stimulation in short-term surgical trials in humans [Rizzo et al. 2003].

18 introduction
Figure 1.7: Subretinal implant jointly fabricated by Retinal Implant AG and Zrenner’s group.(a) The microphotodiode array (MPDA) is a light sensitive 3.0× 3.1 mm CMOS-chipwith 1500 pixel-generating elements on a 20 μm thick polyimide foil carrying anadditional test field with 16 electrodes for direct electrical stimulation (DS test field).(b) The foil exits approximately 25 mm away from the tip at the equator of the eyeballand is attached to the sclera by means of a small fixation pad looping through theorbit to a subcutaneous silicone cable that connects via a plug behind the ear toa power control unit. (c) Magnification of the DS electrode array showing the 16
quadruple electrodes and their dimensions. (from [Zrenner et al. 2010]).82 Rizzo, Snebold, and Kenney
Roughly 5 yr back, the researchers became increasingly concerned with potentialproblems of the biocompatibility of implanted intraocular devices, the challenge of her-metic encapsulation of the electronics and the potential damage caused by transmissionof power sufficient to drive hundreds of electrodes. A radical redesign of the device(i.e., version III), which substantially mitigates the aforementioned concerns, wasundertaken. Version III is designed to maintain almost the entire bulk of the device outside of the eye (Fig. 5, lower right). This approach allows us to take advantage of therelatively spacious orbit (i.e., eye socket) that can accommodate a titanium case to providehermetic encapsulation of the electronics.
A fully assembled first generation wireless prosthetic device (Fig. 6) has been com-pleted. The foundation of the implant is a flexible, 10-µm thick substrate into whichwires and electrodes are microfabricated. The stimulator chip, several other discreteelectronic components, the data and power receiver coils, and the electrode array arethen attached by a variety of means to the thin substrate. After assembly, the devicemaintains sufficient flexibility to enable it to match the curvature of the posterior sclera.It has been verified that the implant works as designed with testing on the bench bydelivering wireless signals to the device (Fig. 7).
More specific details of the device are as follows. The device was designed by theMIT-based engineering team with the perspective that creation of detailed visual imageswould require a relatively large bandwidth for data transmission. High data rates requirea high frequency carrier, but power transmission at high frequencies is inefficient.Therefore, power is transmitted very efficiently at a relatively low frequency (125 kHz),whereas visual scene data is transmitted at a relatively high frequency (13.56 MHz).The system employs a high-efficiency class D oscillator to transmit power; a lower effi-ciency class A amplifier is sufficient to transmit data.
The core of the electronic system is the IC “stimulator chip.” This chip, which con-tains !30,000 transistors was designed and tested entirely by Luke Theogarajan (29).The chip employs aggressive strategies to achieve ultralow power performance—thechip dissipates only about 1.5 mW at low data rates (~100 kilobyte/s), and about 2.5 mWat higher data rates (~500 kilobyte/s) (30). The chip is capable of providing 800 µA for
Fig. 6. Photograph of current design of the animal retinal prosthesis. The secondary coils forpower and data transmission and the integrated circuit and discrete electronic components are allmounted on a flexible, polyimide substrate. Only the stimulating electrode array (red arrow) entersthe eye, where it is positioned within the subretina space. Calibration bar (lower left): 10 mm.
06_Rizzo 5/25/07 10:04 PM Page 82
Figure 1.8: Photograph of a recent design of the animal retinal prosthesis. The secondary coilsfor power and data transmission and the integrated circuit and discrete electroniccomponents are all mounted on a flexible, polyimide substrate. Only the stimulatingelectrode array enters the eye, where it is positioned within the subretinal space.(from Rizzo et al. [Rizzo et al. 2007])
Arguably, the most advanced prosthesis project is led by Dr. Mark Humayun at the
Doheny Eye Institute, University of Southern California Medical School in conjunction
with Second Sight Medical Products (SSMP). This is an effort initiated originally by Dr.
Humayun with Dr. Eugene de Juan Jr. about two decades ago. In 2002, Second Sight

1.3 literature review 19
launched its first trial involving the first generation epiretinal prosthesis called Argus
I. This 16-electrode device was implanted in six patients with RP between 2002 and
2004. The electrode array consisted of a combination of 260 μm and 520 μm diameter
disc electrodes. The prosthesis enabled these patients to detect when lights were on
or off, describe an object’s motion, count discrete items, and locate and differentiate
basic objects in an environment. Five of the six patients carried on to use the retinal
prosthesis at home. In 2006, Second Sight began a study of the Argus II, a second-
generation retinal prosthesis with 60 electrodes. The electrode array comprised 200 μm
diameter disc electrodes. Thirty-two patients, including 14 in the United States, have
been enrolled at 11 sites in five countries (France, Mexico, Switzerland, and the United
Kingdom). The Argus II group has recently claimed the first report of a visual prosthesis
improving the performance of 27 blind subjects, including those with a measurable
amount of native vision, in a spatial-motor task over a large cohort [Ahuja et al. 2010]. It
is the only clinical study of a chronically implanted active prosthesis in humans that is
used routinely, even out of the clinic and in the homes or business places of the users.
Other such studies so far have been only of short duration with relatively infrequent
use outside and limited to clinical trials alone [Kreatsoulas 2010]. SSMP has already
launched their Argus III implant having 200+ electrodes for the third phase that will
expand the number of patients, the quality of vision provided, and ease in which the
device is implanted [Saenz 2010]. This latest variant is currently undergoing animal
trials. The three generations of the Argus implants are presented in Figure 1.9.
Two other major efforts on epiretinal implants that have progressed to the point of
clinical testing is worth mentioning:
1. IIP Technologies GmbH15, who publicised an implant called the Learning Retina
Implant which has been designed such that the patients can optimise their visual
perceptions operated by dialog with a computer. Implantation studies on legally
blind patients were successfully carried out [Feucht et al. 2005].
2. Another effort is called the EPI-RET project. This implant has a “learning neural
computer” called a Retina Encoder, that works interactively with the user to
achieve the best image possible. After implantation in two rabbits, Gerding et al.
[Gerding et al. 2007] stated that “Retinal implant areas in contact to implanted
devices presented a severe structural damage and disorganisation.” A prospective
clinical trial report [Roessler et al. 2009] shows that six subjects have been
15 now called IMI Intelligent Medical Implants GmbH)
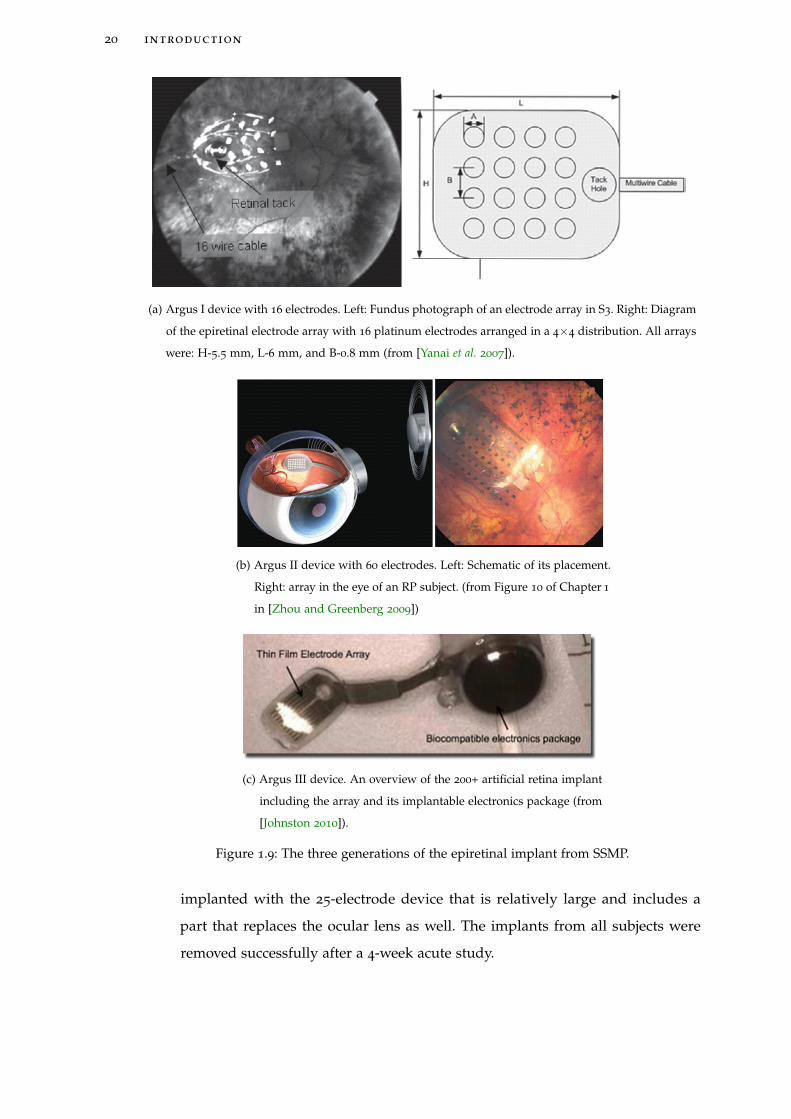
20 introduction
(a) Argus I device with 16 electrodes. Left: Fundus photograph of an electrode array in S3. Right: Diagram
of the epiretinal electrode array with 16 platinum electrodes arranged in a 4×4 distribution. All arrays
were: H-5.5 mm, L-6 mm, and B-0.8 mm (from [Yanai et al. 2007]).
(b) Argus II device with 60 electrodes. Left: Schematic of its placement.
Right: array in the eye of an RP subject. (from Figure 10 of Chapter 1
in [Zhou and Greenberg 2009])
(c) Argus III device. An overview of the 200+ artificial retina implant
including the array and its implantable electronics package (from
[Johnston 2010]).
Figure 1.9: The three generations of the epiretinal implant from SSMP.
implanted with the 25-electrode device that is relatively large and includes a
part that replaces the ocular lens as well. The implants from all subjects were
removed successfully after a 4-week acute study.

1.3 literature review 21
Alternatively, we have fabricated passive electrodes (i. e. without CMOS electronics)
for in vitro electrophysiology experiments and for in-vivo experiments with rats. This
flexible implant is presented in Figure 1.10. The in vitro stimulation experiments were
conducted on isolated retinal slices of embryonic chick in both epiretinal and subretinal
schemes of stimulation by our collaborators at the Geneva University Hospital (HUG).
A total of more than 100 rats have been implanted with our chips in collaboration with
INSERM Paris. A reliable surgical procedure has been set-up and good implantation
results obtained. A quantitative assessment of the electrode-retina interaction was made
by monitoring the electrical impedance for more than two months.
Figure 1.10: (Left) Photo of a passive flexible microelectrode array and its connector box designedfor implantation in rats. (Right) Layout of the flex and the tip of the probe.
1.3.2 Optogenetics - replacing electrode with light stimulation
Before discussing the state-of-the-art modelling strategies, we digress slightly to discuss
a relatively new technique known as Optogenetics that has the prospect of developing
into next generation neurostimulation technology where neurons would be activated by
light. The general information in this section is based primarily on review articles by
Miesenböck [Miesenböck 2009] and Scanziani et Häusser [Scanziani and Häusser 2009].
Optogenetics, as a term, appeared in literature only in 2006 [Miller 2006]. Purists have
remarked that “optogenetics” is a misnomer: similar coinages, such as optoacoustics
or optoelectronics, refer respectively to interactions of light with sound and electrons.
Optogenetics, by contrast, has nothing to do with interactions between light and genes;
it is the effects of light on the protein products of genes that matters. There are two
classes of optogenetic devices (Figure 1.11): sensors and actuators. Sensors translate
cell physiological signals into optical signals, making themselves indicators of cellular
function. Actuators transduce optical signals into physiological signals taking the role
of controlling cellular function. The nice symmetry between sensing and actuation

22 introduction
is practically important because sensors and actuators together make up a complete
experimental package: Actuators deliver controlled perturbations, and sensors report
system responses back.
13. J. Xu, J. Kang, Rev. Neurosci. 16, 311 (2005).14. J. F. Disterhoft, M. M. Oh, Trends Neurosci. 29, 587 (2006).15. P. Sah, R. F. Westbrook, A. Luthi, Ann. N.Y. Acad. Sci.
1129, 88 (2008).16. S. Rumpel, J. LeDoux, A. Zador, R. Malinow, Science
308, 83 (2005); published online 3 March 2005(10.1126/science.1103944).
17. C. Zhao, W. Deng, F. H. Gage, Cell 132, 645 (2008).18. M. S. Esposito et al., J. Neurosci. 25, 10074 (2005).19. L. A. Mongiat, M. S. Espósito, G. Lombardi, A. F. Schinder,
PLoS One 4, e5320 (2009).20. C. Schmidt-Hieber, P. Jonas, J. Bischofberger, Nature
429, 184 (2004).21. N. Kee, C. M. Teixeira, A. H. Wang, P. W. Frankland,
Nat. Neurosci. 10, 355 (2007).22. J. B. Aimone, J. Wiles, F. H. Gage, Neuron 61, 187 (2009).23. S. Ge, K. A. Sailor, G. L. Ming, H. Song, J. Physiol. 586,
3759 (2008).
24. J. B. Aimone, J. Wiles, F. H. Gage, Nat. Neurosci. 9, 723(2006).
25. S. Ge, C. Yang, K. Hsu, G. Ming, H. Song, Neuron 54,559 (2007).
26. C. D. Clelland et al., Science 325, 210 (2009).27. Y.-S. Lee, A. J. Silva, Nat. Rev. Neurosci. 10, 126 (2009).28. K. Sidiropoulou, E. K. Pissadaki, P. Poirazi, EMBO J. 7,
886 (2006).29. K. C. Martin, K. S. Kosik, Nat. Rev. Neurosci. 3, 813 (2002).30. R. G. Morris, Eur. J. Neurosci. 23, 2829 (2006).31. A. Govindarajan, R. J. Kelleher, S. Tonegawa, Nat. Rev.
Neurosci. 7, 575 (2006).32. P. Poirazi, B. W. Mel, Neuron 29, 779 (2001).33. M. R. Mehta, Trends Neurosci. 27, 69 (2004).34. C. D. Harvey, K. Svoboda, Nature 450, 1195 (2007).35. C. D. Harvey, R. Yasuda, H. Zhong, K. Svoboda, Science
321, 136 (2008); published online 12 June 2008(10.1126/science.1159675).
36. S. J. Lee, Y. Escobedo-Lozoya, E. M. Szatmari, R. Yasuda,Nature 458, 299 (2009).
37. J. Rose, S. X. Jin, A. M. Craig, Neuron 61, 351(2009).
38. A. Losonczy, J. K. Makara, J. C. Magee, Nature 452, 436(2008).
39. H. Gelbard-Sagiv, R. Mukamel, M. Harel, R. Malach,I. Fried, Science 322, 96 (2008); published online4 September 2008 (10.1126/science.1164685).
40. We thank the members of the Silva lab, especiallyS. Josselyn, S. Kushner, J. Won, M. Zhou, andM. Karlsson, as well as our colleagues D. Buonomano,F. Gage, P. Golshani, and P Poirazi, for discussions thathelped shape the ideas summarized here. This work wassupported by grants from NIH (R37-AG013622 andP50-MH0779720) to A.J.S.
10.1126/science.1174519
REVIEW
The Optogenetic CatechismGero Miesenböck
An emerging set of methods enables an experimental dialogue with biological systemscomposed of many interacting cell types—in particular, with neural circuits in the brain. Thesemethods are sometimes called “optogenetic” because they use light-responsive proteins (“opto-”)encoded in DNA (“-genetic”). Optogenetic devices can be introduced into tissues or wholeorganisms by genetic manipulation and be expressed in anatomically or functionally definedgroups of cells. Two kinds of devices perform complementary functions: Light-driven actuatorscontrol electrochemical signals, while light-emitting sensors report them. Actuators pose questionsby delivering targeted perturbations; sensors (and other measurements) signal answers. Thesecatechisms are beginning to yield previously unattainable insight into the organization of neuralcircuits, the regulation of their collective dynamics, and the causal relationships between cellularactivity patterns and behavior.
hat Is Optogenetics?The 2019 revision of the Oxford
English Dictionary, which may be thefirst to recognize the new word, will define opto-genetics as “the branch of biotechnologywhich com-bines genetic engineering with optics to observeand control the function of genetically targetedgroups of cells with light, often in the intact ani-mal.” Although the foundations of the field werelaid in the late nineties and early naughts (1–12), theterm appeared in the literature only in 2006 (13).Purists have remarked that “optogenetics” is a mis-nomer: similar coinages, such as optoacoustics oroptoelectronics, refer, respectively, to interactions oflight with sound and electrons. Optogenetics, bycontrast, has nothing to do with interactions be-tween light and genes; what matters is the effectsof light on the protein products of genes.
What Kinds of Light-Sensitive ProteinsAre Used in Optogenetics?There are two classes of optogenetic devices(Fig. 1): sensors and actuators (1). Sensors trans-
late cell physiological signals into optical signals;they make cellular function visible. Actuatorstransduce optical signals into physiological sig-nals; they make cellular function controllable.The pleasing symmetry between sensing and ac-tuation is practically important because sensorsand actuators together make up a complete ex-perimental package: Actuators deliver controlledperturbations, and sensors report system re-sponses back.
Experimentation on Which Systems?Optogenetics was developed to study informa-tion processing in the brain (1, 2, 13), but it iscertain to find many applications outside neuro-science. One vast, still entirely unexplored ter-ritory is information processing in the immunesystem.
What Is Special About Constructing Light-EmittingSensors and Light-DrivenActuators fromProteins?Proteins can be encoded in DNA. DNA mole-cules are stable, portable pieces of code that canbe packaged into many different kinds of de-livery vehicles and integrated into the genome ofnearly any organism. Once a piece of DNA has
been introduced into a cell, endogenousmachineryis directed to produce the required protein. Thissolves the problem of delivering experimentalagents deep into the tissues of intact organisms:After genetic modification, the organism itselfgenerates the tools necessary for investigating itsfunction; biology is revealed through biology.
However, not all optogenetic devices arewholly encodable. Some sensors (3, 14) andactuators (8–10, 15, 16) depend, in additionto a genetically encoded component, on smallmolecules that must be fed or injected. Others(11, 12, 17–19) require protein expression levelsso high that they cannot routinely be achieved by
W
Department of Physiology, Anatomy and Genetics, Uni-versity of Oxford, Parks Road, Oxford, OX1 3PT, UK. E-mail:[email protected]
Membrane potentialFlaSh, SPARC,VSFP, Mermaid
Calciumcameleon, camgaroo,
pericam, G-CaMP
Synaptic transmissionsynapto-pHluorin, sypHy
SensorsActuators
DepolarizingchARGeP2X2, TRPV1, TRPM8channelrhodopsin-2LiGluR
HyperpolarizingSPARKhalorhodopsin
Controller
Optical signalsdriving actuators
Opticalsignalsemitted
by sensors
Fig. 1. Sensors and actuators. Light-drivenactuator proteins are used to control geneticallytargeted cells in a circuit. The actuators transduceoptical commands into de- or hyperpolarizing cur-rents. Light-emitting sensor proteins report changesin membrane potential, intracellular calcium con-centration, or synaptic transmission.
www.sciencemag.org SCIENCE VOL 326 16 OCTOBER 2009 395
SPECIALSECTION
on
May
4, 2
011
ww
w.s
cien
cem
ag.o
rgD
ownl
oade
d fro
m
Figure 1.11: Sensors and actuators. Light-driven actuator proteins are used to control geneticallytargeted cells in a neural circuit. The actuators transduce optical commands intode- or hyperpolarising currents. Light-emitting sensor proteins report changes inmembrane potential, intracellular calcium concentration, or synaptic transmission(from [Miesenböck 2009]).
The two main mechanisms which trigger activity in the nervous system are by
sensory and electrical stimulation. The former is the method opted by sensory
physiologists, because by engaging the nervous system in an ethologically relevant
manner, representation of the various features of the physical world can be studied
through neuronal activity. In contrast, electrical stimulation is used to study mechanisms,
such as synaptic transmission, because by bypassing sensory interfaces it can be applied
to isolated preparations; furthermore, the activity generated by electrical stimuli is
temporally precise and reproducible.
Electrical stimulation involves the use of metal or glass electrodes to trigger action
potentials in individual neurons or groups of neurons. This approach has three key
limitations: it lacks specificity (except when stimulating single neurons or single
synapses); inhibiting neurons is difficult; and it is invasive, causing damage at high
stimulation intensities. These problems can be overcome by using two complementary

1.3 literature review 23
optical approaches. The first is the use of caged compounds, which involves a
pharmacologically active substance that excites or inhibits neurons, delivered in an
inert (‘caged’) form and activated (‘uncaged’) by breaking a photolabile bond, generally
with ultraviolet radiation. The second is the use of optogenetic tools, a new class of
light-sensitive proteins that, when expressed in neurons, allow their activity to be
modulated by light. These proteins are either intrinsically coupled to ionic conductances
or pumps, or affect neuronal excitability through second-messenger pathways [Nagel
et al. 2003, Airan et al. 2009].
Optogenetic tools represent another valid alternative to the stimulation electrodes,
and substantially surpass it in specificity and versatility [Nagel et al. 2003, Airan
et al. 2009]. Targeted expression of light-activated molecules such as channelrhodopsin
[Boyden et al. 2005], light-gated ionotropic glutamate receptor [Szobota et al. 2007]
or halorhodopsin [Han and Boyden 2007, Zhang et al. 2007] allows neurons or their
subcellular compartments to be stimulated with precise spatial, temporal and genetic
specificity. These new optical tools can perform tasks well beyond the capabilities
of conventional stimulation electrodes, such as independent stimulation of multiple
blended populations [Zhang et al. 2008], bistable activation of neurons [Berndt et al.
2009] and stimulation of defined second-messenger pathways (for example to mimic
modulatory neurotransmitter pathways [Airan et al. 2009]). These approaches can
be harnessed to map functional connectivity [Petreanu et al. 2009], to influence the
dynamics of neuronal circuits [Boyden et al. 2005, Zhang et al. 2007, Cardin et al. 2009]
and finally, to control behaviour [Szobota et al. 2007, Tsai et al. 2009b].
One of the most recent uses of an optogenetic tool as a cure for retinal degeneration
has been in restoring visual responses in mice models or human ex vivo retinas affected
by RP [Busskamp et al. 2010]. As a common pathology in RP, rod photoreceptors die
early, whereas light-insensitive, morphologically altered cone photoreceptors persist
longer in both humans and animals [Lin et al. 2009]. In order to restore light-evoked
activity in these light-insensitive cone photoreceptors, Busskamp et al. [Busskamp et al.
2010] genetically targeted a light-activated chloride pump, enhanced Natronomonas
pharaonis Halorhodopsin (eNpHR) [Gradinaru et al. 2008], to photoreceptors by means
of adeno-associated viruses (AAVs) [Lebherz et al. 2008]. Light-activated chloride pumps
were chosen as the rational candidates for reactivating vertebrate photoreceptors, as both
eNpHR-expressing cells [Zhang et al. 2007] and healthy photoreceptors hyperpolarise
in response to increases in light intensity.

24 introduction
Busskamp et al. showed that a microbial gene introduced to surviving cone cell
bodies reactivated retinal ON and OFF pathways and the retinal circuitry for lateral
inhibition and directional selective responses. Moreover, the reactivated cones enabled
retinally degenerated mice to perform visually guided behaviours. The tested time
window of intervention was up to ~260 days in both fast and slow retinally degenerated
mice models, suggesting that persisting cone cell bodies (~25%) are enough to induce
ganglion cell activity, even during later stages of degeneration. Their finding that AAVs
with a cell-specific promoter specifically transduced human photoreceptors and the
identification of patients with little measurable visual function and no outer segments
but surviving cone cell bodies suggest a potential for translating eNpHR-based rescue
of visual function to humans.
In the future, eNpHR-based restoration may be combined with other approaches
that increase the survival of altered photoreceptors [Chen and Cepko 2009, Yang et al.
2009, Léveillard and Sahel 2010]. More studies need to be conducted to bring the
potential halorhodopsin-based therapy to blind human patients and most importantly
be analysed for reliable and sustainable cure to their visual impairment.
1.3.3 Modelling strategies
Modelling and simulation offer a method of evaluating more experimental conditions
than would be possible through direct experimentation. The need for better models for
simulating electric stimulation of the retina was recognised and initiated by Weiland and
Humayun [Weiland and Humayun 2005] when only few simulation studies [Greenberg
et al. 1999, Resatz and Rattay 2004] were performed despite the existence of models on
retina biophysics and retinal circuitry. There has been a substantial contribution in the
field of modelling studies for more than a decade since then. An attempt is made in this
section to cover the multitude of aspects documented in literature that is relevant for
construction of an integrated simulation framework. This simulation framework can be
employed in understanding and predicting various factors affecting retinal stimulation.
The work cited in this section are in a chronological order of their original publication.
One of the first studies in models for retinal stimulation were presented by Greenberg
and his team. They used cell tracing methods to accurately model a retinal ganglion
cell (RGC) [Greenberg et al. 1999]. Their goal was to determine whether the RGC was
preferentially stimulated at its soma or the passing fibres distant from the soma. Using
NEURON [Hines 1993], a multicompartmental simulation package, they tested three

1.3 literature review 25
cell membrane models: a linear passive model, a Hodgkin–Huxley model with passive
dendrites (HH) and an all active compartmental Fohlmeister-Coleman-Miller (FCM)
model with five nonlinear ion channels. These models for epiretinal stimulation of
retinal ganglion cells predicted almost equivalent thresholds for axons and soma. Their
model, simulated as extracellular monopolar stimulation, did not consider the effect
of resistive retinal layers and precise location of the return electrode. The contribution
of RPE, choroid and sclera were not considered, as in an actual implant, the return
electrode is placed on the sclera (external to the eye) on the opposite side of the retina
from the stimulating electrode array [Greenberg et al. 2008].
Rattay and Resatz developed a model that predicted stimulus thresholds for electrical
pulses applied between two strip electrodes running parallel to the retinal ganglion
cell axons [Rattay and Resatz 2004]. The aim was to analyse the possible influence of
electrode geometry on selective stimulation of a target RGC by avoiding co-activation of
passing axons. Using Comsol16 and compartmental models (FCM) of RGC and bipolar
cells, the estimated excitation thresholds were calculated with the help of an activating
function. The thresholds were higher than those found experimentally. However, the
model does predict an increase in neurotransmitter release in the bipolar cells with
increased pulse duration and electrode size. The drawbacks however were similar
to those of Greenberg’s approach as the retina was treated electrically as vitreous
humour having resistivity of 57 Ω · cm. The location of the return electrode and the
electric influence of the anatomical features of the eye wall behind the retina were not
considered.
Computational modelling has been used to estimate the temperature increase in the
eye and head due to heat generation in the retinal prosthesis system. Gosalia et al.
[Gosalia et al. 2004] obtained thermal elevation results for a 3-D model using the explicit
finite difference method to implement the bio-heat equation. The spatial resolution of
the model used was discretised to 0.25 mm by 3-D interpolation from an original 1 mm
cross-sectional slice obtained from the National Library of Medicine (NLM) “Visible
Man Project”. An analysis of different locations (in the centre of the vitreous cavity
and at the anterior of the eye between the ciliary muscles) and sizes (4×4×0.5 mm and
6×6×1 mm) were considered. The chip was covered by an insulating encapsulation
with a uniform thickness of 0.5 mm, and was allowed to dissipate 12.4 mW over its
entire volume (excluding the insulation). The thermal conductivities of the chip and the
16 Comsol was previously known as FEMLAB®

26 introduction
insulation were assumed to be constant and uniform over their volume and equal to
60 J/(m·s·ºC) and 30 J/(m·s·ºC), respectively. As those simulations showed, placing the
chip in the anterior region, or increasing its size, reduced the computed temperature
increase in the vitreous humour and the retina. Their study disregarded the power
dissipated in the retina due to the stimulating array and also neglected the electrical
properties of the multilayered retina. This was later taken into account by Schmidt and
his team [Schmidt et al. 2008] mentioned later in this section.
The signals of ganglion cells are the indications of the complex retinal network
activity, which is transmitted by the ganglion cell axons to the brain [Zrenner 2002].
Appropriately, Eckmiller et al. [Eckmiller et al. 1999] devised a “retinal encoder” to
stimulate ganglion cells with a pattern similar to the ganglion cell output generated by
a native retina. The encoder approximates the typical primate ganglion cell-receptive
field properties of primate RGCs by means of individually tuneable spatiotemporal
receptive field filters. The encoder maps visual patterns onto spike trains for a number
of contacted ganglion cells. Clinical results on the success of this retinal encoder are not
available. The framework of that simulated visual system was later exploited by another
team [Cai et al. 2007] to investigate the encoding mechanism of the RGC. In addition,
Hornig and Eckmiller used FEMs to demonstrate that control of the maximum voltage
field increases with the orthogonal distance to the electrode (z-direction) [Hornig and
Eckmiller 2001]. Hornig modelled layers of retina neurons and used a training algorithm
to selectively stimulate individual model cells distal to a flat simulating grid. With this
approach, Hornig was able to discriminate between two adjacent model cells: one cell
was set into a sub-threshold refractory period while the other was stimulated.
Cottaris and Elfar developed a retina model that includes all major retinal cell types
and the corresponding interconnections among them to characterise the spatiotemporal
activation17 of the retina circuitry during the electrical stimulation period [Cottaris
and Elfar 2005]. Their simulation results show that during the period of electrical
stimulation, the activation of RGCs is governed mainly by the electric field imposed
by the stimulating electrode. This electric field causes the indiscriminate excitation of
17 Selective stimulation requires spatial and temporal coordination of voltage fields in conductive cellularmedia. Some control over the spatial contour of the fields is afforded by the shape of the current-inducedvoltage fields, where the spatial decay of the field is given by the resistivity of the solution, electrode shapeand material [McIntyre and Grill 2001]. Unfortunately, temporal control over the propagation of signals incellular media is virtually impossible to achieve [Ross 2008]. While, it is not feasible to temporally sumsignals at the neuron, the temporal component of voltage fields in the retina-vitreous medium are stillvery relevant.

1.3 literature review 27
ON and OFF retinal ganglion cells. This finding helps to design the image encoding
strategies for the retinal prosthesis.
In order to investigate retinal activation patterns resulting from dipolar current
stimulation, Dokos et al. [Dokos et al. 2005] formulated a simplified bidomain model
of bulk retinal tissue, epiretinally stimulated by one or two pairs of hemispherical
electrodes providing biphasic currents. To the best of our knowledge, this is the first
report of electrode-retina gap inclusion in a model for studying retinal stimulation.
They used the bidomain theory which states that extracellular currents are able to
stimulate excitable cells only if the anisotropic ratios of intracellular and extracellular
conductivities are unequal [Roth 1992]. They assumed an unequal anisotropy ratio in
both domains of a retina such that RGC and bipolar cells are intracellularly coupled
preferentially in the vertical direction normal to the retinal surface, with minimal
synaptic coupling in the lateral directions. A modified RGC model and Poisson equation
within the epiretinal vitreous were used for the computations. Calculations were carried
out in time domain using a custom predictor-corrector algorithm. Results from these
simulations suggested that a biphasic cathodic-anodic stimulus sequence is effective in
providing targeted focal activation of retinal tissue.
An improvement over Dokos’s previous model was recently reported by his team [Yin
et al. 2010] to include an active implementation of the retinal ganglion cell tissue layer
and passive implementation of deeper cell layers. The retinal ganglion cell layer receives
excitatory presynaptic inputs from the bipolar layer and inhibitory presynaptic inputs
from the amacrine layer. Simulations were performed to investigate the behaviour of
retinal tissue activation with epiretinal and suprachoroidal electrode stimulation. The
results indicated the presence of both early and late onset action potentials consistent
with experimental findings.
Another very important factor to consider in modelling studies is the depth of an
excitable neuron within the retina and at various eccentricities from the stimulating
electrode. Ziv et al. investigated the target cell location using threshold data from the
stimulation of RGCs in rabbit to build a mathematical model of the excitation field
around a conical-tipped electrode [Ziv et al. 2005]. The experiments had reported that
the threshold had a 1/r0.84 − 1/r3.19 dependence on distance from the stimulation tip,
in slight contrast with the strict 1/r2 dependence predicted by Coulomb’s law [Jensen
et al. 2003]. To explain this discrepancy, they proposed a modified model that takes
into account the location of the return electrode and the non-infinite dimensions of

28 introduction
the experimental environments often used for in vitro electrophysiology and some
retinal prosthetic designs. The horizontal displacement of the neuron with respect to
the electrode was also considered in the model. Their analytical model did not yield
predictions for neuronal depth that were statistically superior to those of the square
law. Instead, it did provide more realistic median values for cell depth than the square
law when these models were tested with threshold data points that were obtained from
more widely distributed areas on and above the retina. In conclusion, they stated that a
larger threshold data pool would be needed to make more definitive statements about
the relative value of their model versus the traditional square law model.
A series of interesting analytical models to predict the effect of distance between
the stimulation electrode and the target retinal cells over the threshold currents, cross-
talk between electrodes, electrochemical limitations, tissue heating were discussed by
Palanker and his team [Palanker et al. 2005]. They also predicted the resolution of
a retinal prosthesis based on considerations for some parameters mentioned above
(e. g. electric field interference between electrodes and intraocular heating). These
simulations were based on a hemispherical electrodes considering the return electrode
to be at infinity. Subsequently, they also studied a configuration involving closer return
electrodes (targeted for a high-resolution retinal prosthesis) and disc electrodes (Chapter
14 of [Humayun et al. 2007]). These models were studied in a homogeneous medium
disregarding the electrical anisotropy of the retina.
Schiefer and Grill [Schiefer and Grill 2006] studied the retinal sites of excitation after
epiretinal electrical stimulation. Computer-based, compartmental models of a simplified,
isolated RGC were simulated in NEURON to study the effects of cellular geometry,
electrode to neuron distance and stimulus duration and polarity on activation of a
RGC produced by extracellular stimulation. They found that stimulation was highly
dependent on the physical geometry between the electrode and the underlying ganglion
cells. Thresholds were lowest when the electrode was placed close to the characteristic
90º bend18 in the ganglion cell axon, perhaps explaining why epiretinal stimulation
“results in the production of punctuate rather than diffuse or streaky phosphenes”
[Humayun et al. 1996].
One of the most complete studies in modelling and simulation of an epiretinal
prosthesis was demonstrated by Schmidt and his colleagues [Schmidt et al. 2008]. This
work was published while the present thesis work was being carried out, and will be
18 The bend is naturally due to the anatomical layout of ganglion cells with axons leading to the optic fibrerelaying signals to the visual cortex.

1.3 literature review 29
treated as the state of the art for modelling and simulation framework presented in
this dissertation. Although the computation tool and representation of various building
blocks forming the simulation framework were different in this thesis - the general idea
of including features like realistic geometries, electrode placement and inclusion of
retinal inhomogeneity were identical.
In their work, a Partial Inductance Method was used for the computation of the
electrical coupling parameters of the radiating and receiving telemetry coils of a dual-
unit19 retinal prosthesis. Results for the inductive coil coupling were presented and
different coil geometries were compared. Further, a Finite-Difference Time-Domain
(FDTD) method for the solution of a bio-heat equation was used to compute the
temperature increase caused by the implanted electronics and the electromagnetic
absorption due to the external power and data telemetry link [Singh 2009]. Temperature
increases due to the implanted microchip, coils, and stimulating electrode array were
presented.
In addition, they computed current spread in a human retinal tissue based on a
refined electric model of a retina using multi-resolution impedance method. Results
showed variations of current spread in the retina and eye due to different electrode array
geometries and placement configurations. As an advancement over studies conducted
by Gosalia et al. mentioned earlier, Schmidt et al. found that complexity of the relation
between temperature increase and physical characteristics of the implanted electronics
is not only limited to their position or size; for e. g., it may also involve the power
distribution characteristics and material properties of biocompatible materials used
for insulating the chip. The drawback of an electric retina model used by Schmidt
and his team was refined from existing resistivity measurements in a frog Karwoski
et al. [1985] and not a human. Moreover, their model did not include the effect of the
electrode-retina gap and its effect on retinal stimulation.
In order to study the effects of monopolar, dual monopolar and dipolar stimulation
schemes over the threshold currents necessary to epiretinally stimulate the RGCs,
the electric field distribution between the electrode and the retina was analysed
by Ahuja et al. Ahuja et al. [2008]. Simple direct current (DC) simulations using
Comsol were conducted to conclude in support of their experimental results which
showed 212% higher thresholds for a dual monopolar in comparison to a monopolar
stimulation scheme. The simulations were made in physiological saline once again
19 external camera and wireless transmitter integrated in a single device

30 introduction
without considering the anisotropic retina. The details of the geometry were ignored
too as this was more of a validation study to support their experimental results.
A simulation study targeted at modelling electrophysiological properties of RGCs
during epiretinal stimulation was presented by Kameneva et al. [Kameneva et al. 2010].
A model of the electrophysiological properties of ON and OFF retinal ganglion cells
(RGCs) was constrained and validated using experimental data from the literature.
Their simulations supported the experimental findings that differ in the magnitude of
the T-type Ca2+ current explaining differences in the intrinsic electrophysiology of ON
and OFF RGCs. These models can be used to investigate the potential for differential
stimulation of ON and OFF RGCs during retinal stimulation with sinusoidal current.
The model predicts that OFF cells fire preferentially over ON cells in a frequency band
around 10 Hz. The suggested low frequency raises questions on the temporal resolution
and assurance against electrode corrosion. These kinds of studies are out of scope for
this dissertation and hence not commented upon.
To our best knowledge, the first modelling studies on subretinal stimulation of
retina was only demonstrated recently by Gerhardt et al. [Gerhardt et al. 2010]. They
investigated the spatial characteristic of retinal polarisation obtained by electric field
simulation through a subretinally placed monopolar and dipolar electrode array. They
combined electric potential simulation through a boundary element method with a
segmented bipolar cell model. They used this to compute the membrane voltage at the
axon terminal of the bipolar cells as a function of the axon length and the electrode
diameter. They found that dipolar arrays offer a promising approach when simultaneous
stimulation is necessary at multiple retinal sites. The limitations of their study includes
the negligence of retinal inhomogeneity and distance between the electrode array and
the soma-dendritic terminal of the bipolar cells.
The group of Wilke [Wilke et al. 2010b] investigated the electric cross-talk between
the electrodes in a monopolar high resolution (up to 1500 electrodes) retinal prosthesis
when driven simultaneously. The electric field distribution was calculated with the
help of Comsol, essentially by solving the Poisson equation in physiological saline
with 25 to 1681 electrodes activated all together. The limit of spatial frequency of visual
patterns that could be resolved by such arrays can be assessed to be 4.5; 1.2; and 0.7
cycles/mm, for an anticipated distance of target neurons of 20 μm, 200 μm and 400 μm,
respectively. This relates to a best achievable theoretical visual acuity of 2%, 0.6%, and
0.3% of normal vision, respectively. Their studies reiterated the importance of electrodes

1.3 literature review 31
being closer to the target cells or even creating more confined stimulating fields within
the retina to guarantee high resolution retinal stimulation and good visual acuity. They
neglected the electrical properties of the retina.
An important reference for the simulation framework presented in this dissertation
which validates our assumption on the implemented threshold criterion, is an analytical
study from the group of Palanker [Boinagrov et al. 2010]. They modelled extracellular
neural stimulation numerically and analytically for several cell shapes and types bearing
active membrane properties. The strength-duration20 relationship was found to differ
significantly from classical intracellular models. It was demonstrated that extracellular
stimulation can have not only lower but also upper thresholds and may be impossible
below certain pulse durations. It was inferred that in some regimes the extracellular
current can hyperpolarise cells, suppressing rather than stimulating spiking behaviour.
It was demonstrated that thresholds for burst stimuli can be either higher or lower
than that of a single pulse, depending on pulse duration. The modelled thresholds
from their study were found to be comparable to published experimental data. It was
also found that the electroporation thresholds, limiting the range of safe stimulation,
were exceeding the stimulation thresholds by two orders of magnitude. Their results
provide a biophysical basis for understanding stimulation dynamics and guidance for
optimising the neural stimulation efficacy and safety.
Finally, the most recent of all modelling studies that justifies and proves the relevance
of using an electrically anisotropic model of the retina for simulation studies was
conducted by Minnikanti et al. [Minnikanti et al. 2010]. This work complements the
usage of a electric laminar model of a retina for simulation of retinal stimulation as
mentioned in the study conducted by Schmidt et al. [Schmidt et al. 2008] described
earlier. They developed a compartmentalised FEM of the electric field generated in the
rabbit retina caused by a biphasic stimulus pulse. The model included the different
resistivities and capacitances of the retina, RPE, and sclera. Axisymmetric 2-D FEMs
were created for monopolar stimulation electrodes using Comsol. Electrodes of 250 μm
diameter with 10 μm thick insulation were placed in three configurations with respect
to the retina: epiretinal, subretinal and suprachoroidal. A broad return electrode was
located at the back of the eye on the sclera. The relative dielectric constants of each eye-
wall layer with linearly varying resistivity for the retina layers were also incorporated
into the model. Simulations using biphasic 1 mA/cm2 current pulses with pulse widths
20 A graph relating the intensity of an electrical stimulus to the length of time it must flow to be effective.

32 introduction
of either 0.5 ms (0.5 µC/cm2), 1 ms (1 µC/cm2), and 5 ms (5 µC/cm2) indicated high
electric fields in the RPE for all three configurations. They claim that RPE needs to be
taken into consideration for determining safe levels of stimulation. In conclusion, they
demonstrate the differences in using a retina model of constant resistivity (4k Ω · cm) in
comparison to that of a Gaussian resistivity model (3k− 7k Ω · cm).
1.4 dissertation position with respect to the state of the art
There has been extensive previous work in modelling and simulation to better
understand retinal stimulation and appropriately aid in designing efficient retinal
prostheses. But none of the previous modelling studies on modelling retinal stimulation
dealt with the elements of an implantable retinal prosthesis in an integrated simulation
framework. The contribution this dissertation makes to the field of modelling retinal
stimulation are the preliminary experimental and modelling steps taken in constructing
a complete framework for simulating the behaviour of retinal prostheses under various
clinical and experimental conditions.
The primary goal of this dissertation was to study the effects of geometrical factors
affecting stimulation thresholds of a retina. One of the major contributions made in
achieving this was the utilisation of FEM-based simulation framework to evaluate these
effects for different retinal stimulation schemes. The simulation results described in
Chapters 5 and 6 were intended to explain the effects of these factors for epiretinal
and subretinal stimulation schemes respectively. The parameters included were: (1) the
location and dimensions of stimulation and ground electrodes adapted to real in vitro
or implantation scenarios; (2) a realistic representation of the electrical properties of the
retina; (3) choice of a simplified, yet realistic activation threshold criterion based on a
recent analytical study [Boinagrov et al. 2010] that incorporates the critical stimulation
parameters such as stimulus type (monophasic/biphasic), shape (cathodic/anodic)
and duration under a single unified model (4) Estimation and prediction on threshold
currents and impedance with varying electrode-retina distances for different electrode
dimensions. Using our simulation framework, variation of threshold currents and
impedances were computed using different electrode-retina distances and disc electrode
sizes. In order to demonstrate the relevance of our framework, the frame of reference
for the computed results was the most recent in vitro and clinical data drawn from
our collaborators and literature. These data allowed us to demonstrate the role of
geometrical factors affecting stimulation thresholds. We estimated lateral extents of

1.4 dissertation position with respect to the state of the art 33
stimulation for the electrodes which provides an indication to the resolution of the
retinal prostheses used currently. Subsequently, parameters within our simulation
framework can be easily modified to predict the efficiency of novel electrode geometries
for future retinal prostheses.
As mentioned before, previous theoretical studies [Lee and Grill 2005, Miranda
et al. 2007] associate importance to neural tissue inhomogeneity in relation to neural
stimulation. This fact was illustrated for retinal stimulation in recent modelling studies
[Schmidt et al. 2008, Minnikanti et al. 2010] as electric models of retina having a
resistivity profile. These resistivity profiles were extrapolated from previous resistivity
measurements in frogs [Karwoski et al. 1985, Xu and Karwoski 1994] for the purpose
of their simulations. In order to explain the in vitro retinal stimulation results from
embryonic chick retinas obtained by our collaborators using our simulation framework,
it was necessary to know the retina resistivity profile to draw realistic and appropriate
comparisons between experiments and simulations. To the best of our knowledge, until
today, there exists no resistivity profile measurements in an embryonic chick retina.
A secondary goal of this work was to establish a convenient and accurate method
for determining the resistivity profiles in a retina. Another significant contribution
of this dissertation therefore was the experimental determination of resistivities in
isolated retinal slices from rats and embryonic chicks. A direct localised measurement
of resistivities in these retinal slices using bipolar21 electrodes was demonstrated in
Chapter 3 of this dissertation. For the first time, a flexible microprobe was employed
to measure local resistivity with bipolar impedance spectroscopy at various depths
in isolated rat and chick embryo retinas. Small interelectrode spacing permitted high
resolution measurements and the probe flexibility contributed to stable resistivity
profiling. The resistivity was directly calculated based on the resistive part of the
impedance measured with the Peak Resistance Frequency (PRF) methodology developed
by our group previously. The resistivity-depth profiles for both rat and chick embryo
models are in accordance with previous mammalian and avian studies in literature. We
demonstrated that the measured resistivity at each depth has its own PRF signature.
Resistivity profiles obtained with our setup provided the basis for the construction of an
electric model of the retina required for making predictions on stimulation parameters.
21 The word bipolar should not be confused with dipolar. Following the convention by Grimnes and Martinsen(Page 165 of their book [Grimnes and Martinsen 2008]), the terms monopolar–dipolar are of Greek origin,and are preferably used for current carrying systems (stimulation). The terms unipolar and bipolar are ofLatin origin and are used for signal pick-up electrode systems (recording).

34 introduction
These predictions were in good agreement with in vitro experiments conducted on
isolated embryonic chick retinas.
1.5 research objectives
The main objectives for the investigations done as a part of this dissertation can be
summarised as follows:
• To establish preliminary steps in forming an integrated simulation framework
that accommodates some of the most critical geometrical parameters affecting
quality of retinal stimulation significantly
• Devise a high resolution technique for resistivity profiling of the retina. Use
the extracted resistivity profiles from isolated slices of embryonic chick retina
to construct an electric model of retina. This model is incorporated as an input
to the computational framework modelled based on the scenario as in in vitro
stimulation experiments conducted by our HUG collaborators. A demonstration
of relevance of the measured resistivity profile would be proven by an agreement
of the computed and experimental values of stimulation parameters obtained
during the in vitro experiments.
• Evaluate the effect of geometrical parameters on both epiretinal/subretinal
stimulation schemes and consequently demonstrate the weaknesses in current
clinically deployed retinal prostheses
• Using the simulation framework, predict significant parameters that affect the
efficiency of retinal stimulation and demonstrate prospects of a useful tool for
new retinal prosthetic designs
1.6 limitations
Our simulation framework is a preliminary step to build an integrated framework for
studying retinal stimulation. The geometrical and electrical parameters in a conventional
implantable retinal prosthesis were taken into consideration. But, in order to represent
a more accurate and responsive model for extracellular stimulation of the retina, it is
imperative to consider the following factors or phenomena:
• Spatiotemporal properties of retinal stimulation [Cottaris and Elfar 2005, Horsager
et al. 2009; 2011]

1.7 dissertation layout 35
• Properties of the retinal network including intercellular connections [Resatz and
Rattay 2004, Cottaris and Elfar 2005]
• Degeneration and rewiring [Marc et al. 2003] in the retina to be modelled
• Local oedema22 to be modelled, instead a finite distance between the electrode
array and retina was considered
• Ganglion cell density
• Surface (porosity, etc.) and material properties of electrodes; Although, electrochemical
effects at the electrode interface were considered as a part of the model
• Depending on the electrode size, close to a planar electrode surface, the field is not
anymore uniform [Palanker et al. 2005]. In this dissertation, during simulation of
epiretinal stimulation, the RGCs are within a distance in the order of the electrode
size. Under these circumstances, the assumption on the threshold criterion is
questionable and needs to be re-considered.
• Location of the implant with respect to distance from the macula (personal
communication with Ashish Ahuja23)
• Impact of the electronics, for e. g. in computations for heat dissipation [Schmidt
et al. 2008]
• Agonist and antagonist effect on depolarisation and hyperpolarisation of excitable
retinal cells (Chapter 20 by Hetling from [Humayun et al. 2007])
While these factors or phenomena are listed as limitations, some or all of these may form
the basis for further research and refinement of the integrated simulation framework
proposed in this study.
1.7 dissertation layout
In the present chapter, the scope and the modelling problem were first introduced. An
exhaustive review of literature was presented to understand the state-of-the-art retinal
implants and the existing modelling strategies for retinal stimulation. After a brief
mention of the position of this dissertation with respect to the existing knowledge in
22 an abnormal accumulation of fluid beneath the electrode array and the retina after retinal prosthesisimplantation
23 Executive Director of Operations of The California Project to cure blindness at USC’s Keck School ofMedicine. Also a Research Scientist for Second Sight Medical Products

36 introduction
modelling retinal stimulation, the research objectives and limitations of our simulation
framework were stated.
A thorough understanding of theoretical concepts, relating to modelling neural
stimulation, is necessary for building a simulation framework. Chapter 2 takes a detour
presenting theory on the physiological basis for neural stimulation, electric fields in
biological volume conductors, stimulus characteristics affecting neural stimulation, safe
neural stimulation and direct-indirect retinal stimulation. The chapter also provides a
preview to modelling retinal stimulation by stating examples from literature.
The inhomogeneous nature of the retina is a key element in our simulation framework.
An accurate and simple method for determining the electrical anisotropy in different
layers of the retina is instrumental. In this respect, a detailed description of a direct
and local measurement technique to measure retina resistivity profiles in rats and
embryonic chicks was given in Chapter 3. A bipolar impedance spectroscopy technique
with extraction of tissue resistance at PRF was used for calculating the resistivity profile
in the vertical cross-section of the retina.
A computational basis needs to be established in order to evaluate factors affecting the
performance of retinal prostheses. Chapter 4 describes these factors in detail and gives
an account of the model variations employed for epiretinal and subretinal stimulation
schemes resulting in an integrated simulation framework. Corresponding electric models
of retina were used for clinical and in vitro scenarios. For example, the chick data
determined by the resistivity profiling experiment was utilised to construct an electric
model of a chick retina. The retinal model is an element of the framework which
computes quantities that can then be compared to in vitro stimulation experiments using
embryonic chick retina slices by our collaborators. In conclusion, the framework was
used to estimate and predict performance parameters of retinal stimulation for both
clinical and in vitro experiments by appropriate scenario-based adjustments.
In order to validate the built simulation framework, we compare the computations
with clinical and in vitro findings from the literature and experiments conducted by our
collaborators for both epiretinal and subretinal schemes. In Chapter 5, we describe the
results of the influence of geometrical factors on the stimulation thresholds of a clinically
employed epiretinal prosthesis, using our simulation framework. Threshold currents
and impedances for planar disc microelectrodes were estimated for different electrode-
retina distances. The profiles and the values for thresholds and impedances obtained
from our simulation framework are within the range of measured values in clinical

1.7 dissertation layout 37
trials (Argus I). An estimation of resolution for the electrodes used in these trials was
provided. The relevance of the retina resistivity profile obtained from embryonic chick
was demonstrated using valid comparisons with in vitro experimental data obtained
from our collaborators. Our results reiterate the importance of close proximity between
electrodes and retina for safe and efficient retinal stimulation.
After having demonstrated the relevance of the simulation framework for epiretinal
scheme, we describe the effects of electrode-retina interactions on subretinal prostheses
for in vitro and in vivo applications in Chapter 6. Threshold stimulation currents and the
lateral extent of the stimulation zone were computed for planar disc microelectrodes
again. Recent evidence indicates a decrease in threshold charge with time following
subretinal implantation [Wilke et al. 2010a]. A hypothesis based on an electrode-
retina gap was proposed to explain the variation in threshold stimulation currents.
Threshold stimulation currents and impedances for different electrode-retina gaps were
computed. We validate the hypothesis with our simulation results that the changes
in impedance observed with time in vivo can be mainly attributed to the varying
distance of the ganglion cells from electrodes due to changes in electrode-tissue gap. In
addition, through valid comparisons with in vitro experimental data obtained from our
collaborators in subretinal mode, it was also confirmed that the measured resistivity
profile of an embryonic chick retina is relevant for simulation studies.
The dissertation concludes with a discussion on the significance of an integrated
simulation framework employed to study the significant factors affecting the safe and
efficient stimulation by retinal prostheses in Chapter 7. A brief mention of the future
directions to improvements in the simulation framework is also provided.


2E L E C T R I C A L S T I M U L AT I O N O F R E T I N A : F R O M
E L E C T R O P H Y S I O L O G Y T O M O D E L L I N G
2.1 introduction
Retinal prostheses in the form of electrode arrays impart extracellular electric stimulation
to the retina. There are three possible mechanisms by which this stimulation can
activate pathways in the retina to elicit phosphenes in blind patients [Cohen 2007]. First,
electrodes can depolarise and form action potentials in ganglion cell axons. Second,
electrical currents can depolarise and form action potentials in local ganglion cells
directly. Finally electrical currents can depolarise cells in the retinal network such as
bipolar or amacrine cells which propagate the visual signal to ganglion cells indirectly.
To better understand the activation of a RGC by retinal prostheses, it is necessary to
review the fundamental principles of the interaction of electric fields and neurons.
In this chapter, rationales behind neurostimulation are solely discussed as it is
assumed that the reader is well versed with the theory on electrode-electrolyte
interface and the basic mechanism of charge injection at the interface (electrode
double layer1). Moreover, the reader is expected to have a fundamental knowledge
on anatomical properties of a neuron. Commencing from the physiological basis for
activation of neural tissue, the distribution of currents inside the volume conductor
and the interaction between a neuronal axon and applied electric fields is described. In
addition, the stimulus characteristics affecting neural stimulation such as cathodic and
anodic stimulation on activation threshold, mono- and dipolar stimulation, choice
of current/voltage controlled stimulation, strength-duration curves and selective
stimulation of retina is presented. A brief discussion on safety considerations for
both the electrode and retina during extracellular retinal stimulation is also presented.
The chapter terminates with a brief account on direct and indirect stimulation of retina
and a mention of few models explaining different phenomenon associated with retinal
stimulation.
1 the curious reader is referred to: Electric double layer theory - [McAdams et al. 1995, Linderholm 2006]and application to neurostimulation - [Merrill et al. 2005]
39

40 electrical stimulation of retina: from electrophysiology to modelling
2.2 physiological basis for neurostimulation
During extracellular stimulation, electron flow within the stimulation electrode is
converted into a current flow of ions within the volume conductor and the tissue. By
injecting this ionic current in the extracellular medium, the neural tissue undergoes
stimulation at a multicellular level, manipulating the kinetics of the voltage-gated
channels on those neural cells.
A neuron is characterised by a bilipid layer membrane that separates the intracellular
region from the extracellular medium and acts as a barrier to the movement of ions
between these two regions. The channels on the membrane are specific and selective in
permitting ion exchange. All neurons have a resting transmembrane potential with the
interior being negative with respect to the exterior of the neuron. A typical value of the
resting membrane potential is -60 mV measured inside the cell with reference to the
outside. This membrane potential is dependent on the concentration of the ionic species
such that the equilibrium potential of each ion differs from the membrane potential.
In general, the ions of interest are K+ (potassium), Na+ (sodium) and Cl− (chloride).
The electrochemical balance of the neuron is well described by the Nernst potential and
Goldman’s equation and in turn are sufficient to interpret the physiological activation
of neural tissue [Leanne Chan 2009].
The primary effect of an electric stimulation pulse on a neuron is a change of its
transmembrane voltage, being either a depolarisation or a hyperpolarisation. When
the axon membrane is depolarised up to its threshold voltage, based on its electrical
membrane properties, an action potential will be generated by the excitation mechanism
first described by Hodgkin and Huxley [Hodgkin and Huxley 1952]. While an action
potential generated under normal physiological conditions (at the initial segment of the
axon [Fried et al. 2009]) propagates orthodromically (away from the soma), a stimulation-
induced action potential propagates both orthodromically and antidromically (opposite
to the normal, orthodromic direction) along the fibre. A cable network, as shown in
Figure 2.1, was proposed by McNeal to calculate how nodal transmembrane voltages
are affected by a stimulation induced extracellular field. Ve represents the nodal
field potential. Ra represents the intra-axonal resistance. Rm represents the nodal
membrane resistance and Cm represents the nodal membrane capacitance. When a
negative electrode (cathode) is placed near to the nerve fibre, the node closest to the
cathode will have the most negative Ve and it will be depolarised the most, described by
the activating function AF by using equation 2.1. AF is the driving force of the change

2.3 electric fields in volume conductors 41
of nodal transmembrane voltages. For node n, the value of AFn is calculated as the
difference of two potential differences:
AFn = (Ve,n−1 −Ve,n)− (Ve,n −Ve,n+1) = (Ve,n−1 − 2Ve,n + Ve,n+1) (2.1)
Figure 2.1: Schematic drawings of electrical cable model (A) and myelinated nerve fibre (B).(from [Leanne Chan 2009], originally adopted from [Holsheimer 2003])
Ranck [Ranck 1975] observed that the threshold stimulus of nerve fibre excitation is
smallest in the vicinity of a cathode and rises with increasing distance. This observation
was explained by the theoretical approach of the activating function. The node closest
to the cathode will be excited first when the stimulation current is sufficiently high. As
the field potential gradients on both sides of this node get steeper (the field potential
gradient near the stimulation site is the steepest), AF will rise and the stimulus needed
for excitation will be reduced. The same situation (obtaining steeper field potential
gradient) also occurs when the nerve fibre gets closer to the cathode.
2.3 electric fields in volume conductors
The retina to be stimulated is in all possibilities surrounded by an extracellular fluid with
relatively high conductivity (0.5 to 1 S/m). The electrodes used for electric stimulation
are always placed in this “volume conductor” and it is essential to understand how the

42 electrical stimulation of retina: from electrophysiology to modelling
currents and the electric fields are distributed. The calculation of current density and
electric fields can be convenient in simple cases such as a homogeneous2 and isotropic3
medium.
2.3.1 Quasi-static formulation
The electric fields generated by an electrode located in a volume conductor can be
calculated by solving Maxwell equations. A simplified set of equations known as the
quasi-static formulation can be used owing to the fact that the stimulus pulse frequencies
are generally under 10 kHz [Plonsey and Heppner 1967]:
Conservation of charge:
5 ·J = 0 (2.2)
Gauss law:
5 ·E =ρ
ε(2.3)
Ohm’s law:
J = σE (2.4)
Electric field:
E = −5 φ (2.5)
where E is the electric field (V/m) defined as gradient of the scalar potential φ ; J is
the current density (defined as the current crossing a given surface, in A/m2); σ is the
conductivity (inverse of resistivity), in S/m; ρ is the charge density, in C/m3; ε is the
permittivity of the medium; and 5 ·A is the divergence of vector A.
2.3.2 Potential from a monopolar disc
In this dissertation, studies were conducted on disc stimulation electrodes. Under the
above mentioned quasi-static conditions, a disc electrode positioned in a semi-infinite
homogeneous medium with a return electrode at infinity (monopolar configuration)
can be modelled. In this case, the three-dimensional distribution of the extracellular
potential, Ve, is given by [Wiley and Webster 1982]:
Ve(x, y, z) =2V0
πarcsin
[2α√
(r + α)2 + d2 +√(r− α)2 + d2
](2.6)
2 the same conductivity everywhere3 the same conductivity in all directions

2.4 stimulus characteristics affecting retinal stimulation 43
where α is the electrode diameter and
r =√(x− xelectrode)2 + (y− yelectrode)2
d = z− zelectrode
V0 = IelectrodeRtissue
with xelectrode, yelectrode, zelectrode being the coordinates of the centre of the disc electrode,
Ielectrode the current injected by the electrode and Rtissue the resistive impedance of
the retinal tissue (assuming a linear purely resistive electrode-retinal interface). The
derivation is out of the scope of this dissertation.
2.3.3 Inhomogeneous volume conductors
In the retina, the volume conductor is clearly not homogeneous due to variation in
the intracellular densities. A valid question at this stage is how do those different
conductivities affect the potentials generated by the electrode? This can only be
answered numerically by computer models that take into consideration these various
compartments such as finite-differences, finite-elements, or boundary-elements methods.
A simple solution, however, can be obtained in the case of a semi-infinite homogeneous
volume conductor using the method of images. Consider two volume conductors
with conductivities σ1 and σ2 separated by an infinite plane. A monopolar stimulating
electrode is placed in region 1. Potential recordings are made in that same region. It can
be shown that the inhomogeneous volume conductor can be replaced by a homogeneous
volume by adding another current source located on the other side of the plane with an
amplitude equal to [Nunez 1981]:
I′=
σ1 − σ2
σ1 + σ2· I (2.7)
The mirror-image theory is only applicable in simple cases but can be useful to obtain
approximations when the distance between the recording electrode and the surface of
discontinuity is small, thereby approximating an infinite surface [Durand 2000].
2.4 stimulus characteristics affecting retinal stimulation
The variations in stimulus specifications alters the stimulation of a neuron. Following is
a brief discussion on the effects triggered by these variations with relevant results from
literature. Many of these effects have been previously discussed [Leanne Chan 2009]
and are re-visited here:

44 electrical stimulation of retina: from electrophysiology to modelling
2.4.1 Cathodic and anodic stimulation
There are different stimulation schemes, apart from cathodic and anodic excitation,
namely cathodic block and anodic block. These are well known from experimental
research [Ranck 1975]. In cathodic excitation, the cathodic current will propagate in
each direction from the excitation node. The electric field pattern results in slight
hyperpolarisation of the membrane on segments (virtual anodic) just lateral to the
area of depolarisation, but under typical circumstances these hyperpolarised segments
do not stop action potential propagation. Cathodic block occurs when the virtual
anodic hyperpolarisations are sufficient to compensate for the depolarisation induced
by the action potential in between the nodes. Hence, action potential propagation will be
blocked by these virtual anodic4 nodes. Anodic excitation occurs when the anodic current
is so large that the virtual cathodic depolarisation on either side of the hyperpolarisation
will generate an action potential. These action potentials will propagate in opposite
directions, as in cathodic stimulation. Finally, anodic block occurs when an anodic
current is applied to a fibre propagating an action potential. A few nodes closest to the
anode are hyperpolarised and will block the propagation when the anodic current is
large enough.
It has been reported that the anodic excitation is 3-7 times their cathodic excitation
threshold [Rijkhoff et al. 1994]. The cathodic block threshold is more than 8 times
the cathodic excitation threshold [Ranck 1975]. The high thresholds for both anodic
excitation and anodic block as compared to cathodic excitation have also been reported
elsewhere [Wee et al. 2000, Wee 2001]. Hence, cathodic excitation is commonly used in
neurostimulation due to its relatively low excitation threshold.
2.4.2 Monopolar and dipolar configuration
The injection of current solicits the use of two electrodes, an active electrode and a return
electrode. These can be placed in a monopolar configuration where the return electrode
is far away and the current radiates outwards from the active electrode, or in a dipolar
configuration where the return electrode is relatively close to the active electrode and
current is steered towards the return electrode. In monopolar configuration, the current
injected by the active electrode is distributed more or less evenly in all directions. The
threshold current is reduced when the return electrode gets closer to the active electrode
4 Virtual anode and virtual cathode are the side effects of cathodic and anodic stimulation respectively.
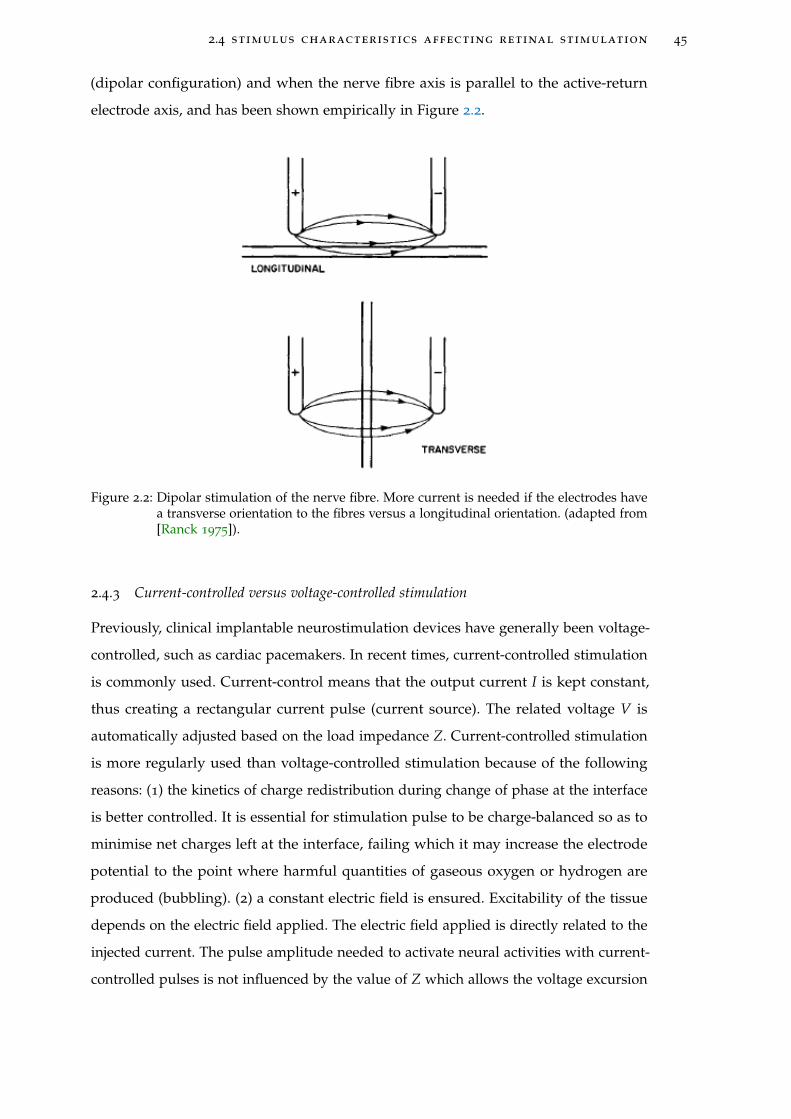
2.4 stimulus characteristics affecting retinal stimulation 45
(dipolar configuration) and when the nerve fibre axis is parallel to the active-return
electrode axis, and has been shown empirically in Figure 2.2.
Figure 2.2: Dipolar stimulation of the nerve fibre. More current is needed if the electrodes havea transverse orientation to the fibres versus a longitudinal orientation. (adapted from[Ranck 1975]).
2.4.3 Current-controlled versus voltage-controlled stimulation
Previously, clinical implantable neurostimulation devices have generally been voltage-
controlled, such as cardiac pacemakers. In recent times, current-controlled stimulation
is commonly used. Current-control means that the output current I is kept constant,
thus creating a rectangular current pulse (current source). The related voltage V is
automatically adjusted based on the load impedance Z. Current-controlled stimulation
is more regularly used than voltage-controlled stimulation because of the following
reasons: (1) the kinetics of charge redistribution during change of phase at the interface
is better controlled. It is essential for stimulation pulse to be charge-balanced so as to
minimise net charges left at the interface, failing which it may increase the electrode
potential to the point where harmful quantities of gaseous oxygen or hydrogen are
produced (bubbling). (2) a constant electric field is ensured. Excitability of the tissue
depends on the electric field applied. The electric field applied is directly related to the
injected current. The pulse amplitude needed to activate neural activities with current-
controlled pulses is not influenced by the value of Z which allows the voltage excursion

46 electrical stimulation of retina: from electrophysiology to modelling
to stay within the compliance voltage of the stimulator. However, in voltage-controlled
stimulation, the voltage needed is influenced by the value of Z and may thus vary over
time. The advantage of using a voltage-controlled stimulation is that it offers high power
efficiency, at the expense of safety due to lack of control over the injected charge into the
tissue (described above) [Simpson and Ghovanloo 2007]. Voltage-controlled stimulation
is beneficial provided that a blocking capacitor is used in the circuit, a compromise on
space efficiency. Recently, a voltage-controlled stimulation for safe neural stimulation
has been studied [Schuettler et al. 2008].
2.4.4 Strength-duration relationship
It has been known for a long time that it is the time change in the applied current and
not the continuous application of the external stimulus that excites a neuron. Direct
current DC cannot excite and even small amplitudes can cause significant tissue damage.
It also has been observed experimentally that the relationship between the pulse width
and the amplitude suggests that it is the total charge injected that contributes to the
neural stimulation.
This relationship between the amplitude and the width of a pulse required to bring
an excitable tissue to threshold is known as strength-duration relationship. Strength-
duration relationship measures the sensitivity of neuronal elements to stimulation.
When the duration of the stimulus duration d increases, the stimulus amplitude I
required to elicit a response becomes less. This inverse, non-linear relationship is shown
in Figure 2.3 A. The shape of a strength-duration curve is generally characterised by
two parameters, the rheobase current b (mA) and the time constant c (ms). This curve is
described by the LaPicque’s equation [Lapicque 1907]:
I = b ·(
1 +cd
)(2.8)
The rheobase current b, the asymptote of the strength-duration curve, is the minimum
stimulus amplitude required to elicit a response with an infinitely long stimulation
duration (a theoretical concept). According to this equation, c = d when I = 2b, which
defines the chronaxie value c as the pulse duration at twice the rheobase current.
Rheobase current is defined by the coupling between the tissue and the stimulating
electrode. By increasing the distance from the stimulating electrode to the tissue will
increase the rheobase current and therefore increase the necessary stimulus amplitude

2.5 safe stimulation of neural tissue 47
for eliciting a response at all pulse durations. Chronaxie is defined by the membrane
properties as:
τm = Rm · Cm (2.9)
with Rm being the membrane resistance and Cm being the membrane capacitance of
the target neuron. With both sides of equation 2.8 are multiplied by d, the Weiss’ Law
[Weiss 1901] is obtained,
I · d = b · (d + c) (2.10)
with I · d being the threshold charge (μC) required for stimulation. This linear charge
duration curve is also shown in Figure 2.3 A. This curve shows that the charged needed
for a threshold pulse rises when d increases. The electrical energy required U equals to
the amount of charge I · d multiplied by the electrical potential I · r, where r represents
the tissue resistance. Solving equations 2.8 and 2.10 for the electrical energy and
demonstrating in 2.3 B indicates that the most electrically efficient stimulation duration
d equal to the chronaxie c of the neuron being activated.
Another way to define the relationship between stimulus strength and excitation is
through amplitude-intensity function, as shown in Figure 2.4. This is typically used
where the response is an evoked potential and generates a plot of the stimulus strength
at fixed pulse duration against the amplitude of the evoked response. It helps in
determination of true threshold by simply extrapolating the curve to intersect the x-axis.
Amplitude-intensity functions are useful because neural prostheses typically operate
above threshold to provide a range of sensation or activation.
2.4.5 Selective stimulation of retinal cells
Electrical current pulses are used to activate neurons and replace lost visual functions
due to retinal diseases. When a neural system is stimulated, different cells respond in
different ways. The duration of the current pulse can be manipulated to target specific
neurons. Short current pulses have been demonstrated to target retinal ganglion cells,
the neurons closest to the electrode in epiretinal approach [Greenberg 1998, Fried et al.
2006, Sekirnjak et al. 2006] while long current pulses target bipolar cells.
2.5 safe stimulation of neural tissue
A system for neural stimulation if improperly designed can cause damage to the tissue
or to the electrode itself. For any neural stimulation system to be successful, it must elicit

48 electrical stimulation of retina: from electrophysiology to modelling
Figure 2.3: Strength-duration curve for current (I), charge-duration curve for charge (Q) andenergy-duration curve for energy (U) are plotted in (A) linear and (B) logarithmicscales. (from [Geddes 2004]).
the required neuronal excitation without causing any damage to the biological system.
Electrode shape, size and material along with stimulus pulse parameters need to be
judicially chosen to meet the requirements of the system. A representative description of
the extensive work carried out in defining the role of different parameters determining
the safety limit of the tissue and electrode is given in this section.
2.5.1 Mechanism
There are several mechanisms that may cause neural injury and can be broadly
categorised into two main classes:
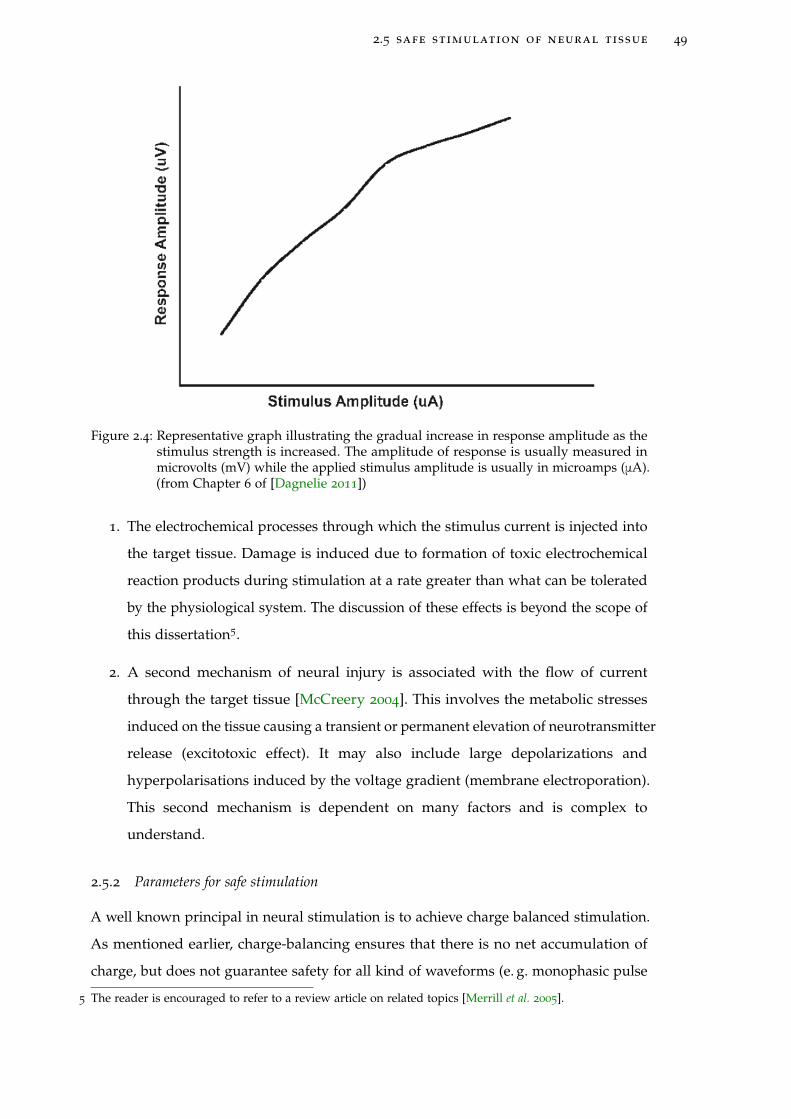
2.5 safe stimulation of neural tissue 49
Figure 2.4: Representative graph illustrating the gradual increase in response amplitude as thestimulus strength is increased. The amplitude of response is usually measured inmicrovolts (mV) while the applied stimulus amplitude is usually in microamps (μA).(from Chapter 6 of [Dagnelie 2011])
1. The electrochemical processes through which the stimulus current is injected into
the target tissue. Damage is induced due to formation of toxic electrochemical
reaction products during stimulation at a rate greater than what can be tolerated
by the physiological system. The discussion of these effects is beyond the scope of
this dissertation5.
2. A second mechanism of neural injury is associated with the flow of current
through the target tissue [McCreery 2004]. This involves the metabolic stresses
induced on the tissue causing a transient or permanent elevation of neurotransmitter
release (excitotoxic effect). It may also include large depolarizations and
hyperpolarisations induced by the voltage gradient (membrane electroporation).
This second mechanism is dependent on many factors and is complex to
understand.
2.5.2 Parameters for safe stimulation
A well known principal in neural stimulation is to achieve charge balanced stimulation.
As mentioned earlier, charge-balancing ensures that there is no net accumulation of
charge, but does not guarantee safety for all kind of waveforms (e. g. monophasic pulse
5 The reader is encouraged to refer to a review article on related topics [Merrill et al. 2005].
50 electrical stimulation of retina: from electrophysiology to modelling
with a blocking capacitor). Conventionally, safety limits for neural stimulation have
been divided into two broad categories:
1. Neural damage limits - ability of the biological tissue to withstand electric current
without any degradation
2. Electrochemical limits - ability of the electrode to store or dissipate electric charge
without exceeding the electrolysis limit, outside of which formation of harmful
products start
While neural injury limits are defined in terms of both charge density and charge per
phase, electrochemical limits are defined in terms of charge density only.
Charge density is simply the total charge per unit area of electrode and determines
the magnitude of the depolarisation or hyperpolarisation induced in the neurons and
axons close to the electrode. Charge per phase is the amount of charge injected during
each phase of the stimulus pulse and determines the distance over which the applied
stimulation can activate the neurons, i. e. the number of neurons activated. McCreery et
al. [McCreery et al. 1990] have shown that charge density and charge per phase act
synergistically to determine the safe or unsafe levels of stimulation. They showed that
neural damage is induced with low charge per phase but high charge density, as is
often the case for microelectrodes. Based on these data, Shannon et al. [Shannon 1992]
developed an empirical relationship delineating the boundary between safe and unsafe
charge injection for different charge and charge density levels:
log(D) = k− log(Q) (2.11)
where, D is the charge density in mC/cm2/phase and Q is the charge per phase in
mC/phase. The equation describes a family of lines for different values of k.
Along with charge density and charge per phase, other stimulus parameters such
as frequency of stimulation, duration, etc. play an important role in determining
the presence or absence of neural damage. McCreery et al. [McCreery et al. 1995]
demonstrated the effect of stimulus frequency as a parameter in causing injury during
peripheral nerve stimulation. Their study showed that continuous stimulation of the cat
sciatic nerve for 8 hours over 3 days causes the myelin sheath to collapse into the axonal
space leading to early axonal degeneration. The threshold of neural injury decreased
with increasing stimulus pulse frequency.

2.6 direct and indirect stimulation 51
2.5.3 Induced retinal injury by stimulation
In spite of the large scale studies on developing novel retinal implants and understanding
response of the visual system to artificial stimuli, only a few studies so far have
been dedicated towards understanding the consequences of long-term stimulation.
Güven et al. [Güven et al. 2005] carried out chronic stimulation studies in dogs and
found that the retina is able to tolerate chronic stimulation at 0.1 mC/cm2 without any
histological detectable damage or change in the electroretinograms (ERGs). Another
study investigated chronic stimulation effects through suprachoroidal-transretinal
stimulation [Nakauchi et al. 2007]. The results of the study showed that threshold
for safe charge increased logarithmically or almost linearly with increasing stimulus
duration but the threshold for safe current decreased logarithmically with increasing
stimulus duration. There was severe damage in the inner layers when the applied
current exceeded this threshold. Colodetti et al. [Colodetti et al. 2007] found that the
retina is sensitive to pressure exerted by the electrode. They studied the type of damage
due to pressure exerted by the electrode with and without accompanying high charge
stimulation in the rodent retina. Although the type of damage exhibited in both cases
was roughly similar, the extent of damaged area was significantly larger in the case of
accompanying high charge stimulation. In the race to move on to the next generation
high resolution retinal prostheses, it is imperative to study the possible consequences of
high level stimulation on both the retina and associated cortical structures. The groups
led by Palanker [Butterwick et al. 2007] and Jensen (Chapter 12 of [Dagnelie 2011]) have
made commendable progress in these areas recently.
2.6 direct and indirect stimulation
In order to determine a reliable stimulation protocol, it is necessary to establish
the fidelity of RGC activation by direct and indirect mechanisms. Several groups
have targeted deeper retinal neurons (bipolar cells and photoreceptors) for epiretinal
stimulation, which activates ganglion cells through the retinal neural network and
thus stimulates them indirectly [Jensen and Rizzo 2007]. Such stimulation attempts use
much larger electrodes (125–500 μm) and/or long-duration stimulation pulses (1 ms),
and result in multiple evoked spikes at long latencies (10 ms). With these stimulation
configurations, spike thresholds are typically much higher than the direct activation
values reported in literature [Jensen et al. 2003, Suzuki et al. 2004, Güven et al. 2005,
Jensen and Rizzo 2007, Ye and Goo 2007]. There are published reports of epiretinal

52 electrical stimulation of retina: from electrophysiology to modelling
stimulation that demonstrate direct activation of ganglion cells by using small electrodes
and short pulses [Kuras et al. 2004, Fried et al. 2004, Sekirnjak et al. 2007]. There is a
unique study on subretinal stimulation [Tsai et al. 2009a] indicating that direct activation
is a more robust mechanism to stimulate RGCs. In the simulation framework presented
in this dissertation, a direct activation of RGC is considered due to its established
potency.
2.7 modelling retinal stimulation
A detailed literature review on strategies for modelling various aspects related to retinal
stimulation has already been provided in Chapter 1. The methodologies that concern
the concepts discussed in this chapter are re-visited here.
There have been many modelling strategies [Greenberg et al. 1999, Resatz and Rattay
2004, Schiefer and Grill 2006] supported by experimental studies [Sekirnjak et al. 2008,
Fried et al. 2009, Behrend et al. 2009] in order to understand the excitation of a RGC by
retinal stimulation; for instance, knowledge of RGC excitation thresholds, exact location
of the originating action potential in the RGC, dependence on nature of stimulus pulses
used, etc. Cottaris and Elfar [Cottaris and Elfar 2005] developed a sophisticated retina
model by integrating the activating function along with all major retinal cell types
and the corresponding network connections to characterise spatiotemporal activation
within the retina. Effects of monopolar or dipolar stimulation schemes over threshold
currents during epiretinal stimulation was studied by Ahuja et al. [Ahuja et al. 2008].
The differential epiretinal stimulation of ON and OFF RGCs during retinal stimulation
with sinusoidal currents by incorporating the electrophysiological properties of both
RGC types was investigated by Kameneva et al. [Kameneva et al. 2010].
Modelling studies in relation to subretinal stimulation were limited to the teams of
Rattay and Stett. Resatz and Rattay [Resatz and Rattay 2003] used different electrode
geometries with a finite element representative models of two bipolar and a single
ganglion cell connected with each other. The activation function was based on models
based on compartmental cable equations as seen earlier in the chapter. The main
findings indicated that disc electrodes have smaller threshold currents than spherical
ones; and long rectangular electrodes parallel to the axons at the retinal surface seemed
to be good candidates for local selective stimulation. On the other hand, Gerhardt et
al. [Gerhardt et al. 2010] used a computational method with segmented cable model

2.8 summary 53
for bipolar cells and determined that dipolar electrode scheme is a better approach
compared to the monopolar during simultaneous stimulation at multiple retinal sites.
2.8 summary
The concepts and the phenomenon relevant to electric stimulation of neural tissue
presented in this chapter provides basis for a simulation framework to study retinal
prostheses. During the operation of a prosthesis, at the interface between the electrode
and tissue, the shape of the waveform can influence the threshold for activation as
well as the corrosion of the electrode and the tissue damage generated. The biological
processes and behaviour of retinal neurons are specific and selective to the stimulation
parameters used. A meticulous experimental protocol needs to be setup to determine
all parameters affecting retinal stimulation which in turn can be used to construct an
accurate model of a retinal prosthesis.


3D E T E R M I N I N G R E S I S T I V I T Y P R O F I L E O F T H E R E T I N A
3.1 introduction
Neural tissue inhomogeneity is an important parameter affecting neural stimulation
[Lee and Grill 2005, Miranda et al. 2007]. The vertebrate retina is a dense neural tissue
composed of multiple layers each characterised by different cell types and densities
[Rodieck 1973] rendering it electrically inhomogeneous. By constructing an electric
model based on inhomogeneity, it is feasible to compute the electric field distribution
in the retina and consequently predict parameters such as threshold and resolution of
stimulation for a safe and efficient retinal prosthesis. In order to construct a realistic,
passive electric model of a retina, it is necessary to measure layer resistivity locally and
precisely.
The resistivity of the retinal layers has been measured for various applications until
now such as local electroretinograms [Heynen and van Norren 1985] and current source
density analysis [Karwoski and Xu 1999]. Researchers mainly used the four-terminal
(tetrapolar) method to measure the resistivity profiles in the depth of the retina. Double-
barrelled [Karwoski and Xu 1999] and concentric [Heynen and van Norren 1985] glass
micropipettes have been employed as the pick-up electrodes previously. Tetrapolar
measurements require a complicated setup due to additional electronics (such as front-
end amplifier, current injection electrodes, etc.) and retina sealing issues (in ex vivo
eyecup based experiments). These experimental setups operated in constant current
injection mode creating an approximately constant current density in the measured
retinal area [Ogden and Ito 1971, Karwoski et al. 1996]. During measurements, the rigid
micropipettes cause a local damage to the retina allowing the perfusion solution to flow
into the cleft. This could result in a local redistribution of current around the inserted
micropipette that could lead to a change in measured voltage drop. This would result in
an inaccurate resistivity measurement due to an increase in the current flow through the
cleft leading to a higher voltage drop. In this situation, a constant current supposition
results in an artificial increase in measured resistivity. Furthermore, the frequency used
in previous experiments was not based on knowledge of the entire impedance spectrum.
55

56 determining resistivity profile of the retina
Neglecting the practical bandwidth might lead to interference of other parameters (for
e. g., interface and parasitic components) on the measured signal [Linderholm 2006].
Lesser reproducibility of glass micropipettes may lead to variability in measurements
(a relatively large range of 12-16 μm for electrode spacing was presented by Xu and
Karwoski [Xu and Karwoski 1994]).
In this chapter, an alternative and direct approach to measure local resistivities in
the various layers of an isolated retina is presented. The approach uses a thin, flexible
microfabricated probe of two electrodes to record impedance by an easy to setup
bipolar impedance spectroscopy technique. Bipolar measurement is more suitable if one
wants to measure a change at a specific position in an otherwise homogeneous sample
(Pg. 140 of [Linderholm 2006]). Considering each retinal layer to be homogeneous,
the changes in resistivity occurring at various layer interfaces can be well detected
by bipolar measurements. Our electrodes with close spacing allow high resolution
resistivity profiling in relatively thin isolated rat and chick retina samples.
3.2 materials and methods
3.2.1 Animals
Wistar (Rattus norvegicus) rats (Charles River or Janvier, France) in their postnatal
period between 14 and 16 days and Lohmann race chicks (Animalco AG, Switzerland)
in their embryonic stages of 12 and 18 days (E12/E18) were employed animal models
in this study.
3.2.2 Electrode design and fabrication
Rectangular electrodes with rounded corners were used to reduce fringing effects. The
dimensions and design of the microprobe used in this study is presented in Figure 3.1.
The rectangular electrodes are spaced 10 μm apart. The spacing between electrodes
is based on a compromise between a localised measurement (high resolution) and
maximum current penetration in the retina (sensitivity). Average retinal thickness for rat
is 150 μm [Thomas et al. 2006] and chicken is 175 μm [Huang et al. 1998]. High resolution
measurements are required to probe the different layers within the rat and embryonic
chick retinas. An electrode spacing of 10 μm is sufficient to obtain an elaborate resistivity
profile of the retina addressing typical retinal cell sizes ranging from 10 μm. Both, an
analytical (Pg. 203 of [Linderholm 2006]) and finite element method based computation
(Comsol Multiphysics 4.0a) of electric field penetration depth in saline (ρ = 1.5 Ω ·m)

3.2 materials and methods 57
for a 10 μm spacing between electrodes revealed an approximate depth of 8.3 μm (see
Appendix B). The large enough penetration depth ensures probing retinal cells making
an electrode spacing of 10 μm appropriate for the application under consideration.
Figure 3.1: A schematic of the electrodes on a flexible substrate with dimensions to scale.
The polyimide-based flexible microprobe 10-12 μm thick consisted of two recessed
Platinum electrodes (40 μm×25 μm), separated by 10 μm was fabricated based on an
established process [Metz et al. 2004] - refer Appendix A. A photograph of the complete
microprobe assembled on a plastic base for easy manipulation is shown in Figure 3.2.
Figure 3.2: Photograph of the device used. (Left) The plastic base is used to facilitate attachmentto a micromanipulator (not shown) for assisting in precise insertion of the electrodesinto the retina. (Right) The narrow polyimide shaft consisting of the electrodes is thepart that is inserted in the retina preparation.
3.2.3 Measurement method and modelling
The choice of measurement method depends on the degree of sample homogeneity
and the measurement hardware (i. e. whether the measurement hardware is better at
detecting absolute or relative changes) [Linderholm 2006]. By virtue of the similarity of

58 determining resistivity profile of the retina
cells within a retinal layer, we can consider each layer to be homogeneous. Owing to
their high sensitivity to small changes near the electrodes, bipolar measurements record
the resistivity of the layer. Bipolar impedance measurement method is used in this study
as it requires a simpler experimental setup compared to multielectrode schemes.
In order to measure a resistivity profile of the retina, it is essential to extract the
resistance in each layer. For the extraction of the tissue resistance from the measured
impedance, one of the approaches is to consider the impedance of an electrode-retina
configuration represented by an equivalent passive electrical circuit model as shown in
Figure 3.3. The model consists of contributions due to the electrodes-electrolyte interface
and the complex tissue impedance in series with it. The constant phase element (CPE),
ZCPE_E addresses the non-ideal capacitive behaviour observed in solid metal electrodes
[McAdams et al. 1995]. The complex tissue impedance is represented by a Cole model
[Cole 1940, Grimnes and Martinsen 2008] of a resistance (Rtissue) in parallel with a series
combination of an intracellular resistance (Rintra) and a CPE (ZCPE_T). The model is
suitable for AC analysis alone.
Figure 3.3: An electrical equivalent representing the electrode and tissue components basedon Cole model for measured tissue impedance. ZCPE_E is the CPE representationof the electrodes. Rintra is the effective resistance offered by the intracellular fluid.ZCPE_T is the CPE part of the tissue impedance. Rtissue is the resistive part of thetissue impedance. CPAR is the parasitic capacitance between the electrodes throughthe polyimide passivation.
A typical impedance/phase spectrum along with its model fit at a depth in the retinal
tissue is presented in Figure 3.4. Tissue resistance can be extracted from experimental
data involving impedance/phase spectra by using fitting algorithms applied on the
equivalent circuit model. Alternatively, tissue resistance has been extracted using the
peak resistance frequency (PRF) method in brain tissue impedance measurements
[Mercanzini et al. 2009].

3.2 materials and methods 59
Figure 3.4: Bode plot at a certain depth in the retina and the corresponding fit using the electricalequivalent. The tissue resistance is identified at the peak resistance frequency (PRF),the point at which the phase is closest to 0°.
The PRF method involves finding the frequency at which the measured impedance is
least capacitive (or closest to resistive behaviour). Below this frequency, electrode CPE
increases the measured impedance; above this frequency, the tissue CPE and CPAR each
separately or jointly decrease the measured impedance. A single choice of frequency to
determine tissue resistance is usually defined by the cut-off frequency calculated from
the electrode capacitance and tissue resistance itself. The PRF approach helps to define
the best measurement frequency for identifying tissue resistance from a typical tissue
impedance spectrum. Although, the tissue resistance can be extracted using fitting
methods on the electrical equivalent (Figure 3.3), its reliability is limited to uncertainties
in the various fitting parameters (ZCPE_E, ZCPE_T, Rtissue, CPAR).
The tissue resistance is extracted from the impedance magnitude at the PRF. At
three different depths in the retina, magnitudes at PRFs (ZPRF) associated with raw
experimental data compared within 10% of their corresponding fitted tissue resistance
(Rtissue) values. We do not observe tissue relaxation as a result of the dominating
electrode interface impedance (owing to the small electrode size). In view of possible
misinterpretation (curbed tissue relaxation) and algorithmic errors in the fitting method
using equivalent circuits, it was proposed to apply the PRF method to extract tissue
resistance from impedance spectra recorded at different depths in the retina.

60 determining resistivity profile of the retina
The resistivity (ρ) at any depth in the retina can be determined from the measured
tissue resistance (R) using a simple direct relationship given by ρ = R/k [Zahn 2003],
where k is the cell constant. The cell constant of the geometry used in this study was
analytically calculated as 232.75 cm−1 according to the method described by Jacobs et
al. [Jacobs et al. 1995]. A 3D finite element simulation revealed a cell constant value of
232.2 cm−1 indicating a good agreement with the analytical value (see Appendix B). The
theoretical and simulated values will be used later to verify the proper functioning of
fabricated electrodes. Conversion of measured advancement of electrode to percentage
of retinal depth corrects the resistivity profiles for deviation of the microelectrodes from
a plane perpendicular to the retina and addresses tissue shrinkage problems due to
dehydration during sample preparation.
3.2.4 Measurement apparatus and protocol
Experimental apparatus
The experimental apparatus consisted of a three-axe Eppendorf micromanipulator 5171
used for positioning the microprobe with respect to the retina sample as shown in
Figure 3.5. The micromanipulator enables a uniform advancement of the electrodes
into the tissue leading to a reliable impedance measurement. The extracted retina slices
from a rat or embryonic chick were placed on a 3-5 mm thick Agar (Sigma Aldrich,
Switzerland) gel (1% in Ringer’s solution ) inside a plastic petri-dish. The dual purpose
served by Agar gel as a base for the retina is – (i) an indication for the termination
of impedance measurement (low resistance of Agar gel) and (ii) a protection cushion
for the penetrating electrodes preventing them from breaking by coming in contact
with the petri-dish base. The petri-dish is filled with Ringer’s solution submerging
the retina-gel structure. All complex impedance data were acquired using an Agilent
4294A (Agilent Technologies, USA) precision impedance analyser connected to a PC
via a GPIB controller (National Instruments, USA). Signal frequency sweep was made
from 100 Hz to 1 MHz for each impedance/phase spectrum, sufficiently covering the
bandwidth of electrophysiological interest and ensuring the PRF is easily identified
and consequently the tissue resistance. Signal amplitude of 25 mV without dc offset
was used as it was a good compromise between generated noise in the recorded signal
and preventing possible extreme electric field effects. Moreover, it was supposed that
applied signal was small enough to avoid any significant activation of retinal neurons
and associated resistivity changes during measurements.

3.2 materials and methods 61
Figure 3.5: Experimental apparatus consisted of (i) an Eppendorf 5171 micromanipulator thatdisplaces the microprobe vertically (z-axis) in steps of 10 μm, (ii) an Agilent 4294Aimpedance analyser for recording impedance/phase spectra for each probed retinaldepth. (iii) a plastic petri-dish containing the isolated retinal slice placed on a blockof Agar gel (1% in Ringer’s solution) submerged in Ringer’s solution.
Electrode cleaning and validation
Before every new experiment, the electrodes were either cleaned with 2% mild soap
solution (rat trials) or chemically treated with the RCA-1 [Kern 1993] cleaning process
(chick embryo trials) for removing any organic contaminants. They were subsequently
treated under a nitrogen gun to dry and blow away dust particles. The impedance
spectrum of electrodes was obtained in standard Ringer’s solution to validate their
proper functioning.
Slice preparation
A common protocol for retinal slice extraction was followed for both wild-type juvenile
rats and embryonic chicks. Eye balls were extracted from decapitated animals. Under
low light conditions, the cornea, iris, and lens were removed from the eye ball followed
by transection of the eyecup to float pieces of retina into a dish of Ringer’s solution to
obtain isolated retinal slices without the retinal pigment epithelium. The slices were
then perfused in Ringer’s solution continuously bubbled in 95% O2/5% CO2 until it
was placed on the Agar gel. The surface on the Agar gel was pre-treated with a solution
of cellulose nitrate (0.14 mg/ml in methanol) and dried. This acted as an adhesion
promoter for the retina to stay on the gel preventing it from being washed away
when in contact with the Ringer’s solution. A few moments before the experiment
was conducted, the retinal slice was taken out from the perfusion and was placed on
the treated area of the gel with the retinal ganglion cell side facing upwards and the

62 determining resistivity profile of the retina
photoreceptor cells in contact with the gel. The Ringer’s solution was then added to fill
the petri-dish to a certain level submerging the retina-gel structure.
Impedance measurement
In every trial, at least three impedance measurements at different depths (every 10 μm)
in the bath (Ringer’s solution) before entering the retina were performed. The first
considerable change in impedance magnitude at PRF indicated the entry into the
retina. Visual control using a pair of binoculars confirmed this first electrode-retina
contact. Subsequent impedance measurements at every 10 μm depth were recorded until
an impedance value similar to the one observed in the bath was encountered. Each
measurement was recorded with a wait time of 30 seconds for the signal to stabilise after
the micromanipulator made the 10 μm vertical movement into the retina. This time was
determined based on measurement of time taken for the impedance value to stabilise at
a random depth in the retina (see Appendix B). Three more recordings at 10 μm intervals
were made to ensure the electrodes contact with the Agar gel before terminating the
experiment and retracting the electrodes to the initial position. The system was under
ambient laboratory conditions of 21°C during the impedance measurements.
3.3 results
3.3.1 Electrode characterisation and PRF shift
To be able to compute the resistivity from the measured tissue resistance at PRF, the
cell constant needs to be experimentally determined. The cell constant of the bipolar
electrodes used in this study was calculated using the impedance/phase spectrum of
Ringer’s solution of predetermined conductivity. The spectrum is as shown in Figure
3.6. Based on an average of such measurements with different batches of electrodes,
an average experimental cell constant was found to be 225 cm−1 (less than 5% error).
This value is within 3.5% of the theoretical and simulated values of cell constant for
the electrode configuration used in this study. The close agreement of the cell constant
with previously calculated values validates the proper working of the electrodes for an
experiment.

3.3 results 63
Figure 3.6: Bode plot in Ringer’s solution and the corresponding fit using the electricalequivalent replacing the tissue component by a simple resistor representing thesolution resistance. The solution resistance is extracted from the modified modelfit. Knowing the resistivity of the medium, an experimental cell constant of225 cm−1 was calculated. From fitting, the magnitude of ZCPE_T was found to be3.2× 10−10 Ωα−1 · Fα, where α=0.85.
Figure 3.7: PRF shift observed at various depths in a rat retina. As the PRF shifts from theright to left, the impedance increases with increasing depth into the retina (fromthe retinal ganglion cell towards photoreceptor layer). Depth is normalised to 100%retinal depth. A 10% retinal depth corresponded to an approximate microprobedisplacement of 14 μm in the retina.
Following the functional validation of electrodes, they can be employed for impedance
measurements at different depths in the retina of the chosen animal model. During
these experiments, a shift in the PRF was observed at each depth in the retina as
presented in Figure 3.7. Starting from the retinal ganglion cell layer as we go deeper

64 determining resistivity profile of the retina
into retina towards the photoreceptor layer, the PRF moved to lower frequencies and
the impedance magnitude rose from a low to a high value between 80-85% of retinal
depth spanned during the experiment. With reference to Figure 3.7, a 10% retinal depth
corresponded to an approximate microprobe displacement of 14 μm in the rat retina.
3.3.2 Resistivity profiling in rat and embryonic chick retinas
Impedance spectroscopic measurements at different depths of isolated retinal slices from
three rat (14-16 days postnatal) and five chick (three E18 and two E12 embryos) samples
were performed. Resistivity values were calculated from the extracted impedance value
at the PRF using the direct relation between both for each depth in the retina sample.
A resistivity depth of 100% was denoted as the last measurement in the retina before
an identical value of resistivity obtained in Ringer’s solution is reached (electrodes in
Agar gel). Point zero represented the last measurement in the Ringer’s solution before
there is a significant change in the resistivity, i. e., an appreciable shift in the PRF is
observed. Resistivity versus retinal depth profiles for both rats and embryonic chicks
are presented in Figure 3.8a and Figure 3.8b respectively.
In both rat Figure 3.8a and embryonic chick Figure 3.8b measurements, an increasing
resistivity-depth profile is observed rising gradually from the retinal ganglion cell layer
towards the photoreceptor layer. At an approximate depth of 65%, the resistivity reaches
a maximum value and then gradually decreases to attain a value obtained in Agar gel.
There is a close interspecies resemblance in the studied resistivity profile shapes.
The maximum mean resistivity reached in rat retina samples is 4.2 ± 0.9Ω·m and for
E12 chick is 4.5 ± 0.2Ω·m occurring between 65-70% retinal depths. On the other hand,
the maximum mean resistivity in E18 chick retina samples is 7.9 ± 0.6Ω·m which is
approximately double the value measured in rats and E12 chicks at the same retinal
depth. In rat and E18 chick resistivity profile measurements, at around 80% depth into
the retina, there is a definite dip in the resistivity profile gradually decreasing into a
low value similar to a measurement in Ringer’s solution.
The standard deviation (SD) of resistivity from the mean resistivity value at each
depth was examined. For the embryonic chick resistivity profiles, it is determined
that the SD is low in the Ringer’s solution and the Agar gel. In contrast, the rat data
demonstrates large SD in these two regions of the resistivity profile.
It is known that there is a PRF shift with a resistivity change in different retinal
layers. A representation of the relationship between PRF and resistivity based on the

3.4 discussion 65
experiments on rat and embryonic chick retinal slices is depicted in Figure 3.8c and
Figure 3.8d respectively. The log resistivity is linearly dependent on the log PRF for
both the species. For embryonic chicks, owing to similarity in the data across various
trials, it can be observed that there is a unique PRF for each resistivity. On the contrary,
the three rat trials suggest multiple PRFs for each resistivity.
3.4 discussion
To the best of our knowledge, planar, bipolar microelectrodes on a flexible substrate
were used for the first time in this study to measure resistivity-depth profiles in rat and
embryonic chick retinas. We first demonstrated the functionality of the microfabricated
device. The electrode cell constant extracted from the measured solution resistance in
Ringer’s solution compares well with the value obtained by equivalent circuit fitting.
The resistivity values at different depths in the retina established by the PRF method
are within 10% of the fitted values. This is a confirmation of the electrode interface
impedance not interfering with the measurements. There was a close agreement
between the experimental and the theoretical/simulated bipolar cell constant values.
The experimental value of 225 cm−1 is low compared to the combined average of both
theoretical and simulated value of 232.5 cm−1. This low difference of 3.5% is within the
experimental variations. Hence, the rounded corners of the electrodes instead of sharp
perpendicular shapes may have contributed to reduction in fringing effects of electric
field originating from the electrode edges. The resistivity-depth profiles, in both rat
and embryonic chick experiments, indicate the inhomogeneous nature of the retina and
the trend they follow are in accordance with the results obtained for various species in
previous studies [Heynen and van Norren 1985, Karwoski and Xu 1999]. This confirms
that our method is valid for retina resistivity profiling studies.
We found the maximum local resistivity occurred in all experiments between 65-
70% retinal depths. This can be explained by greater retinal resistivity in regions like
the inner nuclear layer (INL) where neurons are packed more tightly than the inner
plexiform layer (IPL) [Ogden and Ito 1971]. Our observations are in close agreement
with the local maxima occurring at retinal depths of ~80% in monkey (Heynen and
van Norren 1985), ~75-80% in rat [Hagins et al. 1970] and ~70% in chicken [Ogden
and Ito 1971]. The shape of the resistivity profile of the chick embryo was similar to
that of the chicken [Ogden and Ito 1971] and the rat resembled mammalian species
[Heynen and van Norren 1985] to a large extent. This was particularly true in the region

66 determining resistivity profile of the retina
between the proximal retina and down to the junction of inner and outer photoreceptor
segments. We observed an appreciable dip in the resistivity values from a retinal depth
of 80% onwards until electrodes come in contact with the Agar gel. This decrease in
resistivity in the photoreceptor layer was also found in previous studies using isolated
slice models of avian [Ogden and Ito 1971] and rat [Hagins et al. 1970] retinas. The
local decrease in resistivity might be caused by the relatively large interstitial spaces
among the outer and inner receptor segments [Hagins et al. 1970]. Resistivity profiles
are affected by the type of retinal preparation used (isolated retinal slices and eyecup
preparations). For comparing profiles, the anatomical difference between an isolated
slice and an eyecup preparation of retina needs to be considered owing to the absence
of the retinal pigment epithelium. In an isolated slice preparation, considering that
photoreceptors offer low resistance, the effective resistivity profiling is made between
the inner and outer limiting membrane [Karwoski et al. 1985].
We observed higher resistivity values in E18 compared to E12 chicks. This can be
attributed to the ongoing retinogenesis which terminates only at E18 [Doh et al. 2010].
Cell differentiation between E12 and E18 is accompanied by cell polarisation, laminar
stratification and changes in cell numbers [Livesey and Cepko 2001, Doh et al. 2010]
potentially explaining resistivity changes within the retina. Further exploration of this
subject can be interesting for future studies.
The absolute resistivities found in this study are lower compared to previous findings
in rats [Hagins et al. 1970] and chicken [Ogden and Ito 1971]. The values may be difficult
to compare with former investigations as the measurements are influenced by various
factors like the interracial difference, age difference, measurement technique, electrodes
used, etc. A majority of previous studies used the tetrapolar method with a constant
current injection. The local damage caused by the pick-up micropipettes in the retina
may cause a local current increase due to inflow of the perfusion solution. This could
lead to an increased voltage drop resulting in a false increase of measured resistivity.
In addition, most of the studies were conducted in the low frequency region (ranging
between 1 Hz and 100 Hz) with very small electrodes (~2-20 μm) [Heynen and van
Norren 1985, Sieving and Steinberg 1987, Karwoski and Xu 1999]. Regardless of the
method used, i. e. bipolar or tetrapolar, it is critical to observe the whole impedance
spectrum to identify the practical measurement bandwidth (Linderholm 2006).
The maximum SDs from the mean resistivity at certain retinal depths in our study
was found to be high. A large variability between trials was also observed in previous

3.4 discussion 67
studies of rat and chicken [Hagins et al. 1970, Ogden and Ito 1971] that were used for
comparison to our findings. All measurement techniques until now including ours
have the following inherent drawbacks that affect the resistivity-depth profiling of the
retina – (i) the movement of the electrode relative to the tissue not being accurate due to
chip-tissue slippages, (ii) pressure causing damage to the tissue (iii) damage to the tissue
by electrodes causing a high-current shunting between them resulting in an erroneous
measurement of resistivity in the retinal layers and (iv) unpredictability of resistivity
values at the retinal layer boundaries. Apart from these factors, the location on the
retinal slice where the electrodes penetrate is a significant reason for the variability in
resistivity measurements. A solution, even though it contributes to the experimental
complexity, may be to locally stain the retina as a visual aid for electrodes insertion to
produce reproducible resistivity profiles of the retina.
The small electrode spacing of the bipolar electrodes permitted high resolution
measurements in rat and embryonic chick retinas. The high resolution profiling consisted
of 25 depths in embryonic chicks and 15 depths in rats. Assuming a 10 μm microprobe
displacement into the retina, the 10 μm spacing between the electrodes used in our study
is more sensitive to capture the subtle changes in resistivity between the layers. Previous
investigations employed larger electrode spacing of ~25 μm [Heynen and van Norren
1985] and ~12-16 μm [Karwoski and Xu 1999]. Our electrodes design is an improvement
in terms of measurement resolution compared to literature.
An important result of our study is that the resistivity at a certain depth within
the retina is identified by a unique PRF in embryonic chick experiments. Conversely,
distinct profiles (refer Figure 3.8c) were obtained in the PRF versus resistivity plots
for rats. These profiles can be understood based on the large SDs observed in the
Ringer’s solution before entering the retina and in the Agar gel (refer Figure 3.8a).
Although the PRF is the frequency at which the measured impedance is most resistive,
representing the tissue resistance, it is influenced by interface and parasitic capacitances.
The large differences in resistivities observed for calibrated mediums could be attributed
to changes in electrode capacitance. This may be perceived as the electrodes not being
sufficiently clean before the experiment. There could be a thin layer of adsorbed proteins
from the retinal tissue cells or damaged limiting membrane residues that may add
to the overall measured impedance. Electrodes were cleaned with mild soap solution
for rat experiments whereas with RCA-1 cleaning procedure for the embryonic chick
experiments. Thus, we conclude that quality of an electrode surface is crucial for good

68 determining resistivity profile of the retina
resistivity profiling in a retina and RCA-1 cleaning process is more effective compared
to soap for electrodes used in this study.
3.5 conclusion and outlook
An alternative method for high resolution resistivity profiling along the depth in a
retina based on bipolar impedance spectroscopy was established. We validated our
device by profiling rat and embryonic chick retinas. The resistivity at each retinal
depth was calculated based on tissue resistance extracted by peak resistance frequency
methodology. Qualitatively, we found the resistivity-depth profiles to be in accordance
with earlier studies and that resistivity at any arbitrary retinal depth is characterised
by a unique peak resistance frequency. We have shown the potential of planar bipolar
microelectrodes as a new technique to probe absolute local resistivity within a retina
and multi-layered tissues, in general. We have used the measured chick resistivity
profile in constructing a retina model for analysing in vitro stimulation data obtained by
our collaborators. Relevance and validity of the chick resistivity profile obtained here
will be shown in chapters 5 and 6.
Determining absolute values of resistivities in retina contributes to improved
understanding of retinal stimulation by means of modelling studies. The generated
resistivity profiles can form the basis for construction of a realistic electric model
of a retina. Finite element modelling may be used for estimating and optimising
critical parameters such as stimulation thresholds, heat dissipation, resolution, etc. for a
given electrode geometry, that are instrumental for the safety and efficacy of a retinal
prosthesis. A future improvement of our two-electrode system would be a linear array
of electrodes on a single strip. An array of electrodes is capable of probing different
layer resistivities with a single insertion into the retina which is expected to cause less
damage and provide more reliable measurements.

0 20 40 60 80 100 120 1400
2
4
6
8
10 Rats
Depth (%)
Re
sist
ivity
(W
×m)
(a) Mean resistivity (±SD) vs. percentage depth
profile of three rat retina samples which are
extracted from 14-16 day old postnatal wild-type
juvenile rats.
0 20 40 60 80 100 120 1400
2
4
6
8
10E18
E12
Chicks
Depth (%)
Re
sist
ivity
(W
×m)
(b) Mean resistivity (±SD) vs. percentage depth
profile of five chick embryo retina samples of
which three are extracted from E18 and two from
E12. E18 have a higher peak mean resistivity than
the E12 chick trials.
1 10104
105
106Trial-1
Trial-2
Trial-3
Rats
Resistivity (W×m)
PR
F (
Hz)
(c) PRF vs. resistivity plots for the three rat experiment
trials. A large deviation for resistivity at a particular
PRF between the trials was observed.
1 10104
105
106 Trial-1
Trial-2
Trial-3
Trial-4
Trial-5
Chicks
Resistivity (W×m)
PR
F (
Hz)
(d) PRF vs. resistivity plots for the five embryonic
chick trials. In general, a good reproducibility of
resistivities at a particular PRF in the trials was
observed.
Figure 3.8: Data comparison between rats and embryonic chicks. (a, b) Mean resistivity (±SD)vs. percentage depth profiles. (c, d) PRF vs. resistivity plots.


4F E M - B A S E D I N T E G R AT E D S I M U L AT I O N F R A M E W O R K
4.1 introduction
Before venturing into the simulation of implantable retinal prostheses, a validated
simulation framework was established. As mentioned earlier in Chapter 1, construction
of such a sophisticated computational framework involves consideration of the physical,
electrical and the biological aspects of a typical retinal stimulation scenario. The essential
components of a simulation framework consists of a model for the retina, volume
conductor and the associated parts of a retinal prosthesis. A realistic geometry of these
elements adapted for the system under investigation are inputs to this simulation
framework. The nature of the framework suggests a non-analytical approach in solving
the complex bio-electric fields, currents and voltages in the retina and the volume
conductor. Finite element method has been used in this dissertation to compute the
quantities necessary for analysing retinal stimulation.
A description on the integration of the various elements along with a retina model
into a simulation framework for studying performance of current implantable retinal
prostheses is presented in this chapter. A discussion of the geometrical factors affecting
retinal stimulation followed by elements of the simulation framework is provided in the
following sections.
4.2 geometrical factors
Two significant geometrical factors that affect stimulation thresholds for a retinal
prosthesis are: the distance between electrode and retina; and the electrode size. These
factors contribute in either affecting the path of electric currents and/or affecting the
electric field distribution around the electrode. The representation of these factors in
the simulation framework is explained below.
4.2.1 Electrode-retina gap model
Let us consider the stimulation electrode separated from the retina by a small gap
filled with physiological fluid (PF) of high conductivity. Under these circumstances,
71

72 fem-based integrated simulation framework
a major change in the field lines penetrating the retinal tissue is expected as shown
schematically in Figure 4.1.
Figure 4.1: Schematic diagram of the electric field lines in the retina when the tissue is incontact with the electrode (left) and when a layer of PF is present between the retinaand the electrode (right). The gap is assumed to be filled with PF whose electricalconductivity is assigned a value of 2Ωm.
The distance between the retina and the electrode is actually a volume. This volume
is occupied by physiological fluid1 depending on the implant placement scheme.
Considering a two-dimensional electrode-retina gap, distances of up to 1500 μm for
epiretinal and up to 50 μm for subretinal stimulation schemes were used for simulations.
4.2.2 Electrode size
In Chapter 1, it was mentioned that disc electrodes are the most commonly used
geometries in current implantable retinal prostheses. In general, the simulation
framework presented in this chapter is capable of simulating electrodes of any shape
and sizes that can be used in retinal prostheses. The planar disc electrode sizes employed
to study epiretinal and subretinal prostheses (Chapters 5 and 6) is documented in Table
4.1. These electrode sizes were specifically chosen in order to validate the simulation
framework.
Results from the simulation framework will be compared with different sources in
the literature (primarily Argus I) and from the in vitro experiments conducted by our
collaborators at HUG using the polyimide-based retinal implant fabricated during this
doctoral work.
1 For an epiretinal scheme, the fluid is obviously vitreous humour; and for subretinal scheme it is known assubretinal fluid, an exact composition of such a fluid has not been studied yet.

4.2 geometrical factors 73
Stimulation
scheme
Experiment (s)Disc electrode
diameter (μm)
Epiretinal
Argus I (clinical trials)
and
in vitro data from
literature
260, 520
and
~25-500
Epiretinal EPFL-HUG (in vitro) 50
SubretinalIn vitro data from
literature5-200
Subretinal EPFL-HUG (in vitro) 50
Table 4.1: Disc electrode sizes used for comparison with simulated scenarios.
EPFL implant (epiretinal and subretinal)
With an intent to study retinal implants, EPFL has been involved with a collaborative
retinal implant project with several partners, since 1999. Under this framework, based
on psychophysical studies conducted by one of EPFL’s partners - HUG2, a reliable
technology for the fabrication of implantable microelectrode arrays was developed
[Metz et al. 2004]. This was the same technology utilised for fabricating the flexible
microprobe employed for resistivity profiling in the retina (Chapter 3).
The passive electrodes (i. e., without CMOS electronics) were fabricated for in vitro
electrophysiology experiments [Lecchi et al. 2006] and for in vivo experiments with
rats [Salzmann et al. 2006]. These electrodes were polyimide-based implants with four
platinum electrodes of 50 μm diameter each. These electrodes were surrounded by a
large arc shaped return electrode having a width of 100 μm. The implant is shown in
Figure 4.2. The electrodes are recessed and placed on the polyimide insulation layer.
The recess configuration is practically beneficial [Rubinstein et al. 1987, West 1991] for
neurostimulation electrodes in limiting the high electric fields appearing at the electrode
edge [Wiley and Webster 1982, Shepherd et al. 1985].
These passive implants catered to two applications with respect to this dissertation.
Firstly, they were used in both epiretinal and subretinal experiments conducted by
our collaborators in HUG and CMU3. Secondly, a total of more than 100 rats were
2 HUG - Ophthalmology Department at University Hospital of Geneva jointly headed by Prof. A. B. Safranand led by Prof. M. Pelizzone
3 CMU - Department of Physiology of the University of Geneva headed by Prof. D. Bertrand.

74 fem-based integrated simulation framework
Figure 4.2: A SEM image of the electrode array of the EPFL passive implant. The electrodearray consisted of 50 μm diameter disc electrodes arranged in a straight line, withcentre-to-centre separation of 150 μm. The entire array covered 2×2 mm of retinalspace. There are 20 μm perforations in the implant to permit nutrient exchangebetween the retina and the RPE.
implanted with these implants in collaboration with INSERM Paris4. A reliable surgical
procedure was set-up and good implantation results obtained [Salzmann et al. 2006]. A
quantitative assessment of the electrode-tissue interaction was made by monitoring the
electrical impedance for more than two months (refer Chapter 6).
Other epiretinal implants
The most experimented epiretinal prosthesis until now has been the 16-electrode Argus I
epiretinal implant developed by Second Sight Medical Products. They epiretinally
implanted human patients’ eyes with a four by four array of disc electrodes in the
macular region. Electrodes were either 260 μm or 520 μm in diameter, arranged in an
alternating checkerboard pattern with 800 μm of centre-to-centre separation between
each electrode as shown in Figure 4.3.
The other studies that have been used for comparison are based on in vitro results
from Jensen et al. [Jensen et al. 2005b] and Sekirnjak et al. [Sekirnjak et al. 2006].
Other subretinal implants
Studies from Tsai et al. and Stett et al. have been used to compare with some results
obtained from simulations on subretinal prosthesis in this dissertation (Chapter 6).
Unfortunately, there has been no access to stimulation related data in human subjects
implanted with subretinal prostheses except for an abstract [Wilke et al. 2010a]. Hence,
we are not in a position to make comparisons to clinical studies with subretinal implants.
4 INSERM - Centre de Recherche INSTITUT DE LA VISION, UMR_S968 INSERM / UPMC/ CNRS 7210 /CHNO des Quinze-Vingts headed by Prof. J. Sahel and led by Dr. Serge Picaud

4.3 simulation framework 75
Figure 4.3: Electrode array. The electrode array consisted of 260 μm or 520 μm electrodes arrangedin a checkerboard pattern, with centre-to-centre separation of 800 μm. The entirearray covered 2.9×2.9 mm of retinal space (from [Horsager et al. 2009]).
4.3 simulation framework
The elements of a simulation framework essentially consist of organised subdomains
(constituents), well defined boundary conditions and specifications (hypotheses)
necessary for extracting the required quantities (extracted parameters). These elements
will be described in the following sections.
In the context of a retinal prosthesis, the constituents of the framework can be
subdivided into physiological fluid, stimulation and return (ground) electrodes, retina
and the pigment epithelium (RPE)-sclera combination.
4.3.1 Constituents of the framework
Physiological medium
Physiological medium encompasses the implant when it is not in contact with the retina
and was defined to have a resistivity of ~1.5-2Ωm5.
Stimulation electrode
The stimulation electrode is positioned on RGC layer side or subretinal side of the retina
based on the investigated stimulation scheme (epiretinal or subretinal). The stimulation
electrode is represented in the form of a planar disc embedded in an insulated substrate
and located at the geometrical centre of the entire model geometry. The 12-15 μm thick
insulation (flexible sheet of the implant) was defined with a resistivity of 1× 10¹⁷Ωm
[Smith et al. 1987] corresponding to Polyimide and an electrode resistivity of 106 nΩm,
a standard value for bulk platinum.
5 a value based on measurements using bipolar microprobe in Chapter 3 on rat and embryonic chick isolatedretinal slices.

76 fem-based integrated simulation framework
Ground electrode
The placement of the ground electrode was based on the stimulation scheme. As
monopolar stimulation was used in the investigations and comparisons from literature,
the ground electrode was always placed far away from the stimulation electrode. For all
experimental combinations, the ground electrode was analysed for two configurations.
Firstly, when it is placed in the physiological medium on the photoreceptor (subretinal)
side and axially shifted by 15 mm away from the stimulation disc electrode. The ground
was defined as a 100 mm diameter platinum disc electrode. Secondly, for studying
Argus I implants, the ground electrode was placed on the sclera. A summary of the
various placements studied in this dissertation is provided in Table 4.2.
Stimulation
scheme
Experiment (s) Ground placement
Epiretinal
Argus I (clinical trials)
and
in vitro data from literature
on sclera
and
in the medium (far)
Epiretinal EPFL-HUG (in vitro)in the medium,
axially shifted (far)
Subretinal In vitro data from literature in the medium (far)
Subretinal EPFL-HUG (in vitro)in the medium,
axially shifted (far)
Table 4.2: Placement of the ground electrode for different simulated scenarios.
RPE and sclera
The RPE and sclera together are represented by a highly resistive block, which is set to
a resistivity of 500Ωm. Their position is fixed with respect to the retina’s orientation
which in turn is dependent on the stimulation scheme under investigation.
Electric model of the retina
The electric model of the retina is based on the varying cell densities along its thickness.
We define a piecewise linear model to represent the electrical resistivity of the retina

4.3 simulation framework 77
as shown in Figure 4.4. The data is extrapolated to obtain the resistivity model for
the human eye by scaling the dimensions of the macaque retina to the human retina.
Even though mammalian eyes exhibit differences in sizes, thickness of retinal layers
(including the nerve fibre layer), etc. which are all critical factors under consideration,
the reason for the extrapolation is that the anatomical organisation of the primate retina
closely resembles that of humans [Sernagor et al. 2006].
Figure 4.4: (A) Replica of the plot showing the local resistivity (vs. percentage retina thickness)of the various layers of the retina measured on a macaque retina by Heynen and VanNorren [Heynen and van Norren 1985]. (B) Electric model of the retina representedas variations in electrical resistivities, based on the resistivity changes in the macaqueretinal tissue as seen in (A) and extrapolated to a human retina bearing a thickness of200 μm. The depth of the retina is calculated between the photoreceptors (subretinalside) and the ganglion cell layer (epiretinal side). Legend – RPE: Retinal pigmentepithelium; PR: Photoreceptor layer; IL: Intermediate layers; GL: Ganglion cell layer;PF: Physiological fluid. Arrow indicates the position of the implant for modellingpurposes.

78 fem-based integrated simulation framework
In Heynen’s experiment, the resistivity measurements extend into the retinal
pigment epithelium (RPE). We compositely modelled the Photoreceptor (PR) and
the Intermediate cell (IL) – Ganglion cell (GL) regions (Figure 4.4) based on the linear
approximation of the experimental data. The resistivity varies from 35Ωm at the PR to
2Ωm which is set as the resistivity of physiological fluid filling the interstitial space.
As in most cases, when the electrode is not in intimate contact with the retina, an
electrode-retinal gap filled with ophthalmic physiological fluid (PF) is considered.
The selection for thickness of the retina depends mainly on the location of the retinal
implant. Typically, in retinal implantation trials [Chow et al. 2001], the implant is placed
closer to the fovea, but not over it [Perez Fornos 2006] due to the absence of ganglion
and bipolar cells in the fovea. The retinal thickness in the region surrounding the fovea
is known to vary between ~100 μm at the foveal floor to ~320 μm at the foveal rim
[Bonanomi et al. 2006]. Considering that the location of the implant near the fovea is not
precise, the chosen value for the retinal thickness was 200 μm.
The retinal thickness value of 200 μm was used for analysis on the Argus I and other
in vitro experiments from the literature. For the EPFL-HUG experiments, a value of
175 μm[Huang et al. 1998] with a re-adjusted retina model was used.
Inclusion of geometric factors
The two geometrical factors affecting the stimulation thresholds (discussed in Section
4.2) were included in the simulation model as variable parameters: electrode-retina
distance (g) and electrode disc diameter (d). The retinal resistivity model is positioned
according to the electrode-retina distance, between 0 and 1500 μm (refer 4.2.1). Other
variables defined in the model are: hGL – depth at which ganglion cells are assumed
to be located, and hRet – depth where the retina ends and the RPE starts. hGL was
defined to be 20 μm outwards from the epiretinal side, i. e., (g+20) μm from the surface
of the implant. Figure 4.5 presents a schematic representation of the above mentioned
elements (excluding the ground electrode) and the variable parameters together with a
graph representing the resistivity change as a function of the retina depth. These values
were employed for simulation of an epiretinal prosthesis.
For a subretinal scheme, apart from the orientation change of the retina, the depth of
RGCs (hGL) is assumed to be at 175 μm from the subretinal surface of the retina.
For modelling based on in vitro experiments conducted by our HUG collaborators,
apart from a geometric change in the implant size, the electric model is constructed

4.3 simulation framework 79
Figure 4.5: Schematic representation of the various elements of the simulation framework (foran epiretinal scheme). A schematic representation of the constituents the simulationframework (excluding the ground electrode) and a graphic representation of theresistivity change as a function of the retina depth. RPE is the retinal pigmentepithelium, hGL is the depth at which ganglion cells are assumed to be located,hRet is the depth where the retina ends and the RPE (not shown) starts, g is theelectrode-retina distance and d is the electrode disc diameter.
based on extracted data from resistivity profiling experiments on isolated retina slices
from embryonic chicks. The resistivity varies from ~9Ωm at the PR to 2Ωm which is
set as the resistivity of physiological fluid filling the interstitial space. An appropriate
model is used for epiretinal and subretinal configurations. All computations for these
modelling studies were made with the assumption that retina is in contact with the
implant and that no electrode-retina gap exists.
4.3.2 Hypotheses for RGC activation
Threshold criterion
The threshold current necessary for activation of an RGC by means of extracellular
stimulation has been both experimentally and theoretically demonstrated to depend
upon various parameters such as activation of soma versus axon (axon initial segment)
[Schiefer and Grill 2006, Behrend et al. 2009, Fried et al. 2009], stimulus pulse type
(cathodic or anodic), polarity (monophasic or biphasic) and shape (pulse duration) [Fried
et al. 2006, Boinagrov et al. 2010]. For the purpose of our study, we consider a spherical
RGC soma (without axon and dendrites) activated using a single, balanced, cathodic
pulse duration of 0.975 ms/phase (epiretinal) and 0.1 ms (subretinal) at threshold
excitation. The rationale behind choosing a spherical model of an RGC soma instead
of planar (disc-like) or cylindrical (unmyelinated axon-like) was based on a recent
modelling study by Boinagrov et al. [Boinagrov et al. 2010] employing the six-channel
salamander RGC model [Fohlmeister et al. 1990].

80 fem-based integrated simulation framework
For epiretinal scheme in our simulation studies, a threshold criteria was chosen
following strength-duration curves based on the spherical soma model (Figure 12, Pg.
2245 of [Boinagrov et al. 2010]) and demonstrated good matching with experimental
data [Jensen et al. 2005b] that was generated using large electrode (125 μm and 500 μm
in diameter) stimulation. Similar range of sizes were used for electrodes used in Argus
I trials. The stimulus pulse parameters were taken from Argus I clinical trials in order
to be relevant for comparison with results from our study. An RGC activation threshold
criterion can be extracted from one of the multiple strength-duration curves computed
by Boinagrov et al. [Boinagrov et al. 2010] using a planar Hodgkin-Huxley (HH) cell
model studied using a single, charge-balanced, cathodic-first, biphasic stimulus (type
used in Argus I trials). The threshold current injected to create a voltage gradient to
activate an RGC located at a distance from the electrode (cell activation depth) leads
to a local electric field near the cell. In the current study, an electric field criterion
of 1000 V/m is chosen, assuming uniform electric field around the cell. This value
corresponds to a local voltage drop (transcellular) of 10 mV for a biphasic 1 ms stimulus
pulse duration and a planar Hodgkin-Huxley cell with a cell polarisation time RC of
10−4 ms (refer Figure 5A in [Boinagrov et al. 2010]). The model also demonstrates that
biphasic stimulation thresholds for planar cells are lower than those of a spherical
cell by a factor of 1.7-1.8 throughout all pulse durations. In spite of this factor, we
considered a transcellular potential of 10 mV created across an RGC soma of around
10 μm in diameter, a typical RGC size in primates used in modelling studies previously
[Greenberg et al. 1999]. By neglecting the factor and considering soma to be spherical,
a compromise between experimental (or clinical) and modelling inaccuracies was
made. The influence of pulse type and duration on RGC activation was neglected from
epiretinal simulations as this was considered directly in the assumption for activation
criterion (explained above).
By selecting another threshold electric field criterion (here, based on the strength-
duration curve) would merely cause a scaling on the computed threshold voltages
which affects related parameters (e.g. threshold currents, electric field distribution,
etc.). An illustration of a change in criterion is explained below and demonstrated in
subretinal simulations (Chapter 6).
For comparisons with subretinal in vitro data from literature and in vitro data for both
epiretinal and subretinal obtained by our HUG collaborators, in our simulation studies,
the threshold currents were computed based on a threshold criterion of 3000 V/m, an

4.4 integrated fem model 81
approximation derived from literature [Palanker et al. 2005] under uniform electric
field conditions. This corresponds to a voltage of 30 mV created across a cell of 10 μm
in diameter [Palanker et al. 2005]. However, the depolarisation of a cell membrane
by 10-25 mV (transmembrane) is usually sufficient to activate a retinal neuron. This
provides a range of transcellular voltage values between 2000-5000 V/m (twice the
transmembrane voltage) to choose from as a threshold criterion.
Depth of RGC activation
RGCs are considered to produce robust responses when directly activated regardless
of the scheme of stimulation [Tsai et al. 2009a, Boinagrov et al. 2010]. Therefore, it was
assumed generally in our studies that the retina can be directly stimulated at the depth
hGL, in other words at the RGC layer.
4.4 integrated fem model
The components of the simulation framework are assembled together into a FEM model
bound by well defined conditions. In the FEM simulations presented in this work, we
have used a monopolar stimulation scheme for which the ground electrode is located far
away from the stimulation electrode. The stimulation and ground electrodes are placed
as defined in the section 4.3.1. An external bounding box of 44× 25 mm (epiretinal)
and 18 × 12 mm (subretinal) drawn from the axis of the stimulation electrode and
confining the implant is used to limit the computation space. The retinal resistivity
model presented before is placed in close contact with the electrodes except during the
case studies on electrode-tissue gap.
The time-varying bio-electric fields, currents and voltages in a biological medium can
be examined in the conventional quasistatic limit [Plonsey and Heppner 1967] Under
these circumstances, the electric scalar potential, V in the biological medium is defined
by solving the Laplace’s equation:
∇ · [(σ + iωε0εr)∇V] = 0 (4.1)
where, σ and εr are the conductivity and relative permittivity of the medium
respectively. The angular frequency of the driving stimulus is ω = 2π f , ε0 is the
permittivity of vacuum, and i is the imaginary unit. The current density on the electrode,
J is related to V given by Ohm’s law:
J = −(σ + iωε0εr)∇V (4.2)

82 fem-based integrated simulation framework
We computed the threshold current and the impedance using both harmonic and DC
modes of representing the biological medium.
In the harmonic mode, frequencies of 1 kHz (1 ms) and 10 kHz (0.1 ms) were used
based on the time scale of commonly applied pulses for stimulation. The biological
medium was represented by conductivity and permittivity values considering the
dispersive (frequency dependent) properties of the tissue. The electrode-electrolyte
interface impedance was also implemented into this mode in the form of a thin-layer
approximation as described by Cantrell et al. [Cantrell et al. 2008]. Simulations indicated
that above certain values of the electrode potential, the potential drop seen across
the electrode, also known as overpotential, is negligible compared to the potential
drop across the tissue impedance (refer Appendix C). Furthermore, an estimate of the
capacitive component of the tissue impedance at the given frequency is more than an
order of magnitude higher than the resistive component for both the frequencies. Finally,
the RPE and sclera do not contribute to the dynamic changes in voltages across them
due to the low value of scleral resistance compared to its capacitance. This renders them
to be represented as resistive contribution to the flow of current through them. These
observations suggest that the simulation problem could be reduced to a simple and
computationally less expensive DC model. Consequently, a frequency independent DC
model considering the biological medium as purely resistive along with the neglected
electrode interface impedance was modelled.
Simulations were performed with the Comsol Multiphysics® (versions 3.5 and
4.1) finite element modelling software. An axisymmetric finite element model of the
stimulation and the ground electrodes were created with a mesh resolution of up to
2 Million (epiretinal) and approximately 0.5 Million nodes (subretinal). By default, the
Delaunay (normal or advancing front) triangulation meshing algorithm of Lagrange-
quadratic element type was utilised in Comsol for meshing the simulation volume.
Element refinement (high density meshing) was performed on the stimulation (40 nm
mesh element size) and the ground electrodes to ensure current conservation.
Appropriate Dirichlet, von Neumann and continuity boundary conditions (only for
harmonic simulations) were used to define the electrode-retina interfaces, the insulating
material-retina interfaces and the boundaries of the simulation bounding box. Table 4.3
displays the boundary conditions and equations employed in the simulation framework
operated in DC. Material properties, in this case, electrical resistivities of platinum (Pt)
electrode, insulator (assumed as Polyimide) and PF were adjusted parameters. Table 4.4

4.5 extracted parameters 83
displays the constants employed for the quasistatic and/or conductive DC simulations
performed using FEM model.
Domain/boundary name Type of condition Equation (s)
Physiological fluid
Current conservation
∇ · J = 0
Retina model J = σE
Substrate insulation E = −∇V
Bounding box Electric insulation −n · J = 0
Stimulation electrode Electric potential V = Vstimulation
Ground electrode Ground V = 0
Equation to compute
electric scalar potential, V
in the medium due to an
electrode stimulation
∇ · [σ∇V] = 0
Notations: J : current density on the electrode; E : electric field vector;
Vstimulation : amplitude of the voltage stimulus; σ : conductivity of the
physiological medium; n : normal vector.
Table 4.3: Boundary conditions and equations employed in the simulation framework operatedin DC.
The FEM model was solved using a direct linear solver known as PARDISO. A brief
record of solver parameters is shown in Table 4.5. Simulations were performed under
electrostatic conditions with an applied DC voltage between the stimulation and ground
electrodes. A glimpse of surface voltage profile and current density streamlines for
typical electrode stimulation is presented in Figure 4.6.
4.5 extracted parameters
An element refinement of ten times normal meshing was made for the data extracted
from the simulations which were subsequently post-processed in Matlab® to generate
the required plots.

84 fem-based integrated simulation framework
Subdomain Conductivity (S/m) Relative permittivity
Platinum 94.35× 10⁵ 1
Polyimide 1× 10⁻¹⁷ 4
Subretinal fluid 0.5− 0.67 99a
Retina In accordance with the retina model 30, 000b
a http://niremf.ifac.cnr.it/tissprop – a value at 1 kHz for vitreous
assuming that subretinal fluid has similar properties.b http://niremf.ifac.cnr.it/tissprop – an approximate mean value for
retinal tissue taken in the range between 1 and 10 kHz.
Table 4.4: Constants employed for the quasistatic and/or DC simulations performed using FEMmodel.
4.5.1 Current
The current delivered by the electrode was computed by a boundary integration of the
normal component of current density over the ground electrode.
4.5.2 Impedance
Impedance is computed as the ratio between the applied voltage stimulus and the
resulting current seen at the electrode taking into consideration the retina with or
without an electrode-retina gap.
4.5.3 Lateral extent
During actual experiments, to ensure stimulation, there is a tendency to use stimulation
currents 10-20% above the pre-determined minimum threshold current. In our study,
we define lateral extent as the horizontal distance (measured from the electrode axis)
covered at hGL corresponding to a threshold electric field of 1 kV/m caused by a 20%
excess on the threshold current. An illustration of the assumption and the lateral extent
definition is presented in Figure 4.7. Implant resolution can be calculated based on the
lateral extent of stimulation for the electrodes.
4.6 conclusion and outlook
The simulation framework developed in this chapter is a preliminary step in formulation
of a full scale integrated simulation framework including complex models and criterion.

4.6 conclusion and outlook 85
Direct (PARDISO) - Linear system solver
Parameter Value
Preordering algorithmNested
dissection
Row preordering On
Bunch-Kaufmann On
Pivoting perturbation 10−8
Relative tolerance 10−6
Factor in error estimate 400
Stationary
Parameter Value
Linearity Nonlinear
Relative tolerance 10−6
Maximum number of iterations 5000
Initial damping factor 1
Minimum damping factor 10−4
Table 4.5: A brief overview of solver parameters used for simulations.
This framework will be our basis to study epiretinal and subretinal prostheses presented
in Chapters 5 and 6.

Figure 4.6: A graphical mapping of an electrostatic simulation of electrode stimulation with anapplied DC voltage (13 V) where the retina is in contact with the implant surface. Awireframe-based surface voltage profile along with streamlines of current densityis displayed. The wireframe representation indicates the element sizes employedduring computation. Relevant magnifications in the regions of stimulation andground electrodes are also illustrated for clarity. All designated dimensions are inmetres. Note: please see PDF version for colour version of the figure.
Figure 4.7: A graphical representation of lateral extent of retinal stimulation. An illustration ofthe definition for lateral extent of retinal stimulation. It is denoted by a horizontaldistance measured at hGL, where the threshold electric field criterion is reached for a20% increase in stimulation amplitude. The dark block represents the stimulatingelectrode.

5S I M U L AT I O N O F E P I R E T I N A L P R O S T H E S E S
5.1 background
Two major electrical parameters responsible for affecting the efficiency of retinal
prostheses [de Balthasar et al. 2008] are: (i) the fluctuation of current amplitude for
activation (threshold current) that can occur due to unstable positioning of the electrode
array on the inner retinal surface, electrochemical alterations in the electrodes, or
neurophysiological remodelling of the retina. (ii) The charge density necessary to elicit
visual percepts to permit long-term stimulation without damaging the retina or the
electrodes. The determination of threshold current and charge density is important
for achieving safe stimulation. Appropriately, electrode-retina distances along with the
electrode geometry are factors influencing the retinal stimulation. The development of
an integrated simulation framework can predict the stimulation parameters by including
these factors in the model.
An electrode-retina distance contributes to the varying current spread from the
electrodes causing changes in the stimulation area in the retina and therefore affects the
resolution of the prosthesis. In vitro electrophysiological data and analytical calculations
suggest that the threshold currents rise rapidly with increasing distance of the electrodes
from the retinal surface [Jensen et al. 2003, Palanker et al. 2005]. Electrode geometry has
an effect on the current required for RGC activation. In vitro experiments [Sekirnjak
et al. 2006] have established that the threshold current necessary to elicit spikes in
RGCs has a power law relationship with electrode area. Incorporating these geometrical
factors affecting perceptual thresholds in a simulation framework can be of interest
to: design engineers of retinal implants–aiding them to determine optimal electrode
schemes for retinal stimulation by predicting values for spatial extents (resolution) and
probable electrochemical effects on the electrode surface; surgeons – assisting them after
surgery to verify the distance between implant and the retina in addition to a visual
confirmation [Humayun et al. 2003]; and electrophysiologists – to estimate the threshold
current, voltage or charge needed during an actual stimulation trial [de Balthasar et al.
2008].
87
88 simulation of epiretinal prostheses
Presently, proximity of the retina to the electrodes is verified by two different
techniques after implantation of retinal prostheses. Optical coherence tomography
(OCT) is one of the methods which reveals only proximity of the edges of the device
to the retina for a non-transparent retinal implant. The other technique, known as
impedance analysis [Johnson et al. 2007] uses the changes in impedance to estimate the
electrode-retina distance. The changes in impedance occur when the implant moves
closer or away from the retina. The utilisation of an integrated framework can predict the
impedance associated with an electrode-retina distance considering different electrode
geometries.
For our studies, a simulation framework was built integrating the prosthesis-retina
interface elements involved in an epiretinal prosthesis closely resembling the one
used in the framework of the only and most comprehensive published human trials
until now using Argus I epiretinal implants by de Balthasar et al. [de Balthasar et al.
2008]. Following are the features of our framework (detailed description in Chapter
4) that has not been dealt by previous modelling studies on epiretinal stimulation: (i)
the location and dimensions of stimulation and ground electrodes were adapted to
a real implantation scenario; (ii) a realistic representation of the electrical properties
of the retina; (iii) choice of a simplified, yet realistic activation threshold criterion
based on a recent analytical study [Boinagrov et al. 2010] that incorporates the
critical stimulation parameters such as stimulus type (monophasic/biphasic), shape
(cathodic/anodic) and duration under a single unified model (iv) Predictions on
threshold currents and impedance with varying electrode-retina distances for different
electrode dimensions. Using this framework, variation of threshold currents and
impedances were computed using different electrode-retina distances and disc electrode
sizes. In order to demonstrate the relevance of our simulation framework to implanted
human epiretinal prosthesis, the frame of reference for the computed results is the
most recent experimental data on geometrical factors affecting perceptual thresholds
presented in Argus I trials. We estimated lateral extents of stimulation for the electrodes
which provides an indication to the resolution of the epiretinal prosthesis used in
those trials. Subsequently, this simulation model can be easily modified to predict the
efficiency of novel electrode geometries for epiretinal prostheses.

5.2 methods 89
5.2 methods
The adjustments in the simulation model, threshold current criterion, depth of
RGC activation, electrode-retina gap and the construction of FEM-based simulation
framework was based on explanation in Chapter 4 for an epiretinal scheme of
stimulation. The necessary modifications to the framework in order to be able to
study the two configurations proposed i. e., Argus I and our implant is also mentioned
in Chapter 4.
5.3 results and discussion
The effectiveness of this computational study can be evaluated by directly comparing
clinical and electrophysiological results with outcomes based on our simulation
framework. One of the principal results for comparing our study are the only exhaustive
measurements made during the clinical study conducted by de Balthasar et al.
[de Balthasar et al. 2008] on human beings implanted by Argus I epiretinal implants.
The scattered impedance and threshold data observed in their experimental study
was associated with small movements of the electrode array. In order to determine a
theoretical water window for electrodes used in Argus I experimental protocol, charge
and charge density were calculated with a stimulus duration of 0.975 ms.
5.3.1 Stimulation thresholds as a function of electrode-retina distance
A computed threshold current is plotted as a function of electrode-retina distances for
the two electrode sizes, 260 μm and 520 μm are presented in Figure 5.1. A factor two
difference between the thresholds for both electrodes was noticed when the electrodes
were in contact with the retina. We observed an approximate order of magnitude
increase in thresholds when the electrode-retina distance reached half of the electrode
diameter. Subsequently, for electrode-retina distances exceeding the electrode diameter,
the threshold current becomes proportional to the square of the electrode-retina distance.
For smaller distances (< 20 μm), the threshold changes were less pronounced as also
observed in in vitro experiments conducted by Jensen et al. [Jensen et al. 2003]. At large
electrode-retina distances, above 300 μm, the two electrodes are not differentiated as
they showed nearly the same threshold current values. Threshold current variation as
a function of electrode-retina distance obtained in this study (Figure 5.1), are within
the range of values obtained in the experimental results of the Argus I clinical trials
[de Balthasar et al. 2008].

90 simulation of epiretinal prostheses
Figure 5.1: Threshold current versus electrode-retina distance. Evolution of computed thresholdcurrent with variation in electrode-retina distance for two electrode sizes (260 μmand 520 μm). We observe that there is a factor two difference of threshold betweenthe two sizes when the electrode is in contact with the retina. Approximately, anorder of magnitude increase in threshold current is observed when the electrode-retina distance reaches half of the electrode diameter. When electrode-retina distanceexceeds the electrode diameter, the threshold current becomes proportional to thesquare of the distance. The corresponding charge injection limit (for 0.975 ms pulses)is displayed for both electrode sizes.
Safe stimulation is critical for a chronic usage of a retinal prosthesis. Platinum
electrodes have a charge density limit ranging between 0.05 [Rose and Robblee 1990]
and 0.49 mC/cm2 [Brummer and Turner 1977] per stimulation pulse above which
electrochemical reactions dominates at the electrode surface [Brummer and Turner
1977]. The range of charge densities (also known as reversible charge storage capacity)
is related to considerations on real surface area, geometry of the electrode and on
the stimulus pulse width [Merrill et al. 2005]. A theoretical charge density limit of
0.35 mC/cm2 was chosen for our study considering a real geometry of the electrode and
a pulse width of 0.975 ms. Currents corresponding to this charge limit are 190.6 μA for
260 μm and 762.4 μA for 520 μm electrodes. It can be observed that the current injection
limit can be reached at an electrode-retina distance of about 270 μm for 260 μm diameter
electrodes and nearly 600 μm for 520 μm diameter electrodes. Close proximity of RGCs
to the electrodes is thus a critical issue for safe and chronic retinal stimulation.

5.3 results and discussion 91
5.3.2 Stimulation thresholds as a function of electrode sizes
A range of disc electrodes with diameters ranging between 10 μm and 1500 μm were
used to simulate the relationship between the stimulation threshold and electrode-
retina distances – 0 μm (in contact with retina), 10 μm and 100 μm. In retina contact
condition presented in Figure 5.2 (axes plotted in logarithmic scale), it is observed that
the threshold current is a power function of the square root of the electrode area (follows
a power law with the electrode circumference) as inferred from the linearity between
the quantities. The charge density increases to a high value with smaller electrodes,
as the decrease in surface area outweighs the threshold current decrease, explaining
the change in slope of the linear trend below electrode sizes of 25 μm. Our simulation
results for large electrodes (> 100 μm) are in agreement with the trends observed in in
vitro experiments conducted by Jensen [Jensen et al. 2005b] and the literature review by
Sekirnjak [Sekirnjak et al. 2006] groups indicating that the threshold current necessary
to elicit spikes within RGCs varies as a power law with electrode area. The thresholds
obtained for smaller electrodes (< 25 μm) cannot be compared with a previous report
by Sekirnjak et al. [Sekirnjak et al. 2006] as the stimulus pulse widths used in their
study was different. When the electrode is not in contact with the retina, the threshold
is almost independent of the electrode size for all electrode-retina distances below a
distance approximately equal to the electrode diameter and for distances above this,
follows the power law again. This behaviour is explained by the electrode edge effect
dominating at small electrode-retina distances. Another interesting result in relation to
safe stimulation is an electrode with a radius smaller than the electrode-retina distance
will typically require a stimulation current above its current injection capacity (refer
Figure 5.2).
Computed threshold currents for 260 μm and 520 μm electrodes differ only slightly at
electrode-retina distances from ~ 200 μm onwards. This similarity between threshold
currents for the two electrodes was also observed in Argus I clinical trials [de Balthasar
et al. 2008]. It is interesting to notice from their measurements (threshold versus
electrode-retina distance, refer Figure 7b in [de Balthasar et al. 2008]) that the similarity
in thresholds for the two electrodes, results from the electrode-retina distances being in
the range of 150-300 μm. The consistency offered by our predictions in comparison to
the existing clinical measurements on thresholds correlating to electrode-retina distance
reiterates the importance of a realistic framework.

92 simulation of epiretinal prostheses
Figure 5.2: Threshold current versus electrode diameter/area. Computed trend for variation ofthreshold currents with changing electrode area (corresponding electrode diameteris shown on the top axis). Dotted line represents the charge density limit calculatedfor platinum electrodes using a stimulation pulse width of 0.975 ms. When electrodesare in contact with the retina, the threshold current varies with the square root of theelectrode area (or proportional to the electrode circumference). When electrodes arenot in contact with the retina, the threshold is almost independent of the electrodesize until the electrode diameter is roughly equal to the electrode-retina distance,and then follows the square root law. This behaviour is explained by dominance ofedge effects at small electrode-retina distances. The current injection limit trend lineis also plotted on the graph. It is observed that for an electrode with a radius smallerthan the electrode-retina distance will typically require a stimulation current largerthan the injection limit.
Electrode-retina distance influences the threshold current values for various electrode
sizes having a pronounced effect on safe stimulation of the retina. A trend line between
threshold current limits for different disc electrodes based on the electrochemical limit
for platinum (0.35 mC/cm2) is plotted in Figure 5.2. The approximate electrode sizes
below which the electrochemical limit (for platinum electrodes) is exceeded for the
three electrode-distance conditions is as follows: (i) 11 μm diameter when the electrode
is in contact with retina, (ii) about 20 μm diameter when the electrode is within 10 μm
distance from the retina and (iii) about 100 μm when the electrode is within 100 μm
distance from the retina. Since both charge and charge density are to be considered
for discussion on safe stimulation [Merrill et al. 2005], the stimulus pulse duration
is critical. Our simulation framework is capable of computing threshold currents for
different electrode geometries based on a stimulus pulse dependent threshold criterion,
rendering it a powerful prediction tool.

5.3 results and discussion 93
5.3.3 Impedance variation based on electrode-retina distance
Impedance changes in neuroprostheses (e.g., cochlear implants) have been correlated
with changes in the tissue resistivity surrounding the electrode [Duan et al. 2004] and
electrochemical changes at the electrode surface with time [Hughes et al. 2001]. There
has been no strong evidence for these phenomena in chronic epiretinal implantation
studies [de Balthasar et al. 2008]. Moreover, the probability of an immune response (e.g.
tissue encapsulation) in such implantations is low because the electrodes were observed
to be in the vitreous significantly away from the retina during trials [Mahadevappa
et al. 2005, Mcmahon et al. 2006]. Consequently, by neglecting effects influencing
impedance changes, impedance measurements can be compared to the simulated
values for obtaining information on distance of the retina with respect to the electrode
array of the implant. As threshold currents reduce with closer proximity between the
retina and electrodes, impedance can be used to predict threshold currents for retinal
stimulation. Studies [Mcmahon et al. 2006, de Balthasar et al. 2008] based on frequent
monitoring of impedance during the post implantation period suggest that there is a
continuous change in distance between the electrode array and the retina influencing
the variation in measured impedance.
Our framework computed the trend between impedance and electrode-retina distance
and is shown in Figure 5.3. By using this trend, the threshold currents can then be
directly predicted from computed impedance values knowing the relationship between
threshold currents and electrode-retina distance (Figure 5.1). Higher impedances
(electrodes closer to the retinal surface) means low thresholds for the activation of RGCs.
Electrode-retina distances which affect the computed values of impedance indicate that
there is no benefit of using a smaller electrode other than the capacity to place more
electrodes within the same area; as at large electrode-retina distances (especially in the
range 100-300 μm), there is small difference in thresholds for different electrode sizes.
But, when multiple such electrodes are stimulated simultaneously, a higher resolution
might be produced as shifting stimulation of an array of four small electrodes (for e. g.,
half the size of larger electrode) by one row could shift the stimulation by a smaller
distance than shifting stimulation of larger electrodes by one row. Even though there is
a large variability within the impedance measurements presented in Argus I clinical
trials [de Balthasar et al. 2008] (reproduced in Figure 5.3 for convenience), they are
grossly within our simulated range of values for impedance versus electrode-retina
distance. Considering the data spread of impedance-distance measurements in the

94 simulation of epiretinal prostheses
Argus I clinical data; a fitting of the data is not totally relevant, but a fit would not be in
contradiction with our simulations.
Figure 5.3: Impedance versus electrode-retina distance. Computed impedance change withvariation in electrode distance from the retinal surface. The impedance duringelectrode-retina contact is not indicated. Impedance values for the contact conditionfor 260 μm electrode: 70.5 kΩ; 520 μm electrode: 52 kΩ. Open circles are experimentaldata points from the Argus I clinical trials [de Balthasar et al. 2008]. The clinicaldata demonstrate large scattering of impedance but are grossly within the rangeof simulated values from our framework. A fitting of the experimental data is notcompletely relevant, but it would lead to an impedance-distance relationship that isnot in contradiction with our simulations.
5.3.4 Estimation of resolution based on spatial extent of stimulation
In our study, we have computed threshold currents for activation of a single RGC
located at the cell activation depth (hGL) from the stimulation electrode. During actual
experiments, to ensure stimulation, there is a tendency to use stimulation currents
10-20% above the pre-determined minimum threshold current. In our study, we define
lateral extent as the horizontal distance (measured from the electrode axis) covered at
hGL corresponding to a threshold electric field of 1 kV/m caused by a 20% excess on
the threshold current (refer to Chapter 4 for illustration). Implant resolution can be
calculated based on the lateral extent of stimulation for the electrodes. A relationship
between the lateral extents of stimulation zone with varying electrode-retina distances
for both the electrodes has been plotted in Figure 5.4. The lateral extent is proportional
to the sum of the electrode-retina distance and radius of the electrode. The lateral

5.3 results and discussion 95
extent for a point source electrode (or very small electrodes) would be zero ideally. The
linear-like relationship between the lateral extents of stimulation and the electrode-retina
distance implies that the resolution of the implant drops with increasing electrode-retina
distances for the electrode geometries studied.
Figure 5.4: Lateral extent of stimulation versus electrode-retina distance. Relationship betweenthe computed lateral extent of stimulation and the electrode-retina distancedemonstrates that an increase in electrode-retina distances decreases the resolution ofthe retinal implant. The lateral extent is proportional to the sum of the electrode-retinadistance and radius of the electrode. For a point source (or very small electrodes),the graph would cross the origin of the graph.
5.3.5 Simulation vs. in vitro epiretinal stimulation - Our implant
In an attempt to simulate the in vitro experiments by our HUG collaborators, we
computed the necessary thresholds and lateral extents under an epiretinal scheme for a
model representing our implant.
Intracellular recordings were performed from individual ganglion cells in epiretinal
configurations while electrical pulses were delivered through the electrodes in the array,
one after the other, in order to determine individual cell activation thresholds as a
function of distance from the stimulating electrode i. e. a lateral extent in a different
form. The computed and experimental thresholds as a function of squared distance is
presented in Figure 5.5.
A good agreement was found between the computed and experimental values of
threshold measured as a function of the squared distance.

96 simulation of epiretinal prostheses
(in µm)
20
150
300
450
1 2 3 4
Computation
Figure 5.5: (Top) Thresholds as function of squared distance. Single RGC data is presenteddue to the difficulty with the experimental procedure. The computed profile is ingood agreement with the experimental trend. (Bottom) An illustration of the squareddistance (another definition for lateral extent) from the electrode position with respectto the neuron. The grey bars indicate threshold values for corresponding squareddistance for each electrode. Courtesy: Unpublished data with kind permission fromDr. Alexandre Babalian (HUG)
5.4 conclusions
The simulations on the effect of geometrical factors, viz. electrode size and electrode
distance to the retinal surface affecting impedance and threshold values is an indication
of the importance of proximity between the electrode array and the retina for a successful
retinal implant. The resolution of the implant can be estimated for different electrode-
retina distances considering the computed lateral extents of stimulation.
Alternatively, the good accordance of simulations with in vitro experiments conducted
by our HUG collaborators indicates the relevance of the measured resistivity profile of
the chick retinas using our microprobe technique.
Electrode breakdown and tissue encapsulation effects, in spite of being extremely
important in the viability of neural prostheses, have not been observed to be dominant
in implanted human retinal prostheses studied until now. This could be due to the

5.4 conclusions 97
fact that they have not been studied long enough to evaluate their performance
under long term exposure to retinal milieus. Based on the threshold and impedance
data collected during clinical epiretinal trials conducted in human subjects until now
[de Balthasar et al. 2008, Mahadevappa et al. 2005], the variation in threshold current and
impedance can be linked to changes in electrode-retina distance (Pg. 281, Chapter
14 of [Dagnelie 2011]). Hence, the pre-experimental computation of characteristic
dependency between threshold and impedance is generally a significant guideline
and supplemental information for surgeons and electrophysiologists. Furthermore, the
presented simulation framework is a powerful and useful tool for implant designers -
as it can be used to predict threshold of each electrode, irrespective of its geometry, in
arrays of high electrode count targeted at high-resolution retinal stimulation in future.
An integrated simulation framework computing electric fields in the electrode-retina
interface could help in understanding the effective operation of a retinal implant.
Knowledge of current densities in the retinal tissue can resolve significant questions
which include: design of implantable electrode arrays, a proper location for the implant
to be placed, optimal electrode geometry and ground placement, efficiency of different
shapes and sizes of electrodes, optimal inter-electrode spacing, maximum amount of
current injected safely for a given configuration, efficiency of current injection and
current circulation in a tissue for a particular scenario.


6S I M U L AT I O N O F S U B R E T I N A L P R O S T H E S E S
6.1 introduction
Most prostheses designed to interface with the retina rely on the hypothesis that a
direct stimulation applied either to the outer layers of the retina or to the ganglion cell
layer could restore sight to the patients.
Ganglion cells form the innermost retinal cell layer, relaying the transformed visual
input to the brain, implying that they are the targets in either subretinal or epiretinal
stimulation schemes. They can be excited either by direct or indirect electric stimulation
applied through the intermediate retinal network. Indirect stimulation of ganglion cells
is experimentally observed through activation of bipolar and amacrine cells [Fried et al.
2004] and also predicted theoretically by modelling bipolar cell stimulation [Gerhardt
et al. 2010]. Based on the result that “short stimulation pulses are preferable for safety
and efficacy considerations in subretinal prostheses and that direct activation of ganglion
cells will be necessary for reliable activation during high-frequency stimulation” [Tsai
et al. 2009a]; in this study, we are modelling direct activation of ganglion cells by
extracellular stimulation. A simple passive model of extracellular stimulation [Coburn
1989] of the soma of a ganglion cell has been considered before for analytical studies
[Palanker et al. 2005]. We consider a ganglion cell as a spherical neuronal soma and
hypothesise its activation by assigning a cross-membrane depolarisation condition.
Patch clamp and extracellular multi-electrode recordings have been used to measure
the threshold currents required to activate ganglion cells in both subretinal [Stett et al.
2000, Jensen and Rizzo 2007] and epiretinal [Jensen et al. 2005a, Sekirnjak et al. 2006]
approaches. The threshold stimulation current applied on electrodes is one of the
key elements in determining the performance of a retinal prosthesis. Palanker and
co-workers [Palanker et al. 2005] approximated a threshold electric field of 3000 V/m to
perform analytical calculations and draw predictions on various parameters affected
during stimulation. In the present study, we define a typical threshold as the minimum
stimulation current required to obtain an electric field of 3000 V/m at a certain distance
between the stimulating electrode and the retinal ganglion cell.
99

100 simulation of subretinal prostheses
A recent psychophysical study in blind human volunteers demonstrated a strong
decrease in threshold charge delivered by the electrodes as a function of time after
implantation [Wilke et al. 2010a]. We hypothesise that this decrease is linked to the
discharge pattern of the current above the electrode as a result of changing measured
impedance. Impedance variations may occur due to changes in electrode impedances
due to various factors like physical and chemical changes in electrodes, mechanical
alterations, retinal tissue remodelling in the process of degeneration, etc. Under
ideal implantation conditions and assuming that electrode corrosion does not occur
[de Balthasar et al. 2008], the impedance variation can be explained by two main theories:
1. Gliosis theory – a proliferation of glial cells at the site of a tissue injury or neuronal
loss caused by surgical intervention and insertion of the implant.
2. Gap theory – soon after implantation, the retina may not be in intimate contact
with the electrodes giving rise to a gap. This gap is predicted to be very small in
the order of a few microns. It is likely that a close contact between the retina and
electrodes is recovered within a few days. Similar post-implantation effect of an
electrode-tissue gap is also observed between the target tissue and the stimulation
electrodes immediately after a deep brain implantation [van Kuyck et al. 2007].
In the case of a glial reaction, new cells surround the electrode surface resulting in
retinal ganglion cells moving farther away from the electrode. The highly resistive
glial cells increase the impedance and consequently raise the threshold stimulation
currents. On the contrary, when the retinal cells move closer to the electrode and fill
the electrode-retina gap, it has the same effect of increasing the impedance due to the
higher resistivity of the retinal cells [Heynen and van Norren 1985] and eventually
reducing the threshold of stimulation currents.
A number of studies related to the experimental determination of threshold
stimulation currents in subretinal stimulation on various species in vitro have been
reported [Stett et al. 2000, Jensen and Rizzo 2008, Tsai et al. 2009a]. Despite the
extent of literature on the stimulation parameters and methods, there is still a lack of
understanding on the relationship between the electrical properties of the retinal tissue
and the microelectrode specifications.
The aim of this chapter is to predict the threshold currents for subretinal stimulation
of the retina by using a layered resistivity model of the retinal tissue. The stimulation of
the retina is based on the direct activation of ganglion cells neglecting the contribution

6.2 methods 101
of the inner layers within the retina. We assume a spherical neuronal soma model of a
retinal ganglion cell with an electric field stimulation criterion of 3000 V/m. A lateral
extent of the stimulation zone is estimated at the ganglion cell layer depth in the retina
for a given value of stimulation current. Finally, the effect of an electrode-tissue gap
on the threshold currents and impedance is analysed. We demonstrate a simple finite
element simulation framework aimed at predicting the activation threshold currents for
ganglion cells in the retina. We also demonstrate that the threshold stimulation currents
can be correlated to the changes in impedance due to variations in the gap between the
tissue and electrode.
6.2 methods
The reader is kindly advised to refer to Chapter 4 for more details on this section in
relation with subretinal stimulation scheme as directed below at various places.
6.2.1 Hypotheses for retinal stimulation
The threshold current criterion and depth of RGC activation, was based on explanation
in Chapter 4 for a subretinal scheme of stimulation.
6.2.2 FEM modelling
The adjustments in the FEM-based simulation framework was based on explanation in
Chapter 4 for a subretinal scheme of stimulation. The necessary modifications to the
framework in order to be able to study in vitro results from literature and from our
HUG collaborators using our implant is also mentioned in Chapter 4.
6.2.3 Animal model and impedance spectroscopy
Impedance recordings were performed on P23H line 1 rats at least 3 months old which
were implanted with custom made polyimide-based implants under a well defined
surgical intervention protocol [Salzmann et al. 2006]. As described previously [Salzmann
et al. 2006], the implants consisted of a 1 mm circular head and a 40 mm long shaft. The
thickness was 22 µm. There were four stimulating 50 µm disc electrodes on each implant,
surrounded by a large return electrode. The electrode geometry used in this modelling
study is based on the electrode design used in these implants.
The impedance spectra were acquired using an Agilent 4284A impedance analyser,
controlled by proprietary Java software. Electrodes were connected to the impedance

102 simulation of subretinal prostheses
analyser via a 150 mm long, 5 pole-cable and a DIP-switch (Grayhill 90HBW05)
mounted on a printed circuit board, to which the impedance analyser was connected.
Measurements were carried out using a voltage of 50 − 1000 mV RMS with each
frequency spectrum taken between 100− 1M Hz, with the sweep starting at the highest
frequency. The measurements were made between one of the four 50 µm electrodes
and the surrounding return electrode. The commercial software ZViewTM was used to
analyse the impedance data. The individual electric elements modelling the electrode-
tissue measurement setup were extracted using a complex non-linear least squares
fitting algorithm (CNLS) built into ZViewTM.
A stimulation amplitude of 50 mV was selected for the subsequent impedance
measurements to minimise the risk of tissue and electrode damage by excessive current
densities. Smaller amplitudes however contributed to noisy measurements. The tissue
impedance extracted from the electrical equivalent model was calculated at 10 kHz due
to two main reasons:
1. Relevant as the applied stimulation pulse width is around 0.1 ms in high frequency
stimulation.
2. This frequency appeared as a compromise for the different sample frequency
spectra studied, i. e. the largest change in impedance occurred around 100 kHz
right after implantation, whereas it occurred closer to 1 kHz after a few weeks.
6.3 results
6.3.1 Spatial extent of the threshold current
For a given depth in the retina, the threshold current is increased for the cells located
away from the axis of the electrode. In subretinal implants, the spatial extent of the
stimulation represented in a cross section of the retina just above an electrode is shown
in Figure 6.1. The different curves show the area that is stimulated by the electrode
with the 3000 V/m criteria at different stimulation currents. For instance, the plot
corresponding to the stimulation current of 3.5 μA applied on the electrode is the locus
of the electric field strength criterion. The threshold current value on the electrode axis
is 39 μA for GL. In this case, theoretically, just one cell is stimulated right above the
electrode at the height measured subretinally. Higher values of stimulating current
correspondingly stimulate cells over a wider space above the electrode. This can be
seen from the curve corresponding to the locus of 59 μA stimulation current, where the

6.3 results 103
lateral stimulation zone extends to about 190 μm off-axis from the electrode for GL layer.
The simulations show that the excitable cells in the GL region can be stimulated with
threshold currents above 39 μA using our subretinal electrodes. It is also seen that the
ganglion cells can no longer be stimulated at a lower value than this threshold current.
Figure 6.1: Spatial extent of threshold stimulation criterion met for different electrode currentsin a subretinal scheme. The points along the horizontal line at GL (175 μm) representthe lateral extent of stimulated cells with two different currents. The thick blackhorizontal bar represents the location of the electrode.
Figure 6.2 shows the evolution of the threshold currents with the lateral distance from
the axis of the stimulation electrode. The off-axis threshold currents increase almost in
a quadratic manner with lateral distance from the electrode axis implying that larger
currents are required to stimulate wider area of cells away from the axis of the electrode.
A maximal admissible current during stimulation is based on the hypothesis of an
electrochemical limit. For an electrode current ~69 μA applied for 0.1 ms on a 50 μm
diameter disc electrode, the electrochemical limit of ~0.35 mC/cm2 [Brummer and
Turner 1977] for platinum is reached. It is seen that the computed minimum threshold
stimulation current of ~39 μA required for stimulating the GL is approximately a factor
two below the electrode current at the electrochemical limit.
6.3.2 Effect of a gap between the electrode and the retinal tissue
The electrode-tissue gap plays an important role in the electric potential distribution
above the stimulation electrode and consequently the strength of the threshold currents
originating from the electrode. There is also a significant impact on the impedance due

104 simulation of subretinal prostheses
Figure 6.2: Evolution of the threshold currents (3000 V/m criterion) in the GL vs. the lateraldistance from the electrode axis. The thick black horizontal bar represents the locationof the electrode. A 10% increase in stimulation current from minimum stimulationcurrent results in a lateral extent of 70-75 μm in the GL.
to the space between the electrode and the retinal tissue being gradually replaced by a
fluid more conductive than the retina itself. We will now study both these effects of a
gap between the electrode and the tissue by varying the gap between the retina and
implant surface in the FEM model.
Effect on threshold currents
Figure 6.3 shows the dependence of the on-axis stimulation current required to reach
the 3000 V/m criterion in the GL as a function of the gap between the stimulation
electrode and the bottom surface of the retina. It is seen that the threshold current
increases rapidly in the GL as the gap between the electrode and the tissue increases.
As a result, the electrode electrochemical limit is reached when the gap exceeds 5 μm
for GL stimulation.
Effect on impedance
Knowledge of impedance can be used as an indirect measurement of the electrode-
tissue gap. Previously, impedance analysis [Mcmahon et al. 2006, Johnson et al. 2007]
has been employed to estimate the electrode-retina distance by measuring the changes
in impedance that occur when the implant moves closer or away from the retina. It
is also well known that Advanced Optical Coherence Tomography (OCT) imaging
technique can be used to determine the distance between an electrode and tissue in
in vivo post-implantation [de Balthasar et al. 2008]. On the contrary, for a non-transparent

6.3 results 105
Figure 6.3: Dependence of the on-axis threshold current with the electrode-tissue gap at GL inthe retina.
implant, OCT methods have the drawback of revealing only the proximity of edges of
the implant with respect to the retina.
Our simulation framework can predict the gap between an electrode and tissue by
relating computed values with actual measurements of impedance. Figure 6.4 shows the
computed impedance as a function of the gap between the retina and the stimulation
electrode. The impedance decreases with increasing gap values. A gap of 50 μm is
sufficient to decrease the impedance by a factor of 10 and almost attain a resistivity
equivalent to that of the PF. The line at 36 kΩ corresponds to the computed impedance
of the PF as seen by the stimulating electrode with respect to the ground.
In vivo impedance measurements, presented in Figure 6.5, demonstrate that the
impedance measured just after subretinal implantation in rats [Salzmann et al. 2006]
is appreciably lower than the expected value obtained when there is a close contact
between the electrode and retina. This corresponds to the hypothesis of an electrode-
tissue gap. Typically, after 20 days, the electrode impedance increases to a high value.
It is observed from additional measurements after two months that the attained high
value remains stable. This situation corresponds to a small electrode-tissue gap in our
model.

106 simulation of subretinal prostheses
Figure 6.4: Variation of impedance with changes in electrode-tissue gap.
Figure 6.5: Evolution of the in vivo electrical impedance of retinal tissue measured at 10 kHzin rats during a two-month period. The impedance measurements were performedwith implanted rats that exhibited low fibrous reaction.
6.4 discussion
Using FEM simulations, this report investigated the estimation of spatial extent of the
threshold currents and the evolution of threshold currents with lateral distance in the
GL for subretinal stimulation. The effect of electrode-tissue gap on the threshold current
and impedance was also studied.
6.4.1 Threshold current
Stimulation experiments conducted by independent research groups indicate that the
thresholds for activating the ganglion cells vary depending on the manner of activation –
direct or indirect, pulse type, time-course, polarity and many other unknown parameters.
Based on our assumptions, the computed thresholds for direct activation were expressed
as charge densities. The value is in the order of 0.2 mC/cm2 in the GL for a balanced,

6.4 discussion 107
cathodic-first, rectangular stimulus with a pulse duration of 0.1 ms. These compare with
the threshold charge density values obtained from in vitro subretinal stimulation trials
by Tsai et al. [Tsai et al. 2009a]. They experimentally determined that short balanced
biphasic pulses of the order of 0.1 ms/phase directly activated retinal ganglion cells
with a threshold charge density ranging between 0.06 mC/cm2 and 0.12 mC/cm2.
Considering the limitations of our passive model, the computed thresholds were close
to the values obtained by Tsai et al. Based on the comparison with their measurements,
we predict a higher limit for the threshold currents.
6.4.2 Spatial extent of stimulation
The spatial resolution of a local electrical stimulation triggered by a monopolar
electrode is related to the spatial extent of the elicited retinal response. The retinal
response is directly related to the activation of spatially distributed ganglion cells in
the GL. We computed a near-quadratic variation of threshold current with increasing
lateral distances from the electrode centre for the geometry presented. During actual
experiments, to ensure stimulation, there is a tendency to use stimulation currents
10-20% above the pre-determined minimum threshold current. For a 10% excess on
the minimum threshold current, it is observed from Figure 6.2 that a spatial region of
70-75 μm is in the zone of stimulation at GL. Eckhorn et al. [Eckhorn et al. 2006] quote
in their paper concerning in vitro experiments performed by Stett et al. in normal and
degenerated rat retinas that the spatial resolution at retinal level, subretinally stimulated
by multi-electrode arrays, is at least 70 μm. This limiting value is a good starting point to
associate with the spatial resolution computed at the GL in our FEM model. Our FEM
framework predicts a realistic spatial resolution for the simulated geometry and retina
model presented. Consequently, these values can be used as a guideline for determining
density of stimulation electrodes needed to attain reasonable resolution using current
and future retinal implants.
6.4.3 Effect of electrode size
In this study, the effects of an inhomogeneous retina and the electrode-retina gap on
subretinal stimulation using a 50 μm diameter disc electrode were computed. Increasing
electrode size has proven to increase thresholds in epiretinal stimulation [Sekirnjak et al.
2006]. It also has the effect of reducing the spatial resolution for epiretinal stimulation.
In contrast to these results, we performed simulations in subretinal mode to predict the

108 simulation of subretinal prostheses
direct ganglion cell stimulation thresholds and the lateral extents. The lateral extents
for smaller electrodes (up to 5 μm) were only slightly lesser than with the 50 μm discs.
For larger sizes (up to 200 μm), both the stimulation threshold and the lateral extents
increase marginally. Table 4 displays the computed threshold values for each of the
electrode sizes simulated.
Electrode
size (μm)
Stimulation
threshold (μA)LATERAL EXTENT (μm)
5 39.5 65-70
10 39.5 65-70
25 39.6 70
50 40.5 75
100 43 100
200 54.7 140
Table 6.1: Computed thresholds of stimulation and lateral extents for different electrode sizes.
We also deduced that in smaller electrodes up to 50 μm, similar values of threshold
currents imply large current densities eventually giving rise to electrochemical problems
during stimulation. Additionally, reducing electrode size implies a larger impedance
which leads to higher voltages on the electrode surface. This has an impact on the
voltage delivering capabilities of the power source used for firing up the electrodes.
6.4.4 Effect of electrode-tissue gap
In chronic retinal implantations, there have been no observations of a fibrotic or gliotic
capsule surrounding the implant area [Chow et al. 2001, de Balthasar et al. 2008]. A
mention on the stimulation electrodes unaffected by corrosion [de Balthasar et al. 2008]
also indicates that they are mostly electrochemically stable. To our best knowledge,
explicit records of impedance measurements over a period of time after subretinal
implantations are not available apart from the ones (refer Figure 6.5 above) shown
in this study. But, recent results [Wilke et al. 2010a] on post subretinal implantation
threshold voltage measurements with time along with computed threshold charge
suggest a time variation of impedance in agreement with our hypothesis. This may

6.4 discussion 109
imply that the change in impedance is mainly due to the gap between the tissue and
the electrode. Our FEM computations on the effect of an electrode-tissue gap on the
impedance anticipate that it is the gap closing between the electrode and the retina
which contributes mainly to the increase of impedance and not the resistivity of the
encapsulating tissue surrounding the implanted electrode in retinal implantations.
From the simulation results it can be concluded that the impedance measured
immediately after subretinal implantation may correspond to the electrode-tissue gap
filled with PF. The value of the impedance reached post-implantation after a certain
settling period corresponds to the impedance measured for a small electrode-tissue
distance. This hypothesis is supported substantially by the impedance variation over
time measured in vivo as demonstrated in Figure 6.5. Consequently, the low impedance
measured immediately after implantation corresponds to a leakage of current resulting
from the gap present between the electrodes and the tissue. The increase of impedance
is a sign of the achievement of an intimacy between them.
Interestingly, we can deduce a relationship between variations in threshold current
with changes in impedance. The association between them is presented in Figure 6.6
which is essentially a combination of results in Figure 6.3 and Figure 6.4. Similar
behaviour has been observed in measurements with epiretinal implants on human
subjects [de Balthasar et al. 2008]. We postulate that monitoring impedance is not only
an effective and simple method to check the integrity of the implant; but with an
appropriate electrical model of the retina it can predict a realistic stimulation current.
Figure 6.6: Relationship between the threshold current and the corresponding impedance forincreasing electrode-tissue gap values. No gap (0 μm) corresponds to an impedanceof 320 kΩ as shown in Figure 6.4. Higher values of gap result in lower impedanceand higher thresholds.

110 simulation of subretinal prostheses
6.4.5 Simulation vs. in vitro subretinal stimulation - Our implant
In an attempt to simulate the in vitro experiments by our HUG collaborators, we
computed the necessary thresholds and lateral extents under a subretinal scheme for a
model representing our implant.
Intracellular recordings were performed from individual ganglion cells in subretinal
configurations while electrical pulses were delivered through the electrodes in the array,
one after the other, in order to determine individual cell activation thresholds as a
function of distance from the stimulating electrode i. e. a lateral extent in a different
form. The computed and experimental thresholds as a function of squared distance is
presented in Figure 6.7.
0
200
140
1
150
300
400
2 3 4
400
600
800
1000
0 50000 100000 150000 200000 250000 300000
Inte
nsity
(µA
)
(in µm)
Computation
Squared distance (µm2)
Multiple RGC trials
Figure 6.7: (Top) Thresholds as function of squared distance. Data from 15 RGCs is presented.The computed profile is in good agreement with the experimental trend. (Bottom)An illustration of the squared distance (another definition for lateral extent) from theelectrode position with respect to the neuron. Courtesy: Unpublished data with kindpermission from Dr. Alexandre Babalian (HUG)
A good agreement was found between the computed and experimental values of
threshold measured as a function of the squared distance.

6.5 conclusion 111
6.5 conclusion
Understanding electrode-tissue interactions is a key to efficient and successful
stimulation by a retinal prosthesis. Through the current study, we have shown that
it is possible to study subretinal stimulation applying an electric resistivity model of
the retina in a finite element simulation framework. The following conclusions can be
drawn based on our simulation study:
1. Employing the 3000 V/m criterion on a spherical neuronal soma model of a
retinal ganglion cell results in the prediction of the maximum limits of threshold
current and lateral extent of stimulation to which in vivo experiments conducted
by various researchers can be benchmarked.
2. The effect of an electrode-tissue gap is to increase threshold currents and decrease
the impedance. The increasing impedance related to a closer proximity of the
retina to the electrodes in our model is well supported by in vivo tissue impedance
measurements. Therefore, the impedance can be a tool to monitor electrode-tissue
gap and predict stimulation current simultaneously.
Alternatively, the second occurrence of good agreement between simulations and
in vitro experiments conducted by our HUG collaborators confirms the relevance of the
measured resistivity profile of the chick retinas using our microprobe technique.
We conclude that the importance of performing impedance measurements after
implanting stimulation devices, ensuring the close contact of target neural tissue with
the stimulation electrodes, is instrumental in successful neural stimulation. With further
refinement and validation, it may be possible to use our method to design and simulate
different electrode geometries that optimise stimulation efficiency of the retina, and the
techniques used in this method can be expanded to electrodes used in other neural
stimulation devices.


7C O N C L U S I O N
7.1 summary of main results
The contribution of this dissertation can be summarised by two key points. First, a
simulation platform that can assess the factors that affect RGC activation by retinal
prostheses was formulated and constructed with preliminary validation. Secondly,
using a specially microfabricated bipolar microprobe, measurements were conducted to
determine a high resolution resistivity profile of the cross-sectional layers of a retina.
The requirement for modelling approaches is to understand the mechanisms that
underlie retinal stimulation. Factors that can influence the electrode-retina interface
include the stimulus pulse, electrode shape, electrode position, and retina cell density.
Two of these factors, namely electrode size and electrode position with respect to the
retina, and their effect on the activation of retinal ganglion cells was estimated in
this dissertation using a simulation framework. Effect of both factors on stimulation
thresholds was documented and compared to previously published results. For
both epiretinal and subretinal configurations, they were found to be in agreement.
Furthermore, evaluation on lateral extents of stimulation provided an insight into the
resolution capabilities of the retinal implant under monopolar stimulation scheme.
By impedance computations with varying electrode-tissue gap, it is even possible to
predict the proximity of the retinal tissue to the electrodes of the implant as shown in
the chapter of subretinal simulations (refer Chapter 6). In addition to the computation
of current, charge density and the neural stimulation threshold, it is also possible to
determine the neural injury and electrochemical limits. Owing to the wide range of
study possibilities that this simulation framework offers, it should be considered to be
the primary contribution offered by this dissertation.
As a raw material for the first contribution, an electric retinal model was a necessity
in the building of a simulation framework. It is well known that the inherent electrical
inhomogeneity of the retina alters the potential and electric field distribution within
the retina created by extracellular stimulation. The activation of RGCs depend on the
spatial formation of voltage gradients in their own vicinity. In this work, a localised,
113

114 conclusion
direct method for experimentally determining the anisotropic electric properties of
the retina is presented. The device was validated by profiling rat and embryonic chick
retinas. The resistivity at each retinal depth was calculated based on tissue resistance
extracted by peak resistance frequency methodology. Although, it was qualitatively
established that the resistivity-depth profiles were in accordance with earlier studies,
but were quantitatively different due to a configuration attributed by local and probably
more accurate resistivity measurements. It was observed that resistivity at any arbitrary
retinal depth is characterised by a unique peak resistance frequency. The computations,
using the constructed electric model of chick retina, corresponded well to the in vitro
stimulation experiments conducted by our collaborators at HUG using our implant;
confirming the relevance of the obtained resistivity data in embryonic chicks and the
used measurement method. This method is another major contribution of this work
and to the area of modelling retinal stimulation since it provides a robust experimental
method to extract resistivity profiles from the retina of any species including humans.
7.2 significance of contribution to knowledge
The capability of modelling studies to evaluate factors affecting retinal stimulation
can significantly improve the quality of future retinal prostheses, and will be an aid
to surgeons and neurophysiologists. Previous methods attempting to model retinal
prostheses, either do not consider a realistic geometry of the bioelectronic system; or
study the sole influence of one of the factors like electrode geometry/size or electrode-
retina distance only. By integrating the various elements of a retinal prosthesis into a
single simulation framework, simply provides more accurate assessment of efficacy
and safety of retinal stimulation. A platform has been set for future improvements on
our framework to address other factors and move a step closer to a more complete
modelling framework.
The most important element of a model for retinal stimulation is the retina itself. Until
now, most researchers in this field have not considered an accurate model of the retina. In
an ideal biophysical model of the retina, it would be essential to have detailed mapping
of the resistivities across its various layers. Such demands for high resolution retina
resistivity profiling has been accomplished by the measurement technique demonstrated
in this work.

7.3 future outlook 115
7.3 future outlook
It is possible to consider many other parameters and factors and incorporate in the
simulation framework presented in this dissertation which is relatively in its infancy, in
terms of options currently forming its repertoire. The limitations specified in Chapter 1
(refer section 1.6) will always be candidates for the upgraded version of the simulation
framework. Relatively simple to implement but probably computationally intensive
additions to the framework could be to consider electrode surface properties, ganglion
cell density, etc. The most interesting future directions in the opinion of the author are:
7.3.1 Comsol-NEURON integration
The most exciting of the approaches involves an integration of multiphysics properties of
Comsol and the neurophysiological computing power of NEURON. The methodology is
more useful for simulating indirect stimulation of retina as the full potential of NEURON
in handling intercellular connections within retina is tapped. The working mechanism
is rather simple. Voltages in three dimensional space within the volume conductor or
retina caused by extracellular stimulation is captured by Comsol for a given excitation
on the electrode(s). These voltages can subsequently be fed into different compartments
of the target cell by voltage clamps in NEURON. Based on the time variation of voltage
and the stimulus shape, there would be specific electrophysiologic processes activated
within the cell. It would then be possible to verify if the cell has fired an action potential
or in other words reached the state of activation. Hence, it is possible to benefit from the
physical accuracy of FEM based Comsol and the neurophysiological activity simulator
in Neuron making the simulation framework closer to being ideal. A more powerful
approach consists of writing a stand-alone Matlab code that functions like NEURON
and since Comsol is based on Matlab, a full integration could be achieved.
7.3.2 Electrode array
Future generations of high resolution retinal prostheses comprise dipolar or multipolar
electrode arrays [Wilke et al. 2010b]. This dissertation considers monopolar configuration
alone. It is a computing challenge for Comsol to represent simultaneous stimulation by
1000 electrodes, as an example. Once a methodology to represent an electrode array is
established, various analyses like crosstalk between electrodes, heat dissipation of the
implant, etc. can be performed. Subsequently, an estimation of efficiency of such retinal
implants can be easily determined.

116 conclusion
7.3.3 Pulse dependent stimulation
In Chapter 2, it was mentioned that charge and charge density together contribute
towards safe stimulation of the retina. Based on the pulse shape and duration, time
dependent simulations using electrostatics combined with thermodynamics module, a
heat profile can be generated. This can be used to compute the temperature increase
in the volume conductor indicating retinal damage, if any. Cell membrane properties
can be modelled permitting us to study electroporation [Palanker et al. 2007] related
phenomena as well. By integrating this module with the ones explained above and
existing properties of the framework described in this dissertation, it is possible to
achieve a simulation framework closer to the actual implantation conditions.
7.4 verdict
Owing to nature, not every biological problem has a mathematical or physical
explanation and therefore it is almost impossible to have a simulation framework
that considers all phenomenon occurring during retinal stimulation. Even if there is,
it would probably be practically impossible or time consuming to compute such a
complex mathematical problem.
This dissertation attempts to utilise a piecewise linear electric model of the retina
obtained from a robust experimental setup to extract resistivity profiles from the retina
of any species including humans. In conjunction with the electric model of retina, the
finite element model and simulation framework proposed for electric field estimation
in retina provides scope to incorporate many of the discussed parameters and factors
affecting neural stimulation and evaluating the efficiency of retinal prostheses. The
developed simulation framework computes stimulation thresholds and impedance that
can form a reference for quality control during surgery while inserting implants in
the eye and functionality checks by electrophysiologists. Furthermore, this framework
is useful in deciding the specifications of stimulation electrodes such as optimal size,
shape, material, array density, and the position of the reference electrode to name a few.
The work presented here offers to aid in optimising retinal prostheses and implantation
procedures for patients and eventually contribute towards improvement of their life
quality.

Part II
A P P E N D I C E S


AM I C R O FA B R I C AT I O N P R O T O C O L F O R T H E M I C R O P R O B E
Substrate: Silicon test wafer, <100>, 4”, 525 μm
Illustration Description
1. Deposit TiW (500 nm) / Al (1000 nm) sacrificial
layer
2. Spin Polyimide PI2611 (several layers, 1400 rpm
each) and hard bake
3. Deposit Ti (50 nm) / Pt (200 nm) / Ti (50 nm)
using SPIDER with Ti using RF target
4. Photolithography, METAL mask. S1818 3.5 μm
might require double bake. 12 s exposure at
10 mW
5. Pt etch using STS. Pt etch also does Ti layers.
Resist removal.
6. 2nd polyimide layer coating and hard bake.
Slow ramp up to 300ºC.
7. Deposit SiO2 using SPIDER
119

Illustration Description
8. HMDS/Oxygen plasma treatment for
20 minutes for making sure the adhesion resist in
the next to SiO2
9. Photolithography, PI mask. S1818 3.5 μm might
require double bake. 12 s exposure at 10 mW.
Manual development preferred
10. Oxide, Polyimide and Oxide etch in STS.
Polyimide etch time varies (~1μm/min)
11. outside of clean room: Aluminium dissolution
and 5s of 1% HF dip to remove the protective Ti
layer

BS U P P L E M E N TA RY I N F O R M AT I O N O N R E S I S T I V I T Y P R O F I L I N G
E X P E R I M E N T
All simulations were performed considering the electrode interface components at the
experimental PRF of 375 kHz (frequency at which the solution resistance is extracted
during actual measurements). The electrode interface behaviour was modelled based
on a thin layer approximation similar to the one implemented by Cantrell et al. [Cantrell
et al. 2008].
b.1 electric field penetration depth
Refer to the section materials and methods (subheading ’Electrode design and fabrication’)
Figure B.1: Quasistatic simulation (Comsol 4.1) of the electric field norm for the bipolarelectrodes in Ringer’s solution (1.5 Ω · m) for an excitation of 25 mV at 375 kHz(frequency at which the solution resistance is extracted during actual measurements).The penetration depth of electric field is achieved at 8.3 μm (on the z-axis) where theelectric field is half the value obtained on the axis (y=0) of the microprobe surface(1100 V/m). The white band in the plot represents the zone for penetration depthacross the geometry. The two thick black lines represent the electrodes.
121

122 supplementary information on resistivity profiling experiment
b.2 computed cell constant
Refer to the section materials and methods (subheading ’Measurement method and
modelling’) of Chapter 3.
The cell constant from simulation of the bipolar electrodes can be calculated as
follows. Using Comsol, an integration of current density norm over the return electrode
gives a current of ~0.72 μA for an applied excitation voltage on the electrode, Va of
25 mV. The computed solution resistance, Rsc is calculated as:
Rsc =Va
Ic
where, Ic – computed overall current in the system
Leading to an Rsc = 34830Ω.
We know that cell constant, kbipolar in Ringer’s solution of known resistivity, ρRinger
= 1.5 Ω ·m can be calculated knowing the resistivity of the medium and the solution
resistance as follows:
kbipolar =Rsc
ρRinger
Hence, we obtain a cell constant of 232.2 cm−1 from simulation.

B.3 impedance stabilisation with time 123
b.3 impedance stabilisation with time
Refer to the section materials and methods (subheading ’Measurement apparatus and
protocol’) in Chapter 3.
0 20 40 60
1.60
1.63
1.66
1.69 40mm
Time (s)
Re
sist
ivity
(W
×m)
0 20 40 60
3.10
3.15
3.2080mm
Time (s)
Re
sist
ivity
(W
×m)
0 20 40 603.30
3.45
3.60
3.75
3.90
4.05
4.20 130mm
Time (s)
Re
sist
ivity
(W
×m)
Figure B.2: Resistivity (directly calculated from impedance at peak resistance frequency)stabilisation with time for measurements at three arbitrary depths (40 μm, 80 μmand 130 μm) in a rat retinal slice is presented above. After the microprobe wasdisplaced to a depth in the retina, a series of impedance spectra were recordedwithin intervals of 15 seconds each. Based on the above resistivity changes with time,it was established that the time to wait before valid measurements be recorded was30 seconds.

124 supplementary information on resistivity profiling experiment
b.4 simulation on reduction of fringing effects
Refer to the discussion section (First paragraph on reduction of fringing effects) of
Chapter 3.
Using Comsol 4.1, a DC simulation between bipolar electrodes with sharp and
rounded corners was simulated. The current density norm - surface and contour plots
were generated at an excitation voltage of 25 mV.
Figure B.3: Comparison through a DC simulation of bipolar electrodes with sharp corners (left)and rounded corners (right) used in this study. Sharp electrode edges produce highelectric field zones that may lead to fringing effects and local tissue heating anddamage during an actual trial.
Figure B.4: A zoom in the region of electrode corners reveals an improvement against fringingeffects of rounded corner electrodes in comparison with their sharper counterparts.

CM I S C E L L A N E O U S S I M U L AT I O N S A N D C A L C U L AT I O N S
c.1 validation for neglecting electrode interface
The model of the electrode-electrolyte interface followed by calculations is contained in
this section.
c.1.1 Electrode-Electrolyte Interface
The electrode-electrolyte interface is composed of Faradaic (charge transfer resistance,
RCT) and non-Faradaic (constant phase element, ZCPA) components.
Equations used:
ZCPA = K · (iω)−β (C.1)
where K and β are considered to be constants in most early studies of the
electrode–electrolyte interface, but Richardot and McAdams have examined these
values and demonstrated that while they remain relatively constant at low driving
voltages, they show a strong dependence on overpotential when those voltages are
increased.
RCT(η) =η
I0·(
eαa· nFRT ·η − e−αc· nF
RT ·η)−1
(C.2)
where, R universal gas constant,
T temperature in Kelvin,
F Faraday’s constant,
n number of electrons per molecule participating in the reaction,
I0 exchange current,
η overpotential, and
αa and αc transfer coefficients.
Constants used (refer [Cantrell et al. 2008] and [Richardot and McAdams 2002]):
The values were normalised for electrode surface area appropriately:
K = 1.57 Ω ·m2s−β, β = 0.91, n = 2, I0 = 6.41× 10⁻⁴A ·m2 and T = 298 K
125

126 miscellaneous simulations and calculations
K = A · e−(|η|σ
)2
β = a · (|η|)4 + b · (|η|)3 + c · (|η|)2 + d · (|η|) + e
A = 1.5785 Ω ·m2s−β, σ = 0.1552, a = −3.736, b = 3.852, c = 0.3697
d = −1.2112 and e = 0.9244
Additional constants for the Butler-Volmer equation for RCT:
αa = 0.5, αc = 0.5, n = 2 and T = 298 K
F = 96484.6 C ·mol−1
R = 8.3144 J · K−1 ·mol−1
Insulator-electrolyte interface was incorporated also as described by Cantrell et al.
[Cantrell et al. 2008] to avoid leakage of current into the insulator during simulations.
Equations C.1 and C.2 along with the values of constants were implemented in
Comsol as shown in Figure C.1.
Figure C.1: (Left) Circuit equivalents and (right) quasi-static equations representing theboundary conditions

C.1 validation for neglecting electrode interface 127
c.1.2 Calculations
Incorporating equations C.1 and C.2 as described by Cantrell et al. , 2008 [Cantrell et al.
2008] in the simulation framework, following computations for a 50 μm diameter disc
electrode at 1 kHz (using a subretinal scheme with the 200 μm thick electric model of
retina included) are as follows:
I [μA] V1 [V] V0 [V]Vtissue [V] Rtissue [kΩ]
(V0-V1) (∆V/I)
0 0 0 0 -
0.3 0.136 0.2 0.064 213
1.4 0.229 0.6 0.371 265
2.6 0.269 1 0.731 281
5.7 0.303 2 1.697 298
15.2 0.339 5 4.661 307
31 0.363 10 9.637 311
63 0.384 20 19.616 311
126 0.405 40 39.595 314
Table C.1: Overpotential (V1), voltage across tissue (Vtissue) and tissue resistance (Rtissue) basedon the applied electrode voltage (V0). Above values are for quasi-static simulationincorporating the electrode interface equations for 50 μm diameter disc electrode at1 kHz.
From Table C.1, a relation between the overpotential and the current through the
charge transfer resistance, Irct, can be plotted as shown in Figure C.2. We observe that
the effective voltage across the tissue is reduced by V0. For currents above 2 μA, the
tissue voltage is reduced by 0.3-0.4 V as shown in Figure C.3.
To reach a threshold current value of ~38 μA for subretinal scheme of stimulation
based on computations from our simulation framework, it is necessary to apply
approximately 12 V on the electrode. The voltage across the interface impedance is
negligible in comparison to the applied voltage and therefore interface impedance can
be ignored in our simulation framework.

128 miscellaneous simulations and calculations
0
0.5
1
0 50 100O
verp
oten
tial
, V1
[V]
Current, Irct [µA]
Figure C.2: Overpotential versus current through the charge transfer resistance. Above 2 μA,the voltage drop across the interface (overpotential) reaches 0.3 V, and then slowlyincreases.
0
1
2
3
0 1 2 3 4 5 6
Vol
tage
[V]
Current [µA]
Vtissue V0
Figure C.3: Tissue voltage (Vtissue) and overpotential (V0) for all values of applied electrodevoltage. The effective voltage across in the tissue is reduced by V0 for all ranges ofapplied electrode voltages. For currents above 2 μA, the tissue voltage has a constantreduction by 0.3-0.4 V.
c.2 validation for neglecting capacitive tissue impedance
c.2.1 Model
Consider a Cole electrical equivalent of the computational model as shown in Figure
C.4.

C.2 validation for neglecting capacitive tissue impedance 129
Figure C.4: Circuit equivalent (Cole model) of the simulation model between the electrode andthe ground. The various components are: Charge transfer resistance (RCT), Constantphase element (CPE) impedance of the electrode (ZCPE_I), tissue resistance (Rt),intracellular bulk resistance (Ri) and CPE impedance of the tissue (ZCPE_T). Voltageacross the electrode interface (Vint), voltage across tissue (Vt or V1), applied voltage(Vapp or V2)
c.2.2 Calculations
A 50 μm recessed disc electrode is considered for all calculations. The 200 μm thick
retina model is considered in contact with the electrode.
Using quasi-static computations, at 1 kHz, we have:
Vt or V1|V2=10 = 9.79V [9.77 + i (0.28)]
Considering negligible influence of intracellular conductivity over extracellular
medium conductivity, the spread resistance can be computed with conductivity of
physiological saline as:
Ri|@high f requencies =ρ
4r× 1.6 = 24 kΩ
(resistivity o f physiological medium, ρ = 1.5 Ω ·m)
This is the equation for a disc electrode in a uniform homogeneous medium [Newman
1966] – factor of 1.6 to account for recess (determined by computations).
Current (I) flowing in the circuit can be computed as indicated in Chapter 4.
I|V2=10 = 30.96 µA [30.9 + i (2.56× 10⁻⁶)]
Now,

130 miscellaneous simulations and calculations
V1
I= Rt||Ri + ZCPE_T (C.3)
Considering the tissue impedance to be represented by a CPE component ZCPE_T,
with the following equation:
ZCPE_T = |KT · (iω)−αt |
and assuming αt = 0.75 [Lempka et al. 2009], equation C.3 with two variables can be
substituted with αt at 10 kHz also.
As a consequence, two equations are formed. Solving the two linear simultaneous
equations, values of the variables are obtained as:
Rt = 316 kΩ
@ 1 kHz ZCPE_T = 76 MΩ
@ 10 kHz ZCPE_T = 14 MΩ
It can be inferred that the capacitive impedance of the tissue is more than one order
of magnitude compared to the tissue resistance.

B I B L I O G R A P H Y
Ahuja, A.K., Behrend, M.R., Kuroda, M., Humayun, M.S. and Weiland, J.D. (2008). “An in vitro model of aretinal prosthesis.” IEEE transactions on bio-medical engineering 55(6): 1744–1753, URL http://www.ncbi.nlm.nih.gov/pubmed/18714839. (Cited on pages 29 and 52.)
Ahuja, A.K., Dorn, J.D., Caspi, A., McMahon, M.J., Dagnelie, G., Dacruz, L., Stanga, P., Humayun,M.S. and Greenberg, R.J. (2010). “Blind subjects implanted with the Argus II retinal prosthesis areable to improve performance in a spatial-motor task.” The British journal of ophthalmology URL http://www.ncbi.nlm.nih.gov/pubmed/20881025. (Cited on page 19.)
Airan, R.D., Thompson, K.R., Fenno, L.E., Bernstein, H. and Deisseroth, K. (2009). “Temporally precise invivo control of intracellular signalling.” Nature 458(7241): 1025–1029, URL http://www.ncbi.nlm.nih.gov/pubmed/19295515. (Cited on page 23.)
Ameri, H., Weiland, J. and Humayun, M. (2008). Biological considerations for an intraocular retinal prosthesis,Springer, chapter 1. pages 1–29, URL http://www.springerlink.com/index/v0wj612741557278.pdf.(Cited on page 7.)
AREDS Study Research Group (2001). “A randomized, placebo-controlled, clinical trial of high-dosesupplementation with vitamins C and E, beta carotene, and zinc for age-related macular degenerationand vision loss”. Archives of ophthalmology 119(10): 1417–1436, URL http://www.ncbi.nlm.nih.gov/pmc/articles/PMC1462955/?tool=pmcentrez&report=abstract. (Cited on page 3.)
Banghart, M., Borges, K., Isacoff, E., Trauner, D. and Kramer, R.H. (2004). “Light-activated ion channelsfor remote control of neuronal firing.” Nature neuroscience 7(12): 1381–1386, URL http://www.ncbi.nlm.nih.gov/pmc/articles/PMC1447674/?tool=pmcentrez&report=abstract. (Cited on page 6.)
Behrend, M.R., Ahuja, A.K., Humayun, M.S., Weiland, J.D. and Chow, R.H. (2009). “Selective labeling ofretinal ganglion cells with calcium indicators by retrograde loading in vitro.” Journal of neurosciencemethods 179(2): 166–172, URL http://www.ncbi.nlm.nih.gov/pubmed/19428523. (Cited on pages 52
and 79.)Berndt, A., Yizhar, O., Gunaydin, L.A., Hegemann, P. and Deisseroth, K. (2009). “Bi-stable neural state
switches.” Nature neuroscience 12(2): 229–234, URL http://www.ncbi.nlm.nih.gov/pubmed/19079251.(Cited on page 23.)
Besch, D., Sachs, H., Szurman, P., Gülicher, D., Wilke, R., Reinert, S., Zrenner, E., Bartz-Schmidt, K.U. andGekeler, F. (2008). “Extraocular surgery for implantation of an active subretinal visual prosthesis withexternal connections: feasibility and outcome in seven patients.” The British journal of ophthalmology92(10): 1361–1368, URL http://www.ncbi.nlm.nih.gov/pubmed/18662916. (Cited on page 14.)
Bi, A., Cui, J., Ma, Y.P., Olshevskaya, E., Pu, M., Dizhoor, A.M. and Pan, Z.H. (2006). “Ectopic expression ofa microbial-type rhodopsin restores visual responses in mice with photoreceptor degeneration”. Neuron50(1): 23–33, URL http://www.ncbi.nlm.nih.gov/pubmed/16600853. (Cited on page 6.)
Boinagrov, D., Loudin, J. and Palanker, D. (2010). “Strength-duration relationship for extracellularneural stimulation: numerical and analytical models.” Journal of neurophysiology 104(4): 2236–2248, URL http://www.pubmedcentral.nih.gov/articlerender.fcgi?artid=2957463&tool=pmcentrez&rendertype=abstract. (Cited on pages 10, 31, 32, 79, 80, 81, and 88.)
Bonanomi, M.T.B.C., Nicoletti, A.G.B., Carricondo, P.C., Buzalaf, F., Kara-José, N., Gomes, A.M.V.and Nakashima, Y. (2006). “Retinal thickness assessed by optical coherence tomography (OCT) inpseudophakic macular edema.” Arquivos brasileiros de oftalmologia 69(4): 539–44, URL http://www.ncbi.nlm.nih.gov/pubmed/17119727. (Cited on page 78.)
Boughman, J.A., Conneally, P.M. and Nance, W.E. (1980). “Population genetic studies of retinitispigmentosa”. American journal of human genetics 32(2): 223–235, URL http://www.ncbi.nlm.nih.gov/pubmed/7386458. (Cited on page 3.)
Boyden, E.S., Zhang, F., Bamberg, E., Nagel, G. and Deisseroth, K. (2005). “Millisecond-timescale, geneticallytargeted optical control of neural activity.” Nature neuroscience 8(9): 1263–1268, URL http://www.ncbi.nlm.nih.gov/pubmed/16116447. (Cited on page 23.)
Brindley, G.S. (1973). “Sensory effects of electrical stimulation of the visual and paravisual cortex in man”.Handbook of Sensory Physiology. Central Processing of Visual Information, Part B VII(3): 583–594. (Cited onpage 6.)
Brindley, G.S. and Lewin, W.S. (1968a). “The sensations produced by electrical stimulation of the visualcortex.” The Journal of physiology 196(2): 479–493, URL http://www.ncbi.nlm.nih.gov/pubmed/4871047.(Cited on page 6.)
Brindley, G.S. and Lewin, W.S. (1968b). “The visual sensations produced by electrical stimulation of themedial occipital cortex.” The Journal of physiology 194(2): 54–5P, URL http://www.ncbi.nlm.nih.gov/
131
http://www.pubmedcentral.nih.gov/articlerender.fcgi?artid=2957463&tool=pmcentrez&rendertype=abstract

132 bibliography
pubmed/5639368. (Cited on page 6.)Bringhurst, R. and Marks, H.. (2002). The elements of typographic style. Hartley & Marks, ISBN 0881791326,
350 pages. (Cited on page 145.)Brummer, S.B. and Turner, M.J. (1977). “Electrochemical considerations for safe electrical stimulation of the
nervous system with platinum electrodes.” IEEE transactions on bio-medical engineering 24(1): 59–63, URLhttp://www.ncbi.nlm.nih.gov/pubmed/851475. (Cited on pages 90 and 103.)
Busskamp, V., Duebel, J., Balya, D., Fradot, M., Viney, T.J., Siegert, S., Groner, A.C., Cabuy, E., Forster, V.,Seeliger, M., Biel, M., Humphries, P., Paques, M., Mohand-Said, S., Trono, D., Deisseroth, K., Sahel, J.a.,Picaud, S. and Roska, B. (2010). “Genetic reactivation of cone photoreceptors restores visual responsesin retinitis pigmentosa.” Science (New York, N.Y.) 329(5990): 413–417, URL http://www.ncbi.nlm.nih.gov/pubmed/20576849. (Cited on page 23.)
Butterwick, A., Vankov, A., Huie, P., Freyvert, Y. and Palanker, D. (2007). “Tissue damage by pulsedelectrical stimulation.” IEEE transactions on bio-medical engineering 54(12): 2261–2267, URL http://www.ncbi.nlm.nih.gov/pubmed/18075042. (Cited on page 51.)
Cai, C.F., Liang, P.J. and Zhang, P.M. (2007). A Simulation Study on the Encoding Mechanism of RetinalGanglion Cell, Springer Berlin Heidelberg, Berlin, Heidelberg, volume 4689 of Lecture Notes inComputer Science. ISBN 978-3-540-74770-3, pages 470–479, URL http://www.springerlink.com/content/8112h285306m8257/. (Cited on page 26.)
Cantrell, D.R., Inayat, S., Taflove, A., Ruoff, R.S. and Troy, J.B. (2008). “Incorporation of the electrode-electrolyte interface into finite-element models of metal microelectrodes.” Journal of neural engineering5(1): 54–67, URL http://www.ncbi.nlm.nih.gov/pubmed/18310811. (Cited on pages 82, 121, 125, 126,and 127.)
Cardin, J.A., Carlén, M., Meletis, K., Knoblich, U., Zhang, F., Deisseroth, K., Tsai, L.H. and Moore, C.I.(2009). “Driving fast-spiking cells induces gamma rhythm and controls sensory responses.” Nature459(7247): 663–667, URL http://www.ncbi.nlm.nih.gov/pubmed/19396156. (Cited on page 23.)
Chader, G.J., Weiland, J. and Humayun, M.S. (2009). “Artificial vision: needs, functioning, and testing of aretinal electronic prosthesis.” Progress in brain research 175(09): 317–332, URL http://www.ncbi.nlm.nih.gov/pubmed/19660665. (Cited on pages 7 and 16.)
Chen, B. and Cepko, C.L. (2009). “HDAC4 regulates neuronal survival in normal and diseased retinas.”Science (New York, N.Y.) 323(5911): 256–259, URL http://www.ncbi.nlm.nih.gov/pubmed/19131628.(Cited on page 24.)
Chow, A.Y., Chow, V.Y., Packo, K.H., Pollack, J.S., Peyman, G.A. and Schuchard, R. (2004). “Theartificial silicon retina microchip for the treatment of vision loss from retinitis pigmentosa.” Archivesof ophthalmology 122(4): 460–469, URL http://www.ncbi.nlm.nih.gov/pubmed/15078662. (Cited onpages 14, 16, and 17.)
Chow, A.Y., Pardue, M.T., Chow, V.Y., Peyman, G.A., Liang, C., Perlman, J.I. and Peachey, N.S. (2001).“Implantation of silicon chip microphotodiode arrays into the cat subretinal space.” IEEE transactions onneural systems and rehabilitation engineering : a publication of the IEEE Engineering in Medicine and BiologySociety 9(1): 86–95, URL http://www.ncbi.nlm.nih.gov/pubmed/11482368. (Cited on pages 78 and 108.)
Ciulla, T.A., Danis, R.P. and Harris, A. (1998). “Age-related macular degeneration: a review of experimentaltreatments”. Survey of ophthalmology 43(2): 134–46, URL http://www.ncbi.nlm.nih.gov/pubmed/9763138.(Cited on page 4.)
Clausen, J. (1955). “Visual sensations (phosphenes) produced by AC sine wave stimulation.” Actapsychiatrica et neurologica Scandinavica. Supplementum 94: 1–101, URL http://www.ncbi.nlm.nih.gov/pubmed/13258326. (Cited on page 5.)
Coburn, B. (1989). “Neural modeling in electrical stimulation”. Critical reviews in biomedical engineering17(2): 133–78, URL http://www.ncbi.nlm.nih.gov/pubmed/2663351. (Cited on page 99.)
Cohen, E.D. (2007). “Prosthetic interfaces with the visual system: biological issues.” Journal of neuralengineering 4(2): R14–R31, URL http://www.ncbi.nlm.nih.gov/pubmed/17409473. (Cited on page 39.)
Cole, K.S. (1940). “Permeability and impermeability of cell membranes for ions”. Cold Spring HarborSymposia on Quantitative Biology 8: 110–122, URL http://symposium.cshlp.org/content/8/110.short.(Cited on page 58.)
Colodetti, L., Weiland, J.D., Colodetti, S., Ray, A., Seiler, M.J., Hinton, D.R. and Humayun, M.S. (2007).“Pathology of damaging electrical stimulation in the retina.” Experimental eye research 85(1): 23–33, URLhttp://www.ncbi.nlm.nih.gov/pubmed/17531974. (Cited on page 51.)
Congdon, N., O’Colmain, B., Klaver, C.C.W., Klein, R., Muñoz, B., Friedman, D.S., Kempen, J., Taylor, H.R.and Mitchell, P. (2004). “Causes and prevalence of visual impairment among adults in the United States.”Archives of ophthalmology 122(4): 477–485, URL http://www.ncbi.nlm.nih.gov/pubmed/15078664. (Citedon page 3.)
Congdon, N.G., Friedman, D.S. and Lietman, T. (2003). “Important causes of visual impairment inthe world today”. JAMA : the journal of the American Medical Association 290(15): 2057–60, URL http://www.ncbi.nlm.nih.gov/pubmed/14559961. (Cited on page 3.)

bibliography 133
Cottaris, N.P. and Elfar, S.D. (2005). “How the retinal network reacts to epiretinal stimulation to form theprosthetic visual input to the cortex.” Journal of neural engineering 2(1): S74–90, URL http://www.ncbi.nlm.nih.gov/pubmed/15876658. (Cited on pages 26, 34, 35, and 52.)
Dagnelie, G. (2008). “Psychophysical evaluation for visual prosthesis.” Annual review of biomedical engineering10: 339–368, URL http://www.ncbi.nlm.nih.gov/pubmed/18429703. (Cited on page 6.)
Dagnelie, G. (2011). Visual prosthetics. Springer, 1st edition, ISBN 978-1-4419-0753-0, 453 pages, URL http://www.ingentaconnect.com/content/ftd/erd/2006/00000003/00000003/art00008. (Cited on pages 49,51, and 97.)
de Balthasar, C., Patel, S., Roy, A., Freda, R., Greenwald, S., Horsager, A., Mahadevappa, M., Yanai, D.,McMahon, M.J., Humayun, M.S., Greenberg, R.J., Weiland, J.D. and Fine, I. (2008). “Factors affectingperceptual thresholds in epiretinal prostheses.” Investigative ophthalmology & visual science 49(6): 2303–2314, URL http://www.ncbi.nlm.nih.gov/pubmed/18515576. (Cited on pages 9, 12, 87, 88, 89, 91, 93,94, 97, 100, 104, 108, and 109.)
Dobelle, W.H. (2000). “Artificial vision for the blind by connecting a television camera to the visualcortex.” ASAIO journal (American Society for Artificial Internal Organs : 1992) 46(1): 3–9, URL http://www.ncbi.nlm.nih.gov/pubmed/10667705. (Cited on pages 6 and 7.)
Dobelle, W.H. and Mladejovsky, M.G. (1974). “Phosphenes produced by electrical stimulation of humanoccipital cortex, and their application to the development of a prosthesis for the blind.” The Journalof physiology 243(2): 553–576, URL http://www.ncbi.nlm.nih.gov/pmc/articles/PMC1330721/?tool=pmcentrez&report=abstract. (Cited on page 6.)
Dobelle, W.H., Mladejovsky, M.G. and Girvin, J.P. (1974). “Artifical vision for the blind: electrical stimulationof visual cortex offers hope for a functional prosthesis.” Science (New York, N.Y.) 183(123): 440–444, URLhttp://www.ncbi.nlm.nih.gov/pubmed/4808973. (Cited on page 6.)
Doh, S.T., Hao, H., Loh, S.C., Patel, T., Tawil, H.Y., Chen, D.K., Pashkova, A., Shen, A., Wang, H. and Cai,L. (2010). “Analysis of retinal cell development in chick embryo by immunohistochemistry and in ovoelectroporation techniques.” BMC developmental biology 10(1): 8, URL http://www.pubmedcentral.nih.gov/articlerender.fcgi?artid=2822752&tool=pmcentrez&rendertype=abstract. (Cited on page 66.)
Dokos, S., Suaning, G.J. and Lovell, N.H. (2005). “A bidomain model of epiretinal stimulation.” IEEEtransactions on neural systems and rehabilitation engineering 13(2): 137–146, URL http://www.ncbi.nlm.nih.gov/pubmed/16003891. (Cited on page 27.)
Dommel, N.B., Wong, Y.T., Lehmann, T., Dodds, C.W., Lovell, N.H. and Suaning, G.J. (2009). “A CMOSretinal neurostimulator capable of focussed, simultaneous stimulation.” Journal of neural engineering 6(3):035,006 (10pp), URL http://www.ncbi.nlm.nih.gov/pubmed/19458399. (Cited on page 7.)
Doroudchi, M.M., Greenberg, K.P., Liu, J., Silka, K.A., Boyden, E.S., Lockridge, J.A., Arman, A.C., Janani,R., Boye, S.E., Boye, S.L., Gordon, G.M., Matteo, B.C., Sampath, A.P., Hauswirth, W.W. and Horsager,A. (2011). “Virally delivered Channelrhodopsin-2 Safely and Effectively Restores Visual Function inMultiple Mouse Models of Blindness.” Molecular therapy : the journal of the American Society of GeneTherapy URL http://www.ncbi.nlm.nih.gov/pubmed/21505421. (Cited on page 5.)
Dowling, J. (2009). “Current and future prospects for optoelectronic retinal prostheses.” Eye (London,England) 23(10): 1999–2005, URL http://www.ncbi.nlm.nih.gov/pubmed/19098703. (Cited on page 11.)
Duan, Y.Y., Clark, G.M. and Cowan, R.S.C. (2004). “A study of intra-cochlear electrodes and tissueinterface by electrochemical impedance methods in vivo.” Biomaterials 25(17): 3813–28, URL http://www.ncbi.nlm.nih.gov/pubmed/15020157. (Cited on page 93.)
Dufier, J.L. (2003). “[Early therapeutic trials for retinitis pigmentosa].” Bulletin de l’Académie nationalede médecine 187(9): 1685–1692; discussion 1692–1694, URL http://www.ncbi.nlm.nih.gov/pubmed/15369238. (Cited on page 4.)
Durand, D.M. (2000). Electric Stimulation of Excitable Tissue, CRC Press, Boco Ratan, FL, chapter 17. 2ndedition, ISBN 978-0-8493-8594-0, page 23. (Cited on page 43.)
Eckhorn, R., Wilms, M., Schanze, T., Eger, M., Hesse, L., Eysel, U.T., Kisvárday, Z.F., Zrenner, E., Gekeler,F., Schwahn, H., Shinoda, K., Sachs, H. and Walter, P. (2006). “Visual resolution with retinal implantsestimated from recordings in cat visual cortex.” Vision research 46(17): 2675–2690, URL http://www.ncbi.nlm.nih.gov/pubmed/16571357. (Cited on page 107.)
Eckmiller, R., Becker, M. and Hunermann, R. (1999). Towards a learning retina implant with epiretinal contacts.IEEE, ISBN 0-7803-5731-0, 396–399 pages, URL http://ieeexplore.ieee.org/lpdocs/epic03/wrapper.htm?arnumber=812435. (Cited on pages 15 and 26.)
Fariss, R.N., Li, Z.Y. and Milam, A.H. (2000). “Abnormalities in rod photoreceptors, amacrine cells, andhorizontal cells in human retinas with retinitis pigmentosa.” American journal of ophthalmology 129(2):215–223, URL http://www.ncbi.nlm.nih.gov/pubmed/10682975. (Cited on page 6.)
Feucht, M., Laube, T., Bornfeld, N., Walter, P., Velikay-Parel, M., Hornig, R. and Richard, G. (2005).“[Development of an epiretinal prosthesis for stimulation of the human retina].” Der Ophthalmologe :Zeitschrift der Deutschen Ophthalmologischen Gesellschaft 102(7): 688–691, URL http://www.ncbi.nlm.nih.gov/pubmed/15770506. (Cited on page 19.)
http://www.pubmedcentral.nih.gov/articlerender.fcgi?artid=2822752&tool=pmcentrez&rendertype=abstract

134 bibliography
Foerster, O. (1929). “Beiträge zur pathophysiologie der sehspäre”. J Psychol Neurol (Ppz) 39: 463–485. (Citedon page 6.)
Fohlmeister, J.F., Coleman, P.A. and Miller, R.F. (1990). “Modeling the repetitive firing of retinal ganglioncells.” Brain research 510(2): 343–345, URL http://www.ncbi.nlm.nih.gov/pubmed/2331606. (Cited onpage 79.)
Fried, S., Kubow, T. and Werblin, F. (2004). “Complex synaptic activation of bipolar, amacrine and ganglioncells is elicited with biphasic electrical stimulation”. Neural Networks, 2004. Proceedings. 2004 IEEEInternational Joint Conference on 1, URL http://ieeexplore.ieee.org/xpls/abs_all.jsp?arnumber=1379952. (Cited on pages 52 and 99.)
Fried, S.I., Hsueh, H.A. and Werblin, F.S. (2006). “A method for generating precise temporal patternsof retinal spiking using prosthetic stimulation.” Journal of neurophysiology 95(2): 970–978, URL http://www.ncbi.nlm.nih.gov/pubmed/16236780. (Cited on pages 47 and 79.)
Fried, S.I., Lasker, A.C.W., Desai, N.J., Eddington, D.K. and Rizzo, J.F. (2009). “Axonal sodium-channelbands shape the response to electric stimulation in retinal ganglion cells.” Journal of neurophysiology 101(4):1972–1987, URL http://www.ncbi.nlm.nih.gov/pubmed/19193771. (Cited on pages 40, 52, and 79.)
Fujikado, T., Morimoto, T., Kanda, H., Kusaka, S., Nakauchi, K., Ozawa, M., Matsushita, K., Sakaguchi, H.,Ikuno, Y., Kamei, M. and Tano, Y. (2007). “Evaluation of phosphenes elicited by extraocular stimulationin normals and by suprachoroidal-transretinal stimulation in patients with retinitis pigmentosa.” Graefe’sarchive for clinical and experimental ophthalmology 245(10): 1411–1419, URL http://www.ncbi.nlm.nih.gov/pubmed/17342502. (Cited on page 7.)
Geddes, L.A. (2004). “Accuracy limitations of chronaxie values.” IEEE transactions on bio-medical engineering51(1): 176–181, URL http://www.ncbi.nlm.nih.gov/pubmed/14723507. (Cited on page 48.)
Gerding, H. (2007). “A new approach towards a minimal invasive retina implant.” Journal of neuralengineering 4(1): S30–S37, URL http://www.ncbi.nlm.nih.gov/pubmed/17325414. (Cited on page 7.)
Gerding, H., Benner, F.P. and Taneri, S. (2007). “Experimental implantation of epiretinal retina implants(EPI-RET) with an IOL-type receiver unit.” Journal of neural engineering 4(1): S38–S49, URL http://www.ncbi.nlm.nih.gov/pubmed/17325415. (Cited on pages 7 and 19.)
Gerhardt, M., Alderman, J. and Stett, A. (2010). “Electric field stimulation of bipolar cells in a degeneratedretina–a theoretical study.” IEEE transactions on neural systems and rehabilitation engineering : a publicationof the IEEE Engineering in Medicine and Biology Society 18(1): 1–10, URL http://www.ncbi.nlm.nih.gov/pubmed/20071281. (Cited on pages 30, 52, and 99.)
Gosalia, K., Weiland, J., Humayun, M. and Lazzi, G. (2004). “Thermal elevation in the human eye and headdue to the operation of a retinal prosthesis.” IEEE transactions on bio-medical engineering 51(8): 1469–77,URL http://www.ncbi.nlm.nih.gov/pubmed/15311834. (Cited on page 25.)
Gradinaru, V., Thompson, K.R. and Deisseroth, K. (2008). “eNpHR: a Natronomonas halorhodopsinenhanced for optogenetic applications.” Brain cell biology 36(1-4): 129–139, URL http://www.pubmedcentral.nih.gov/articlerender.fcgi?artid=2588488&tool=pmcentrez&rendertype=abstract. (Cited on page 23.)
Greenberg, R. (1998). Analysis of Electrical Stimulation of the Vertebrate Retina: Work Towards a Retinal Prosthesis.- PhD Thesis. Phd thesis, The Johns Hopkins University Baltimore. (Cited on page 47.)
Greenberg, R., Neysmith, J., Talbot, N., Little, J., McClure, K., Mech, B., Dai, R., Zhou, D. and Nolan, G.(2008). “Return Electrode for a Flexible Circuit Electrode Array”. URL http://www.freepatentsonline.com/y2009/0118805.html. (Cited on page 25.)
Greenberg, R.J., Velte, T.J., Humayun, M.S., Scarlatis, G.N. and de Juan, E. (1999). “A computational modelof electrical stimulation of the retinal ganglion cell.” IEEE transactions on bio-medical engineering 46(5):505–514, URL http://www.ncbi.nlm.nih.gov/pubmed/10230129. (Cited on pages 24, 52, and 80.)
Grimnes, S. and Martinsen, O.G. (2008). Bioimpedance and Bioelectricity Basics (Second Edition). AcademicPress, ISBN 0-12-374004-5, 488 pages. (Cited on pages 33 and 58.)
Güven, D., Weiland, J.D., Fujii, G., Mech, B.V., Mahadevappa, M., Greenberg, R., Roizenblatt, R., Qiu,G., Labree, L., Wang, X., Hinton, D. and Humayun, M.S. (2005). “Long-term stimulation by activeepiretinal implants in normal and RCD1 dogs.” Journal of neural engineering 2(1): S65–S73, URL http://www.ncbi.nlm.nih.gov/pubmed/15876657. (Cited on page 51.)
Hagins, W.A., Penn, R.D. and Yoshikami, S. (1970). “Dark current and photocurrent in retinal rods.”Biophysical journal 10(5): 380–412, URL http://www.ncbi.nlm.nih.gov/pubmed/5439318. (Cited onpages 65, 66, and 67.)
Haim, M. (2002). “Epidemiology of retinitis pigmentosa in Denmark.” Acta ophthalmologica Scandinavica.Supplement (233): 1–34, URL http://www.ncbi.nlm.nih.gov/pubmed/11921605. (Cited on page 3.)
Haim, M., Holm, N.V. and Rosenberg, T. (1992). “A population survey of retinitis pigmentosa and allieddisorders in Denmark. Completeness of registration and quality of data.” Acta ophthalmologica 70(2):165–177, URL http://www.ncbi.nlm.nih.gov/pubmed/1609564. (Cited on page 3.)
http://www.pubmedcentral.nih.gov/articlerender.fcgi?artid=2588488&tool=pmcentrez&rendertype=abstract
http://www.pubmedcentral.nih.gov/articlerender.fcgi?artid=2588488&tool=pmcentrez&rendertype=abstract

bibliography 135
Han, X. and Boyden, E.S. (2007). “Multiple-color optical activation, silencing, and desynchronization ofneural activity, with single-spike temporal resolution.” PloS one 2(3): e299, URL http://www.ncbi.nlm.nih.gov/pubmed/17375185. (Cited on page 23.)
Harding, S. (2003). “Extracts from "concise clinical evidence". Diabetic retinopathy.” BMJ (Clinicalresearch ed.) 326(7397): 1023–1025, URL http://www.ncbi.nlm.nih.gov/pmc/articles/PMC1125930/?tool=pmcentrez&report=abstract. (Cited on page 4.)
Heynen, H. and van Norren, D. (1985). “Origin of the electroretinogram in the intact macaque eye–II.Current source-density analysis.” Vision research 25(5): 709–15, URL http://www.ncbi.nlm.nih.gov/pubmed/4024471. (Cited on pages 10, 55, 65, 66, 67, 77, and 100.)
Hims, M.M., Diager, S.P. and Inglehearn, C.F. (2003). “Retinitis pigmentosa: genes, proteins and prospects”.Developments in ophthalmology 37: 109–125, URL http://www.scopus.com/scopus/inward/record.url?eid=2-s2.0-0042285484&partnerID=40&rel=R7.0.0. (Cited on page 4.)
Hines, M. (1993). “NEURON-a program for simulation of nerve equations”. Neural systems: Analysis andmodeling : 127–136URL http://citeseerx.ist.psu.edu/viewdoc/summary?doi=10.1.1.45.9006. (Citedon page 24.)
Hodgkin, A.L. and Huxley, A.F. (1952). “A quantitative description of membrane current and its applicationto conduction and excitation in nerve.” The Journal of physiology 117(4): 500–544, URL http://www.ncbi.nlm.nih.gov/pubmed/12991237. (Cited on page 40.)
Holsheimer, J. (2003). Principles of neurostimulation, Elsevier Science Health Science div, chapter 3. ISBN0444512586, page 17. (Cited on page 41.)
Hornig, R. and Eckmiller, R. (2001). Optimizing stimulus parameters by modeling multi-electrode electricalstimulation for retina implants. IEEE, Washington, DC, ISBN 0-7803-7044-9, 860–865 pages, URL http://ieeexplore.ieee.org/lpdocs/epic03/wrapper.htm?arnumber=939472. (Cited on page 26.)
Hornig, R., Laube, T., Walter, P., Velikay-Parel, M., Bornfeld, N., Feucht, M., Akguel, H., Rössler, G.,Alteheld, N., Lütke Notarp, D., Wyatt, J. and Richard, G. (2005). “A method and technical equipment foran acute human trial to evaluate retinal implant technology.” Journal of neural engineering 2(1): S129–S134,URL http://www.ncbi.nlm.nih.gov/pubmed/15876648. (Cited on page 7.)
Horsager, A., Boynton, G.M., Greenberg, R.J. and Fine, I. (2011). “Temporal interactions during paired-electrode stimulation in two retinal prosthesis subjects.” Investigative ophthalmology & visual science 52(1):549–557, URL http://www.ncbi.nlm.nih.gov/pubmed/20720224. (Cited on page 34.)
Horsager, A., Greenwald, S.H., Weiland, J.D., Humayun, M.S., Greenberg, R.J., McMahon, M.J., Boynton,G.M. and Fine, I. (2009). “Predicting visual sensitivity in retinal prosthesis patients.” Investigativeophthalmology & visual science 50(4): 1483–1491, URL http://www.ncbi.nlm.nih.gov/pubmed/19098313.(Cited on pages 34 and 75.)
Huang, Y., Cideciyan, A.V., Papastergiou, G.I., Banin, E., Milam, A.H., Semple-Rowland, S.L. and Jacobson,S.G. (1998). “Relation of optical coherence tomography to microanatomy in normal and rd chickens.”Investigative ophthalmology & visual science 39(12): 2405–16, URL http://www.ncbi.nlm.nih.gov/pubmed/9804149. (Cited on pages 56 and 78.)
Hughes, M.L., Vander Werff, K.R., Brown, C.J., Abbas, P.J., Kelsay, D.M., Teagle, H.F. and Lowder, M.W.(2001). “A longitudinal study of electrode impedance, the electrically evoked compound action potential,and behavioral measures in nucleus 24 cochlear implant users.” Ear and hearing 22(6): 471–486, URLhttp://www.ncbi.nlm.nih.gov/pubmed/11770670. (Cited on page 93.)
Humayun, M.S., de Juan, E., Dagnelie, G., Greenberg, R.J., Propst, R.H. and Phillips, D.H. (1996). “Visualperception elicited by electrical stimulation of retina in blind humans.” Archives of ophthalmology 114(1):40–6, URL http://www.ncbi.nlm.nih.gov/pubmed/8540849. (Cited on pages 7 and 28.)
Humayun, M.S., de Juan, E., Weiland, J.D., Dagnelie, G., Katona, S., Greenberg, R. and Suzuki, S. (1999).“Pattern electrical stimulation of the human retina.” Vision research 39(15): 2569–2576, URL http://www.ncbi.nlm.nih.gov/pubmed/10396625. (Cited on page 7.)
Humayun, M.S., Weiland, J.D., Chader, G. and Greenbaum, E. (2007). Artificial Sight. Biological and MedicalPhysics, Biomedical Engineering, Springer New York, New York, NY, biological edition, ISBN 978-0-387-49329-9, URL http://www.springerlink.com/index/10.1007/978-0-387-49331-2. (Cited on pages 28
and 35.)Humayun, M.S., Weiland, J.D., Fujii, G.Y., Greenberg, R., Williamson, R., Little, J., Mech, B., Cimmarusti, V.,
Van Boemel, G., Dagnelie, G. and de Juan, E. (2003). “Visual perception in a blind subject with a chronicmicroelectronic retinal prosthesis.” Vision research 43(24): 2573–2581, URL http://www.ncbi.nlm.nih.gov/pubmed/13129543. (Cited on page 87.)
Humphries, P., Kenna, P. and Farrar, G.J. (1992). “On the molecular genetics of retinitis pigmentosa”. Science(New York, N.Y.) 256(5058): 804–808, URL http://www.ncbi.nlm.nih.gov/pubmed/1589761. (Cited onpage 3.)
Jacobs, P., Varlan, A. and Sansen, W. (1995). “Design optimisation of planar electrolytic conductivitysensors”. Medical & biological engineering & computing 33(6): 802–10, URL http://www.ncbi.nlm.nih.gov/pubmed/8558953. (Cited on page 60.)

136 bibliography
Jensen, R. and Rizzo, J. (2008). “Activation of retinal ganglion cells in wild-type and rd1 mice throughelectrical stimulation of the retinal neural network”. Vision Research 48(14): 1562–1568, URL http://linkinghub.elsevier.com/retrieve/pii/S0042698908002277. (Cited on page 100.)
Jensen, R.J. and Rizzo, J.F. (2007). “Responses of ganglion cells to repetitive electrical stimulation of theretina.” Journal of neural engineering 4(1): S1–S6, URL http://www.ncbi.nlm.nih.gov/pubmed/17325407.(Cited on pages 51 and 99.)
Jensen, R.J., Rizzo, J.F., Ziv, O.R., Grumet, A. and Wyatt, J. (2003). “Thresholds for activation of rabbitretinal ganglion cells with an ultrafine, extracellular microelectrode.” Investigative ophthalmology & visualscience 44(8): 3533–3543, URL http://www.ncbi.nlm.nih.gov/pubmed/12882804. (Cited on pages 27, 51,87, and 89.)
Jensen, R.J., Ziv, O.R. and Rizzo, J.F. (2005a). “Responses of rabbit retinal ganglion cells to electricalstimulation with an epiretinal electrode.” Journal of neural engineering 2(1): S16–S21, URL http://www.ncbi.nlm.nih.gov/pubmed/15876650. (Cited on page 99.)
Jensen, R.J., Ziv, O.R. and Rizzo, J.F. (2005b). “Thresholds for activation of rabbit retinal ganglion cellswith relatively large, extracellular microelectrodes.” Investigative ophthalmology & visual science 46(4):1486–1496, URL http://www.ncbi.nlm.nih.gov/pubmed/15790920. (Cited on pages 74, 80, and 91.)
Johnson, L., Scribner, D., Skeath, P., Klein, R., Ilg, D., Perkins, K., Helfgott, M., Sanders, R. and Panigrahi,D. (2007). “Impedance-based retinal contact imaging as an aid for the placement of high resolutionepiretinal prostheses.” Journal of neural engineering 4(1): S17–S23, URL http://www.ncbi.nlm.nih.gov/pubmed/17325412. (Cited on pages 88 and 104.)
Johnston, D. (2010). “Lab plays key role in Department of Energy’s artificial retina project”. URL https://www.llnl.gov/news/newsreleases/2010/NR-10-02-03.html. (Cited on page 20.)
Kameneva, T., Meffin, H. and Burkitt, A.N. (2010). “Differential stimulation of ON and OFF retinal ganglioncells: A modeling study.” Conference proceedings : ... Annual International Conference of the IEEE Engineeringin Medicine and Biology Society 1: 4246–4249, URL http://www.ncbi.nlm.nih.gov/pubmed/21096639.(Cited on pages 30 and 52.)
Karwoski, C.J., Frambach, D.A. and Proenza, L.M. (1985). “Laminar profile of resistivity in frog retina”.Journal of neurophysiology 54(6): 1607–1619, URL http://www.ncbi.nlm.nih.gov/pubmed/3878863. (Citedon pages 29, 33, and 66.)
Karwoski, C.J. and Xu, X. (1999). “Current source-density analysis of light-evoked field potentials inrabbit retina.” Visual neuroscience 16(2): 369–377, URL http://www.ncbi.nlm.nih.gov/pubmed/10367970.(Cited on pages 55, 65, 66, and 67.)
Karwoski, C.J., Xu, X. and Yu, H. (1996). “Current-source density analysis of the electroretinogram of thefrog: methodological issues and origin of components.” Journal of the Optical Society of America. A, Optics,image science, and vision 13(3): 549–556, URL http://www.ncbi.nlm.nih.gov/pubmed/8627411. (Cited onpage 55.)
Kern, W. (1993). Handbook of Semiconductor Wafer Cleaning Technology - Science, Technology, and Applications.Elsevier Science and Technology Books, ISBN 0-8155-1331-3, 623 pages. (Cited on page 61.)
Klassen, H.J., Ng, T.F., Kurimoto, Y., Kirov, I., Shatos, M., Coffey, P. and Young, M.J. (2004). “Multipotentretinal progenitors express developmental markers, differentiate into retinal neurons, and preservelight-mediated behavior”. Investigative Ophthalmology & Visual Science 45(11): 4167–4173. (Cited onpage 5.)
Klomp, G.F., Womack, M.V. and Dobelle, W.H. (1977). “Fabrication of large arrays of cortical electrodes foruse in man.” Journal of biomedical materials research 11(3): 347–364, URL http://www.ncbi.nlm.nih.gov/pubmed/853046. (Cited on page 6.)
Kolb, H. (1994). “The architecture of functional neural circuits in the vertebrate retina. The ProctorLecture.” Investigative ophthalmology & visual science 35(5): 2385–2404, URL http://www.ncbi.nlm.nih.gov/pubmed/8163331. (Cited on page 13.)
Krause, F. (1924). “Die sehbahnen in chirurgischer beziehung und die faradische reizung des sehzentrums.”Klin Wochenschr 3: 1260–1265. (Cited on page 6.)
Kreatsoulas, J. (2010). “Retinal prosthesis techonology”. URL http://bmctoday.net/retinatoday/2010/08/article.asp?f=retinal-prosthesis-technology. (Cited on page 19.)
Kuras, A., Baginskas, A. and Batuleviciene, V. (2004). “Suprathreshold excitation of frog tectal neurons byshort spike trains of single retinal ganglion cell.” Experimental brain research. Experimentelle Hirnforschung.Expérimentation cérébrale 159(4): 509–18, URL http://www.ncbi.nlm.nih.gov/pubmed/15221171. (Citedon page 52.)
Lambert, V., Laloyaux, C., Schmitt, C., Gerard, B., Delbeke, J. and Veraart, C. (2003). “Localisation,Discrimination, and Grasping of Daily Life Objects with an Implanted Optic Nerve Prosthesis”. ARVOMeeting Abstracts 44(5): 4208, URL http://abstracts.iovs.org/cgi/content/abstract/44/5/4208.(Cited on page 7.)
Lapicque, L. (1907). “Recherches quantitatives sur l’excitation électrique des nerfs traitée comme unepolarisation”. J. Physiol. Pathol. Gen 9: 620–635. (Cited on page 46.)

bibliography 137
Leanne Chan (2009). Electrical excitation of degenerate retina. Phd dissertation. (Cited on pages 40, 41, and 43.)Lebherz, C., Maguire, A., Tang, W., Bennett, J. and Wilson, J.M. (2008). “Novel AAV serotypes for improved
ocular gene transfer.” The journal of gene medicine 10(4): 375–382, URL http://www.pubmedcentral.nih.gov/articlerender.fcgi?artid=2842078&tool=pmcentrez&rendertype=abstract. (Cited on page 23.)
Lecchi, M., Linderholm, P., Pelizzone, M., Picaud, S., Renaud, P., Salzmann, J., Sommerhalder, J., Safran, A.and Bertrand, D. (2006). “What physiology tells us about electrical stimulation in retinal implants”. In“Invest Ophthalmol Vis Sci - ARVO 2006”, pages 4–4. (Cited on page 73.)
Lee, D.C. and Grill, W.M. (2005). “Polarization of a spherical cell in a nonuniform extracellular electric field.”Annals of biomedical engineering 33(5): 603–15, URL http://www.ncbi.nlm.nih.gov/pubmed/15981861.(Cited on pages 13, 33, and 55.)
Lempka, S.F., Miocinovic, S., Johnson, M.D., Vitek, J.L. and McIntyre, C.C. (2009). “In vivo impedancespectroscopy of deep brain stimulation electrodes.” Journal of neural engineering 6(4): 046,001, URLhttp://www.ncbi.nlm.nih.gov/pubmed/19494421. (Cited on page 130.)
Léveillard, T. and Sahel, J.A. (2010). “Rod-derived cone viability factor for treating blinding diseases: fromclinic to redox signaling.” Science translational medicine 2(26): 26ps16, URL http://www.pubmedcentral.nih.gov/articlerender.fcgi?artid=2896730&tool=pmcentrez&rendertype=abstract. (Cited onpage 24.)
Lin, B., Masland, R.H. and Strettoi, E. (2009). “Remodeling of cone photoreceptor cells after roddegeneration in rd mice.” Experimental eye research 88(3): 589–599, URL http://www.pubmedcentral.nih.gov/articlerender.fcgi?artid=2656412&tool=pmcentrez&rendertype=abstract. (Cited on page 23.)
Linderholm, P. (2006). Two-dimensional microimpedance imaging for cell culture monitoring. Ph.D. thesis, EPFL.(Cited on pages 39, 56, and 57.)
Livesey, F.J. and Cepko, C.L. (2001). “Vertebrate neural cell-fate determination: lessons from the retina.”Nature reviews. Neuroscience 2(2): 109–118, URL http://www.ncbi.nlm.nih.gov/pubmed/11252990. (Citedon page 66.)
Löwenstein, W.K. and Borchart, M. (1918). “Symptomatologie und elektrische Reizung bei einerSchubverletzung des Histerhauptlappens”. Dtsch Z Nervenheilk 58: 264–292. (Cited on page 6.)
MacLaren, R.E., Pearson, R.a., MacNeil, a., Douglas, R.H., Salt, T.E., Akimoto, M., Swaroop, a., Sowden, J.C.and Ali, R.R. (2006). “Retinal repair by transplantation of photoreceptor precursors.” Nature 444(7116):203–7, URL http://www.ncbi.nlm.nih.gov/pubmed/17093405. (Cited on page 5.)
Mahadevappa, M., Weiland, J.D., Yanai, D., Fine, I., Greenberg, R.J. and Humayun, M.S. (2005). “Perceptualthresholds and electrode impedance in three retinal prosthesis subjects”. IEEE transactions on neuralsystems and rehabilitation engineering : a publication of the IEEE Engineering in Medicine and Biology Society13(2): 201–206, URL http://www.ncbi.nlm.nih.gov/pubmed/16003900. (Cited on pages 93 and 97.)
Majji, A.B., Humayun, M.S., Weiland, J.D., Suzuki, S., D’Anna, S.A. and de Juan, E. (1999). “Long-termhistological and electrophysiological results of an inactive epiretinal electrode array implantation indogs.” Investigative ophthalmology & visual science 40(9): 2073–2081, URL http://www.ncbi.nlm.nih.gov/pubmed/10440263. (Cited on page 15.)
Marc, R.E., Jones, B.W., Watt, C.B. and Strettoi, E. (2003). “Neural remodeling in retinal degeneration.”Progress in retinal and eye research 22(5): 607–655, URL http://www.ncbi.nlm.nih.gov/pubmed/12892644.(Cited on pages 6 and 35.)
Margalit, E. and Sadda, S.R. (2003). “Retinal and optic nerve diseases.” Artificial organs 27(11): 963–974,URL http://www.ncbi.nlm.nih.gov/pubmed/17471327. (Cited on page 3.)
Maynard, E.M., Hatsopoulos, N.G., Ojakangas, C.L., Acuna, B.D., Sanes, J.N., Normann, R.A. andDonoghue, J.P. (1999). “Neuronal interactions improve cortical population coding of movement direction.”The Journal of neuroscience 19(18): 8083–8093, URL http://www.ncbi.nlm.nih.gov/pubmed/10479708.(Cited on page 7.)
McAdams, E., Lackermeier, A., McLaughlin, J.A., Macken, D. and Jossinet, J. (1995). “The linear andnon-linear electrical properties of the electrode-electrolyte interface”. Biosensors and Bioelectronics 10(1-2):67–74, URL http://linkinghub.elsevier.com/retrieve/pii/095656639596795Z. (Cited on pages 39
and 58.)McCreery, D. (2004). Tissue reaction to electrodes: The problem of safe and effective stimulation of neural tissue,
World Scientific Publishing, River Edge, NJ. pages 592–607. (Cited on page 49.)McCreery, D.B., Agnew, W.F., Yuen, T.G. and Bullara, L. (1990). “Charge density and charge per phase as
cofactors in neural injury induced by electrical stimulation”. IEEE transactions on bio-medical engineering37(10): 996–1001, URL http://www.ncbi.nlm.nih.gov/pubmed/2249872. (Cited on page 50.)
McCreery, D.B., Agnew, W.F., Yuen, T.G. and Bullara, L.A. (1995). “Relationship between stimulusamplitude, stimulus frequency and neural damage during electrical stimulation of sciatic nerve of cat.”Medical & biological engineering & computing 33(3 Spec No): 426–469, URL http://www.ncbi.nlm.nih.gov/pubmed/7666690. (Cited on page 50.)
http://www.pubmedcentral.nih.gov/articlerender.fcgi?artid=2842078&tool=pmcentrez&rendertype=abstract
http://www.pubmedcentral.nih.gov/articlerender.fcgi?artid=2842078&tool=pmcentrez&rendertype=abstract
http://www.pubmedcentral.nih.gov/articlerender.fcgi?artid=2896730&tool=pmcentrez&rendertype=abstract
http://www.pubmedcentral.nih.gov/articlerender.fcgi?artid=2896730&tool=pmcentrez&rendertype=abstract
http://www.pubmedcentral.nih.gov/articlerender.fcgi?artid=2656412&tool=pmcentrez&rendertype=abstract

138 bibliography
McFarland, T.J., Zhang, Y., Appukuttan, B. and Stout, J.T. (2004). “Gene therapy for proliferative oculardiseases”. Expert Opinion on Biological Therapy 4(7): 1053–1058. (Cited on page 4.)
McIntyre, C.C. and Grill, W.M. (2001). “Finite Element Analysis of the Current-Density and ElectricField Generated by Metal Microelectrodes”. Annals of Biomedical Engineering 29(3): 227–235, URL http://www.springerlink.com/openurl.asp?id=doi:10.1114/1.1352640. (Cited on page 26.)
Mcmahon, M.J., Fine, I., Greenwald, S.H., Horsager, A., Palmer, G., Mech, B.V., Greenberg, R.J. andHumayun, M.S. (2006). “Electrode impedance as a predictor of electrode-retina proximity and perceptualthreshold in a retinal prosthesis”. In “ARVO 2006 Annual Meeting”, Fort Lauderdale, Florida, volume 47,pages 3184–B552, URL http://abstracts.iovs.org/cgi/content/abstract/47/5/3184. (Cited onpages 93 and 104.)
Mercanzini, A., Colin, P., Bensadoun, J.C., Bertsch, A. and Renaud, P. (2009). “In vivo electrical impedancespectroscopy of tissue reaction to microelectrode arrays”. IEEE Transactions on Biomedical Engineering56(7): 1909–1918, URL http://www.ncbi.nlm.nih.gov/pubmed/19362904. (Cited on page 58.)
Merrill, D.R., Bikson, M. and Jefferys, J.G.R. (2005). “Electrical stimulation of excitable tissue: design ofefficacious and safe protocols.” Journal of neuroscience methods 141(2): 171–198, URL http://www.ncbi.nlm.nih.gov/pubmed/15661300. (Cited on pages 39, 49, 90, and 92.)
Metz, S., Bertsch, A., Bertrand, D. and Renaud, P. (2004). “Flexible polyimide probes with microelectrodesand embedded microfluidic channels for simultaneous drug delivery and multi-channel monitoring ofbioelectric activity”. Biosensors & bioelectronics 19(10): 1309–1318, URL http://www.ncbi.nlm.nih.gov/pubmed/15046764. (Cited on pages 57 and 73.)
Miesenböck, G. (2009). “The optogenetic catechism.” Science (New York, N.Y.) 326(5951): 395–399, URLhttp://www.ncbi.nlm.nih.gov/pubmed/19833960. (Cited on pages 21 and 22.)
Miller, G. (2006). “Optogenetics. Shining new light on neural circuits.” Science (New York, N.Y.) 314(5806):1674–1676, URL http://www.ncbi.nlm.nih.gov/pubmed/17170269. (Cited on page 21.)
Minnikanti, S., Cohen, E. and Peixoto, N. (2010). “Quasi-static Analysis of Electric Field Distributionsby Disc Electrodes in a Rabbit Eye Model”. In “26th Southern Biomedical Engineering ConferenceSBEC 2010 April 30-May 2, 2010 College Park, Maryland, USA, IFMBE Proceedings”, SpringerVerlag, volume 32, ISBN 3642149979, pages 385–388, URL http://www.springerlink.com/content/m3kh23120t023147. (Cited on pages 13, 31, and 33.)
Miranda, P.C., Correia, L., Salvador, R. and Basser, P.J. (2007). “Tissue heterogeneity as a mechanism forlocalized neural stimulation by applied electric fields.” Physics in medicine and biology 52(18): 5603–5617,URL http://www.ncbi.nlm.nih.gov/pubmed/17804884. (Cited on pages 13, 33, and 55.)
Mohand-Said, S., Hicks, D., Dreyfus, H. and Sahel, J.A. (2000). “Selective transplantation of rods delayscone loss in a retinitis pigmentosa model”. Archives of Ophthalmology 118(6): 807–811. (Cited on page 5.)
Nagel, G., Szellas, T., Huhn, W., Kateriya, S., Adeishvili, N., Berthold, P., Ollig, D., Hegemann, P.and Bamberg, E. (2003). “Channelrhodopsin-2, a directly light-gated cation-selective membranechannel.” Proceedings of the National Academy of Sciences of the United States of America 100(24):13,940–13,945, URL http://www.pubmedcentral.nih.gov/articlerender.fcgi?artid=283525&tool=pmcentrez&rendertype=abstract. (Cited on page 23.)
Nakauchi, K., Fujikado, T., Kanda, H., Kusaka, S., Ozawa, M., Sakaguchi, H., Ikuno, Y., Kamei, M. andTano, Y. (2007). “Threshold suprachoroidal-transretinal stimulation current resulting in retinal damagein rabbits.” Journal of neural engineering 4(1): S50–S57, URL http://www.ncbi.nlm.nih.gov/pubmed/17325416. (Cited on page 51.)
Newman, J. (1966). “Resistance for Flow of Current to a Disk”. Journal of The Electrochemical Society 113(5):501, URL http://link.aip.org/link/JESOAN/v113/i5/p501/s1&Agg=doi. (Cited on page 129.)
Nunez, P. (1981). Electric fields of the brain: the neurophysics of EEG, volume 35. Oxford UniversityPress, England, Oxford, URL http://scholar.google.com/scholar?hl=en&btnG=Search&q=intitle:Electric+Fields+of+the+Brain:+the+neurophysics+of+EEG#0. (Cited on page 43.)
Ogden, T.E. and Ito, H. (1971). “Avian retina. II. An evaluation of retinal electrical anisotropy.” Journalof neurophysiology 34(3): 367–373, URL http://www.ncbi.nlm.nih.gov/pubmed/5560038. (Cited onpages 55, 65, 66, and 67.)
Palanker, D., Vankov, A., Huie, P. and Baccus, S. (2005). “Design of a high-resolution optoelectronic retinalprosthesis.” Journal of neural engineering 2(1): S105–S120, URL http://www.ncbi.nlm.nih.gov/pubmed/15876646. (Cited on pages 7, 8, 9, 11, 12, 28, 35, 81, 87, and 99.)
Palanker, D., Vankov, A., Huie, P., Butterwick, A., Chan, I., Marmor, M. and Blumenkranz, M. (2007).High-Resolution Opto-Electronic Retinal Prosthesis: Physical Limitations and Design, Springer New York,New York, NY. Biological and Medical Physics, Biomedical Engineering, ISBN 978-0-387-49329-9, pages255–277, URL http://www.springerlink.com/index/10.1007/978-0-387-49331-2. (Cited on pages 12
and 116.)Pauleikhoff, D. (2005). “Neovascular age-related macular degeneration: Natural History and Treatment
Outcomes.” Retina (Philadelphia, Pa.) 25(8): 1065–1084, URL http://www.ncbi.nlm.nih.gov/pubmed/16340538. (Cited on page 4.)

bibliography 139
Peachey, N.S. and Chow, A.Y. (1999). “Subretinal implantation of semiconductor-based photodiodes:progress and challenges.” Journal of rehabilitation research and development 36(4): 371–376, URL http://www.ncbi.nlm.nih.gov/pubmed/10678460. (Cited on page 16.)
Penfield, W. and Jasper, H. (1954). Epilepsy and the functional anatomy of the human brain. Churchill, London,896 pages. (Cited on page 6.)
Perez Fornos, A. (2006). Minimum requirements for a retinal prosthesis to restore useful vision - PhD Thesis. Phdthesis, University of Geneva. (Cited on pages 7, 8, and 78.)
Peterman, M.C., Bloom, D.M., Lee, C., Bent, S.F., Marmor, M.F., Blumenkranz, M.S. and Fishman, H.A.(2003). “Localized neurotransmitter release for use in a prototype retinal interface.” Investigativeophthalmology & visual science 44(7): 3144–3149, URL http://www.ncbi.nlm.nih.gov/pubmed/12824264.(Cited on page 6.)
Petreanu, L., Mao, T., Sternson, S.M. and Svoboda, K. (2009). “The subcellular organization ofneocortical excitatory connections.” Nature 457(7233): 1142–1145, URL http://www.pubmedcentral.nih.gov/articlerender.fcgi?artid=2745650&tool=pmcentrez&rendertype=abstract. (Cited on page 23.)
Plonsey, R. and Heppner, D.B. (1967). “Considerations of quasi-stationarity in electrophysiologicalsystems.” The Bulletin of mathematical biophysics 29(4): 657–664, URL http://www.ncbi.nlm.nih.gov/pubmed/5582145. (Cited on pages 42 and 81.)
Ranck, J.B. (1975). “Which elements are excited in electrical stimulation of mammalian central nervoussystem: a review.” Brain research 98(3): 417–440, URL http://www.ncbi.nlm.nih.gov/pubmed/1102064.(Cited on pages 41, 44, and 45.)
Rattay, F. and Resatz, S. (2004). “Effective electrode configuration for selective stimulation with inner eyeprostheses”. IEEE transactions on bio-medical engineering 51(9): 1659–1664, URL http://www.ncbi.nlm.nih.gov/pubmed/15376514. (Cited on page 25.)
Resatz, S. and Rattay, F. (2003). “Excitability of bipolar and ganglion cells with retinal prosthesis: amodeling study”. In “Proceedings of the 25th Annual International Conference of the IEEE Engineeringin Medicine and Biology Society”, IEEE, ISBN 0-7803-7789-3, pages 2039–2042, URL http://ieeexplore.ieee.org/lpdocs/epic03/wrapper.htm?arnumber=1280136. (Cited on page 52.)
Resatz, S. and Rattay, F. (2004). “A Model for the Electrically Stimulated Retina”. Mathematical and ComputerModelling of Dynamical Systems 10(2): 93–106, URL http://www.informaworld.com/smpp/content~db=all~content=a713682520~frm=abslink. (Cited on pages 14, 24, 35, and 52.)
Richardot, A. and McAdams, E.T. (2002). “Harmonic analysis of low-frequency bioelectrode behavior.” IEEEtransactions on medical imaging 21(6): 604–612, URL http://www.ncbi.nlm.nih.gov/pubmed/12166856.(Cited on page 125.)
Rijkhoff, N.J., Holsheimer, J., Koldewijn, E.L., Struijk, J.J., van Kerrebroeck, P.E., Debruyne, F.M. andWijkstra, H. (1994). “Selective stimulation of sacral nerve roots for bladder control: a study by computermodeling.” IEEE transactions on bio-medical engineering 41(5): 413–424, URL http://www.ncbi.nlm.nih.gov/pubmed/8070800. (Cited on page 44.)
Rizzo, J., Snebold, L. and Kenney, M. (2007). Development of a visual prosthesis, Springer, chapter 6. pages71–93, URL http://www.springerlink.com/index/j558627477nq8126.pdf. (Cited on pages 15 and 18.)
Rizzo, J.F., Wyatt, J., Loewenstein, J., Kelly, S. and Shire, D. (2003). “Perceptual efficacy of electricalstimulation of human retina with a microelectrode array during short-term surgical trials.” Investigativeophthalmology & visual science 44(12): 5362–5369, URL http://www.ncbi.nlm.nih.gov/pubmed/14638739.(Cited on pages 7, 15, and 17.)
Rodieck, R.W. (1973). The Vertebrate Retina: Principles of Structure and Function. W.H.Freeman & Co Ltd(October 24, 1974), ISBN 0716706962, 1044 pages. (Cited on pages 13 and 55.)
Roessler, G., Laube, T., Brockmann, C., Kirschkamp, T., Mazinani, B., Goertz, M., Koch, C., Krisch, I.,Sellhaus, B., Trieu, H.K., Weis, J., Bornfeld, N., Röthgen, H., Messner, A., Mokwa, W. and Walter, P. (2009).“Implantation and explantation of a wireless epiretinal retina implant device: observations during theEPIRET3 prospective clinical trial.” Investigative ophthalmology & visual science 50(6): 3003–3008, URLhttp://www.ncbi.nlm.nih.gov/pubmed/19420330. (Cited on pages 15 and 19.)
Rose, T.L. and Robblee, L.S. (1990). “Electrical stimulation with Pt electrodes VIII Electrochemically safecharge injection limits with 0.2 ms pulses”. IEEE transactions on bio-medical engineering 37(11): 1118–1120,URL http://www.ncbi.nlm.nih.gov/pubmed/2276759. (Cited on page 90.)
Ross, J. (2008). Microstimulation and multicellular analysis: A neural interfacing system for spatiotemporalstimulation. Ph.D. thesis, URL http://smartech.gatech.edu/dspace/handle/1853/24684. (Cited onpage 26.)
Roth, B.J. (1992). “How the anisotropy of the intracellular and extracellular conductivities influencesstimulation of cardiac muscle.” Journal of mathematical biology 30(6): 633–646, URL http://www.ncbi.nlm.nih.gov/pubmed/1640183. (Cited on page 27.)
Rubinstein, J.T., Spelman, F.A., Soma, M. and Suesserman, M.F. (1987). “Current density profiles of surfacemounted and recessed electrodes for neural prostheses.” IEEE transactions on bio-medical engineering34(11): 864–75, URL http://www.ncbi.nlm.nih.gov/pubmed/3319885. (Cited on page 73.)
http://www.pubmedcentral.nih.gov/articlerender.fcgi?artid=2745650&tool=pmcentrez&rendertype=abstract

140 bibliography
Saenz, A. (2010). “Argus III - The Artificial Retina is Near!” URL http://singularityhub.com/2010/02/25/argus-iii-the-artificial-retina-is-near. (Cited on page 19.)
Saigo, Y. (2004). “Transplantation of Transduced Retinal Pigment Epithelium in Rats”. InvestigativeOphthalmology & Visual Science 45(6): 1996–2004, URL http://www.iovs.org/cgi/doi/10.1167/iovs.03-0777. (Cited on page 5.)
Salzmann, J., Linderholm, O.P., Guyomard, J.L., Paques, M., Simonutti, M., Lecchi, M., Sommerhalder, J.,Dubus, E., Pelizzone, M., Bertrand, D., Sahel, J., Renaud, P., Safran, A.B. and Picaud, S. (2006). “Subretinalelectrode implantation in the P23H rat for chronic stimulations.” The British journal of ophthalmology90(9): 1183–1187, URL http://www.ncbi.nlm.nih.gov/pubmed/16754649. (Cited on pages 73, 74, 101,and 105.)
Scanziani, M. and Häusser, M. (2009). “Electrophysiology in the age of light.” Nature 461(7266): 930–939,URL http://www.ncbi.nlm.nih.gov/pubmed/19829373. (Cited on page 21.)
Schiefer, M.A. and Grill, W.M. (2006). “Sites of neuronal excitation by epiretinal electrical stimulation.”IEEE transactions on neural systems and rehabilitation engineering 14(1): 5–13, URL http://www.ncbi.nlm.nih.gov/pubmed/16562626. (Cited on pages 28, 52, and 79.)
Schmidt, E.M., Bak, M.J., Hambrecht, F.T., Kufta, C.V., O’Rourke, D.K. and Vallabhanath, P. (1996).“Feasibility of a visual prosthesis for the blind based on intracortical microstimulation of the visual cortex.”Brain : a journal of neurology 119 ( Pt 2: 507–522, URL http://www.ncbi.nlm.nih.gov/pubmed/8800945.(Cited on page 7.)
Schmidt, S., Cela, C., Singh, V. and Weiland, J. (2008). “Computational Modeling of Electromagneticand Thermal Effects for a Dual-Unit Retinal Prosthesis: Inductive Telemetry, TemperatureIncrease, and Current Densities”. Artificial Sight : 279–305URL http://www.springerlink.com/index/m8655p2068w00wn3.pdf. (Cited on pages 13, 26, 28, 31, 33, and 35.)
Schuettler, M., Franke, M., Krueger, T.B. and Stieglitz, T. (2008). “A voltage-controlled current sourcewith regulated electrode bias-voltage for safe neural stimulation.” Journal of neuroscience methods 171(2):248–252, URL http://www.ncbi.nlm.nih.gov/pubmed/18471890. (Cited on page 46.)
Sekirnjak, C., Hottowy, P., Sher, A., Dabrowski, W., Litke, A.M. and Chichilnisky, E. (2007). ElectricalStimulation of Mammalian Retinal Ganglion Cells Using Dense Arrays of Small-Diameter Electrodes, SpringerNew York, New York, NY. Biological and Medical Physics, Biomedical Engineering, ISBN 978-0-387-49329-9, URL http://www.springerlink.com/index/10.1007/978-0-387-49331-2. (Cited on page 52.)
Sekirnjak, C., Hottowy, P., Sher, A., Dabrowski, W., Litke, A.M. and Chichilnisky, E.J. (2006). “Electricalstimulation of mammalian retinal ganglion cells with multielectrode arrays.” Journal of neurophysiology95(6): 3311–3327, URL http://www.ncbi.nlm.nih.gov/pubmed/16436479. (Cited on pages 47, 74, 87, 91,99, and 107.)
Sekirnjak, C., Hottowy, P., Sher, A., Dabrowski, W., Litke, A.M. and Chichilnisky, E.J. (2008). “High-resolution electrical stimulation of primate retina for epiretinal implant design.” The Journal of neuroscience28(17): 4446–4456, URL http://www.ncbi.nlm.nih.gov/pubmed/18434523. (Cited on page 52.)
Sernagor, E., Eglen, S., Harris, B. and Wong, R. (2006). Retinal development. Cambridge Press, 400 pages.(Cited on page 77.)
Shannon, R.V. (1992). “A model of safe levels for electrical stimulation.” IEEE transactions on bio-medicalengineering 39(4): 424–426, URL http://www.ncbi.nlm.nih.gov/pubmed/1592409. (Cited on page 50.)
Shepherd, R.K., Murray, M.T., Houghton, M.E. and Clark, G.M. (1985). “Scanning electron microscopyof chronically stimulated platinum intracochlear electrodes.” Biomaterials 6(4): 237–242, URL http://www.ncbi.nlm.nih.gov/pubmed/3840392. (Cited on page 73.)
Sieving, P.A. and Steinberg, R.H. (1987). “Proximal retinal contribution to the intraretinal 8-Hz pattern ERGof cat.” Journal of neurophysiology 57(1): 104–120, URL http://www.ncbi.nlm.nih.gov/pubmed/3559667.(Cited on page 66.)
Simpson, J. and Ghovanloo, M. (2007). “An Experimental Study of Voltage, Current, and Charge ControlledStimulation Front-End Circuitry”. In “2007 IEEE International Symposium on Circuits and Systems”,IEEE, ISBN 1-4244-0920-9, pages 325–328, URL http://ieeexplore.ieee.org/lpdocs/epic03/wrapper.htm?arnumber=4252637. (Cited on page 46.)
Singh, V. (2009). Implantable devices for a retinal prosthesis: Design and electromagnetic and thermal effects. Ph.D.thesis, North Carolina State University. (Cited on page 29.)
Smith, F.W., Neuhaus, H.J., Senturia, S.D., Feit, Z., Day, D.R. and Lewis, T.J. (1987). “Electrical conductionin polyimide between 20 and 350° C”. Journal of Electronic Materials 16(1): 93–106, URL http://www.springerlink.com/index/10.1007/BF02667796. (Cited on page 75.)
Stett, A., Barth, W., Weiss, S., Haemmerle, H. and Zrenner, E. (2000). “Electrical multisite stimulation of theisolated chicken retina”. Vision research 40(13): 1785–95, URL http://www.ncbi.nlm.nih.gov/pubmed/10814763. (Cited on pages 99 and 100.)
Stone, J.L., Barlow, W.E., Humayun, M.S., de Juan, E. and Milam, A.H. (1992). “Morphometric analysis ofmacular photoreceptors and ganglion cells in retinas with retinitis pigmentosa.” Archives of ophthalmology110(11): 1634–1639, URL http://www.ncbi.nlm.nih.gov/pubmed/1444925. (Cited on page 6.)

bibliography 141
Suzuki, S., Humayun, M.S., Weiland, J.D., Chen, S.J., Margalit, E., Piyathaisere, D.V. and de Juan, E. (2004).“Comparison of electrical stimulation thresholds in normal and retinal degenerated mouse retina.”Japanese journal of ophthalmology 48(4): 345–349, URL http://www.ncbi.nlm.nih.gov/pubmed/15295659.(Cited on page 51.)
Szobota, S., Gorostiza, P., Del Bene, F., Wyart, C., Fortin, D.L., Kolstad, K.D., Tulyathan, O., Volgraf, M.,Numano, R., Aaron, H.L., Scott, E.K., Kramer, R.H., Flannery, J., Baier, H., Trauner, D. and Isacoff,E.Y. (2007). “Remote control of neuronal activity with a light-gated glutamate receptor.” Neuron 54(4):535–545, URL http://www.ncbi.nlm.nih.gov/pubmed/17521567. (Cited on page 23.)
Tassicker, G.E. (1956). “Preliminary report on a retinal stimulator.” The British journal of physiological optics13(2): 102–105, URL http://www.ncbi.nlm.nih.gov/pubmed/13315967. (Cited on page 6.)
Thomas, B.B., Arai, S., Ikai, Y., Qiu, G., Chen, Z., Aramant, R.B., Sadda, S.R. and Seiler, M.J. (2006). “Retinaltransplants evaluated by optical coherence tomography in photoreceptor degenerate rats.” Journal ofneuroscience methods 151(2): 186–93, URL http://www.ncbi.nlm.nih.gov/pubmed/16129495. (Cited onpage 56.)
Thylefors, B., Negrel, A.D. and Pararajasegaram, R. (1992). “Epidemiologic Aspects of Global BlindnessPrevention”. Current Opinion in Ophthalmology 3(6): 824–834. (Cited on page 3.)
Tsai, D., Morley, J.W., Suaning, G.J. and Lovell, N.H. (2009a). “Direct activation and temporal responseproperties of rabbit retinal ganglion cells following subretinal stimulation.” Journal of neurophysiology102(5): 2982–2993, URL http://www.ncbi.nlm.nih.gov/pubmed/19741103. (Cited on pages 52, 81, 99,100, and 107.)
Tsai, H.C., Zhang, F., Adamantidis, A., Stuber, G.D., Bonci, A., de Lecea, L. and Deisseroth, K. (2009b).“Phasic firing in dopaminergic neurons is sufficient for behavioral conditioning.” Science (New York, N.Y.)324(5930): 1080–1084, URL http://www.ncbi.nlm.nih.gov/pubmed/19389999. (Cited on page 23.)
Urban, H. (1937). “Zur Physiologie der Occipitalregion des Menschen”. Zeitschrift für die gesamte Neurologieund Psychiatrie 158(1): 257–261, URL http://www.springerlink.com/index/10.1007/BF02870737.(Cited on page 6.)
van Kuyck, K., Welkenhuysen, M., Arckens, L., Sciot, R. and Nuttin, B. (2007). “HistologicalAlterations Induced by Electrode Implantation and Electrical Stimulation in the Human Brain: AReview”. Neuromodulation 10(3): 244–261, URL http://www.blackwell-synergy.com/doi/abs/10.1111/j.1525-1403.2007.00114.x. (Cited on page 100.)
Veraart, C., Raftopoulos, C., Mortimer, J.T., Delbeke, J., Pins, D., Michaux, G., Vanlierde, A., Parrini, S.and Wanet-Defalque, M.C. (1998). “Visual sensations produced by optic nerve stimulation using animplanted self-sizing spiral cuff electrode.” Brain research 813(1): 181–186, URL http://www.ncbi.nlm.nih.gov/pubmed/9824694. (Cited on page 7.)
Wee, A.S. (2001). “Anodal excitation of intact peripheral nerves in humans.” Electromyography and clinicalneurophysiology 41(2): 71–77, URL http://www.ncbi.nlm.nih.gov/pubmed/11284058. (Cited on page 44.)
Wee, A.S., Leis, A.A., Kuhn, A.R. and Gilbert, R.W. (2000). “Anodal block: can this occur during routinenerve conduction studies?” Electromyography and clinical neurophysiology 40(7): 387–391, URL http://www.ncbi.nlm.nih.gov/pubmed/11142109. (Cited on page 44.)
Weiland, J.D. and Humayun, M.S. (2005). “A biomimetic retinal stimulating array.” IEEE engineering inmedicine and biology magazine : the quarterly magazine of the Engineering in Medicine & Biology Society 24(5):14–21, URL http://www.ncbi.nlm.nih.gov/pubmed/16248113. (Cited on page 24.)
Weiland, J.D., Humayun, M.S., Dagnelie, G., de Juan, E., Greenberg, R.J. and Iliff, N.T. (1999).“Understanding the origin of visual percepts elicited by electrical stimulation of the human retina.”Graefe’s archive for clinical and experimental ophthalmology 237(12): 1007–1013, URL http://www.ncbi.nlm.nih.gov/pubmed/10654170. (Cited on page 7.)
Weiss, G. (1901). “Sur la possibilite de rendre comparables entre eux les appareils servant al’excitation electrique”. Arch. Ital. Biol. 35: 413–446, URL http://scholar.google.com/scholar?hl=en&btnG=Search&q=intitle:Sur+la+possibilite+de+rendre+comparables+entre+eux+les+appareils+servant+a+l’excitation+electrique#0. (Cited on page 47.)
West, A.C. (1991). “Current Distributions on Recessed Electrodes”. Journal of The Electrochemical Society138(6): 1620–1625, URL http://link.aip.org/link/JESOAN/v138/i6/p1620/s1&Agg=doi. (Cited onpage 73.)
Wiley, J.D. and Webster, J.G. (1982). “Analysis and control of the current distribution under circulardispersive electrodes”. IEEE transactions on bio-medical engineering 29(5): 381–5, URL http://www.ncbi.nlm.nih.gov/pubmed/7084970. (Cited on pages 42 and 73.)
Wilke, R., Greppmaier, U., Harscher, A., Benav, H. and Zrenner, E. (2010a). “Factors Affecting PerceptualThresholds of Subretinal Electric Stimulation in Blind Volunteers”. ARVO Meeting Abstracts 51(5): 2026,URL http://abstracts.iovs.org//cgi/content/abstract/51/5/2026. (Cited on pages 37, 74, 100,and 108.)
Wilke, R.G.H., Moghaddam, G.K., Dokos, S., Suaning, G. and Lovell, N.H. (2010b). Stimulation of theRetinal Network in Bionic Vision Devices: From Multi-Electrode Arrays to Pixelated Vision, Springer Berlin

142 bibliography
/ Heidelberg. pages 140–147, URL http://dx.doi.org/10.1007/978-3-642-17537-4_18DO-10.1007/978-3-642-17537-4_18. (Cited on pages 9, 12, 30, and 115.)
Woch, G., Aramant, R.B., Seiler, M.J., Sagdullaev, B.T. and McCall, M.a. (2001). “Retinal transplants restorevisually evoked responses in rats with photoreceptor degeneration.” Investigative ophthalmology & visualscience 42(7): 1669–76, URL http://www.ncbi.nlm.nih.gov/pubmed/11381076. (Cited on page 5.)
Wu, P., Mehenti, N., Leng, T., Marmor, M., Blumenkranz, M. and Fishman, H. (2003). “Cell Demographicsfrom Full Thickness Retinal Explant Growth on Micropatterned Surfaces”. Investigative Ophtalmology andVisual Science 44(5): 5008, URL http://abstracts.iovs.org/cgi/content/abstract/44/5/5008. (Citedon page 6.)
Xu, X. and Karwoski, C.J. (1994). “Current source density (CSD) analysis of retinal field potentials.I. Methodological considerations and depth profiles.” Journal of neurophysiology 72(1): 84–95, URLhttp://www.ncbi.nlm.nih.gov/pubmed/7965035. (Cited on pages 33 and 56.)
Yagi, T., Kameda, S., Hayashida, Y. and Li, L. (1999). “An artificial retina with adaptive mechanisms and itsapplication to retinal prosthesis”. In “IEEE SMC’99 Conference Proceedings. 1999 IEEE InternationalConference on Systems, Man, and Cybernetics”, IEEE, Kyushu Inst of Technology, Fukuoka, Jpn,volume 4 of Proceedings of the IEEE International Conference on Systems, Man and Cybernetics, ISBN 0-7803-5731-0, pages 418–423, URL http://ieeexplore.ieee.org/lpdocs/epic03/wrapper.htm?arnumber=812440. (Cited on page 6.)
Yanai, D., Weiland, J.D., Mahadevappa, M., Greenberg, R.J., Fine, I. and Humayun, M.S. (2007). “Visualperformance using a retinal prosthesis in three subjects with retinitis pigmentosa.” American journal ofophthalmology 143(5): 820–827, URL http://www.ncbi.nlm.nih.gov/pubmed/17362868. (Cited on pages 7
and 20.)Yang, Y., Mohand-Said, S., Danan, A., Simonutti, M., Fontaine, V., Clerin, E., Picaud, S., Léveillard,
T. and Sahel, J.A. (2009). “Functional cone rescue by RdCVF protein in a dominant modelof retinitis pigmentosa.” Molecular therapy : the journal of the American Society of Gene Therapy17(5): 787–795, URL http://www.pubmedcentral.nih.gov/articlerender.fcgi?artid=2835133&tool=pmcentrez&rendertype=abstract. (Cited on page 24.)
Ye, J.H. and Goo, Y.S. (2007). “Comparison of voltage parameters for the stimulation of normal anddegenerate retina.” Annual International Conference of the IEEE Engineering in Medicine and Biology Society2007: 5783–5786, URL http://www.ncbi.nlm.nih.gov/pubmed/18003327. (Cited on page 51.)
Yin, S., Lovell, N.H., Suaning, G.J. and Dokos, S. (2010). “A continuum model of the retinal network andits response to electrical stimulation.” In “Annual International Conference of the IEEE Engineeringin Medicine and Biology Society”, volume 1, pages 2077–2080, URL http://www.ncbi.nlm.nih.gov/pubmed/21095947. (Cited on page 27.)
Zahn, M. (2003). Electromagnetic Field Theory: A Problem Solving Approach. Krieger Publishing Company,second edition, ISBN 1575242354, 753 pages. (Cited on page 60.)
Zeiss, C.J., Allore, H.G., Towle, V. and Tao, W. (2006). “CNTF induces dose-dependent alterations inretinal morphology in normal and rcd-1 canine retina.” Experimental eye research 82(3): 395–404, URLhttp://www.ncbi.nlm.nih.gov/pubmed/16143329. (Cited on page 4.)
Zhang, F., Prigge, M., Beyrière, F., Tsunoda, S.P., Mattis, J., Yizhar, O., Hegemann, P. and Deisseroth,K. (2008). “Red-shifted optogenetic excitation: a tool for fast neural control derived from Volvoxcarteri.” Nature neuroscience 11(6): 631–633, URL http://www.pubmedcentral.nih.gov/articlerender.fcgi?artid=2692303&tool=pmcentrez&rendertype=abstract. (Cited on page 23.)
Zhang, F., Wang, L.P., Brauner, M., Liewald, J.F., Kay, K., Watzke, N., Wood, P.G., Bamberg, E., Nagel, G.,Gottschalk, A. and Deisseroth, K. (2007). “Multimodal fast optical interrogation of neural circuitry.”Nature 446(7136): 633–639, URL http://www.ncbi.nlm.nih.gov/pubmed/17410168. (Cited on page 23.)
Zhou, D. and Greenberg, R. (2009). Implantable Neural Prostheses 1 - Devices and Applications. Springer, 1–42
pages, URL http://www.springerlink.com/index/t5l7g263u75nm530.pdf. (Cited on pages 8 and 20.)Zhou, J.A., Woo, S.J., Park, S.I., Kim, E.T., Seo, J.M., Chung, H. and Kim, S.J. (2008). “A suprachoroidal
electrical retinal stimulator design for long-term animal experiments and in vivo assessment of itsfeasibility and biocompatibility in rabbits.” Journal of biomedicine & biotechnology 2008: 547,428, URL http://www.ncbi.nlm.nih.gov/pmc/articles/PMC2246081/?tool=pmcentrez&report=abstract. (Cited onpage 7.)
Zibek, S., Hagmeyer, B., Stett, A. and Stelzle, M. (2010). “Chemical stimulation of adherentcells by localized application of acetylcholine from a microfluidic system.” Frontiers inneuroengineering 3: 113, URL http://www.pubmedcentral.nih.gov/articlerender.fcgi?artid=2999818&tool=pmcentrez&rendertype=abstract. (Cited on page 6.)
Ziv, O.R., Rizzo, J.F. and Jensen, R.J. (2005). “In vitro activation of retinal cells: estimating locationof stimulated cell by using a mathematical model.” Journal of neural engineering 2(1): S5–S15, URLhttp://www.ncbi.nlm.nih.gov/pubmed/15876655. (Cited on page 27.)
Zrenner, E. (2002). “The subretinal implant: can microphotodiode arrays replace degenerated retinalphotoreceptors to restore vision?” Ophthalmologica 216 Suppl: 8–20; discussion 52–3, URL http://www.
http://www.pubmedcentral.nih.gov/articlerender.fcgi?artid=2835133&tool=pmcentrez&rendertype=abstract
http://www.pubmedcentral.nih.gov/articlerender.fcgi?artid=2835133&tool=pmcentrez&rendertype=abstract
http://www.pubmedcentral.nih.gov/articlerender.fcgi?artid=2692303&tool=pmcentrez&rendertype=abstract
http://www.pubmedcentral.nih.gov/articlerender.fcgi?artid=2692303&tool=pmcentrez&rendertype=abstract
http://www.pubmedcentral.nih.gov/articlerender.fcgi?artid=2999818&tool=pmcentrez&rendertype=abstract

bibliography 143
ncbi.nlm.nih.gov/pubmed/12207119. (Cited on page 26.)Zrenner, E., Bartz-Schmidt, K.U., Benav, H., Besch, D., Bruckmann, A., Gabel, V.P., Gekeler, F., Greppmaier,
U., Harscher, A., Kibbel, S., Koch, J., Kusnyerik, A., Peters, T., Stingl, K., Sachs, H., Stett, A., Szurman,P., Wilhelm, B. and Wilke, R. (2010). “Subretinal electronic chips allow blind patients to read lettersand combine them to words”. Proceedings of the Royal Society B: Biological Sciences URL http://rspb.royalsocietypublishing.org/cgi/doi/10.1098/rspb.2010.1747. (Cited on pages 7, 15, 17, and 18.)


colophon
This thesis was typeset with LATEX 2ε using Hermann Zapf’s Palatino and Euler type
faces (Type 1 PostScript fonts URW Palladio L and FPL were used).
The typographic style was inspired by Bringhurst and Marks’s genius as presented in
The Elements of Typographic Style [Bringhurst and Marks 2002]. It is available for LATEX
via CTAN as “classicthesis”.

Curriculum Vitae
Harsha Kasi
EDUCATION
Doctor of Philosophy, Microtechnology and Microsystems 2006 – 2011
Swiss Federal Institute of Technology (EPF Lausanne)
Lausanne, Switzerland
• Research Assistant in the Microsystems Laboratory (advisor: Prof. Philippe
Renaud)
• Thesis title: Analysis of factors affecting the performance of retinal prostheses
using finite element modelling and simulation of electric field distribution in the
retina
Master of Science, Micro and Nano Technology October 2004 – February 2006
Institute of Microtechnology (EPF Lausanne)
Neuchâtel, Switzerland
• Master Thesis: Microfabrication and characterisation of a novel DNA hybridisation
reaction chamber
• Semester Project 1: Electrical characterisation of cell membrane support chips
• Semester Project 2: Optical demultiplexer using diffractive lens – Theoretical
analysis
PROFESSIONAL EXPERIENCE
Software Intern July 2005 – September 2005
EM Microelectronic (a Swatch Group Ltd. company)
Marin, Switzerland
• Developed a customised interactive Result Viewing Environment (RVE) in
TCL/TK • The tool was deployed at the EM offices in Czech Republic and
USA

Software Engineer February 2003 – June 2004
SoCrates Software India Pvt. Ltd. (A Toshiba Group Company)
Bengaluru, India
• Led two members of the product validation team, who were supervised and
guided in daily tasks
Associate Software Engineer August 2002 – February 2003
SoCrates Software India Pvt. Ltd. (A Toshiba Group Company)
Bengaluru, India
• Implemented a Sub-band coding standard for Audio in C language
SKILLS
Microfabrication & laboratory techniques : Polyimide-based flexible implants, impedance
spectroscopy, MEMS characterisation, basic dissection (retina extraction) Programming
Languages : TCL/TK, C/C++, Scripting in Linux, Perl, Java
Simulation/analysis Software : Matlab® & Simulink®, Mathematica®, PSpice®,
MapleTM, Origin®, Comsol Multiphysics® (FEMLAB)
Design (CAD) Software : Solidworks®, Clewin
Operating Systems : Macintosh OSX, Linux, Solaris®, MS Windows®
Spoken Languages : English (Fluent), French (Advanced), German (Beginner), Hindi
(Fluent)
CERTIFICATIONS
Swiss Animal Experimentation Certificate May 2007 - July 2008
French Language Participation Certificate July 2004 - September 2004
SCHOLARSHIPS AND AWARDS
Doctoral research scholarship November 2006 – December 2010
Jointly by Swiss National Science Foundation and Swiss Federal Institute of Technology
(EPF/ETH Lausanne)
Top 10 finalists July 2010
IEEE Change the World Competition
Graduate research scholarship Oct. 2004 – Dec. 2005

Jointly by IMT and University of Neuchâtel to pursue master studies at Neuchâtel
Ranked fourth in the University 2003
Bachelor studies, amongst more than 100 colleges and at least 4000 students
Award for Best Achiever and Academic Excellence 2001 - 2002
During Bachelor studies at M. S. Ramaiah Institute of Technology
PUBLICATIONS/CONFERENCES
Publications
1. Simulation of epiretinal prostheses – Evaluation of geometrical factors affecting
stimulation thresholds - Kasi H. et al., Accepted by the Journal of NeuroEngineering
and Rehabilitation, 2011
2. Simulations to study spatial extent of stimulation and effect of electrode–tissue gap
in subretinal implants - Kasi H. et al., Medical Engineering & Physics, 2011 (in Press)
3. Direct localised measurement of electrical resistivity profile in rat and embryonic
chick retinas using a microprobe - Kasi H. et al. , Journal of Electrical Bioimpedance,
2010
4. Distinguishing drug-induced minor morphological changes from major cellular
damage via label-free impedimetric toxicity screening - Meissner R., Eker B., Kasi H. et
al. , Lab Chip, 2011
Conference Proceedings
1. A new flexible microfabricated polyimide-based platinum electrodes for stimulation
of rat retinal tissue in vitro and recording using a multi-electrode array - Kasi H. et al.,
Proceedings of the 12th International Conference on Miniaturised Systems for Chemistry
and Life Sciences, San Diego, 2008
2. Modelling and microfabrication of a polyimide-based 3D tissue coupled electrodes
for electrical stimulation in the chick retina - Kasi H. et al., USGEB, Lausanne, 2008
3. Retinal Prosthesis: Testing Prototypes on a Dystrophic Rat Retina, Salzmann J.,
Guyomard J.-L., Linderholm P., Kolomiets B., H. Kasi et al., European Conference on
Circuit Theory and Design, 2007