Recycling food packaging & food waste in plastics revolution
1
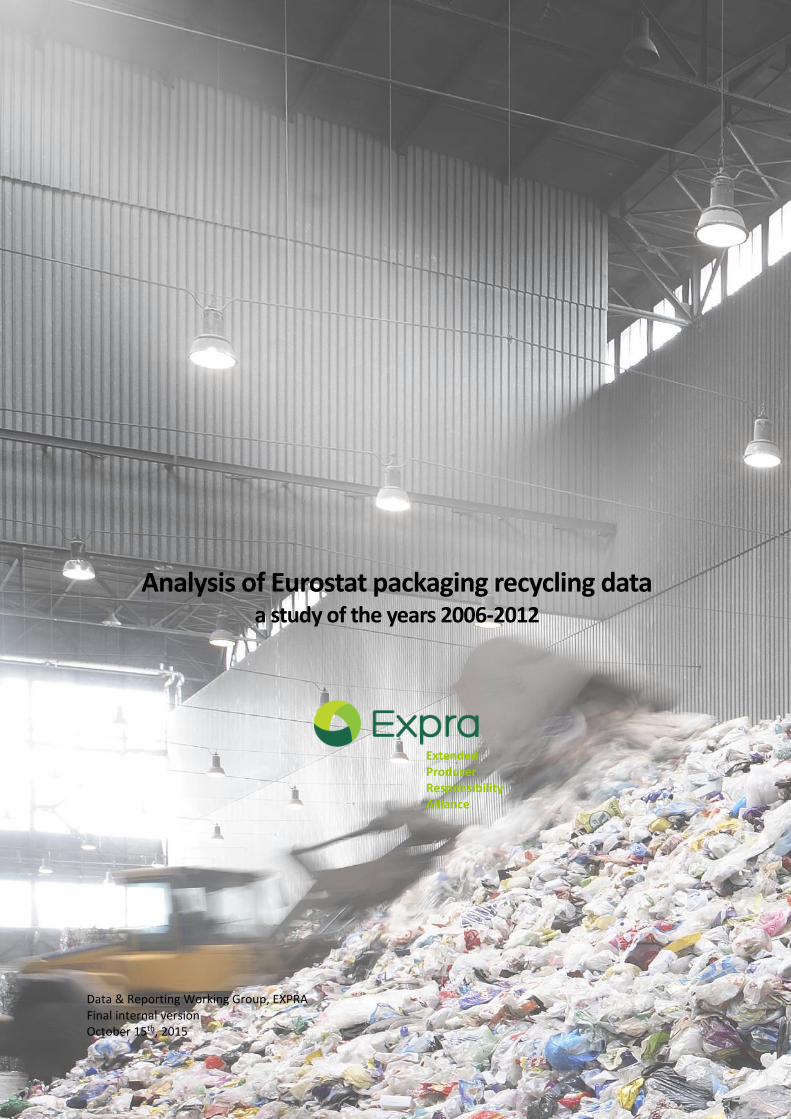
Analysis of Eurostat packaging recycling data a study of the years 2006-2012
Extended Producer Responsibility Alliance
Data & Reporting Working Group, EXPRA Final internal version October 15th, 2015
2
Colophon
Title Analysis of Eurostat packaging recycling data: a study of the years 2006-2012
Principal Extended Producer Responsibility Alliance (EXPRA) Avenue des Olympiades 2 1140 Brussels (Evere) Belgium
Project of Data & Reporting Working Group of EXPRA
Author Paul Christiaens MSc
Version/status 1.0 (Publication)
Date October 15th, 2015
EU transparency number 382147211686-77
3
Table of Contents 1. Management Summary ................................................................................................................................. 4
2. Introduction ................................................................................................................................................... 5
3. Methodology ................................................................................................................................................. 6
3.1 Discussion ................................................................................................................................................... 7
4. Packaging on the market (generated packaging waste) ................................................................................. 9
4.1 Reporting of the exact same data as the previous year or missing data .................................................. 10
4.2 Relative year-to-year development .......................................................................................................... 10
4.3 Correlation-analysis for per capita consumption ..................................................................................... 11
4.4 Conclusion about waste generation (packaging consumption) ................................................................ 12
5. Recycling ...................................................................................................................................................... 14
5.1 Reporting of the exact same data as the previous year or missing data .................................................. 15
5.2 Relative year-to-year development .......................................................................................................... 15
5.3 Conclusion about packaging waste recycling............................................................................................ 16
6. Recycling rates ............................................................................................................................................. 18
6.1 Reporting of the exact same data as the previous year or missing data .................................................. 19
6.2 Relative year-to-year development .......................................................................................................... 19
6.3 Recycling rates above reasonability .......................................................................................................... 20
6.4 Conclusion about packaging recycling rate............................................................................................... 20
7. General conclusions and recommendations for further research ................................................................. 22
7.1 Description of the study ................................................................................................................................... 22
7.2 Conclusions ....................................................................................................................................................... 22
7.3 Recommendations for further research ........................................................................................................... 23
Appendix 1: Analysis tables for packaging on the market (generated packaging waste) ..................................... 25
Appendix 2: Analysis tables for packaging waste recycling .................................................................................. 31
Appendix 3: Analysis tables for packaging recycling rates ................................................................................... 34
4
1. Management Summary According to EU directive 94/62/EC of 20 December 1994 on packaging and packaging waste (in short: PPWD), EU Member States have to reach certain levels of packaging recycling. The recycling targets that were defined in 1994, were changed in 2004. Member states have to hand in reports on recycling as communicated in Commission Decision 2005/270 EC. After approval, the results of the Member States are published in Eurostat, European statistical office of the European Union. In recent discussions and documents1 that contribute to the change of European regulation for packaging and packaging waste, it was often mentioned that the reliability of statistics is not sufficient. In the same process, the European Commission has concluded that all member states have reached the European recycling targets for packaging waste. As the above statements are contradictory, the statistics are further analysed by EXPRA. The methodology and the results of the study are mentioned in this document. The report describes the results of a study of statistics on packaging and packaging waste of 28 EU Member States or EFTA members2, as published by the European Commission on the Eurostat website. The countries in the study were selected based on the availability of statistics for a longer period, from 2006 until 2012. The study that forms the basis of this report is purely theoretical, focuses on quantitative aspects. Country specific elements and qualitative elements are not taken into account. Within the study, statistics on three elements are analysed separately:
- Packaging on the market (as an indicator of total packaging waste)
- Packaging waste recycling
- Packaging recycling rates Each of the elements are analysed for their consistency, variability and plausibility. The outline of the study can be found in the table below. Table 1: Outline of the study on packaging and packaging waste statistics within Europe
Sort of analysis Special action
Packaging on the market
Packaging waste recycling
Packaging waste recycling rate
Reporting of the exact same data as the previous year or missing data
Each event is earmarked
x x x
Relative year-to-year development Changes > 10% are earmarked
x x x
Relative year-to-year development Extreme results are earmarked
x x x
Correlation-analysis for per capita consumption
If correlation, outliers are earmarked
x
Level of recycling rate above reasonability
Each event is earmarked
x
The main conclusion is that, looking at the time frame from 2006 until 2012, the data of the studied countries vary in consistency. The level of variation in consistency is so large, that it is premature to say that all statistics are proven to be complete, accurate and reliable and to conclude that all EU member states have reached the EU targets for the recycling of packaging waste. In order to do so, more analysis is needed. This analysis should focus on country measures in order to achieve complete, accurate and reliable statistics and tackle key topics such as free riders, the use of research results and estimates, mixing of packaging waste and double counting of packaging waste recycling.
1 Including reports and statements made or commissioned by the EC 2 Austria, Belgium, Bulgaria, Cyprus, Czech Republic, Denmark, Estonia, Finland, France, Germany, Greece, Hungary, Ireland, Italy, Latvia, Lithuania, Luxembourg, Malta, the Netherlands, Norway, Poland, Portugal, Romania, Slovakia, Slovenia, Spain, Sweden, United Kingdom.
5
2. Introduction According to EU directive 94/62/EC of 20 December 1994 on packaging and packaging waste (in short: PPWD), EU member states have to reach certain levels of packaging recycling. The recycling targets that were defined in 1994, were changed in 2004. Member states have to hand in reports on recycling as communicated in Commission Decision 2005/270 EC. After approval, the results of the Member States are published in Eurostat, European statistical office of the European Union. As part of a periodical review and to harmonize with other waste directives, the PPWD is in a phase of revision and renewal. The European Commission has commissioned various studies and consultations. Regarding the statistics on packaging waste recycling, the following conclusions were drawn:
1. Improving the quality and validity of the reported statistics is one of the key priorities identified by the vast majority of stakeholders. The same need was written in the conclusion of the fitness check that was performed for the European Commission.
2. The European Commission concludes that recovery and recycling targets set out in the Directive have been met by nearly all MS, with a significant increase over the past 15 years (e.g. packaging waste recovery rates increased from 53.7% in 1998 (EU15) to 77.3% in 2011 (EU27) and recycling rates from 47.3% to 63.6%)3.
The same two conclusions were drawn in the Waste Fitness Check, performed by BIO IS et al: “recycling and recovery targets have generally been met, but some uncertainty exists about the accuracy of the reported data”4. Consequently, if the first of the above conclusions is true (so data are not reliable enough), the second conclusion (all Member States have reached the targets) cannot be drawn with certainty. Moreover, if there is uncertainty about the results of the member states, it cannot be analysed if future targets are realistic. The conclusion about the quality and validity of reported statistics is merely based on general opinions, although there is some basic statistical proof. In a previous publication of EXPRA5, it was shown that in some member states, municipal waste recycling is quite low compared with the level of packaging waste recycling (which consists typically for about 50% of packaging waste arising in municipalities). Until now, no further research reports were found. The underlying document gives additional insight on the quality of the packaging and packaging waste statistics that EU Member States have reported to the European Commission (EC) and that were approved of by the EC.
3 Commission Staff Working Document – Impact Assessment accompanying the document “Proposal for a DIRECTIVE OF THE EUROPEAN PARLIAMENT AND OF THE COUNCIL”, page 15 (part of the withdrawn Circular Economy Package) 4 Ex-post evaluation of certain waste stream Directives, final report, page 7. BIO IS, Arcadis, Institute for European Environmental Policy, 18 April 2014 5 The effects of the proposed EU packaging waste policy on waste management practice - a feasibility study. EXPRA, 2 October 2014
6
3. Methodology The recycling rate of packaging waste is generally calculated the weight of recycled packaging waste by the weight of total packaging waste. To measure the weight of packaging waste, a detailed analysis of separately collected waste, packaging in solid waste and packaging in litter would have to be available. Especially the latter two elements are not widely available, therefore it is accepted to calculate the weight of packaging waste by measuring packaging that was brought onto the market. In short: the report describes the analysis of the following three factors:
1. Packaging waste arising, commonly calculated for as the weight of packaging on the market
2. The weight of packaging waste recycling
3. The packaging waste recycling rate: packaging waste recycling divided by packaging on the market In order to be able to have a representative analysis, the above data of the years 2006 until 2012 were taken from the Eurostat database for 28 countries who are EU Member States or EFTA members6. The period for which data is available for almost all countries is 2006 until 2012. The last year with available data is 2012. After a preliminary description of the data (including average and dispersion), the above data were analysed for consistency and plausibility. The exact elements are mentioned in the table below and explained later in this chapter. The table shows the sort of analysis that was performed, and on which of the three factors. Table 2: elements of the analysis
Sort of analysis Special action
Packaging on the market
Packaging waste recycling
Packaging waste recycling rate
Reporting of the exact same data as the previous year or missing data
Each event is earmarked
x x x
Relative year-to-year development Changes > 10% are earmarked
x x x
Relative year-to-year development Extreme results are earmarked
x x x
Correlation-analysis for per capita consumption
If correlation, outliers are earmarked
x
Level of recycling rate above reasonability
Each event is earmarked
x
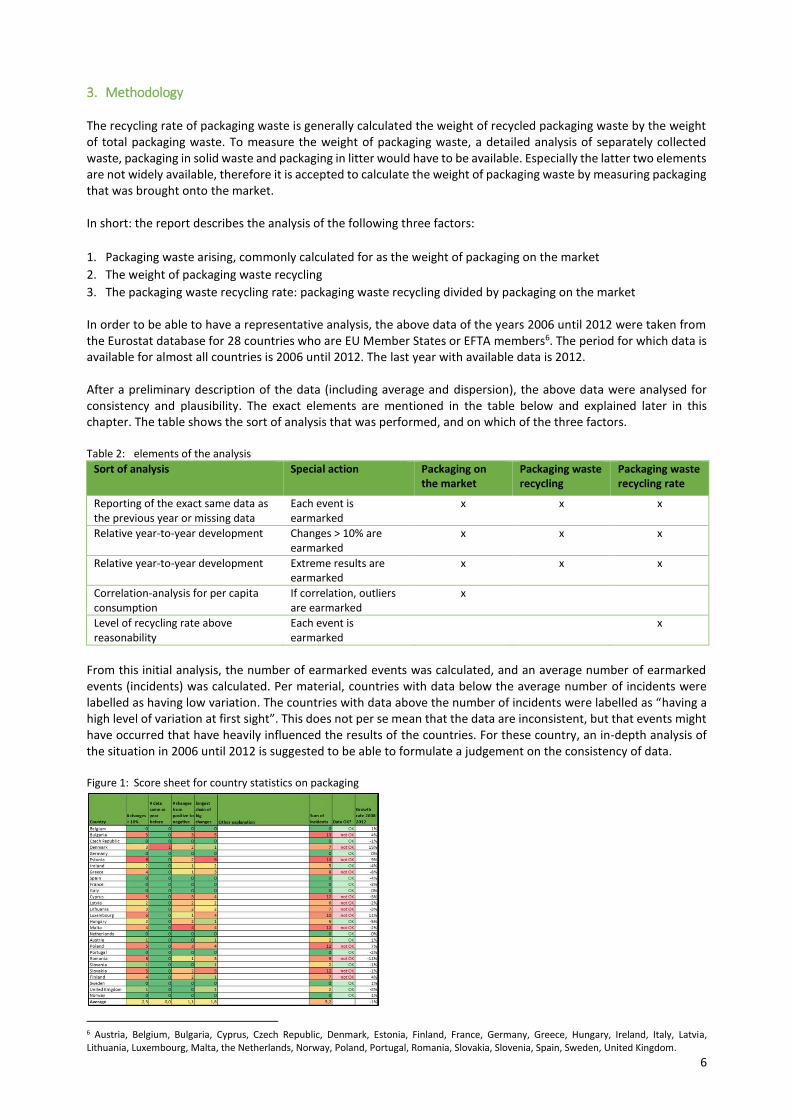
From this initial analysis, the number of earmarked events was calculated, and an average number of earmarked events (incidents) was calculated. Per material, countries with data below the average number of incidents were labelled as having low variation. The countries with data above the number of incidents were labelled as “having a high level of variation at first sight”. This does not per se mean that the data are inconsistent, but that events might have occurred that have heavily influenced the results of the countries. For these country, an in-depth analysis of the situation in 2006 until 2012 is suggested to be able to formulate a judgement on the consistency of data. Figure 1: Score sheet for country statistics on packaging
6 Austria, Belgium, Bulgaria, Cyprus, Czech Republic, Denmark, Estonia, Finland, France, Germany, Greece, Hungary, Ireland, Italy, Latvia, Lithuania, Luxembourg, Malta, the Netherlands, Norway, Poland, Portugal, Romania, Slovakia, Slovenia, Spain, Sweden, United Kingdom.
7
For each of the materials, the countries with plausible statistics are further taken into account and the average recycling percentage of the top 5 performers in 2012 is calculated. This percentage is defined as a realistic representation of actual performance of member states.
3.1 Discussion In this section, reasoning is provided for some of the elements that were used in the analysis.
Reporting of the exact same data as the previous year or missing data It can happen that a member state reports the same data as in the previous year, or that its data is missing. The change of this occurrence is so small (especially the chance that all data are identical the data of the year before) that the occurrence is the result of absence of reliable data in the current year. It is therefore justified to earmark each of such an occurrence.
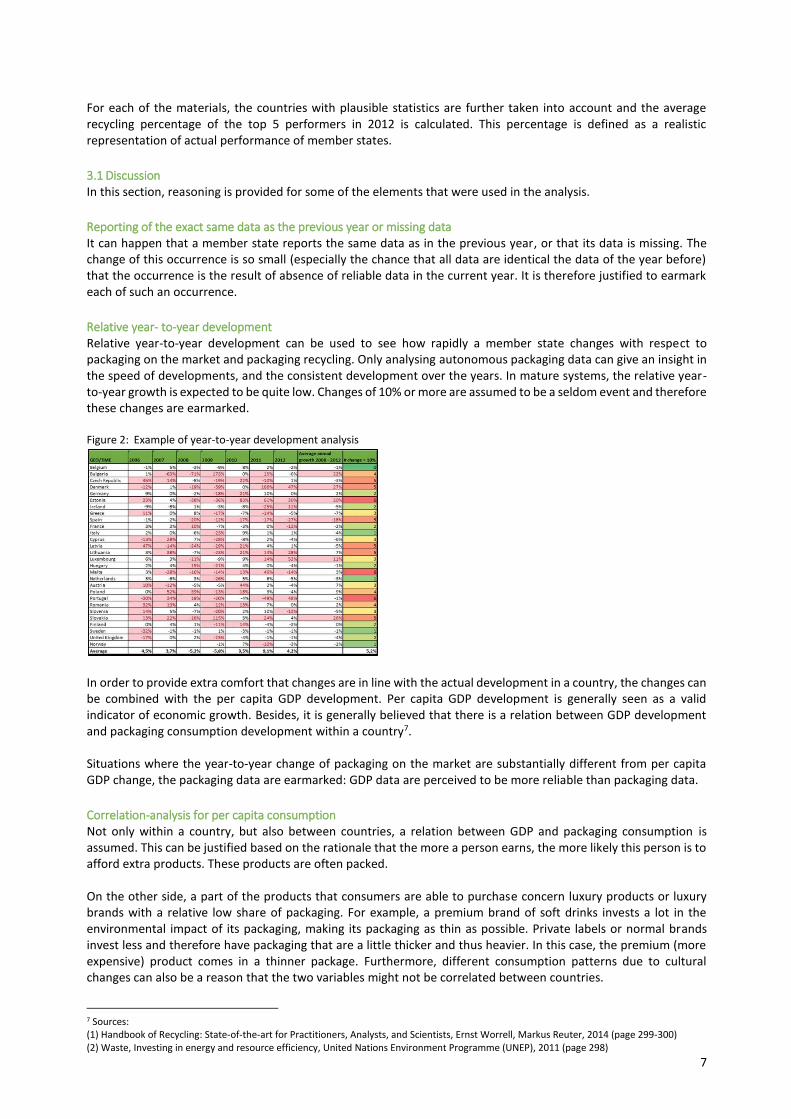
Relative year- to-year development Relative year-to-year development can be used to see how rapidly a member state changes with respect to packaging on the market and packaging recycling. Only analysing autonomous packaging data can give an insight in the speed of developments, and the consistent development over the years. In mature systems, the relative year-to-year growth is expected to be quite low. Changes of 10% or more are assumed to be a seldom event and therefore these changes are earmarked. Figure 2: Example of year-to-year development analysis
In order to provide extra comfort that changes are in line with the actual development in a country, the changes can be combined with the per capita GDP development. Per capita GDP development is generally seen as a valid indicator of economic growth. Besides, it is generally believed that there is a relation between GDP development and packaging consumption development within a country7. Situations where the year-to-year change of packaging on the market are substantially different from per capita GDP change, the packaging data are earmarked: GDP data are perceived to be more reliable than packaging data.
Correlation-analysis for per capita consumption Not only within a country, but also between countries, a relation between GDP and packaging consumption is assumed. This can be justified based on the rationale that the more a person earns, the more likely this person is to afford extra products. These products are often packed. On the other side, a part of the products that consumers are able to purchase concern luxury products or luxury brands with a relative low share of packaging. For example, a premium brand of soft drinks invests a lot in the environmental impact of its packaging, making its packaging as thin as possible. Private labels or normal brands invest less and therefore have packaging that are a little thicker and thus heavier. In this case, the premium (more expensive) product comes in a thinner package. Furthermore, different consumption patterns due to cultural changes can also be a reason that the two variables might not be correlated between countries.
7 Sources: (1) Handbook of Recycling: State-of-the-art for Practitioners, Analysts, and Scientists, Ernst Worrell, Markus Reuter, 2014 (page 299-300) (2) Waste, Investing in energy and resource efficiency, United Nations Environment Programme (UNEP), 2011 (page 298)
8
As the correlation between income and packaging consumption is a topic for a separate study, correlation is largely omitted in this study. Only if a country is an extreme outlier in the numerical correlation analysis, this country is “unofficially” earmarked. Furthermore, if correlation is low and packaging consumption figures of the different member states differ significantly, there might be a reason for further analysis. In this case, either data quality could differ greatly between the various countries, or behaviour towards using the packaging material differs a lot.
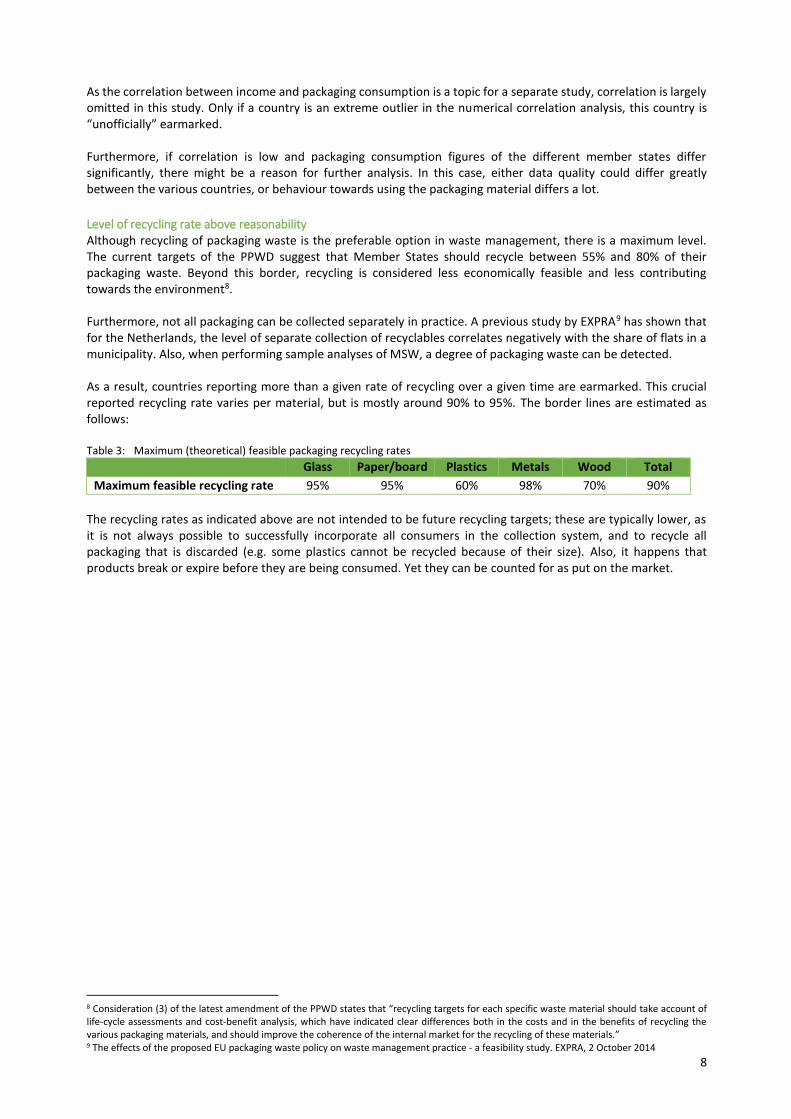
Level of recycling rate above reasonability Although recycling of packaging waste is the preferable option in waste management, there is a maximum level. The current targets of the PPWD suggest that Member States should recycle between 55% and 80% of their packaging waste. Beyond this border, recycling is considered less economically feasible and less contributing towards the environment8. Furthermore, not all packaging can be collected separately in practice. A previous study by EXPRA9 has shown that for the Netherlands, the level of separate collection of recyclables correlates negatively with the share of flats in a municipality. Also, when performing sample analyses of MSW, a degree of packaging waste can be detected. As a result, countries reporting more than a given rate of recycling over a given time are earmarked. This crucial reported recycling rate varies per material, but is mostly around 90% to 95%. The border lines are estimated as follows: Table 3: Maximum (theoretical) feasible packaging recycling rates
Glass Paper/board Plastics Metals Wood Total
Maximum feasible recycling rate 95% 95% 60% 98% 70% 90%
The recycling rates as indicated above are not intended to be future recycling targets; these are typically lower, as it is not always possible to successfully incorporate all consumers in the collection system, and to recycle all packaging that is discarded (e.g. some plastics cannot be recycled because of their size). Also, it happens that products break or expire before they are being consumed. Yet they can be counted for as put on the market.
8 Consideration (3) of the latest amendment of the PPWD states that “recycling targets for each specific waste material should take account of life-cycle assessments and cost-benefit analysis, which have indicated clear differences both in the costs and in the benefits of recycling the various packaging materials, and should improve the coherence of the internal market for the recycling of these materials.” 9 The effects of the proposed EU packaging waste policy on waste management practice - a feasibility study. EXPRA, 2 October 2014
9
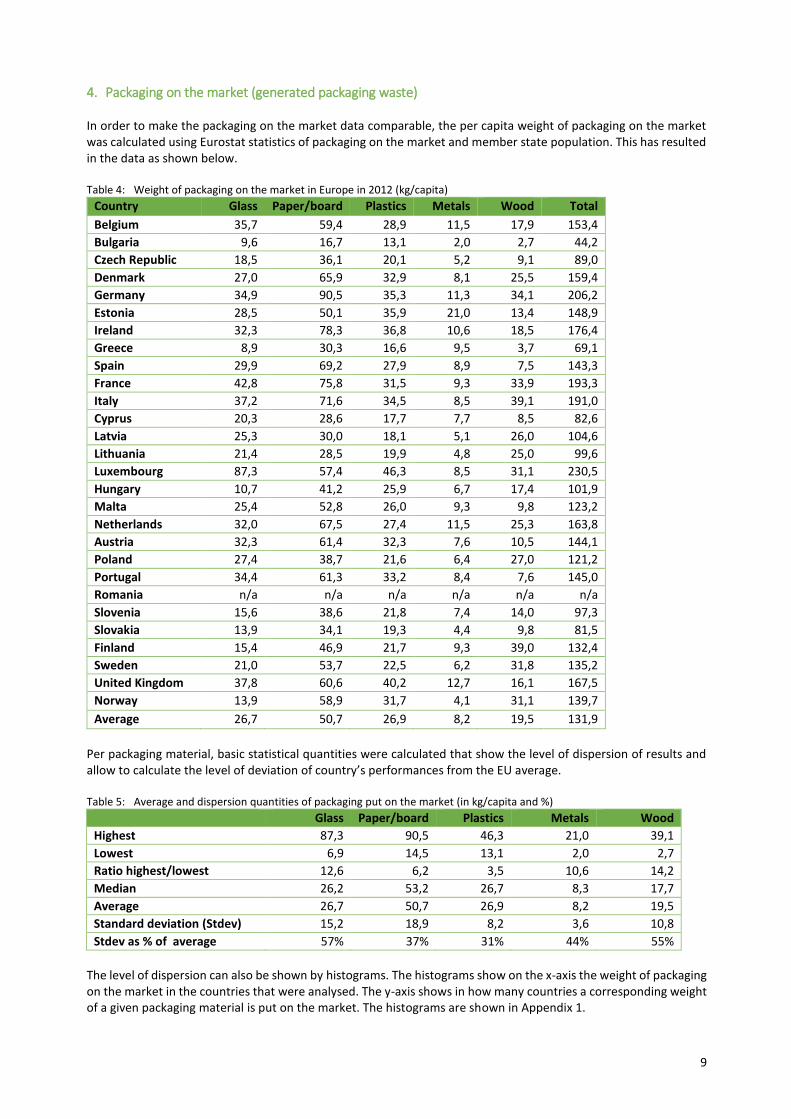
4. Packaging on the market (generated packaging waste) In order to make the packaging on the market data comparable, the per capita weight of packaging on the market was calculated using Eurostat statistics of packaging on the market and member state population. This has resulted in the data as shown below. Table 4: Weight of packaging on the market in Europe in 2012 (kg/capita)
Country Glass Paper/board Plastics Metals Wood Total
Belgium 35,7 59,4 28,9 11,5 17,9 153,4
Bulgaria 9,6 16,7 13,1 2,0 2,7 44,2
Czech Republic 18,5 36,1 20,1 5,2 9,1 89,0
Denmark 27,0 65,9 32,9 8,1 25,5 159,4
Germany 34,9 90,5 35,3 11,3 34,1 206,2
Estonia 28,5 50,1 35,9 21,0 13,4 148,9
Ireland 32,3 78,3 36,8 10,6 18,5 176,4
Greece 8,9 30,3 16,6 9,5 3,7 69,1
Spain 29,9 69,2 27,9 8,9 7,5 143,3
France 42,8 75,8 31,5 9,3 33,9 193,3
Italy 37,2 71,6 34,5 8,5 39,1 191,0
Cyprus 20,3 28,6 17,7 7,7 8,5 82,6
Latvia 25,3 30,0 18,1 5,1 26,0 104,6
Lithuania 21,4 28,5 19,9 4,8 25,0 99,6
Luxembourg 87,3 57,4 46,3 8,5 31,1 230,5
Hungary 10,7 41,2 25,9 6,7 17,4 101,9
Malta 25,4 52,8 26,0 9,3 9,8 123,2
Netherlands 32,0 67,5 27,4 11,5 25,3 163,8
Austria 32,3 61,4 32,3 7,6 10,5 144,1
Poland 27,4 38,7 21,6 6,4 27,0 121,2
Portugal 34,4 61,3 33,2 8,4 7,6 145,0
Romania n/a n/a n/a n/a n/a n/a
Slovenia 15,6 38,6 21,8 7,4 14,0 97,3
Slovakia 13,9 34,1 19,3 4,4 9,8 81,5
Finland 15,4 46,9 21,7 9,3 39,0 132,4
Sweden 21,0 53,7 22,5 6,2 31,8 135,2
United Kingdom 37,8 60,6 40,2 12,7 16,1 167,5
Norway 13,9 58,9 31,7 4,1 31,1 139,7
Average 26,7 50,7 26,9 8,2 19,5 131,9
Per packaging material, basic statistical quantities were calculated that show the level of dispersion of results and allow to calculate the level of deviation of country’s performances from the EU average. Table 5: Average and dispersion quantities of packaging put on the market (in kg/capita and %)
Glass Paper/board Plastics Metals Wood
Highest 87,3 90,5 46,3 21,0 39,1
Lowest 6,9 14,5 13,1 2,0 2,7
Ratio highest/lowest 12,6 6,2 3,5 10,6 14,2
Median 26,2 53,2 26,7 8,3 17,7
Average 26,7 50,7 26,9 8,2 19,5
Standard deviation (Stdev) 15,2 18,9 8,2 3,6 10,8
Stdev as % of average 57% 37% 31% 44% 55%
The level of dispersion can also be shown by histograms. The histograms show on the x-axis the weight of packaging on the market in the countries that were analysed. The y-axis shows in how many countries a corresponding weight of a given packaging material is put on the market. The histograms are shown in Appendix 1.
10
From both table 5 and the figures from Appendix 1 can be concluded that the results are quite dispersed for paper/board and wood. The results for glass seem quite dispersed based on the table, but as can be derived from the histogram in Appendix 1, there is an outlier with an extreme high value. All outliers are mentioned in Appendix 1 and earmarked.
4.1 Reporting of the exact same data as the previous year or missing data Denmark and Romania have reported the same weight as the year before or missing data in (resp. 2010 and 2012).
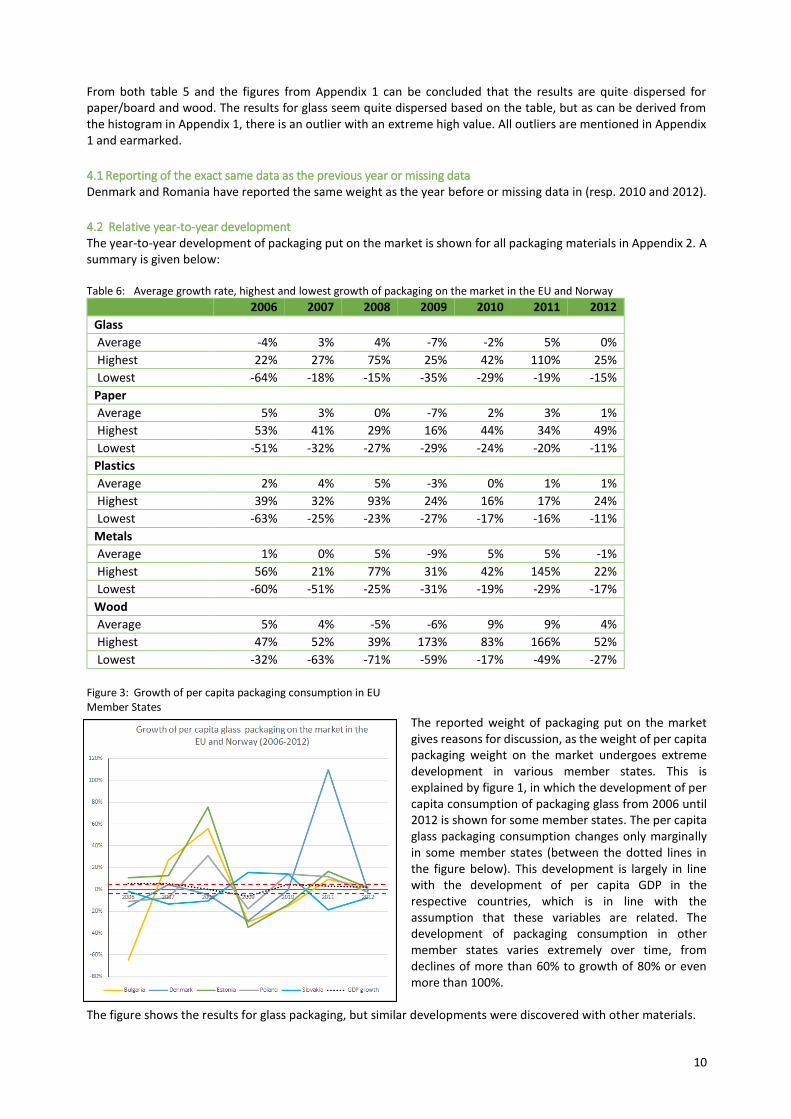
4.2 Relative year-to-year development The year-to-year development of packaging put on the market is shown for all packaging materials in Appendix 2. A summary is given below: Table 6: Average growth rate, highest and lowest growth of packaging on the market in the EU and Norway
2006 2007 2008 2009 2010 2011 2012
Glass
Average -4% 3% 4% -7% -2% 5% 0%
Highest 22% 27% 75% 25% 42% 110% 25%
Lowest -64% -18% -15% -35% -29% -19% -15%
Paper
Average 5% 3% 0% -7% 2% 3% 1%
Highest 53% 41% 29% 16% 44% 34% 49%
Lowest -51% -32% -27% -29% -24% -20% -11%
Plastics
Average 2% 4% 5% -3% 0% 1% 1%
Highest 39% 32% 93% 24% 16% 17% 24%
Lowest -63% -25% -23% -27% -17% -16% -11%
Metals
Average 1% 0% 5% -9% 5% 5% -1%
Highest 56% 21% 77% 31% 42% 145% 22%
Lowest -60% -51% -25% -31% -19% -29% -17%
Wood
Average 5% 4% -5% -6% 9% 9% 4%
Highest 47% 52% 39% 173% 83% 166% 52%
Lowest -32% -63% -71% -59% -17% -49% -27%
Figure 3: Growth of per capita packaging consumption in EU Member States
The reported weight of packaging put on the market gives reasons for discussion, as the weight of per capita packaging weight on the market undergoes extreme development in various member states. This is explained by figure 1, in which the development of per capita consumption of packaging glass from 2006 until 2012 is shown for some member states. The per capita glass packaging consumption changes only marginally in some member states (between the dotted lines in the figure below). This development is largely in line with the development of per capita GDP in the respective countries, which is in line with the assumption that these variables are related. The development of packaging consumption in other member states varies extremely over time, from declines of more than 60% to growth of 80% or even more than 100%.
The figure shows the results for glass packaging, but similar developments were discovered with other materials.

11
Based on the results, the basic pattern can be observed that many traditional EU member states show a limited growth or decline in the per capita weight of packaging on the market, and the largest growth or decline rates are to be seen in the relatively new EU member states and member states without producer responsibility. The difference in the level of variance in the year-to-year growth between the two groups is remarkable and suggests that further analysis is necessary to verify the quality of the data and possible reasons for extreme growth or decline.
4.3 Correlation-analysis for per capita consumption The correlation between GDP and for all packaging is shown in the figure below. The correlation figures for all materials are presented in Appendix 2. In general, there seems to be a reasonable correlation between GDP per capita and packaging consumption per capita. In general, it is shown that the higher the GDP per capita is in a country, the more packaging is consumed. This is especially the case when looking at the total weight of all packaging materials, and the packaging materials glass, paper/board and plastics. Figure 4: Correlation between GDP/capita and packaging consumption/capita (all materials)
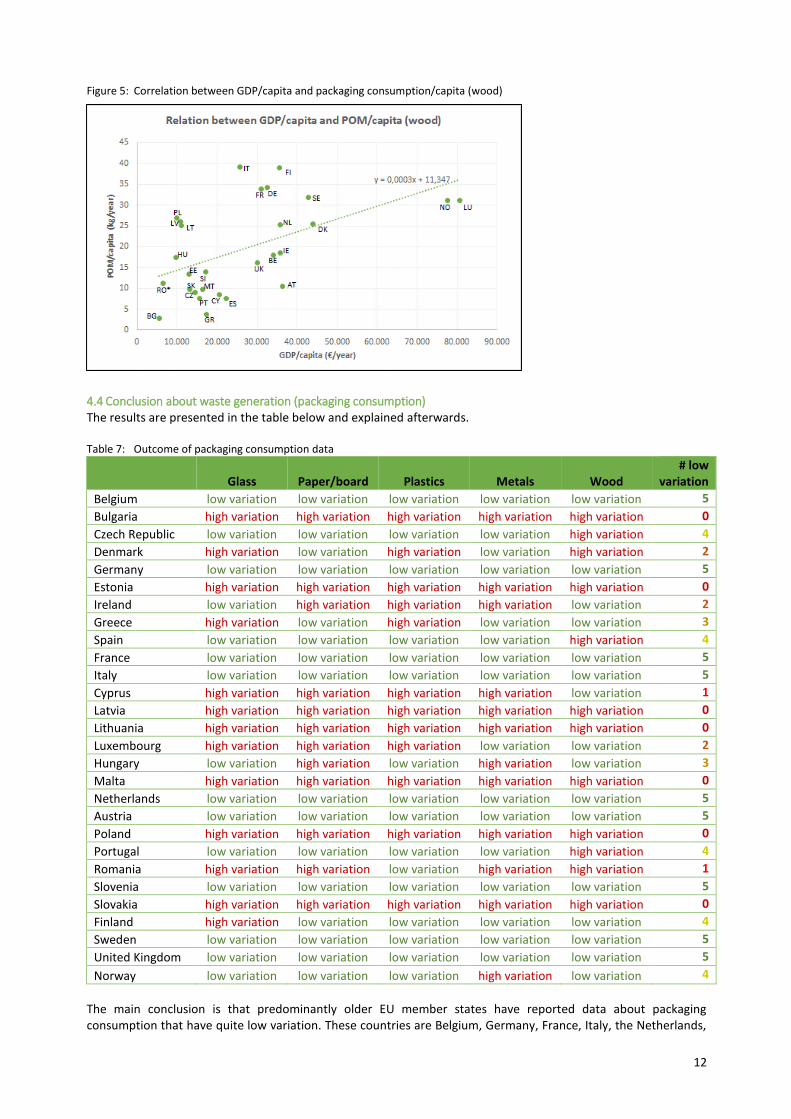
When looking at micro level, some differences can be detected however. When looking more closely at countries with a similar GDP per capita, it can be observed that data about packaging consumption deviates significantly. When looking at Finland, Ireland, the Netherlands and Austria, the difference between the country with the lowest and the highest GDP is 3%. When looking at per capita packaging consumption, the difference is 33%. Besides, the country with the largest consumption is not the one with the highest GDP. The difference is even more extreme when looking at Portugal, Malta, Slovenia and Greece. The GDP difference is 12%, yet the difference in packaging consumption is 109%. Strikingly, the country with the lowest GDP out of the group of 4 has the highest packaging consumption. For metals, correlation between countries is very low. There is not a large difference in the weight of metal used for packaging in the EU member states. For wood, correlation is mediocre, yet the weight of packaging on the market varies largely between member states. The countries where the highest weight of packaging wood per capita is used are not the ones with the highest income, but the ones with a moderate income. Furthermore, countries with a similar income show extremely differing results for wooden packaging consumption. Because of this, no outliers are calculated for wood. There is reason to believe that many of the reported figures for wood have to be thoroughly checked to conclude what their quality is.
12
Figure 5: Correlation between GDP/capita and packaging consumption/capita (wood)
4.4 Conclusion about waste generation (packaging consumption) The results are presented in the table below and explained afterwards. Table 7: Outcome of packaging consumption data
Glass Paper/board Plastics Metals Wood # low
variation
Belgium low variation low variation low variation low variation low variation 5
Bulgaria high variation high variation high variation high variation high variation 0
Czech Republic low variation low variation low variation low variation high variation 4
Denmark high variation low variation high variation low variation high variation 2
Germany low variation low variation low variation low variation low variation 5
Estonia high variation high variation high variation high variation high variation 0
Ireland low variation high variation high variation high variation low variation 2
Greece high variation low variation high variation low variation low variation 3
Spain low variation low variation low variation low variation high variation 4
France low variation low variation low variation low variation low variation 5
Italy low variation low variation low variation low variation low variation 5
Cyprus high variation high variation high variation high variation low variation 1
Latvia high variation high variation high variation high variation high variation 0
Lithuania high variation high variation high variation high variation high variation 0
Luxembourg high variation high variation high variation low variation low variation 2
Hungary low variation high variation low variation high variation low variation 3
Malta high variation high variation high variation high variation high variation 0
Netherlands low variation low variation low variation low variation low variation 5
Austria low variation low variation low variation low variation low variation 5
Poland high variation high variation high variation high variation high variation 0
Portugal low variation low variation low variation low variation high variation 4
Romania high variation high variation low variation high variation high variation 1
Slovenia low variation low variation low variation low variation low variation 5
Slovakia high variation high variation high variation high variation high variation 0
Finland high variation low variation low variation low variation low variation 4
Sweden low variation low variation low variation low variation low variation 5
United Kingdom low variation low variation low variation low variation low variation 5
Norway low variation low variation low variation high variation low variation 4
The main conclusion is that predominantly older EU member states have reported data about packaging consumption that have quite low variation. These countries are Belgium, Germany, France, Italy, the Netherlands,

13
Austria, Sweden and the United Kingdom. Of the newer member states, Slovenia has reported data that didn’t show significant variation. On the other hand, 7 countries have reported packaging consumption data to the European Commission, in which
a high level of variation for all materials could be discovered. These countries are Bulgaria, Estonia, Latvia,
Lithuania, Malta, Poland and Slovakia.
14
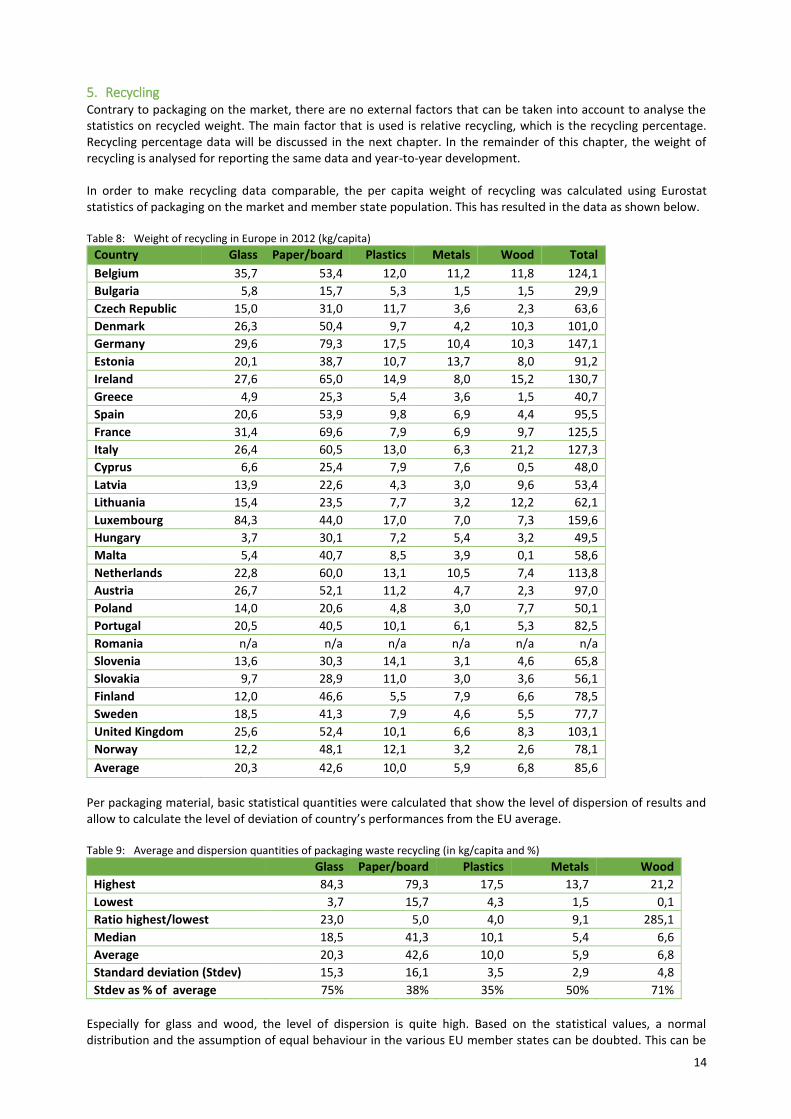
5. Recycling Contrary to packaging on the market, there are no external factors that can be taken into account to analyse the statistics on recycled weight. The main factor that is used is relative recycling, which is the recycling percentage. Recycling percentage data will be discussed in the next chapter. In the remainder of this chapter, the weight of recycling is analysed for reporting the same data and year-to-year development. In order to make recycling data comparable, the per capita weight of recycling was calculated using Eurostat statistics of packaging on the market and member state population. This has resulted in the data as shown below. Table 8: Weight of recycling in Europe in 2012 (kg/capita)
Country Glass Paper/board Plastics Metals Wood Total
Belgium 35,7 53,4 12,0 11,2 11,8 124,1
Bulgaria 5,8 15,7 5,3 1,5 1,5 29,9
Czech Republic 15,0 31,0 11,7 3,6 2,3 63,6
Denmark 26,3 50,4 9,7 4,2 10,3 101,0
Germany 29,6 79,3 17,5 10,4 10,3 147,1
Estonia 20,1 38,7 10,7 13,7 8,0 91,2
Ireland 27,6 65,0 14,9 8,0 15,2 130,7
Greece 4,9 25,3 5,4 3,6 1,5 40,7
Spain 20,6 53,9 9,8 6,9 4,4 95,5
France 31,4 69,6 7,9 6,9 9,7 125,5
Italy 26,4 60,5 13,0 6,3 21,2 127,3
Cyprus 6,6 25,4 7,9 7,6 0,5 48,0
Latvia 13,9 22,6 4,3 3,0 9,6 53,4
Lithuania 15,4 23,5 7,7 3,2 12,2 62,1
Luxembourg 84,3 44,0 17,0 7,0 7,3 159,6
Hungary 3,7 30,1 7,2 5,4 3,2 49,5
Malta 5,4 40,7 8,5 3,9 0,1 58,6
Netherlands 22,8 60,0 13,1 10,5 7,4 113,8
Austria 26,7 52,1 11,2 4,7 2,3 97,0
Poland 14,0 20,6 4,8 3,0 7,7 50,1
Portugal 20,5 40,5 10,1 6,1 5,3 82,5
Romania n/a n/a n/a n/a n/a n/a
Slovenia 13,6 30,3 14,1 3,1 4,6 65,8
Slovakia 9,7 28,9 11,0 3,0 3,6 56,1
Finland 12,0 46,6 5,5 7,9 6,6 78,5
Sweden 18,5 41,3 7,9 4,6 5,5 77,7
United Kingdom 25,6 52,4 10,1 6,6 8,3 103,1
Norway 12,2 48,1 12,1 3,2 2,6 78,1
Average 20,3 42,6 10,0 5,9 6,8 85,6
Per packaging material, basic statistical quantities were calculated that show the level of dispersion of results and allow to calculate the level of deviation of country’s performances from the EU average. Table 9: Average and dispersion quantities of packaging waste recycling (in kg/capita and %)
Glass Paper/board Plastics Metals Wood
Highest 84,3 79,3 17,5 13,7 21,2
Lowest 3,7 15,7 4,3 1,5 0,1
Ratio highest/lowest 23,0 5,0 4,0 9,1 285,1
Median 18,5 41,3 10,1 5,4 6,6
Average 20,3 42,6 10,0 5,9 6,8
Standard deviation (Stdev) 15,3 16,1 3,5 2,9 4,8
Stdev as % of average 75% 38% 35% 50% 71%
Especially for glass and wood, the level of dispersion is quite high. Based on the statistical values, a normal distribution and the assumption of equal behaviour in the various EU member states can be doubted. This can be
15
explained by the different levels of waste management in the EU member states. Some countries have landfill bans and legal minimum standards for the treatment of waste (e.g. separate collection and recycling), whereas other countries still rely on landfilling.
5.1 Reporting of the exact same data as the previous year or missing data Denmark and Romania have reported the same weight as the year before or missing data in (resp. 2010 and 2012).
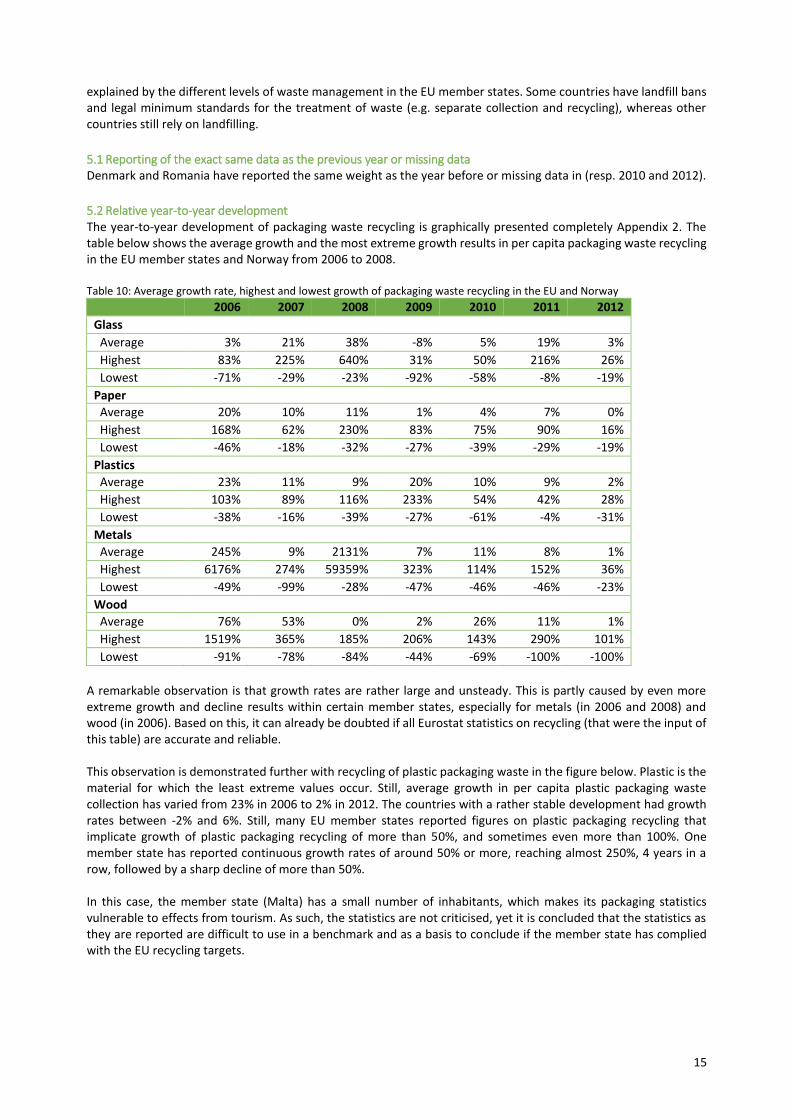
5.2 Relative year-to-year development The year-to-year development of packaging waste recycling is graphically presented completely Appendix 2. The table below shows the average growth and the most extreme growth results in per capita packaging waste recycling in the EU member states and Norway from 2006 to 2008. Table 10: Average growth rate, highest and lowest growth of packaging waste recycling in the EU and Norway
2006 2007 2008 2009 2010 2011 2012
Glass
Average 3% 21% 38% -8% 5% 19% 3%
Highest 83% 225% 640% 31% 50% 216% 26%
Lowest -71% -29% -23% -92% -58% -8% -19%
Paper
Average 20% 10% 11% 1% 4% 7% 0%
Highest 168% 62% 230% 83% 75% 90% 16%
Lowest -46% -18% -32% -27% -39% -29% -19%
Plastics
Average 23% 11% 9% 20% 10% 9% 2%
Highest 103% 89% 116% 233% 54% 42% 28%
Lowest -38% -16% -39% -27% -61% -4% -31%
Metals
Average 245% 9% 2131% 7% 11% 8% 1%
Highest 6176% 274% 59359% 323% 114% 152% 36%
Lowest -49% -99% -28% -47% -46% -46% -23%
Wood
Average 76% 53% 0% 2% 26% 11% 1%
Highest 1519% 365% 185% 206% 143% 290% 101%
Lowest -91% -78% -84% -44% -69% -100% -100%
A remarkable observation is that growth rates are rather large and unsteady. This is partly caused by even more extreme growth and decline results within certain member states, especially for metals (in 2006 and 2008) and wood (in 2006). Based on this, it can already be doubted if all Eurostat statistics on recycling (that were the input of this table) are accurate and reliable. This observation is demonstrated further with recycling of plastic packaging waste in the figure below. Plastic is the material for which the least extreme values occur. Still, average growth in per capita plastic packaging waste collection has varied from 23% in 2006 to 2% in 2012. The countries with a rather stable development had growth rates between -2% and 6%. Still, many EU member states reported figures on plastic packaging recycling that implicate growth of plastic packaging recycling of more than 50%, and sometimes even more than 100%. One member state has reported continuous growth rates of around 50% or more, reaching almost 250%, 4 years in a row, followed by a sharp decline of more than 50%. In this case, the member state (Malta) has a small number of inhabitants, which makes its packaging statistics vulnerable to effects from tourism. As such, the statistics are not criticised, yet it is concluded that the statistics as they are reported are difficult to use in a benchmark and as a basis to conclude if the member state has complied with the EU recycling targets.

16
Figure 6: Growth of per capita plastic packaging recycling in the EU
5.3 Conclusion about packaging waste recycling The results are presented in the table below and explained afterwards. Table 11: Outcome of packaging waste recycling data
Glass Paper/board Plastics Metals Wood # low
variation
Belgium low variation low variation low variation low variation high variation 4
Bulgaria high variation high variation high variation high variation high variation 0
Czech Republic low variation high variation low variation high variation high variation 2
Denmark high variation high variation low variation low variation high variation 2
Germany low variation low variation low variation low variation low variation 5
Estonia high variation high variation high variation high variation high variation 0
Ireland low variation low variation low variation high variation low variation 4
Greece high variation low variation high variation low variation high variation 2
Spain low variation low variation low variation low variation high variation 4
France low variation low variation low variation low variation low variation 5
Italy low variation low variation low variation low variation low variation 5
Cyprus high variation high variation high variation high variation high variation 0
Latvia high variation high variation high variation high variation high variation 0
Lithuania high variation high variation high variation high variation high variation 0
Luxembourg high variation high variation high variation low variation high variation 1
Hungary high variation high variation high variation high variation high variation 0
Malta high variation high variation high variation high variation high variation 0
Netherlands low variation low variation low variation low variation low variation 5
Austria low variation low variation low variation low variation low variation 5
Poland high variation high variation high variation high variation high variation 0
Portugal low variation high variation low variation low variation high variation 3
Romania high variation low variation high variation low variation high variation 2
Slovenia high variation low variation high variation high variation high variation 1
Slovakia high variation high variation high variation high variation high variation 0
Finland high variation low variation low variation low variation high variation 3
Sweden low variation low variation high variation low variation high variation 3
United Kingdom low variation low variation low variation low variation low variation 5
Norway low variation low variation low variation high variation high variation 3
17
As already described in the previous section, the year-to year development has not been stable for many countries in the period from 2006 until 2012. Again, the older EU member states have reported that has quite low variation. This variation is larger than for packaging on the market, as the per capita weight of recycling is more related with communication and financial incentives than with economic growth. The countries with low variation are Germany, France, Italy, the Netherlands, Austria and the United Kingdom. On the other hand, 9 countries have reported packaging consumption data to the European Commission, in which a high level of variation for all materials could be discovered. These countries are Bulgaria, Cyprus, Estonia, Latvia, Lithuania, Hungary, Malta, Poland and Slovakia.
18
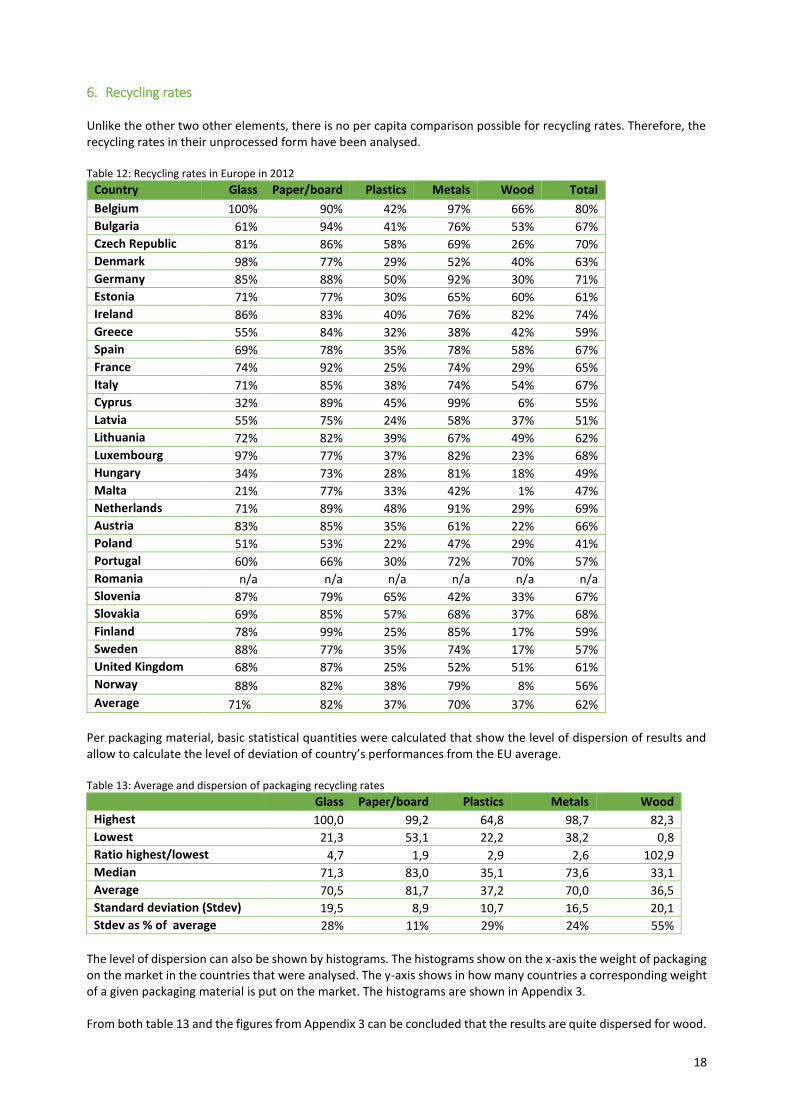
6. Recycling rates Unlike the other two other elements, there is no per capita comparison possible for recycling rates. Therefore, the recycling rates in their unprocessed form have been analysed. Table 12: Recycling rates in Europe in 2012
Country Glass Paper/board
Belgium 100%
Bulgaria 61%
Czech Republic 81%
Denmark 98%
Germany 85%
Estonia 71%
Ireland 86%
Greece 55%
Spain 69%
France 74%
Italy 71%
Cyprus 32%
Latvia 55%
Lithuania 72%
Luxembourg 97%
Hungary 34%
Malta 21%
Netherlands 71%
Austria 83%
Poland 51%
Portugal 60%
Romania n/a
Slovenia 87%
Slovakia 69%
Finland 78%
Sweden 88%
United Kingdom
Norway
Average
68% 88%
71%
90%
94% 86%
77% 88% 77%
83% 84%
78% 92%
85% 89% 75%
82% 77%
73% 77% 89%
85% 53%
66%
n/a
79%
85% 99%
77%
87% 82% 82%
Plastics
42%
41% 58%
29% 50% 30%
40% 32%
35% 25%
38% 45% 24%
39% 37%
28% 33% 48%
35% 22%
30%
n/a
65%
57% 25%
35%
25% 38% 37%
Metals
97%
76% 69%
52% 92% 65%
76% 38%
78% 74%
74% 99% 58%
67% 82%
81% 42% 91%
61% 47%
72%
n/a
42%
68% 85%
74%
52% 79% 70%
Wood
66%
53% 26%
40% 30% 60%
82% 42%
58% 29%
54%
6%
37%
49% 23%
18%
1%
29%
22% 29%
70%
n/a
33%
37% 17%
17%
51%
8%
37%
Total
80%
67% 70%
63% 71% 61%
74% 59%
67% 65%
67% 55% 51%
62% 68%
49% 47% 69%
66% 41%
57%
n/a
67%
68% 59%
57%
61% 56% 62%
Per packaging material, basic statistical quantities were calculated that show the level of dispersion of results and allow to calculate the level of deviation of country’s performances from the EU average. Table 13: Average and dispersion of packaging recycling rates
Glass Paper/board Plastics Metals Wood
Highest 100,0 99,2 64,8 98,7 82,3
Lowest 21,3 53,1 22,2 38,2 0,8
Ratio highest/lowest 4,7 1,9 2,9 2,6 102,9
Median 71,3 83,0 35,1 73,6 33,1
Average 70,5 81,7 37,2 70,0 36,5
Standard deviation (Stdev) 19,5 8,9 10,7 16,5 20,1
Stdev as % of average 28% 11% 29% 24% 55%
The level of dispersion can also be shown by histograms. The histograms show on the x-axis the weight of packaging on the market in the countries that were analysed. The y-axis shows in how many countries a corresponding weight of a given packaging material is put on the market. The histograms are shown in Appendix 3. From both table 13 and the figures from Appendix 3 can be concluded that the results are quite dispersed for wood.

19
6.1 Reporting of the exact same data as the previous year or missing data Denmark and Romania have reported the same weight as the year before or missing data in (resp. 2010 and 2012).
6.2 Relative year-to-year development The year-to-year development of packaging put on the market is shown for all packaging materials in Appendix 3. Just as the results for packaging recycling, the packaging recycling rates show sturdy developments. These extreme results are likely to have a relation, since the former is the numerator of the latter. Table 14: Average growth rate, highest and lowest growth of packaging recycling rates in the EU and Norway
2006 2007 2008 2009 2010 2011 2012
Glass
Average 16% 20% 40% 1% 7% 16% 4%
Highest 318% 277% 758% 96% 45% 197% 48%
Lowest -71% -29% -34% -94% -52% -51% -17%
Paper
Average 19% 8% 12% 8% 1% 4% -1%
Highest 202% 89% 265% 64% 22% 58% 20%
Lowest -37% -28% -38% -24% -40% -32% -22%
Plastics
Average 25% 6% 4% 24% 10% 8% 2%
Highest 140% 43% 48% 264% 60% 43% 32%
Lowest -20% -17% -42% -24% -57% -16% -25%
Metals
Average 246% 6% 1167% 18% 5% 3% 2%
Highest 6100% 209% 32450% 375% 69% 44% 37%
Lowest -46% -97% -24% -24% -43% -25% -22%
Wood
Average 80% 38% 5% 15% 14% 10% 1%
Highest 1433% 304% 243% 186% 123% 217% 112%
Lowest -92% -69% -82% -46% -66% -66% -48%
In the analysis, some remarkable results were identified. In some countries, the year-to-year change of both packaging on the market and recycling changed with the same percentage point for 2 or more consecutive years. The chance of such an occasion is very small, so it is worth to further analyse the specific cases. Figure 7: year-to-year changes of packaging on the market and packaging recycling in two countries
20
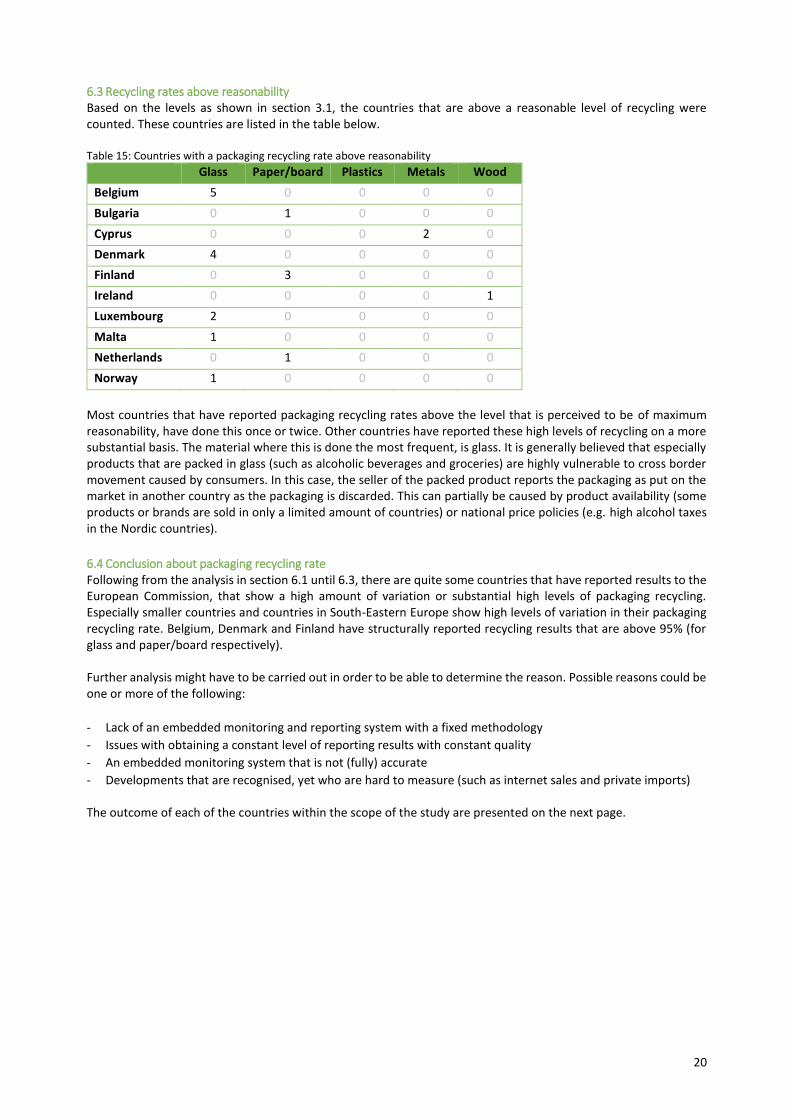
6.3 Recycling rates above reasonability Based on the levels as shown in section 3.1, the countries that are above a reasonable level of recycling were counted. These countries are listed in the table below. Table 15: Countries with a packaging recycling rate above reasonability
Glass Paper/board Plastics Metals Wood
Belgium 5 0 0 0 0
Bulgaria 0 1 0 0 0
Cyprus 0 0 0 2 0
Denmark 4 0 0 0 0
Finland 0 3 0 0 0
Ireland 0 0 0 0 1
Luxembourg 2 0 0 0 0
Malta 1 0 0 0 0
Netherlands 0 1 0 0 0
Norway 1 0 0 0 0
Most countries that have reported packaging recycling rates above the level that is perceived to be of maximum reasonability, have done this once or twice. Other countries have reported these high levels of recycling on a more substantial basis. The material where this is done the most frequent, is glass. It is generally believed that especially products that are packed in glass (such as alcoholic beverages and groceries) are highly vulnerable to cross border movement caused by consumers. In this case, the seller of the packed product reports the packaging as put on the market in another country as the packaging is discarded. This can partially be caused by product availability (some products or brands are sold in only a limited amount of countries) or national price policies (e.g. high alcohol taxes in the Nordic countries).
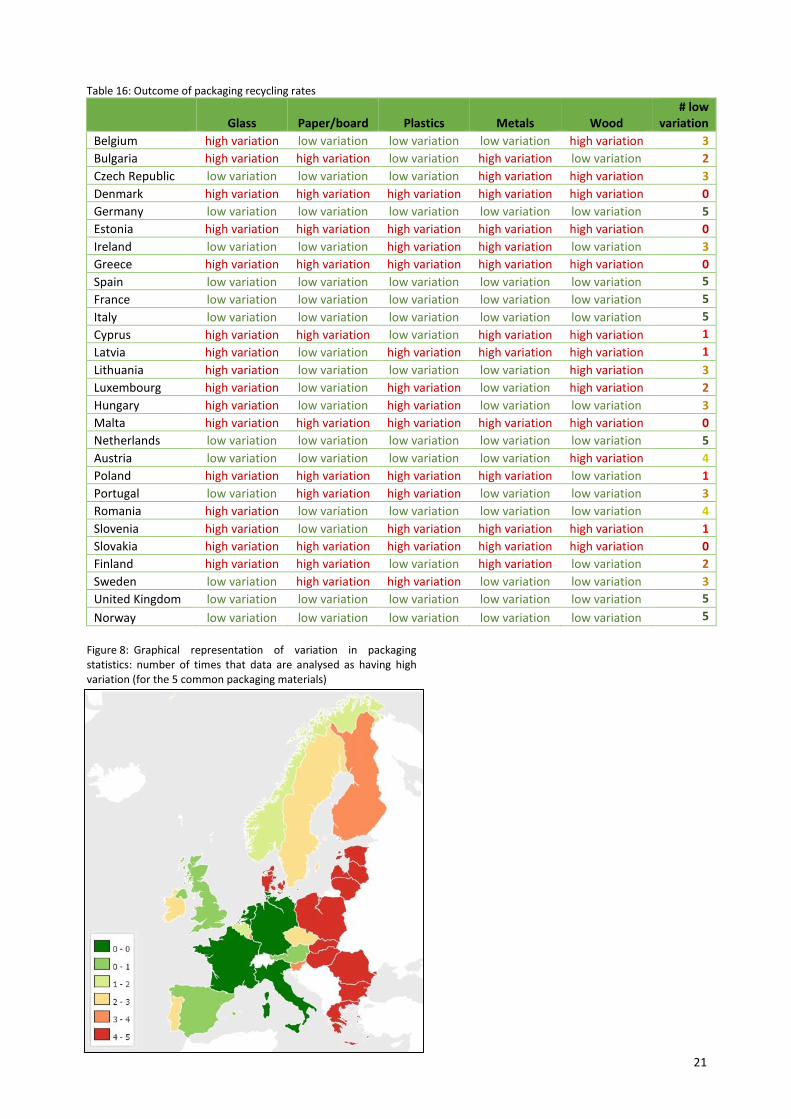
6.4 Conclusion about packaging recycling rate Following from the analysis in section 6.1 until 6.3, there are quite some countries that have reported results to the European Commission, that show a high amount of variation or substantial high levels of packaging recycling. Especially smaller countries and countries in South-Eastern Europe show high levels of variation in their packaging recycling rate. Belgium, Denmark and Finland have structurally reported recycling results that are above 95% (for glass and paper/board respectively). Further analysis might have to be carried out in order to be able to determine the reason. Possible reasons could be one or more of the following:
- Lack of an embedded monitoring and reporting system with a fixed methodology
- Issues with obtaining a constant level of reporting results with constant quality
- An embedded monitoring system that is not (fully) accurate
- Developments that are recognised, yet who are hard to measure (such as internet sales and private imports) The outcome of each of the countries within the scope of the study are presented on the next page.
21
Table 16: Outcome of packaging recycling rates
Glass Paper/board Plastics Metals Wood # low
variation
Belgium high variation low variation low variation low variation high variation 3
Bulgaria high variation high variation low variation high variation low variation 2
Czech Republic low variation low variation low variation high variation high variation 3
Denmark high variation high variation high variation high variation high variation 0
Germany low variation low variation low variation low variation low variation 5
Estonia high variation high variation high variation high variation high variation 0
Ireland low variation low variation high variation high variation low variation 3
Greece high variation high variation high variation high variation high variation 0
Spain low variation low variation low variation low variation low variation 5
France low variation low variation low variation low variation low variation 5
Italy low variation low variation low variation low variation low variation 5
Cyprus high variation high variation low variation high variation high variation 1
Latvia high variation low variation high variation high variation high variation 1
Lithuania high variation low variation low variation low variation high variation 3
Luxembourg high variation low variation high variation low variation high variation 2
Hungary high variation low variation high variation low variation low variation 3
Malta high variation high variation high variation high variation high variation 0
Netherlands low variation low variation low variation low variation low variation 5
Austria low variation low variation low variation low variation high variation 4
Poland high variation high variation high variation high variation low variation 1
Portugal low variation high variation high variation low variation low variation 3
Romania high variation low variation low variation low variation low variation 4
Slovenia high variation low variation high variation high variation high variation 1
Slovakia high variation high variation high variation high variation high variation 0
Finland high variation high variation low variation high variation low variation 2
Sweden low variation high variation high variation low variation low variation 3
United Kingdom low variation low variation low variation low variation low variation 5
Norway low variation low variation low variation low variation low variation 5
Figure 8: Graphical representation of variation in packaging statistics: number of times that data are analysed as having high variation (for the 5 common packaging materials)
22
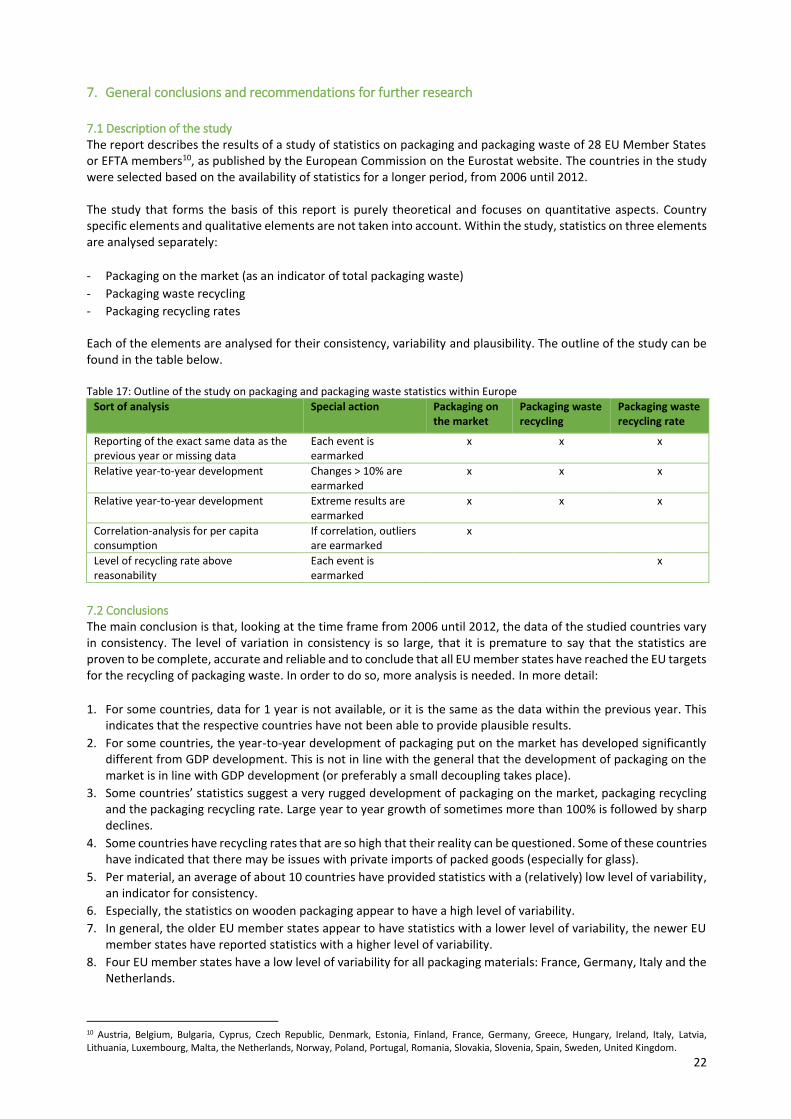
7. General conclusions and recommendations for further research
7.1 Description of the study The report describes the results of a study of statistics on packaging and packaging waste of 28 EU Member States or EFTA members10, as published by the European Commission on the Eurostat website. The countries in the study were selected based on the availability of statistics for a longer period, from 2006 until 2012. The study that forms the basis of this report is purely theoretical and focuses on quantitative aspects. Country specific elements and qualitative elements are not taken into account. Within the study, statistics on three elements are analysed separately:
- Packaging on the market (as an indicator of total packaging waste)
- Packaging waste recycling
- Packaging recycling rates Each of the elements are analysed for their consistency, variability and plausibility. The outline of the study can be found in the table below. Table 17: Outline of the study on packaging and packaging waste statistics within Europe
Sort of analysis Special action
Packaging on the market
Packaging waste recycling
Packaging waste recycling rate
Reporting of the exact same data as the previous year or missing data
Each event is earmarked
x x x
Relative year-to-year development Changes > 10% are earmarked
x x x
Relative year-to-year development Extreme results are earmarked
x x x
Correlation-analysis for per capita consumption
If correlation, outliers are earmarked
x
Level of recycling rate above reasonability
Each event is earmarked
x
7.2 Conclusions The main conclusion is that, looking at the time frame from 2006 until 2012, the data of the studied countries vary in consistency. The level of variation in consistency is so large, that it is premature to say that the statistics are proven to be complete, accurate and reliable and to conclude that all EU member states have reached the EU targets for the recycling of packaging waste. In order to do so, more analysis is needed. In more detail:
1. For some countries, data for 1 year is not available, or it is the same as the data within the previous year. This indicates that the respective countries have not been able to provide plausible results.
2. For some countries, the year-to-year development of packaging put on the market has developed significantly different from GDP development. This is not in line with the general that the development of packaging on the market is in line with GDP development (or preferably a small decoupling takes place).
3. Some countries’ statistics suggest a very rugged development of packaging on the market, packaging recycling and the packaging recycling rate. Large year to year growth of sometimes more than 100% is followed by sharp declines.
4. Some countries have recycling rates that are so high that their reality can be questioned. Some of these countries have indicated that there may be issues with private imports of packed goods (especially for glass).
5. Per material, an average of about 10 countries have provided statistics with a (relatively) low level of variability, an indicator for consistency.
6. Especially, the statistics on wooden packaging appear to have a high level of variability.
7. In general, the older EU member states appear to have statistics with a lower level of variability, the newer EU member states have reported statistics with a higher level of variability.
8. Four EU member states have a low level of variability for all packaging materials: France, Germany, Italy and the Netherlands.
10 Austria, Belgium, Bulgaria, Cyprus, Czech Republic, Denmark, Estonia, Finland, France, Germany, Greece, Hungary, Ireland, Italy, Latvia, Lithuania, Luxembourg, Malta, the Netherlands, Norway, Poland, Portugal, Romania, Slovakia, Slovenia, Spain, Sweden, United Kingdom.
23
7.3 Recommendations for further research The study has shed light on the current status of packaging statistics, yet it has not intended to give reasons for this current status quo. It is highly recommended to analyse these reasons. Some key aspects in such an additional analysis could be:
- Do countries have a formal reporting structure/procedure?
- If yes, is this structure/procedure demonstrably implemented?
- How does the member state determine the weight of packaging on the market, to which risks of incomplete, unreliable or inaccurate results does this method lead (e.g. free riders, imprecise registration or research results, estimation)?
- Is any inconsistent weight of packaging on the market caused by elements that don’t happen on a yearly basis, e.g. renewal of reusable packaging (which is typically counted for as put on the market only at the first time of use)?
- What elements are counted as recycling of packaging waste (especially for wooden packaging)?
- How does the member state determine the weight of packaging waste recycling, to which risks of incomplete, unreliable or inaccurate results does this method lead (e.g. double counting, errors in estimates, mixing of packaging waste)?
- Are other elements of packaging waste (e.g. the share of packaging in municipal solid waste) incorporated in order to determine the quality the level of recycling?
- Which factors can distort the quality of statistics (e.g. freeriding, private imports of packed goods and internet trade to final consumers), and to what extent?

24
Appendices
25
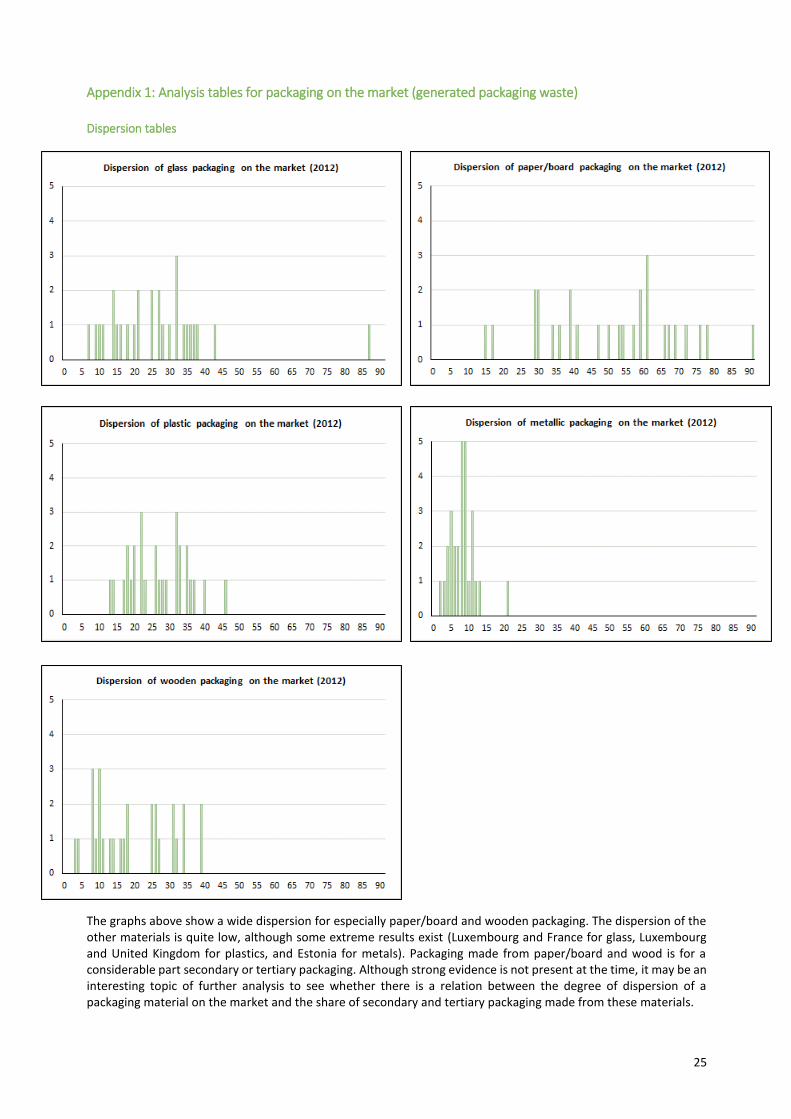
Appendix 1: Analysis tables for packaging on the market (generated packaging waste)
Dispersion tables
The graphs above show a wide dispersion for especially paper/board and wooden packaging. The dispersion of the other materials is quite low, although some extreme results exist (Luxembourg and France for glass, Luxembourg and United Kingdom for plastics, and Estonia for metals). Packaging made from paper/board and wood is for a considerable part secondary or tertiary packaging. Although strong evidence is not present at the time, it may be an interesting topic of further analysis to see whether there is a relation between the degree of dispersion of a packaging material on the market and the share of secondary and tertiary packaging made from these materials.
26
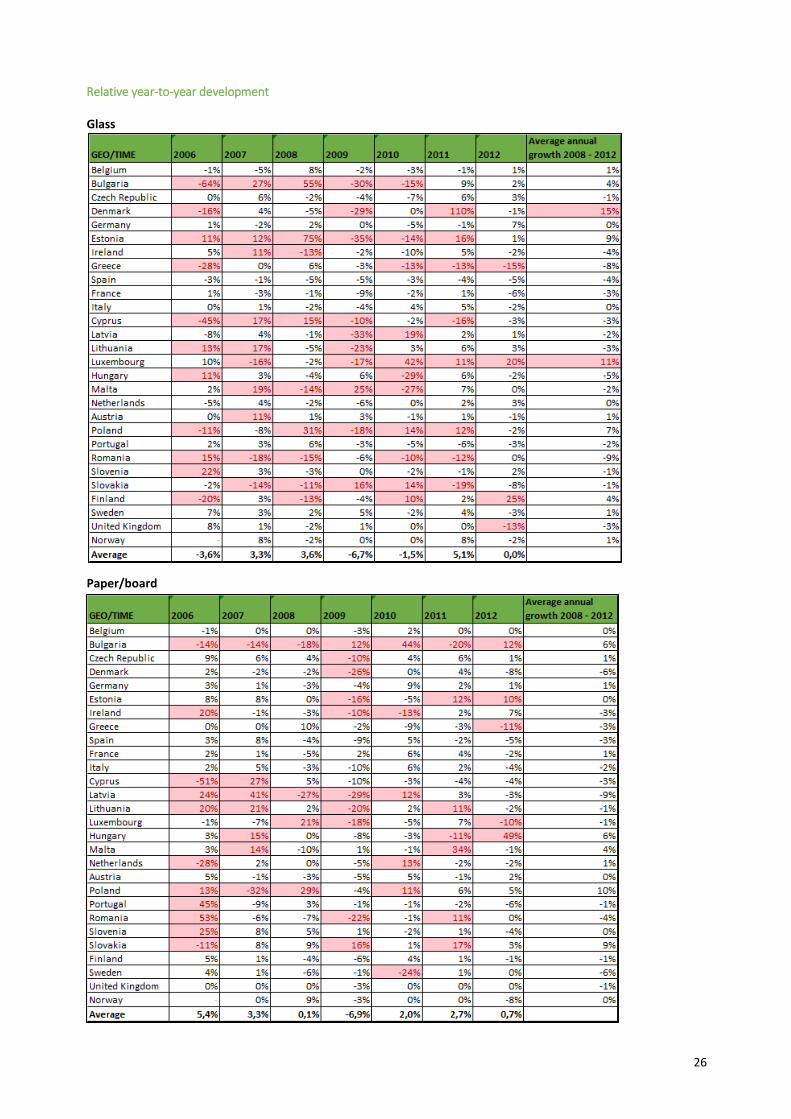
Relative year-to-year development Glass
Paper/board
27
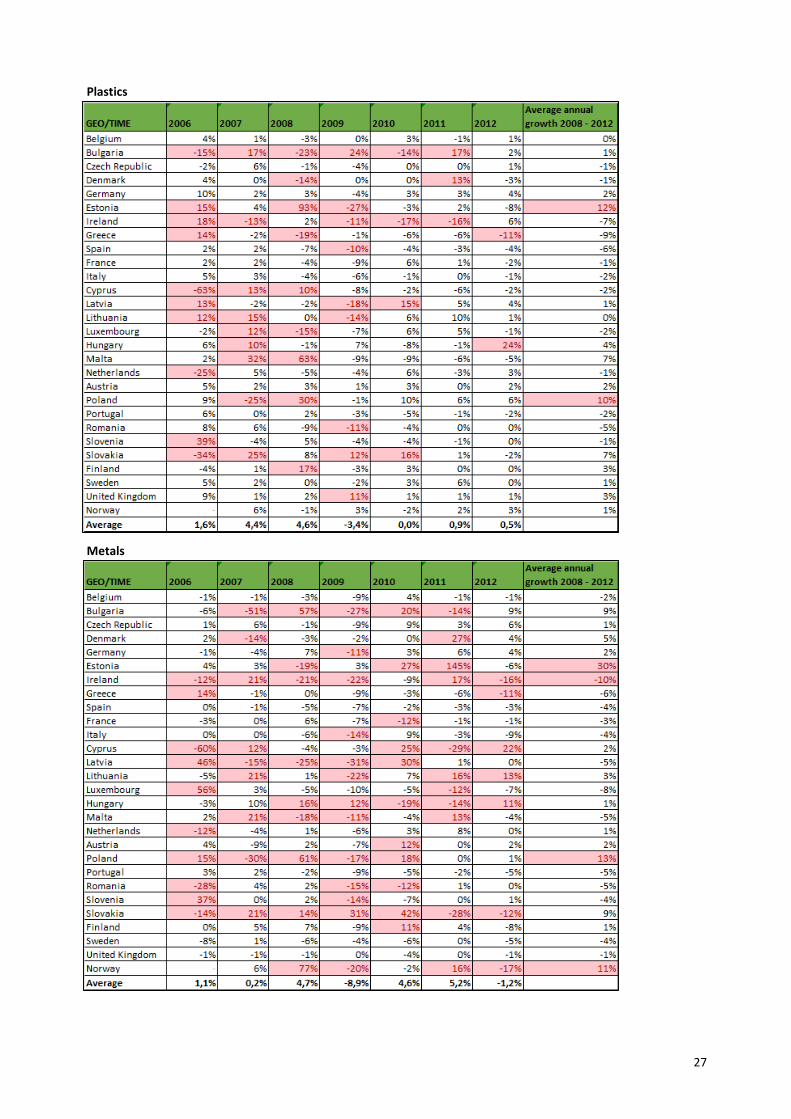
Plastics
Metals
28
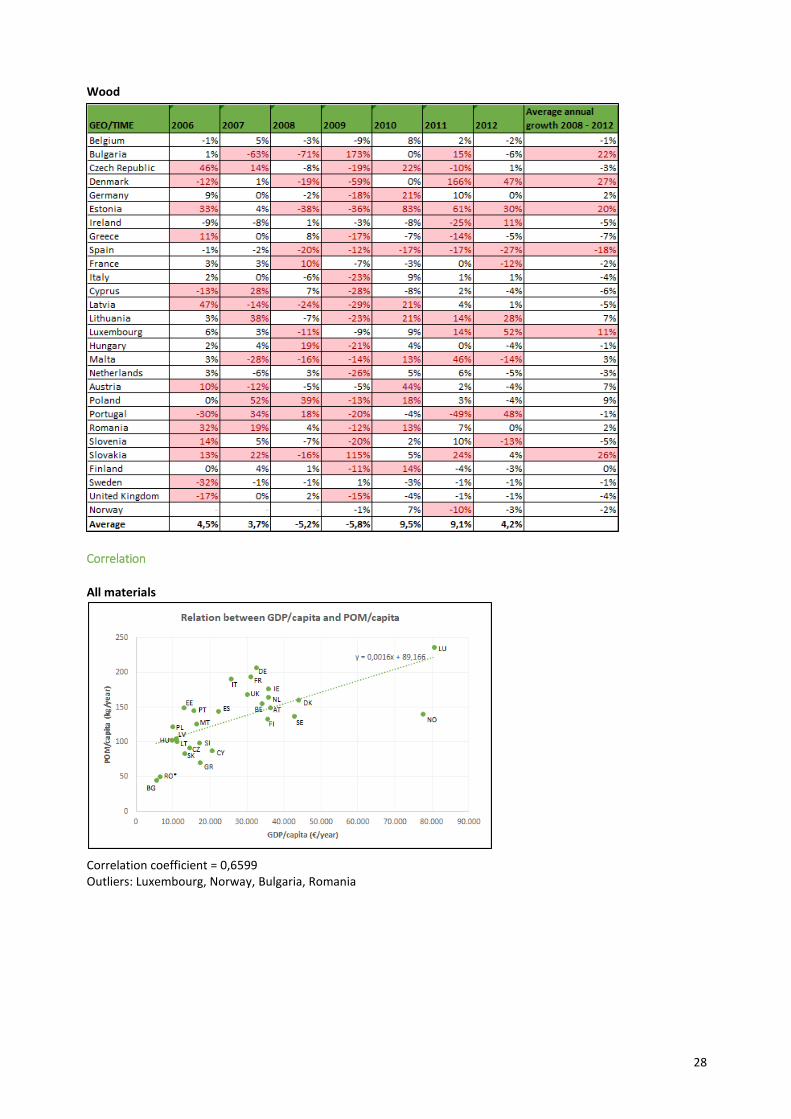
Wood
Correlation
All materials
Correlation coefficient = 0,6599 Outliers: Luxembourg, Norway, Bulgaria, Romania
29
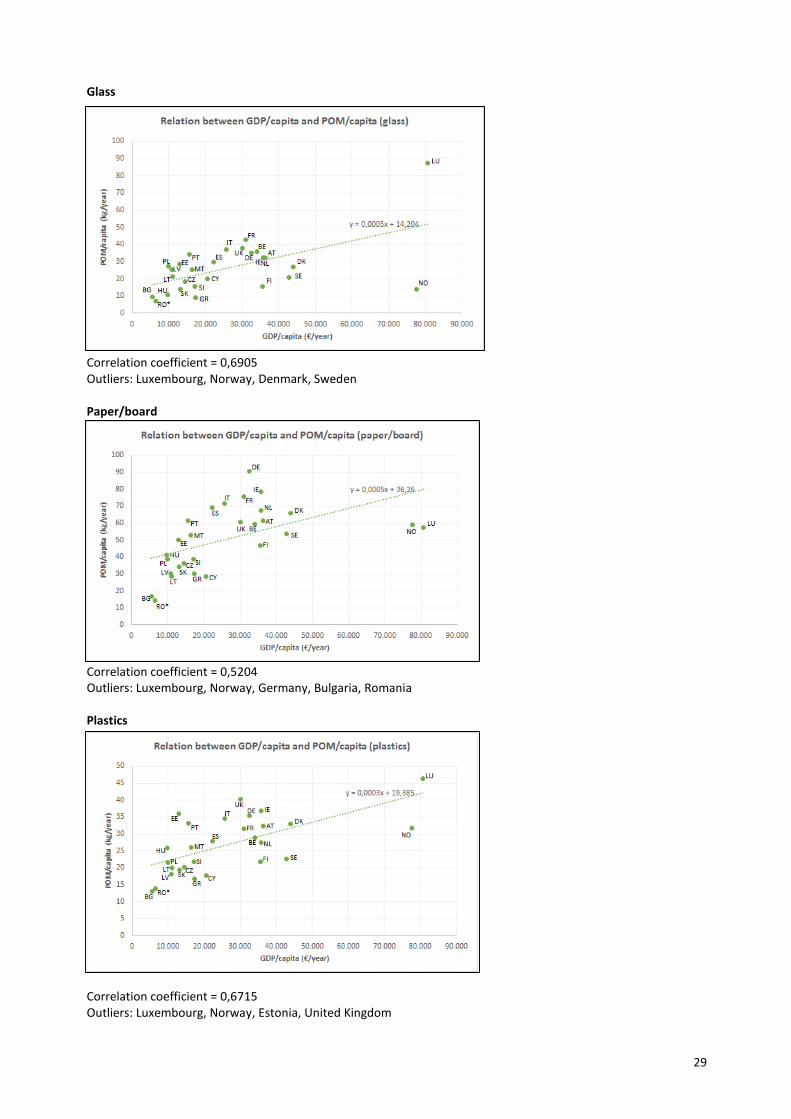
Glass
Correlation coefficient = 0,6905 Outliers: Luxembourg, Norway, Denmark, Sweden Paper/board
Correlation coefficient = 0,5204 Outliers: Luxembourg, Norway, Germany, Bulgaria, Romania Plastics
Correlation coefficient = 0,6715 Outliers: Luxembourg, Norway, Estonia, United Kingdom
30
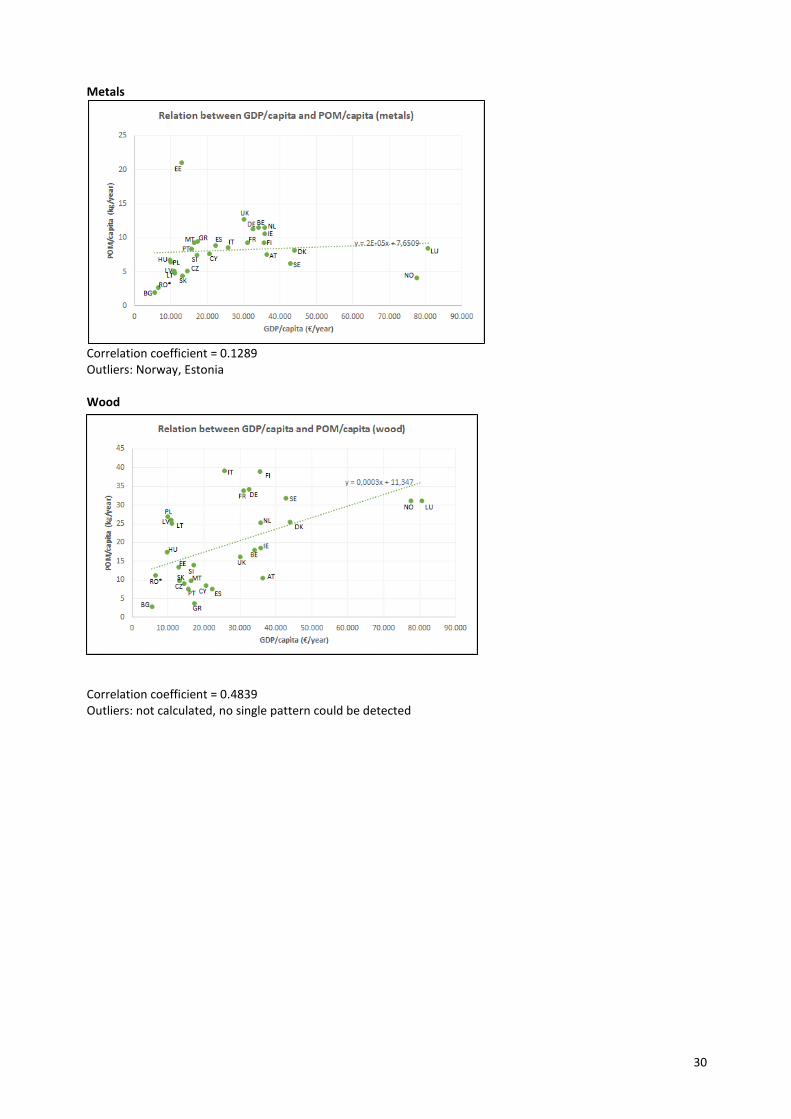
Metals
Correlation coefficient = 0.1289 Outliers: Norway, Estonia Wood
Correlation coefficient = 0.4839 Outliers: not calculated, no single pattern could be detected
31
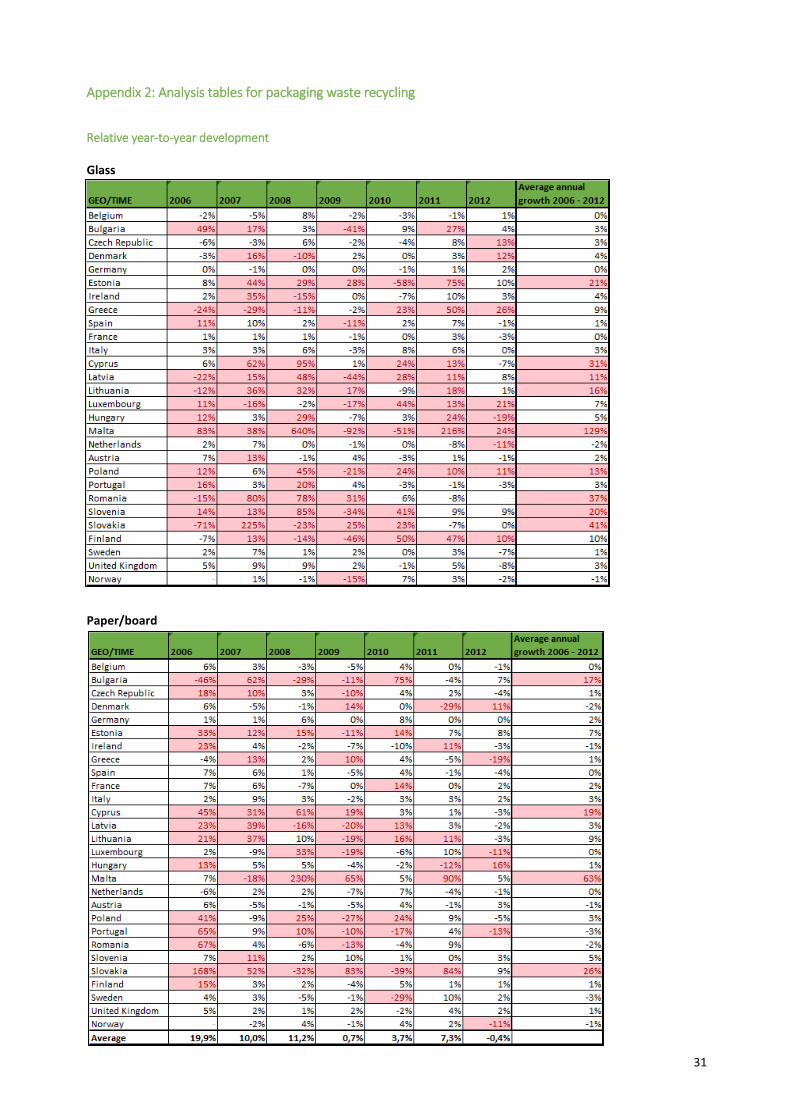
Appendix 2: Analysis tables for packaging waste recycling
Relative year-to-year development Glass
Paper/board
32
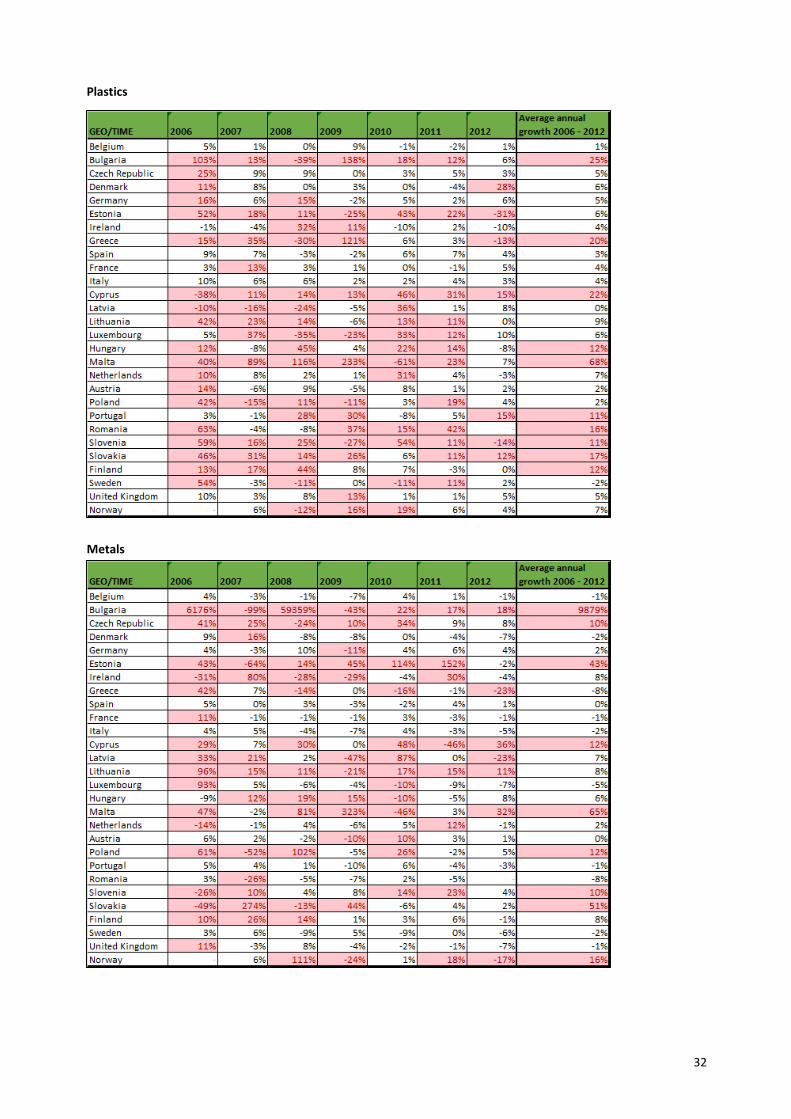
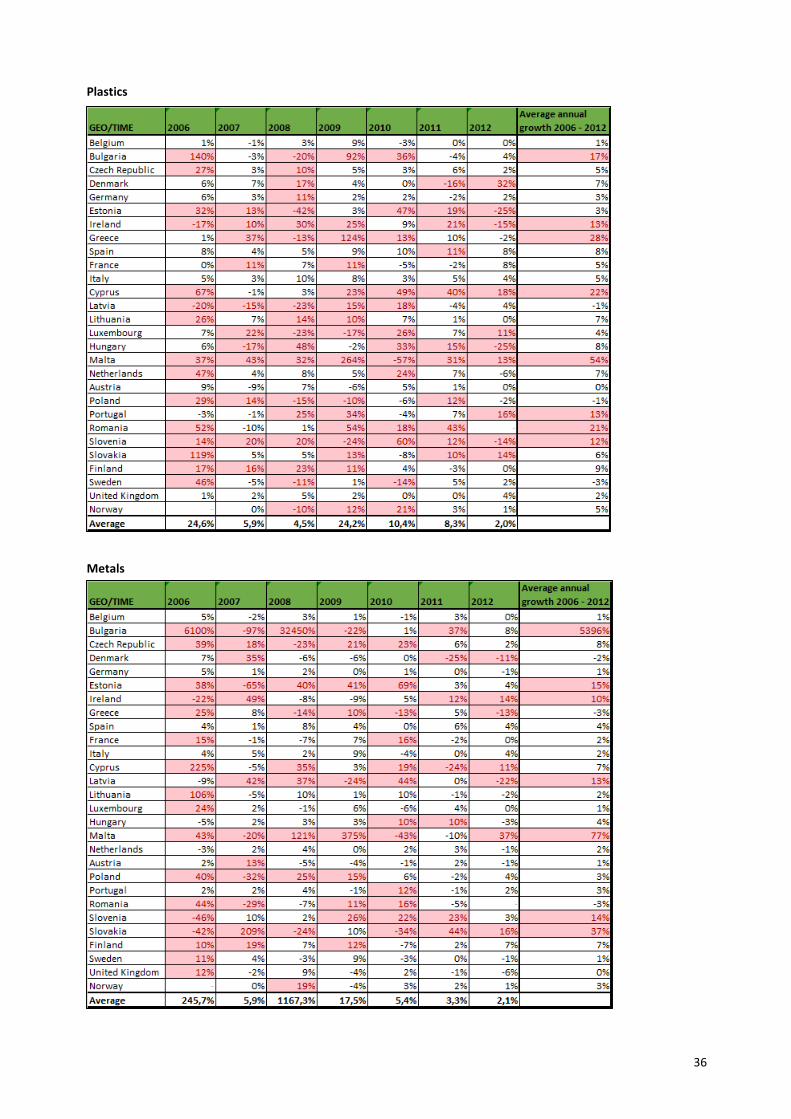
Plastics
Metals
33
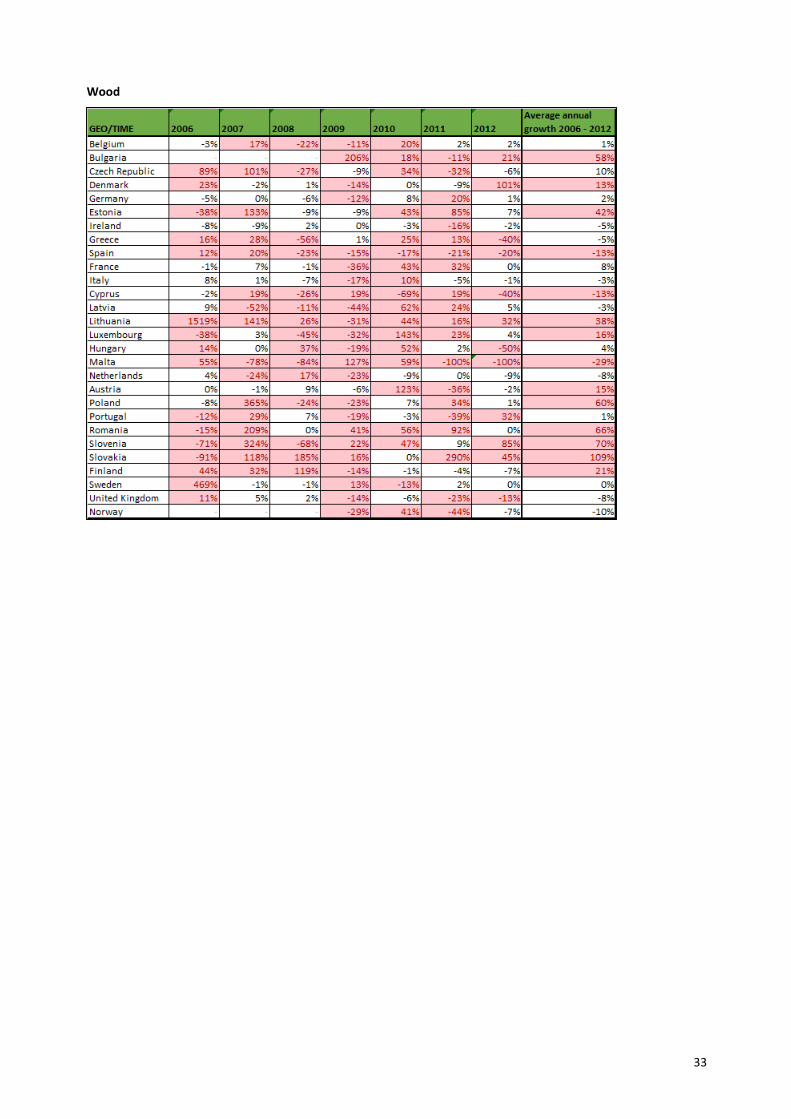
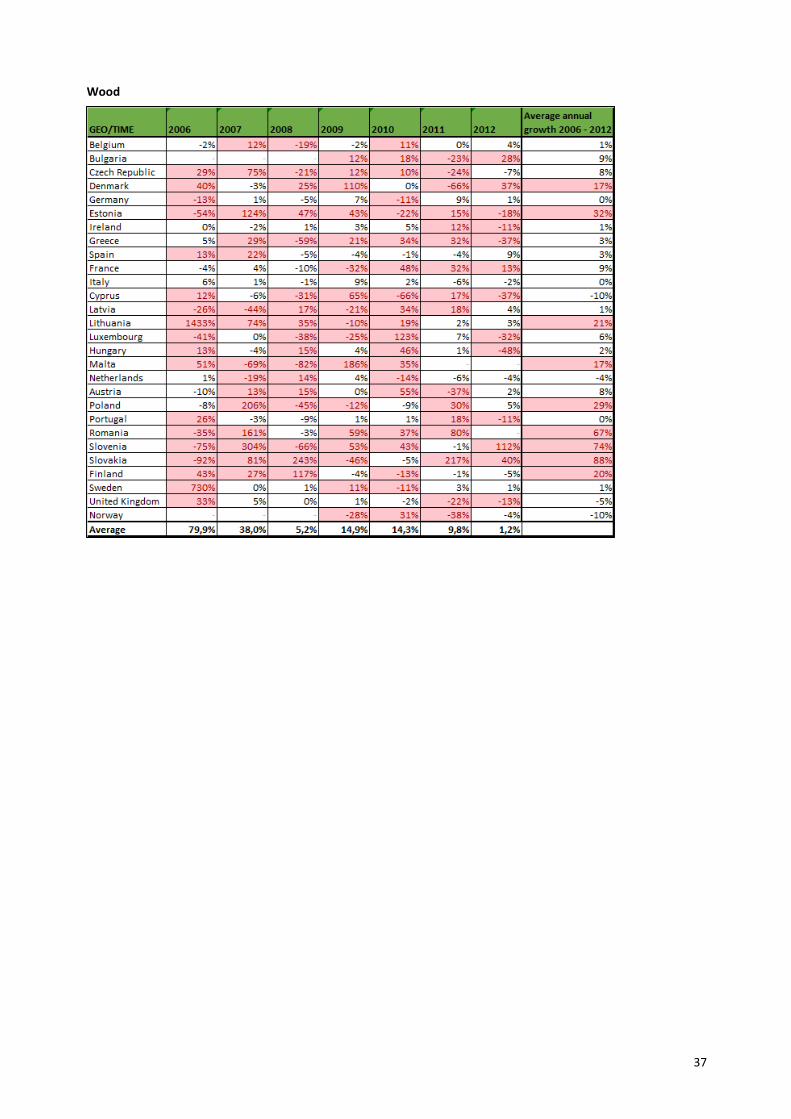
Wood
34
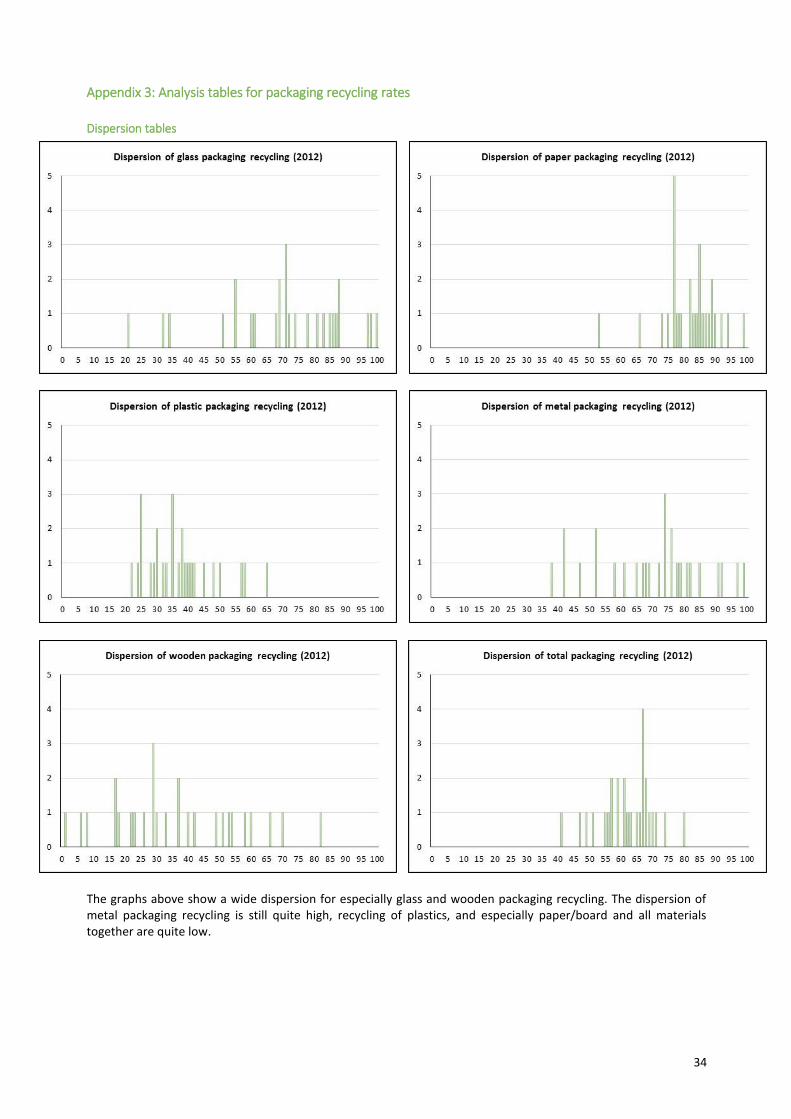
Appendix 3: Analysis tables for packaging recycling rates
Dispersion tables
The graphs above show a wide dispersion for especially glass and wooden packaging recycling. The dispersion of metal packaging recycling is still quite high, recycling of plastics, and especially paper/board and all materials together are quite low.

35
Relative year-to-year development Glass
Paper/board
36
Plastics
Metals
37
Wood