ANALYSIS OF DROPLET BEHAVIOR ON A ROTATING …
163
ANALYSIS OF DROPLET BEHAVIOR ON A ROTATING SURFACE IN ATOMIZATION-BASED CUTTING FLUID SYSTEMS FOR MICRO-MACHINING BY ISHA GHAI THESIS Submitted in partial fulfillment of the requirements for the degree of Master of Science in Mechanical Engineering in the Graduate College of the University of Illinois at Urbana-Champaign, 2010 Urbana, Illinois Advisers: Professor Shiv G. Kapoor Professor Richard E. DeVor
Transcript of ANALYSIS OF DROPLET BEHAVIOR ON A ROTATING …

ANALYSIS OF DROPLET BEHAVIOR ON A ROTATING SURFACE IN
ATOMIZATION-BASED CUTTING FLUID SYSTEMS FOR MICRO-MACHINING
BY
ISHA GHAI
THESIS
Submitted in partial fulfillment of the requirements
for the degree of Master of Science in Mechanical Engineering
in the Graduate College of the
University of Illinois at Urbana-Champaign, 2010
Urbana, Illinois
Advisers:
Professor Shiv G. Kapoor
Professor Richard E. DeVor
ii
Abstract
Atomization-based cutting fluid (ACF) systems have been recently found to be
effective in providing both cooling and lubrication for micro-scale machining operations.
The ACF systems are preferable over the conventional flood cooling methods as they
effectively reduce the temperature at the workpiece-tool interface through evaporative
cooling and provide superior lubrication to the cutting zone. While such ACF systems
appear to be beneficial, there is a lack of a physics-based understanding of the
phenomena underlying cooling and lubrication performance of ACF systems in micro-
machining processes.
The research presented in this thesis investigates the effect of ACF system
parameters and machining conditions on the cooling and lubrication performance in
micro-machining processes in order to enable the design of efficient ACF systems. To
accomplish this, experiments are first conducted to understand the cooling and lubrication
mechanism of ACF systems. The knowledge gained from the experiments is then used to
develop a model-based approach to the design of ACF systems for high cooling and
lubrication performance in micro-machining.
On the experimental front, micro-turning experiments are carried out and the
cutting performance evaluated for varying cutting fluids and at different droplet speeds.
Micro-turning experiments indicate that a cutting fluid with low surface tension and low
viscosity generates lower cutting temperatures whereas a fluid with low surface tension
and high viscosity generates lower cutting forces. Since in most machining processes,
either the workpiece or the tool is rotating, single droplet impingement experiments are
iii
also conducted on a rotating surface using fluids with different surface tension and
viscosity values. Upon impact the droplet shape is observed to be a function of both the
droplet speed and the surface speed. The spreading increases with increased surface
speed owing to the tangential momentum added by the rotating surface. Spreading is
observed to also increase with a decrease in fluid surface tension and does not change
with the fluid viscosity. It is concluded that a fluid with low surface tension and low
viscosity is an effective coolant of the cutting zone, whereas, a fluid with low surface
tension and high viscosity is effective for lubrication. Another set of single droplet
impingement experiments are conducted on a rotating surface to capture the 3D shape of
a droplet upon impingement to aid the model development.
On the modeling front, a parameterization scheme is developed to mathematically
define the 3D shape of droplet upon impingement. The shape information is used to
develop an energy-based model for droplet spreading. The droplet spreading model
captures the experimental results within 10% accuracy. The spreading model is then used
to predict the cooling and lubrication for an ACF-based micro-turning process. The
model captures the cooling and lubrication trends observed in micro-turning experiments.
A parametric study is conducted to identify the significant factors affecting the
performance of an ACF system. Droplet speed is found to have a dominant effect on both
cooling and lubrication performance, particularly, with a low surface tension fluid for
cooling and a low surface tension and high viscosity fluid for lubrication.
iv
Acknowledgements
I would like to thank my advisers Professor Richard E. DeVor and Professor Shiv
G. Kapoor for their guidance and encouragement over the course of this research. Their
leadership has not only enabled me to develop as a graduate student but also instilled in
me a sense of passion for the work one is committed to. I would also like to thank
Professor John Wentz of University of St. Thomas and Dr. Johnson Samuel of University
of Illinois for their input in this research.
I would like to gratefully acknowledge the support of the National Science
Foundation (Grant No. DMI 06-54374) and Grayce Wicall Gauthier Chair for funding
this research. I would like to thank the Illinois Sustainable Technology Center,
University of Illinois at Urbana Champaign for the use of their facilities for measuring
fluid properties.
I would like to thank my friends Amanjot, Arnika and Garima and my roommates
Grace and Lara for their love, support and encouragement during my time here. I would
also like to thank my colleagues Ken, Kevin, Kurt, and Keith for their valuable input to
the research and for the friendly atmosphere in the lab.
I am forever indebted to my parents Tirlok Swaroop Ghai and Reena Ghai, my
sister Aanchal Ghai and my brother Amar Ghai for their selfless love, support, and
encouragement throughout my life. They are the ones who are wholly and solely behind
all that I am. Finally, I would like to thank God for entrusting me with this research and
giving me strength and wisdom to carry out the task set before me.

v
Table of Contents
List of Figures................................................ ...................................................................ix
List of Tables....................................................................................................................xiv
Nomenclature ................................................................................................................... xv
1 Introduction .......................................................................................................................1
1.1 Background and Motivation ......................................................................................1
1.2 Research Objectives, Scope, and Tasks .....................................................................6
1.2.1 Research Objectives and Goals .......................................................................... 6
1.2.2 Scope of Research .............................................................................................. 7
1.2.3 Research Tasks................................................................................................... 7
1.3 Overview of Thesis ....................................................................................................9
2 Literature Review............................................................................................................11
2.1 Mist-based Cutting Fluid Systems ...........................................................................11
2.1.1 Minimum Quantity Lubrication ....................................................................... 11
2.1.2 Atomization-based Cutting Fluid Systems in Micromachining....................... 16
2.1.3 Effect of Surface Tension and Viscosity on Cutting Fluid Functionality ........ 24
2.2 Fundamentals of Droplet Dynamics ........................................................................26
2.2.1 Atomization Basics ..................................................................................... 26
2.2.2 Droplet Impingement Dynamics ................................................................. 28
2.3 Droplet Spreading Behavior on a Stationary Surface ..............................................31
2.3.1 Experimental Study .......................................................................................... 31

vi
2.3.2 Modeling Spreading Behavior ......................................................................... 35
2.4 Droplet Behavior on a Rotating Surface ..................................................................39
2.4.1 Droplet Impingement Dynamics ...................................................................... 39
2.4.2 Droplet Spreading Behavior ............................................................................ 45
2.5 Performance Evaluation of an ACF System in Micromachining Processes ............50
2.5.1 Evaporative Cooling Models ........................................................................... 50
2.5.2 Lubrication Models .......................................................................................... 53
2.6 Gaps in Knowledge ..................................................................................................55
3 Micro-turning Experiments .............................................................................................58
3.1 Experimental Setup and Design ...............................................................................58
3.1.1 Test-bed Design ............................................................................................... 58
3.1.2 Cutting Force and Temperature Measurement ................................................ 61
3.1.3 Experimental Design ........................................................................................ 63
3.2 Experimental Results ...............................................................................................65
3.2.1 Cutting Temperatures....................................................................................... 65
3.2.2 Cutting Forces .................................................................................................. 68
3.3 Chapter Summary ..................................................................................................70
4 Single Droplet Impingement Experiments ......................................................................72
4.1 Experimental Setup and Design ...............................................................................73
4.1.1 Test-bed Design ............................................................................................... 73
4.1.2 Experimental Design .............................................................................................74
4.2 Experimental Results ...............................................................................................76
4.2.1 Time evolution of droplets on a rotating surface ............................................. 76

vii
4.2.2 Droplet Behavior in the Spreading Phase ........................................................ 82
4.2.3 Droplet Behavior in the Evaporative Phase ..................................................... 86
4.3 Discussion ................................................................................................................90
4.4 Chapter Summary ....................................................................................................92
5 Modeling Droplet Spreading on a Rotating Surface .......................................................94
5.1 Experimental Setup and Design ...............................................................................95
5.1.1 Test-bed Design ............................................................................................... 95
5.1.2 Experimental Design ........................................................................................ 97
5.2 Experimental Results .............................................................................................98
5.3 Droplet Shape Parameterization ............................................................................102
5.3.1 Side-view parameterization ........................................................................... 102
5.3.2 Top-view parameterization ............................................................................ 104
5.3.3 3D equation of the droplet shape ................................................................... 105
5.3.4 Validation of the droplet parameterization scheme ....................................... 107
5.4 Droplet Spreading Model .......................................................................................109
5.4.1 Energy conservation equation .............................................................................110
5.4.2 Volume conservation equation ...................................................................... 112
5.4.3 Relation between d1 and d2 ............................................................................ 113
5.5 Chapter Summary ..................................................................................................114
6 Prediction of Cooling and Lubrication Performance of Atomization-based Cutting
Fluid System ....................................................................................................................115
6.1 Cooling performance of an ACF system ...............................................................115
6.1.1 Calculating heat transfer from surface to the droplets ................................... 116

viii
6.1.2 Predicting cooling performance of an ACF system ....................................... 118
6.2 Lubrication performance of an ACF system ..........................................................122
6.3 Predicting Cooling and Lubrication for ACF-based Micro-turning Process: A
Parametric Study ..................................................................................................125
6.3.1 Cooling Performance ..................................................................................... 126
6.3.2 Lubrication Performance ............................................................................... 128
6.4 Chapter Summary ................................................................................................130
7 Conclusions and Recommendations .............................................................................132
7.1 Conclusions ............................................................................................................132
7.1.1 Experimental Investigation ............................................................................ 133
7.1.2 Model Development and Interpretation ......................................................... 134
7.2 Recommendations for Future Work.......................................................................136
7.2.1 Further experimentation to improve the design of ACF systems .................. 136
7.2.2 Further modeling studies to capture the mechanism of ACF systems ........... 137
7.2.3 Implementation of improved ACF system ..................................................... 138
Bibliography ....................................................................................................................139

ix
List of Figures
Figure 2.1 The velocity field with (a) flood coolant application (b) MQL [19] ............... 13
Figure 2.2 Effect of cutting fluid applied as mist on tool temperature in turning [20] ..... 14
Figure 2.3 Schematic illustration of the difference between (a) flood coolant
application (b) MQL application [21] ............................................................................... 14
Figure 2.4 Schematic of preliminary ACF system [2] ...................................................... 17
Figure 2.5 Peak-to-valley cutting forces [2] ..................................................................... 18
Figure 2.6 Photographs of burrs [2] .................................................................................. 18
Figure 2.7 Photographs of tool wear after cutting (a) 30 slots with flood cooling and
(b) 45 slots with atomized fluid [2]................................................................................... 19
Figure 2.8 Results of temperature measurements [2] ....................................................... 20
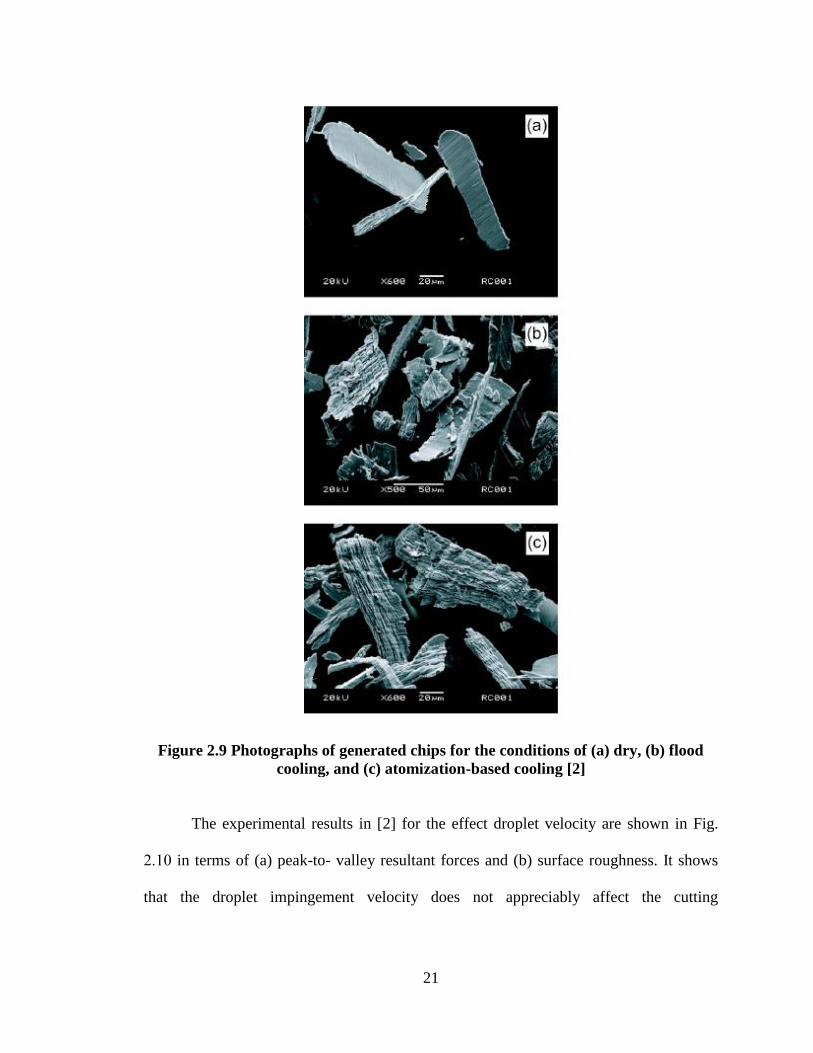
Figure 2.9 Photographs of generated chips for the conditions of (a) dry, (b) flood
cooling, and (c) atomization-based cooling [2] ................................................................ 21
Figure 2.10 Experimental results at different droplet impingement ................................. 22
Figure 2.11 Performance measures [25] ........................................................................... 24
Figure 2.12 Spray generated by the ACF system [25] ...................................................... 24
Figure 2.13 Operating principle of the different types of atomizers: (a) shearing-type
(b) ultrasonic [27] ............................................................................................................ 27
Figure 2.14 Types of spray nozzles: (a) full cone, (b) hollow cone, and (c) flat
stream [28] ........................................................................................................................ 28
Figure 2.15 Various impingement regimes identified for droplet impact [8] .................. 29
Figure 2.16 Schematic representation of the spread factor with time [36] ....................... 33

x
Figure 2.17 Droplet impact on a dry surface [36] ............................................................. 34
Figure 2.18 Geometry of the (a) spherical cap model (b) cylindrical disk model [40] .... 38
Figure 2.19 Drop trajectory and cine-film frames for collision of droplet (d0 = 2 mm,
u0 = 1.2 m/sec) with surface of rotating sphere: a) for us = 30 m/sec; b) for
us = 60 m/sec [10] ............................................................................................................. 41
Figure 2.20 Effect of velocity ratio on reflection of droplet from a rotating surface: 1)
droplet diameter d0 = 0.3 mm; 2) 0.8 mm; 3) 4 mm. I) region of complete adherence;
II) partial reflection; III) total reflection [10] ................................................................... 42
Figure 2.21(a) Splashing of a liquid droplet with Re = 598.8, Oh = 0.0518 on a
smooth surface, (b) Deposition of a liquid droplet with Re = 251.4, Oh = 0.0492
smooth surface [11]........................................................................................................... 43
Figure 2.22 Schematic of the (a) splashing process, (b) deposition process [11] ............. 43
Figure 2.23 Limits for splashing and deposition of droplets on a rotating surface [11] ... 45
Figure 2.24 Variables and coordinates system [12] .......................................................... 46
Figure 2.25 Impact regimes for varying values of Wen and Wet numbers [12] ............... 47
Figure 2.26 Impact regimes (a) Partial rebound (b) Deposition (c) Split
deposition [12] .................................................................................................................. 47
Figure 2.27 Dimensionless excess spread area versus Wet [12] ....................................... 50
Figure 2.28 Fluid flow between two sliding plates [45] .................................................. 54
Figure 2.29 Load-carrying capacity R of the volume of water droplets V placed
between the hydrophobic surfaces [47] ............................................................................ 55
Figure 3.1 Schematic of the ACF system used for micro-turning operation .................... 59
Figure 3.2 Setup of the micro-turning ACF system .......................................................... 60

xi
Figure 3.3 Cutting tool- thermocouple assembly .............................................................. 62
Figure 3.4 Typical cutting force plot (in the direction of feed) ........................................ 62
Figure 3.5 Typical cutting temperature plot ..................................................................... 63
Figure 3.6 Cutting temperature versus droplet speed ....................................................... 66
Figure 3.7 Cutting force versus droplet speed ................................................................. 68
Figure 4.1 Schematic of the single droplet generator experimental setup ........................ 74
Figure 4.2 Experimental setup for single droplet impingement study .............................. 74
Figure 4.3 (a) Droplet before impact (b) Droplet after impact (c) Droplet in the steady
state ................................................................................................................................... 76
Figure 4.4 Time evolution for DI Water droplet on a surface rotating (scale bar
= 20µm)............................................................................................................................. 78
Figure 4.5 Relationship between droplet and surface velocities....................................... 80
Figure 4.6 Time evolution for 12.5% Castrol 6519 droplet on a surface rotating at
0.8m/s (scale bar= 20µm) ................................................................................................. 81
Figure 4.7 Droplets of 12.5% Castrol 6519 spreading on a surface moving at
(a) 0.8 m/s (b) 2.5 m/s (c) 4.2 m/s ..................................................................................... 83
Figure 4.8 (a) Droplet of DI Water spreading on a surface moving at 4.2 m/s
(b) Droplet of 12.5% Castrol 6519 spreading on a surface moving at 4.2 m/s ................ 84
Figure 4.9 Dimensionless diameter (d/d0) versus surface tension (Fluid viscosity
of 1cP) ............................................................................................................................... 85
Figure 4.10 Dimensionless diameter (d/d0) versus viscosity ............................................ 86
Figure 4.11 Evaporation of droplet of DI water ............................................................... 87
Figure 4.12 Variation of dimensionless volume with time for DI Water ......................... 88
xii
Figure 4.13 Variation of dimensionless volume with time for varying surface tension
(viscosity constant at 1cP) ................................................................................................ 89
Figure 4.14 Variation of dimensionless volume with time for varying viscosity
(surface tension of 42mN/m) ............................................................................................ 90
Figure 5.1 Schematic of experimental set-up ................................................................... 96
Figure 5.2 Axes definitions for single-droplet studies ...................................................... 98
Figure 5.3 Side and top view of varying surface tension droplets at the end of
spreading phase for (a) test 1 and (b) test 9 in Table 5.2 .................................................. 99
Figure 5.4 Side and top view of varying viscosity droplets at the end of spreading
phase for (a) test 9 and (b) test 13 in Table 5.2............................................................... 100
Figure 5.5 Side and top view of droplets impinging upon surfaces of varying surface
speed at the end of spreading phase for (a) test 13 and (b) test 14 in Table 5.2 ............. 100
Figure 5.6 Side and top view of droplets with varying droplet speed at the end of
spreading phase for (a) test 1 and (b) test 3 in Table 5.2 ................................................ 101
Figure 5.7 Parameterization scheme for side-view of the droplet .................................. 103
Figure 5.8 Parameterization scheme for top-view of the droplet.................................... 105
Figure 5.9 Parameterized images of the side and top view of droplets corresponding
to conditions in Fig. 5.3a-b ............................................................................................. 107
Figure 5.10 Comparison of calculated and measured droplet volumes .......................... 109
Figure 6.1 Model prediction of heat transfer vs. droplet speed ...................................... 121
Figure 6.2 Cutting temperature data from Chapter 3 ...................................................... 122
Figure 6.3 Model prediction of lubrication force vs. droplet speed................................ 124
Figure 6.4 Two-way diagrams for cooling performance ................................................ 128

xiii
Figure 6.5 Two-way diagrams for lubrication performance ........................................... 130

xiv
List of Tables
Table 2.1 Time scales and dimensionless numbers related to droplet spreading [15] ...... 35
Table 3.1 Cutting Fluid Properties .................................................................................... 64
Table 3.2 Experimental conditions for the micro-turning tests ........................................ 65
Table 3.3 Cutting temperature data ................................................................................... 66
Table 3.4 Cutting force data.............................................................................................. 69
Table 4.1 Physical properties of the fluids used for single droplet experiments .............. 76
Table 5.1 Physical properties of the fluids used for single droplet experiments .............. 97
Table 5.2 Single droplet experiment results ................................................................... 102
Table 6.1 Conditions for the micro-turning tests ............................................................ 119
Table 6.2 Single droplet normalized contact lengths and height at maximum
spreading ......................................................................................................................... 120
Table 6.3 Cutting force data............................................................................................ 124
Table 6.4 Factor levels for 25
design ............................................................................... 126
Table 6.5 Values of significant effects on cooling performance .................................... 127
Table 6.6 Values of significant effects on lubrication performance ............................... 129
xv
Nomenclature
a1f, b1f = semi-axis lengths of ellipse E1F
a2f, b2f = semi-axis lengths of ellipse E2F
a1, b1, c1 = semi-axes of ellipsoid E1
a2, b2, c2 = semi-axes of ellipsoid E2
A1 = surface area of ellipsoidal cap APBQA
A2 = surface area of ellipsoidal cap CPBQC
A3 = surface area of ellipsoidal base APCQA
A = droplet contact area at the condition of maximum spread
c = penetration coefficient
do = droplet diameter
d1 = length of major-axis of droplet in top-view
d2 = length of minor-axis of droplet in top-view
Ev = energy lost to viscous dissipation
f = lubrication force generated by one droplet
F = total lubrication force generated by the droplets
lo = distance of nozzle from the cutting zone
l1 = contact length AD
l2 = contact length DC
h = droplet height
KE1 = droplet kinetic energy before impact

xvi
ks = thermal conductivity of the surface
kf = thermal conductivity of the cutting fluid
M = volume flow rate of the atomizer
n = number of droplets reaching the cutting zone per second measured at mist velocity
N = number of droplets reaching into the cutting zone per second
No = flow rate of atomizer in droplets per second
Oh = Ohnesorge number
q = heat transferred from the surface to one droplet
Q = total heat transferred from the cutting zone to the cutting fluid
r = nozzle radius
R= radius of curvature of the droplet upon impact
SE1 = droplet surface energy before impact
SE2 = droplet surface energy after impact
To = ambient air temperature
ts = time taken by the droplet to spread to its maximum
uo = droplet speed
us = surface speed
V11 = volume of ellipsoidal cap APBQA
V22 = volume of ellipsoidal cap CPBQC
V1 = droplet volume before impact
V2 = droplet volume after impact
vx = fluid velocity in x-direction

xvii
vz = fluid velocity in z-direction
vm = mist velocity
We = Weber number
Greek Symbols
angle at which flow emerges from the nozzle
least square fit coefficients
proportionality constant
µ = fluid viscosity
1 = advancing contact angle
2 = receding contact angle
c = equilibrium contact angle
0 = equivalent contact angle
fluid density
lv = surface tension between fluid and air
sl = surface tension between fluid and solid
sv = surface tension between solid and air
viscous dissipation function

1
Chapter 1
Introduction
1.1 Background and Motivation
Micro-machining, in particular, micro-milling, micro-drilling, and micro-turning,
provides both a viable and potentially preferable process to satisfy the requirements for
production of components with manufactured features in the range of a few to a few
hundred microns with high relative accuracies for a wide range of engineering materials.
However, the limitations of micro-tooling technologies (large edge radii and poor
geometry control) and the resulting ploughing mechanism and minimum chip thickness
effect [1] lead to increased levels of tool wear and tool failure. For improving the cutting
performance in such micro-scale machining operations, atomization-based cutting fluid
(ACF) systems have been found to be preferable over the conventional flood cooling
methods as they effectively reduce the temperature at the workpiece-tool interface
through evaporative cooling and provide superior lubrication to the cutting zone [2].
While such ACF systems appear to be beneficial, there is a lack of a physics-based
understanding of the phenomena underlying cooling and lubrication performance of ACF
systems in micro-machining processes.
For micro-machining processes, ACF systems have been found to be attractive
wherein the micro-sized atomized droplets access the cutting zone, provide effective
2
lubrication at the tool-chip interface, and remove heat from the cutting zone through
evaporative cooling. Jun et al. [2] used an ACF system for micro-milling process with
droplets of diameter 6-10 µm impinging upon the cutting zone wherein the tool rotational
speed was of the order of 2m/s. They found that atomization-based cutting fluid
application is more effective than the conventional flood coolant application. The
experimental results showed that the cutting forces are lower and tool life is significantly
improved with the atomized cutting fluids when compared to dry and flood cooling
methods. Also, application of atomized cutting fluid was found to result in good chip
evacuation and lower cutting temperatures. The study suggested that the droplet
impingement dynamics on a rotating surface are an important factor in determining the
cooling and lubrication performance of an ACF system. However, their study did not
investigate the relationship between droplet dynamics and the observed cutting
performance. Furthermore, their study did not consider the effect of fluid properties, viz.,
surface tension and viscosity, on the efficiency of lubrication and cooling when the
cutting fluid is applied in atomized form.
Atomized droplets have been used in the form of sprays for a wide range of
cooling applications wherein the surface to be cooled is usually held stationary. Thus,
over the years, a large knowledge base has been developed exploring the fundamental
basis of the cooling observed in spray applications for cases where the target surface is
stationary [3-5]. These studies have revealed that the cooling capacity of a spray is
influenced by the droplet characteristics (droplet size and size distribution, droplet
speed), which are also affected by the atomization method (e.g., pressure nozzle,
ultrasonic vibration), atomization parameters (nozzle size, vibration frequency), and the

3
fluid properties (surface tension and viscosity) [6-7]. Knowledge of droplet impingement
dynamics and the ensuing spreading and evaporative behavior forms the fundamental
basis of understanding of the physics underlying spray cooling applications.
In general, droplet impingement upon a surface is classified into four distinct
regimes: stick, rebound, spread and splash. The observed regime is dependent upon the
droplet characteristics, fluid properties and surface characteristics [8-9]. The first regime,
i.e., the stick regime occurs when an impinging droplet adheres to the wall or film surface
in nearly a spherical form. This often happens when the impact energy is extremely low,
and the surface temperature is below the pure adhesion temperature [8]. The rebounding
regime occurs when the impinging droplet bounces off the wall or film. The air layer
trapped between the droplet and the surface causes low energy loss resulting in bouncing.
The third regime, spreading, is similar to the sticking regime but occurs when the impact
energy is large. Finally, the fourth regime is where splashing or further atomization
occurs and droplets break into many secondary droplets.
For the purpose of atomized cutting fluid application, the objective is to wet the
cutting zone effectively through spreading. Thus, the droplet characteristics and fluid
properties should be such that the droplet undergoes spreading when it impinges upon the
rotating surface. It has been shown in [8] that to ensure spreading a set of conditions must
be met. These conditions have been defined in fluid dynamic terms using dimensionless
groups such as Weber number and Ohnesorge number [8] that include droplet
characteristics and fluid properties.
A limited number of studies have been conducted for investigating droplet
impingement dynamics on rotating surfaces. Povarov et al. [10] studied the impingement

4
regimes of droplets of diameter 0.3-4.0 mm with the boundary layer on a rotating surface.
They found the droplets to be either partially reflected or deposited onto the surface based
on the relative magnitudes of droplet speed and surface speed. Mundo et al. [11]
investigated the deposition-splash boundary for droplet impinging upon rotating surfaces.
Their tests were conducted with droplets in the diameter range 60-150 µm and for a wide
range of fluid properties with surface tension in the range 22-72 mN/m and viscosity in
the range 1-2.9 cP. An empirical expression for the deposition-splash boundary was
proposed based on the experimental observations. The result from their study helps in
predicting whether a droplet will deposit on a rotating surface or will splash to form
smaller satellite droplets. Since their objective was simply to avoid droplet splashing for
better surface finish in spray coating/painting applications, no investigation of the droplet
spreading behavior was carried out.
In order to understand the effect of surface speed on the impingement behavior of
droplets for spray coating and spray cooling applications, Chen and Wang [12] studied
the impact of water droplets with sizes 500-900 μm upon a rotating Teflon surface. For
such water droplets, at surface speeds above 4 m/s, necking and subsequent splitting of
droplets was observed. Based on the experimental data collected, the transition
boundaries for partial-rebound to deposition and deposition to split-deposition were
proposed. Although they showed that the contact area for the droplets is dependent on the
surface speed, their experiments were limited only to the study of water droplets. The
droplet diameters used in this study were also significantly larger to those encountered in
the atomized cutting fluid application. Furthermore, the studies of both Mundo et al. [11]
and Chen and Wang [12] did not investigate the spreading and evaporation behavior of a

5
droplet impinging on a rotating surface as a function of specific fluid properties, viz.,
surface tension and viscosity.
There has been extensive research done to model the spreading behavior of a
droplet impinging upon a stationary surface [13-15]. The droplet diameters in these
studies ranged between 20 µm and 4 mm and droplet impact velocities were between 0.5-
6 m/s. These studies reveal that the droplet spreading upon impact can be classified into
two distinct phases, viz., the initial spreading phase that results in a maximum spread
diameter followed by a recoil phase during which the droplet undergoes oscillations that
change the droplet contact area and height with time [14-15]. Given the symmetry of the
droplet shape upon impact, the spreading dynamics is modeled as a 2D problem. In all
these studies, the droplet is modeled to spread out in the shape of either a thin cylindrical
disk or a spherical cap. This shape information is then used to determine the energy of the
droplet after impact and is critical in accurately modeling the spreading behavior of
droplet upon impact. Attané et al. [13] showed that the accuracy of the spreading model
is dependent upon the assumed shape of the spreading droplet. The experiments of
Povarov et al. [10] and Chen and Wang [12] show the presence of a rotating surface
changes the dynamics of the spreading process imposing a need to develop a 3D
spreading model to capture the asymmetric geometry of the droplet upon impact.
While the initial studies have been successful in establishing the effectiveness of
ACF systems in micro-machining processes and in investigating the impingement
dynamics of droplets upon a rotating surface, several gaps in knowledge still exist. First,
there is a lack of micro-machining studies that identify the combined effects of droplet
characteristics and cutting fluid properties on the cooling and lubrication performance of

6
ACF systems. Second, there is a lack of understanding of droplet spreading behavior on a
rotating surface, in particular, as a function of droplet characteristics, fluid properties and
surface speed. Third, modeling work on droplet spreading on a rotating surface has not
been undertaken. A spreading model that predicts droplet geometry resulting from
spreading on a rotating surface will be important to predict the cooling achieved by a
droplet in the cutting zone and the lubrication force generated at the tool-chip interface.
Last, no study has been done to understand the relationship between droplet spreading
behavior on a rotating surface and the cooling and lubrication performance of an ACF
system in micro-machining processes.
1.2 Research Objectives, Scope, and Tasks
1.2.1 Research Objectives and Goals
This research investigates the effect of ACF system parameters and machining
conditions on the cooling and lubrication performance in micro-machining processes in
order to enable the design of efficient ACF systems. To accomplish this, the specific
objectives are:
1. To gain knowledge of effect of droplet characteristics, cutting fluid properties,
and surface speed on the droplet spreading behavior on a rotating surface.
2. To link the knowledge gained on the droplet spreading behavior with the
cooling and lubrication performance of ACF systems in micro-machining
processes.

7
The overarching goal of the research is to use the above knowledge to develop a model-
based approach to the design of ACF systems for high cooling and lubrication
performance in micro-machining.
1.2.2 Scope of Research
This research focuses on investigating and modeling the droplet spreading on a
rotating surface with an aim to enable design of better ACF systems. Since ACF systems
involve droplet diameters in the range of 6-20 µm, this work will consider only droplet
diameters less than 50 µm. Given the high temperatures encountered during machining, it
is expected that the initial dynamics prior to the maximum spreading is not critical, rather
the contact geometry that the droplet achieves at the maximum spread condition. The
droplet spreading model on a rotating surface, therefore, focuses on predicting the droplet
spreading at the condition of maximum spread. The surface roughness values
encountered in micro-machining are in the range of tens to hundreds nanometers [16]
whereas, the initial diameter of the atomized droplet is between 6-20 m. Since the
droplet has 20 times larger diameter than the ridges on the machined surface, for
modeling purposes it is assumed that surface is perfectly smooth. The surface speeds
considered in this study will be within the range of speeds typically used in the micro-
machining of metal, i.e., a few meters/second.
1.2.3 Research Tasks
The objectives of this research will be achieved in the two phases that are
described in detail below.
8
Phase I. Focus will be on the experimental investigation of the droplet behavior on a
rotating surface to better understand the physics underlying the cooling and lubrication
performance of ACF systems. This will be achieved in the following sequence of tasks:
1. Conduct micro-turning experiments and evaluate the cutting performance for
cutting fluids with varying physical properties and at different droplet speeds.
2. Conduct single droplet impingement experiments on a rotating surface for fluids
with different surface tension and viscosity values and study the spreading and
evaporation behavior.
3. Interpret the machining results in light of results from single droplet experiments
to identify the factors affecting the performance of an ACF system.
Phase II. Model development will be undertaken to predict the cooling and lubrication
performance of ACF systems. The specific tasks to be completed are:
1. Conduct single droplet impingement experiments to capture the 3D shape of
droplet upon impact on a rotating surface.
2. Develop a parameterization scheme to define the 3D shape of a droplet and use it
to model droplet spreading on a rotating surface.
3. Use the output of spreading model to predict the heat transferred from the cutting
zone to the droplets and the lubrication force generated by the droplets at the tool-
chip interface.
4. Accomplish model validation by using the spreading model to predict the cooling
and lubrication performance of an ACF-based micro-turning application.
5. Use the validated spreading model to conduct a parametric study in an effort to
develop guidelines for the design of effective ACF systems.
9
1.3 Overview of Thesis
Chapter 2 provides an overview of the available literature on droplet dynamics
and performance of ACF systems. First, previous work on use of ACF systems in micro-
machining processes will be discussed. Next, droplet dynamics on stationary and rotating
surfaces will be discussed. Then, droplet spreading models for stationary surfaces will be
introduced. Last, the usage of spray-based systems for cooling will be discussed.
In chapter 3, micro-turning experiments are conducted to understand the effect of
droplet speed and cutting fluid properties on cutting forces and cutting temperatures. The
cutting performance is evaluated for varying droplet speeds and fluid surface tension and
viscosity values.
In chapter 4, droplet behavior on a rotating surface is studied to better understand
the physics underlying atomized cutting fluid application. First, single droplet
impingement experiments are conducted on a rotating surface using fluids of different
surface tension and viscosity values to understand the spreading and ensuing evaporative
behavior of a droplet from a rotating surface. The micro-turning results presented in
chapter 3 are then interpreted with the help of the results from the single-droplet
experiments to shed light on the underlying physics of cooling and lubrication in ACF
systems.
Chapter 5 presents droplet spreading model developed with an aim to predict
droplet spreading behavior on a rotating surface. First, single droplet impingement
experiments are conducted on a rotating surface to capture the 3D shape of a droplet upon
impingement. A parameterization scheme is then developed to mathematically define the

10
3D shape of droplet upon impingement. The shape information is used to develop an
energy-based model for droplet spreading.
In chapter 6 model validation is accomplished using the spreading model to
predict the cooling and lubrication performance of an ACF based micro-turning
application. Next, a parametric study is conducted to identify the significant factors
affecting the performance of an ACF system.
Chapter 7 provides the conclusions reached through the research and gives
suggestions for the direction of continued work in this area.

11
Chapter 2
Literature Review
The following chapter provides an overview of the available literature concerning
the performance of atomization-based cutting fluid (ACF) systems and associated droplet
dynamics. The review is divided into five subsections. Section 2.1 discusses the use of
ACF systems and their performance in machining processes. Section 2.2 introduces the
basics of atomization and droplet impingement dynamics. Section 2.3 reviews previous
experimental research on droplet spreading dynamics and modeling work done on droplet
spreading. Section 2.4 examines the cooling and lubrication models to predict
performance in a machining process. The last section summarizes the previous research
to date and lists the areas where further research is needed.
2.1 Mist-based Cutting Fluid Systems
2.1.1 Minimum Quantity Lubrication
Generally speaking, application of cutting fluid in a machining process acts as a
cooling and lubricating agent, hence the cutting temperature and cutting force is reduced
and the tool life and machined surface finish is improved. However, the conventional
flood coolant application consumes large amounts of fluid posing cost issues [17-18] and
also has serious environmental pollution and health issues owing to mist generated during
cutting operations [17-18]. The used cutting fluids further pose waste disposal problems

12
due to their hazardous nature [17-18]. In order to mitigate such effects, minimum
quantity lubrication (MQL) approach has been introduced and developed wherein the
cutting fluid is applied in form of a directed mist [17-18].
In MQL approach, the cutting fluid is fed to the tool and/or machining point in
tiny quantities. This is done with or without the assistance of a transport medium, e.g.,
air. In the case of the former, the so-called airless systems, a pump supplies the tool with
the medium, usually oil, in the form of a rapid succession of precision-metered droplets.
In the case of the latter, the medium is atomized in a nozzle to form extremely fine
droplets, which are then fed to the machining point in form of an aerosol spray.
Lacalle et al [19] assessed the efficiency of MQL in high-speed milling of
wrought aluminum alloys wherein it is usual to observe the presence and growth of a
build up edge. The study of flank wear evolution showed that the wear with MQL is
always smaller than wear with conventional cutting fluid application. A computational
fluid dynamics (CFD) simulation was done to study the lubricant flow on the rotating tool
for the two cases to better understand the mechanism underlying each application. The
velocity field for both the application methods is shown in Fig. 2.1. For flood coolant
application (Fig. 2.1a), a wall is generated in the tool vicinity that obstructs the way of
the cutting fluid towards the tool center. Therefore, the application is inefficient because
it does accomplish neither the cooling function by convection, nor the lubrication
function. It only acts taking out chips from the cutting zone. A similar study for MQL
(Fig. 2.1b) shows that the MQL jet adequately penetrates in the inner zones of the tool
edges. Therefore, the three actions expected from the fluid (cooling, lubrication and chip
evacuation) are successfully performed. It was further observed that MQL application

13
reduced the quantity of cutting fluid used by 95% in comparison to the flood coolant
application leading to considerably lower overall machining costs.
Figure 2.1 The velocity field with (a) flood coolant application (b) MQL [19]
Ueda et al [20] investigated the use of oil mist in turning of carbon steel and
observed effective reduction in cutting temperatures when compared to dry cutting. As
shown in Fig. 2.2, the tool temperature is about 60°C lower in MQL compared to dry
turning. It was hypothesized that the deposition of cutting fluid on the tool face decreases
the friction between the tool face and the chips, and this action suppresses the
temperature rise during the cutting operation in MQL application. Liao et al. [21] used
MQL in high-speed machining of hardened steel to investigate the performance
mechanism underlying MQL application. It was found that MQL provides extra oxygen
to promote the formation of a protective oxide layer in the chip–tool interface that
promotes the reduction of friction (Fig. 2.3).
(a) (b)

14
Figure 2.2 Effect of cutting fluid applied as mist on tool temperature in turning [20]
Figure 2.3 Schematic illustration of the difference between (a) flood coolant
application (b) MQL application [21]
Dhar et al. [22] compared the performance of MQL to dry turning of AISI-1040
steel based on experimental measurement of cutting temperature, chip reduction
coefficient, cutting forces, tool wears, surface finish, and dimensional accuracy. Results
indicated that the use of near dry lubrication leads to lower cutting temperature and
cutting force, favorable chip–tool interaction, reduced tool wear, improved surface

15
roughness, and improved dimensional accuracy. MQL reduces the cutting temperatures
leading to improved chip-tool interaction. Further, cutting forces were also observed to
reduce by about 5-15% attributed to retention of cutting edge sharpness due to reduction
of cutting temperatures. MQL resulted in reduced flank wear and hence is expected to
improve tool life. Surface finish and dimensional accuracy improved mainly due to
reduction of wear and damage at the tool tip by the application of MQL.
While the above studies show that use of MQL is advantageous in terms of
cutting performance and economic viability, they were conducted for macro-scale
machining operations. Recent advances in medical, aerospace, electronics, and
communication industries require manufactured features in the range of a few to a few
hundred microns with high relative accuracies. However, the limitations of micro-tooling
technologies (large edge radii and poor geometry control) and the resulting ploughing
mechanism and minimum chip thickness effect [1] lead to increased levels of tool wear
and tool failure. For such micromachining processes the conventional cutting fluid
applications are not viable approaches for two prime reasons: (1) the impact force of the
cutting fluids may be greater than the cutting forces since micromachining forces are only
in the order of a few Newtons [23-24], and (2) the cutting zone is very small (chip loads
are only a few microns or less) so fluid penetration is an important issue. The use of
atomization-based cutting fluid application to circumvent such issues resulting in
improved cutting performance in micromachining processes is discussed in the next
section.
16
2.1.2 Atomization-based Cutting Fluid Systems in
Micromachining
Jun et al [2] used an atomization-based cutting fluid (ACF) system for micro-end
milling of aluminum. They found that for micro-machining processes, it is desirable that
the ACF system produce a spray with droplet sizes in the range of 5-15 µm for effective
penetration into the small cutting zone and the droplet velocity is high (several m/s) so
that the chips are evacuated effectively. A schematic of the ACF system used by Jun et al.
[2] is shown in Fig. 2.4. The system includes an ultrasonic vibration-based atomizer,
cutting fluid reservoir tank, air supplies, and vacuum-based exhaust system to draw
excessive cutting fluid in the form of mist from the air. Ultrasonic vibration was chosen
as the atomization method since it allows easy control of droplet size with narrow size
distribution. The atomized droplets were carried through a pipe using a low velocity air
supply. In the center of the pipe lies a small tube that carried air moving at high velocity.
As soon as the droplets exit the pipe, they meet with this high velocity air jet that carried
the droplets to the cutting zone at a velocity equal to the air jet velocity. The speed of the
air jet was controlled externally by a pressure valve. For effective application of the
cutting fluid, the air speed in the pipe was at values such that the droplets did not stick to
the pipe walls and travelled all the way to the pipe exit. Further, as the droplets impinged
upon the cutting zone, the droplet speed was maintained at values that caused droplets to
spread upon the surface and the effectively wet the cutting zone through spreading. Since
another purpose of the cutting fluid was to carry away the chips from the cutting zone,
the air jet velocity that carried the droplets was kept high enough to carry away the chips

17
from the cutting zone. To ensure that maximum number of droplets will impinge upon
the cutting zone and thereafter spread on the surface the authors used the impingement
criteria developed for droplet impact upon stationary surfaces [2].
Figure 2.4 Schematic of preliminary ACF system [2]
Jun et al. [2] used the above described ACF system to examine its viability and
performance in micromachining processes. Micromilling experiments were done under
dry conditions, conventional flood coolant application and atomization-based cutting
fluid application. The experiments showed that lower cutting forces are generated with
atomization-based cutting fluid application (Fig. 2.5). At a feed rate of 0.33 µm/flute,
where ploughing dominates the cutting process, the milling cutter failed after cutting
eight slots in one case and five slots in the other when cutting dry. On the other hand, the
cutter was able to machine more than 50 slots when cutting fluid was applied in atomized
form. Significantly better tool life was also achieved when the atomized cutting fluid was

18
used as opposed to dry cutting. Burrs formed during dry cutting were significantly larger
than during cutting with the atomized cutting fluid (Fig. 2.6 ).
Figure 2.5 Peak-to-valley cutting forces [2]
Figure 2.6 Photographs of burrs [2]
Jun et al. [2] observed that when conventional flood cooling method is used, the
small size chips cluster around the cutting zone, resulting increased welding of the chips
to the surface and increased tool wear or chipping whereas the atomization-based cutting
fluid application system provides good chip evacuation and longer tool life. Figure 2.7
shows the cutting edge wear after cutting (a) 30 slots with the flood coolant method and
(b) 45 slots with the atomization-based cutting fluid application system. One of the
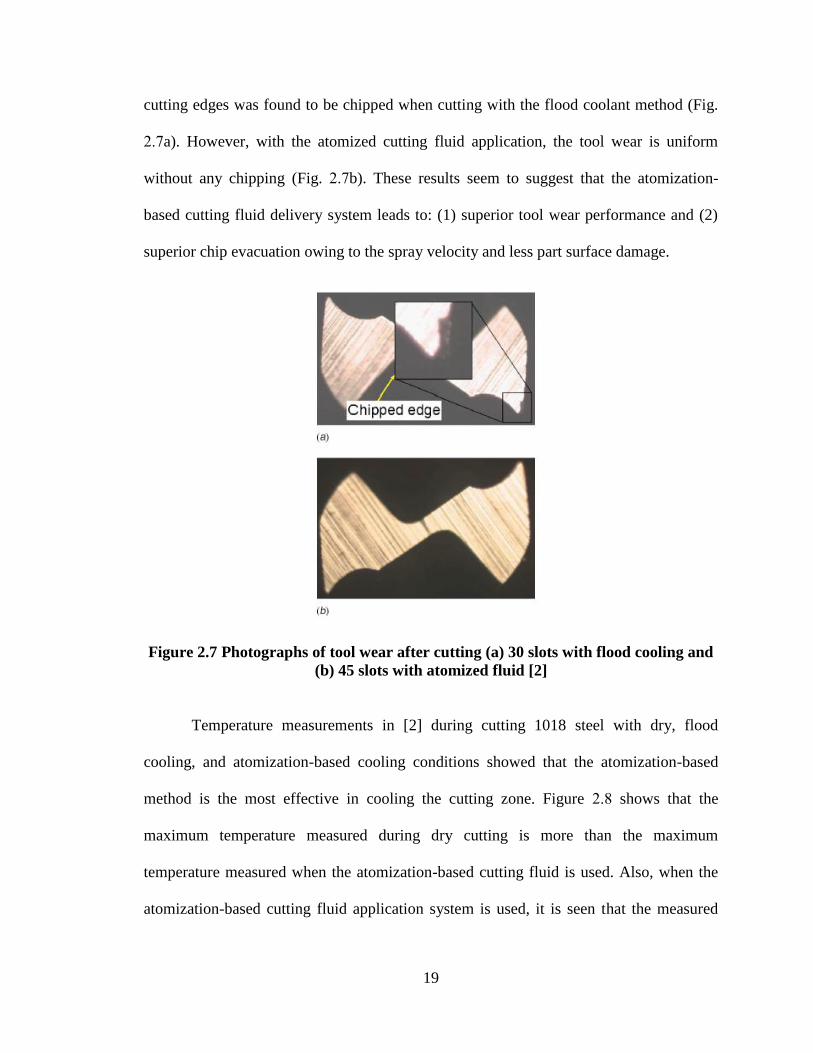
19
cutting edges was found to be chipped when cutting with the flood coolant method (Fig.
2.7a). However, with the atomized cutting fluid application, the tool wear is uniform
without any chipping (Fig. 2.7b). These results seem to suggest that the atomization-
based cutting fluid delivery system leads to: (1) superior tool wear performance and (2)
superior chip evacuation owing to the spray velocity and less part surface damage.
Figure 2.7 Photographs of tool wear after cutting (a) 30 slots with flood cooling and
(b) 45 slots with atomized fluid [2]
Temperature measurements in [2] during cutting 1018 steel with dry, flood
cooling, and atomization-based cooling conditions showed that the atomization-based
method is the most effective in cooling the cutting zone. Figure 2.8 shows that the
maximum temperature measured during dry cutting is more than the maximum
temperature measured when the atomization-based cutting fluid is used. Also, when the
atomization-based cutting fluid application system is used, it is seen that the measured
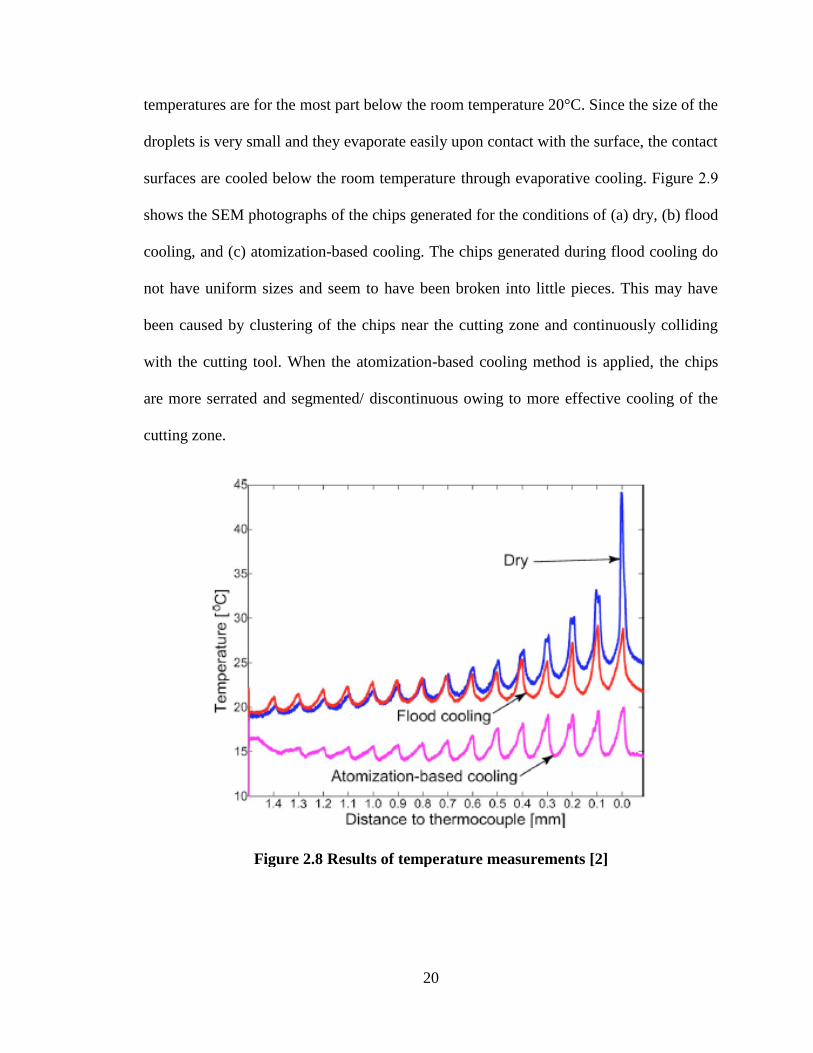
20
temperatures are for the most part below the room temperature 20°C. Since the size of the
droplets is very small and they evaporate easily upon contact with the surface, the contact
surfaces are cooled below the room temperature through evaporative cooling. Figure 2.9
shows the SEM photographs of the chips generated for the conditions of (a) dry, (b) flood
cooling, and (c) atomization-based cooling. The chips generated during flood cooling do
not have uniform sizes and seem to have been broken into little pieces. This may have
been caused by clustering of the chips near the cutting zone and continuously colliding
with the cutting tool. When the atomization-based cooling method is applied, the chips
are more serrated and segmented/ discontinuous owing to more effective cooling of the
cutting zone.
Figure 2.8 Results of temperature measurements [2]
21
Figure 2.9 Photographs of generated chips for the conditions of (a) dry, (b) flood
cooling, and (c) atomization-based cooling [2]
The experimental results in [2] for the effect droplet velocity are shown in Fig.
2.10 in terms of (a) peak-to- valley resultant forces and (b) surface roughness. It shows
that the droplet impingement velocity does not appreciably affect the cutting
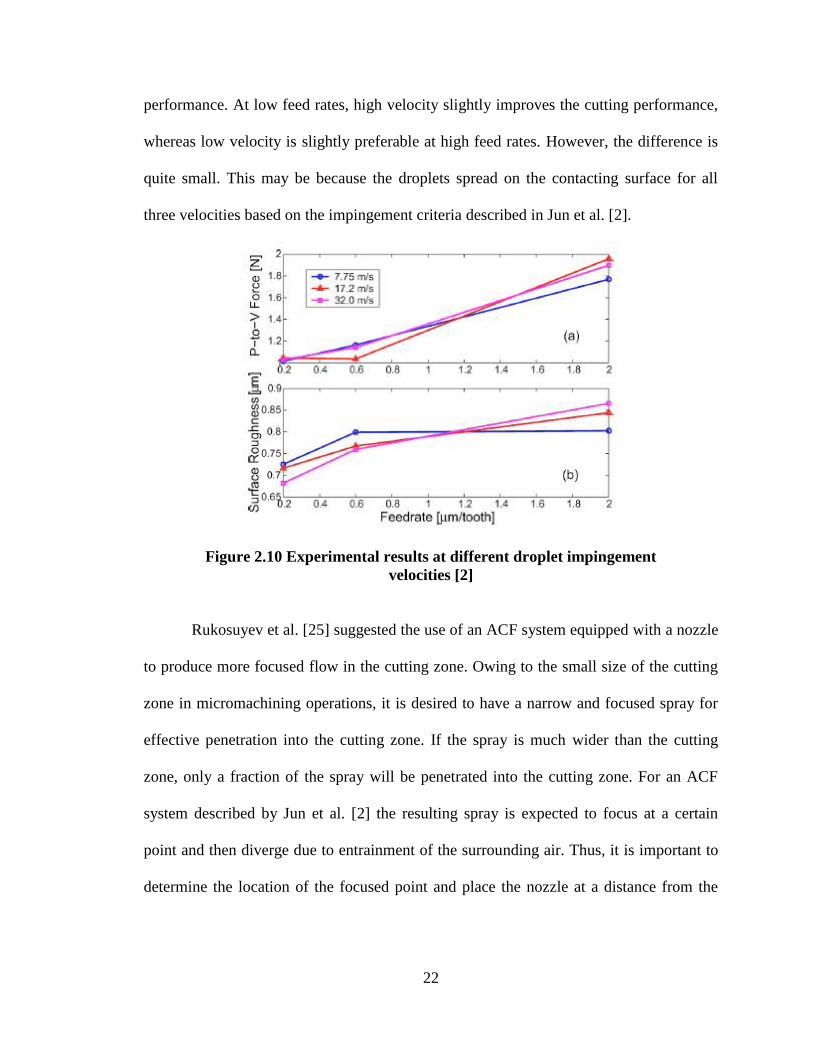
22
performance. At low feed rates, high velocity slightly improves the cutting performance,
whereas low velocity is slightly preferable at high feed rates. However, the difference is
quite small. This may be because the droplets spread on the contacting surface for all
three velocities based on the impingement criteria described in Jun et al. [2].
Figure 2.10 Experimental results at different droplet impingement
velocities [2]
Rukosuyev et al. [25] suggested the use of an ACF system equipped with a nozzle
to produce more focused flow in the cutting zone. Owing to the small size of the cutting
zone in micromachining operations, it is desired to have a narrow and focused spray for
effective penetration into the cutting zone. If the spray is much wider than the cutting
zone, only a fraction of the spray will be penetrated into the cutting zone. For an ACF
system described by Jun et al. [2] the resulting spray is expected to focus at a certain
point and then diverge due to entrainment of the surrounding air. Thus, it is important to
determine the location of the focused point and place the nozzle at a distance from the

23
cutting zone at the location such that maximum number of droplets are in the vicinity of
the cutting zone.
In the study of Rukosuyev et al. [25] two performance measures were defined for
sprays obtained using the ACF system: focus height and length (Fig. 2.11). Focus height
of the spray is the spray diameter at the focal point and focus length is the distance from
the nozzle end to the focal point. Experiments were conducted to examine the focus
height and focus length for varying velocities of air in the tube and the pipe (in a
configuration similar to Fig. 2.4). Photographs of the spray generated for the system
described by Rukosuyev et al. [25] is shown in Fig. 2.12. The velocity of air in the pipe is
referred to as mist velocity (Vm) and the velocity of air in the tube is referred to as spray
velocity (Vs). It was observed that an increase in the mist velocity leads to an increase in
the focus length and height and increase in the spray velocity leads to a decrease in the
focus length and height. Based on photographic evidence, it was shown that the number
of atomized droplets in the cutting zone is a function of the angle of the nozzle used and
its distance from the cutting zone. Thus, the positioning of the ACF system with respect
to the cutting zone is expected to be a critical component of the observed machining
performance. Although no machining experiments were conducted, their study suggested
that the design of the ACF system is important for effective cooling and lubrication
performance.

24
Figure 2.11 Performance measures [25]
Figure 2.12 Spray generated by the ACF system [25]
2.1.3 Effect of Surface Tension and Viscosity on Cutting Fluid
Functionality
Bittorf et al. [26] examined the link between fluid properties (viz., surface tension
and viscosity) and the functionality of the cutting fluid in a machining operation. Testing
was carried out on an instrumented drilling test-bed to evaluate the effect of the
properties on cutting temperatures and forces. The findings suggested that surface tension
and viscosity in a cutting fluid play important roles in cooling and lubrication of the

25
drilling process. From the experiments conducted it was concluded that a lower surface
tension will reduce temperatures during machining. Consequently, it was also established
that a lower surface tension, independent of the type of chemical used to lower it,
provided better cooling. It was hypothesized here that as the surface tension of the fluid
is decreased, the wettability of the fluid is increased. As the wettability is increased the
fluid coats the tool and workpiece more completely. The fluid is then able to transfer
heat away from the area of the tool and workpiece that it is in contact with. Separate
experiments with varying viscosities showed that as the viscosity of a solution increased
the machining forces decreased. As the viscosity of a solution increases the layer of
hydrodynamic lubrication increases and a larger gap is created between the chip and the
face of the drill. The larger gap creates less rubbing, or friction, between the chip and
tool. The reduction in friction leads to a reduction in frictional heat generated.
While the studies presented in Section 2.1 show that ACF systems effectively
reduce the temperature at the workpiece-tool interface and provide superior lubrication to
the cutting zone, there is a lack of a physics-based understanding of the phenomena
underlying cooling and lubrication performance of ACF systems in micro-machining
processes. In order to understand the mechanism underlying atomized cutting fluid
application, a study of droplet impingement dynamics and its effect on observed cooling
and lubrication is required. A review of fundamentals of droplet dynamics and spreading
behavior is presented in sections 2.2 and 2.3, respectively.

26
2.2 Fundamentals of Droplet Dynamics
2.2.1 Atomization Basics
Atomization refers to the process of breaking up bulk liquids into droplets. Once
the liquid is atomized, the droplets are moved in a controlled manner resulting in a spray.
The resulting spray is characterized by the droplet size and size distribution, and the flow
rate which are determined by the type of atomization method, the atomization parameters
and the liquid properties [27].
The common atomizing systems produce sprays by either shearing or by external
excitation [27]. In the first group are systems based on the shearing properties of co-
flowing jets. A large velocity difference between the liquid jet and the surrounding
medium (usually air) induces liquid surface instabilities and droplet peeling from the jet
surface. The jet is rapidly broken into lumps, filaments and droplets. This process takes
place when a high-speed liquid jet is injected into a quiescent or turbulent atmosphere, as
is the case, for instance, in diesel engines. Such systems may handle high liquid flow
rates (greater than 100 ml/min), but create widely dispersed sprays (in terms of droplet
sizes) and produce high-velocity droplets (greater than 10 m/s). The resulting droplet size
is a function of the jet velocity and the liquid properties [27]. A second group of spray
generators uses external excitation means. The instabilities of a free surface lead to the
breakup of the liquid, creating droplets. These instabilities are commonly created by
superimposed oscillations at ultrasonic frequencies. A mono-disperse spray is produced
in this way, but the liquid flow rate is small (below 100 ml/min). The droplet size is
nearly constant and is related to the oscillation frequency. By varying the oscillation
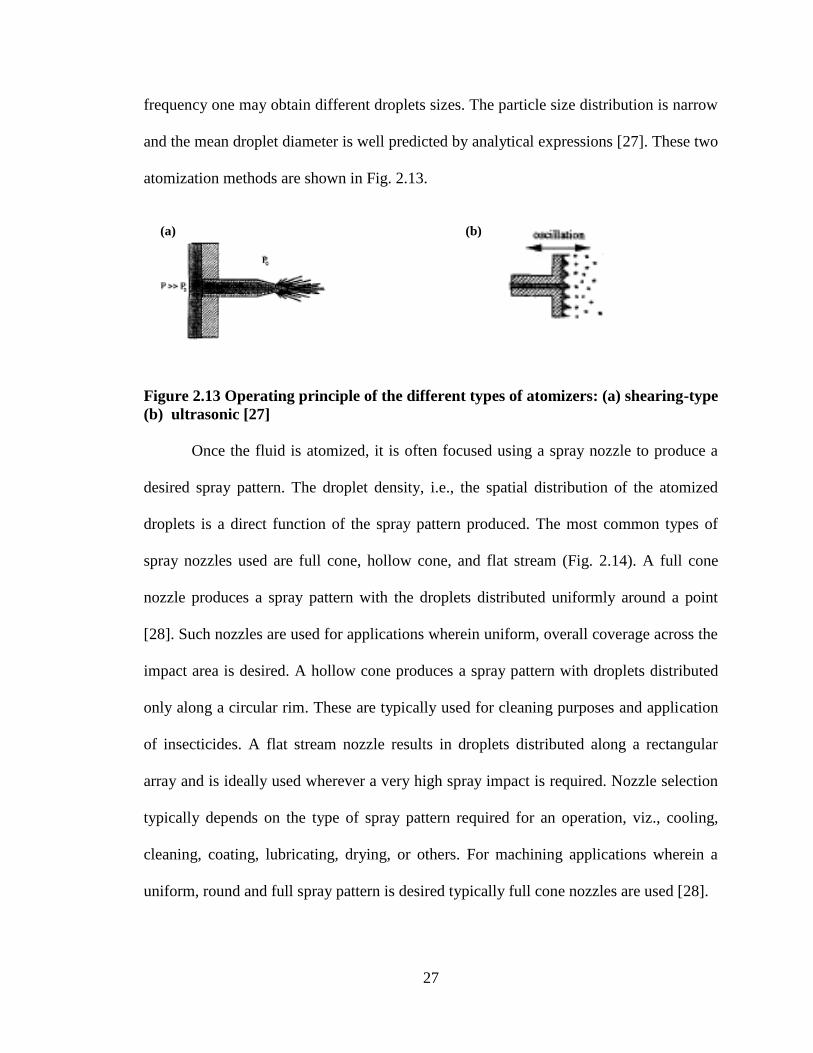
27
frequency one may obtain different droplets sizes. The particle size distribution is narrow
and the mean droplet diameter is well predicted by analytical expressions [27]. These two
atomization methods are shown in Fig. 2.13.
Figure 2.13 Operating principle of the different types of atomizers: (a) shearing-type
(b) ultrasonic [27]
Once the fluid is atomized, it is often focused using a spray nozzle to produce a
desired spray pattern. The droplet density, i.e., the spatial distribution of the atomized
droplets is a direct function of the spray pattern produced. The most common types of
spray nozzles used are full cone, hollow cone, and flat stream (Fig. 2.14). A full cone
nozzle produces a spray pattern with the droplets distributed uniformly around a point
[28]. Such nozzles are used for applications wherein uniform, overall coverage across the
impact area is desired. A hollow cone produces a spray pattern with droplets distributed
only along a circular rim. These are typically used for cleaning purposes and application
of insecticides. A flat stream nozzle results in droplets distributed along a rectangular
array and is ideally used wherever a very high spray impact is required. Nozzle selection
typically depends on the type of spray pattern required for an operation, viz., cooling,
cleaning, coating, lubricating, drying, or others. For machining applications wherein a
uniform, round and full spray pattern is desired typically full cone nozzles are used [28].
(a) (b)

28
Figure 2.14 Types of spray nozzles: (a) full cone, (b) hollow cone, and (c) flat stream
[28]
2.2.2 Droplet Impingement Dynamics
Droplet impact on solid and liquid surfaces is a key element of a wide variety of
phenomena encountered in technical applications, such as ink-jet printing, rapid spray
cooling of hot surfaces (turbine blades, rolls in rolling mills for steel production, lasers,
semiconductor chips, and electronic devices), fire suppression by sprinklers, internal
combustion engines (intake ducts of gasoline engines or piston bowls in direct-injection
diesel engines), spray painting and coating, and crop spraying [29]. Consequently, a large
base of literature has been developed over the years capturing the phenomena
accompanying droplet impact on solid and liquid surfaces under varying physical
conditions.
The early investigations of Wachters and Westerling [30], Levin and Hobbs [31],
and Stow and Hadfield [9] identified the parameters that influence the droplet
impingement dynamics are the diameter (d0) and velocity (u0) of the incident droplet, the
(a)
(b)
(c)

29
liquid viscosity (μ), density (ρ), and surface tension (σ). The conditions of the receiving
surface such as the film thickness (hf) for wet surfaces also play a major role in
controlling the outcome of a droplet-surface collision. The following non-dimensional
numbers based on the normal component of droplet velocity u0 have been identified as
the most relevant in determining the outcome of droplet impact
2
0 0 0 0
0
We , Re , Oh ,nd
o
fhu d u dh
dd
(2.1)
where, We is the Weber number, Re is the Reynolds number, Oh is the Ohnesorge
number, and hnd is the non-dimensional film thickness number [32]. Weber number is the
ratio of the droplet kinetic energy to the droplet surface energy, Reynolds number is the
measure of the ratio of droplet kinetic energy to the viscous dissipation upon impact, and
Ohnesorge number relates the viscous dissipation to kinetic and surface tension energy.
Based on the experimental observations, four impingement regimes have been identified
for droplet-wall or droplet-film interaction phenomenon: sticking, rebounding, spreading,
and splashing as presented pictorially in Fig. 2.15.
Figure 2.15 Various impingement regimes identified for droplet impact [8]
30
The stick regime occurs when an impinging droplet adheres to the wall or film
surface in a nearly spherical form. This often happens when the impact energy of the
droplet is extremely low, or the wall temperature is below the pure adhesion temperature
[8]. Jayaratne and Mason [33] studied the sticking of water droplets of radius 60-200 µm
at a clean air/water interface. The variable parameters in the system were the droplet
diameter, droplet velocity, and the angle of impact. Based on their experiments the
transition criteria for the stick regime was proposed as We < 5 [8]. The rebounding
regime is characterized by an impinging droplet bouncing off the wall or the film.
Rebounding occurs when the air layer trapped between the drop and the surface causes
low energy loss resulting in bouncing [8]. It is also facilitated by elevated surface
temperatures, especially when the Leidenfrost effect sets in and the drop is propelled
upward by vapor at its base [4]. Based on the experimental work of Rodriguez and
Meslor [34] and Stow and Hadfield [9] the transition criteria for the rebounding regime
has been found to be 5 ≤ We < 10. The third regime, spreading, is similar to the sticking
regime wherein the droplet deposits and spreads on the receiving surface. For spreading a
high initial impact energy is required. The experiments of Stanton and Rutland [8] show
that droplet spreading typically occurs when We ≥ 10. The final splashing regime occurs
when impact energy is such that the impact results in breaking of the impinging droplet
into multiple secondary droplets. The experimental work of Yarin and Weiss [35] showed
that the transition criteria for splashing is given by We ≥
1/2
1/4 3/4
0 0324d u f
, where f is
the frequency of the impinging droplets.

31
The above transition criteria help in identifying the outcome of a droplet-surface
collision. Based on the application, impact parameters are controlled such that desired
results are obtained. The study of Jun et al. [2] showed that for atomized cutting fluid
application, it is desired that the droplets spread as they impinge upon the cutting zone
and effectively wet the cutting zone through spreading. Thus, the droplet characteristics
and cutting fluid properties were kept at values that ensured that droplets undergo
spreading as they impinge upon the cutting zone. Although Jun et al. [2] applied the
above transition criteria to predict the outcome of droplet impact in the cutting zone, the
rotation of workpiece and/or tool is expected to change the droplet impact phenomena
indicating that above transition criteria should be applied to machining applications with
caution.
2.3 Droplet Spreading Behavior on a Stationary
Surface
2.3.1 Experimental Study
The phenomena accompanying droplet spreading on a stationary surface has been
the subject of many investigations. The droplet contact area and height upon impact and
its variation over time are required, especially in cases wherein heat transfer predictions
are made. Predictions for spray cooling, spray coating and ink-jet printing rely heavily on
the input provided by droplet spreading data available in the literature.

32
Rioboo et al. [36] studied the time evolution of droplets of initial diameter 1.2-4.9
mm, velocity 0.78-4.1 m/s, viscosity 0.3-934 cP, and surface tension 21-73 mN/m
spreading on solid, dry surfaces. The experiments showed that the time evolution of a
droplet spreading can be divided into four distinct phases: kinetic, spreading, relaxation
and equilibrium. The first stage represents the kinetic phase, when the contact diameter
increases with approximately square root of time following impact, followed by the
spreading phase where surface and viscous forces begin to play a role in the impact
evolution. The spreading phase is followed by a relaxation phase, which may have
different outcomes, depending mainly on the magnitude of the contact angle between the
surface and the liquid. In the final phase, the spreading droplet attains some constant
diameter (equilibrium phase). These stages are shown in Fig. 2.16. The boundaries of
these four distinct phases along with the spread factor (= diameter of the spreading
droplet / initial spherical droplet diameter) is shown in Fig. 2.16. The diverging lines in
Fig. 2.16 show the different possible outcomes, depending on the specific parameters of
the impact process.

33
Figure 2.16 Schematic representation of the spread factor with time [36]
Rioboo et al. [36] showed that in the kinetic phase the droplet is in the early stage
of impact and the droplet spreads under the influence of inertial forces alone with the
shape resembling a truncated sphere. During this phase no spreading lamella is yet visible
(Frame 1 in Fig. 2.17). The diameter grows according to a power law in time, with an
exponent lying between 0.45 and 0.57. The experiments done with varying parameters
showed that this phase of the impact process can be completely described by the impact
velocity and initial diameter. With increasing time, a lamella is ejected from the base of
the drop and forms a thin film bounded by a rim leading to an increase in the contact
diameter (frames 2-3 in Fig. 2.17). As the droplet spreads on the surface, the initial
kinetic energy of the pre-impact droplet is in-part irreversibly dissipated by the action of
viscosity and in-part converted to surface energy. The spreading phase has been observed
to be influenced by many factors: increasing the impact velocity or droplet diameter leads
to faster spreading, and increasing the surface tension or viscosity leads to slower

34
spreading. It was observed that the maximum diameter is smaller and is reached earlier
when the viscosity increases. The energy dissipated during droplet spreading increases
with increasing viscosity, thus the maximum spread diameter for a given impact energy
decreases inversely with increased viscosity. The effect of surface tension on spreading
behavior was studied by Zhang and Basaran [37]. Reduction in surface tension was
observed to enhance the spreading of the droplet across the substrate.
Figure 2.17 Droplet impact on a dry surface [36]
The study of Rioboo et al. [36] further showed that after the spreading phase the
drop may begin to recede. Frame 4 in Fig. 2.17 shows the droplet receding after reaching
a maximum spread diameter. The retraction occurs when the surface tension forces are
large to cause the droplet to recoil. Subsequently, the droplet undergoes oscillations on
the surface the physics of which is set by the competition between kinetic, surface and
viscous forces. After this phase, the equilibrium phase follows characterized by no
change in the droplet shape until the droplet volume decreases due to evaporation.
Based on the study of Rioboo et al. [36], Schiaffino and Sonin [37] and Lim et al.
[15] the various time scales for droplet spreading dynamics on a stationary surface are
listed in Table 2.1. τkin shows the time scale for which the kinetic phase lasts, τosc is the
time period of interfacial oscillations, τvis represents the time scale of the interfacial
oscillations. As shown in Table 2.1, Oh represents the ratio of the time scale of the
interfacial oscillation period to the viscous damping time. Similarly, the Weber number

35
can be considered as the square of the ratio of the kinematic spreading time scale and the
time scale of surface tension driven wetting resisted by inertia.
Table 2.1 Time scales and dimensionless numbers related to droplet spreading [15]
2.3.2 Modeling Spreading Behavior
Predicting Maximum Spread Diameter
For droplets spreading on a dry surface, the maximum spread diameter can be
accurately predicted using semi-empirical analytical models based on energy balance [4-
5]. The initial kinetic and surface energy partly dissipates due to viscous effects, the
remainder comprising the surface energy of the final droplet assumed to be at complete
rest. The droplet shape is either assumed to be a cylindrical disk or a spherical cap, and
the kinetic energy and surface energy expressions are calculated directly from initial and
final droplet geometries. However, the estimation of energy dissipated through viscous
forces varies from one study to other. The viscous dissipation is usually estimated with
certain simplifying assumptions and on the basis of available empirical information.
Chandra et al. [4] estimated viscous dissipation over the spreading process as
Time Scale
Kinetic 0 0
/kin
d u osc visOh
Oscillation 3
0oscd
2
osc kinWe
Viscous Damping 2
0visd vis kin
Re

36
0
s
st
v
V
E dVdt Vt (2.2)
where, is the viscous dissipation function, V is the droplet volume and ts is the time
taken by the droplet to spread to its maximum spread state. The viscous dissipation
function is given by fluid mechanics principles as
22 22 2
2
2
.
y yx x xz z
yz
v vv v vv v
x y z x y z x
vv
y z
(2.3)
Chandra et al. [4] assumed a significant velocity gradient to exist only normal to the
spreading direction and approximated the viscous dissipation function as
2
0u
h
(2.4)
indicating that significant viscous dissipation is assumed to occur over the entire
thickness of the spread droplet. The spreading time is estimated by assuming it to be the
time taken for the droplet height h to go from its maximum value d0 to 0 at velocity u0,
0
0
.s
dt
u
(2.5)
Using Eqs. 2.2-2.4 the total energy dissipated through viscous forces was estimated. The
spreading model of Chandra et al. [4] over-predicted the spread diameter by about 40%.
Pasandideh Fard et al. [39] improved the model of Chandra et al. [4] by assuming
significant dissipation to occur only within the boundary layer of the spreading droplet.
The dissipation function was thus given by
2
0u
(2.6)
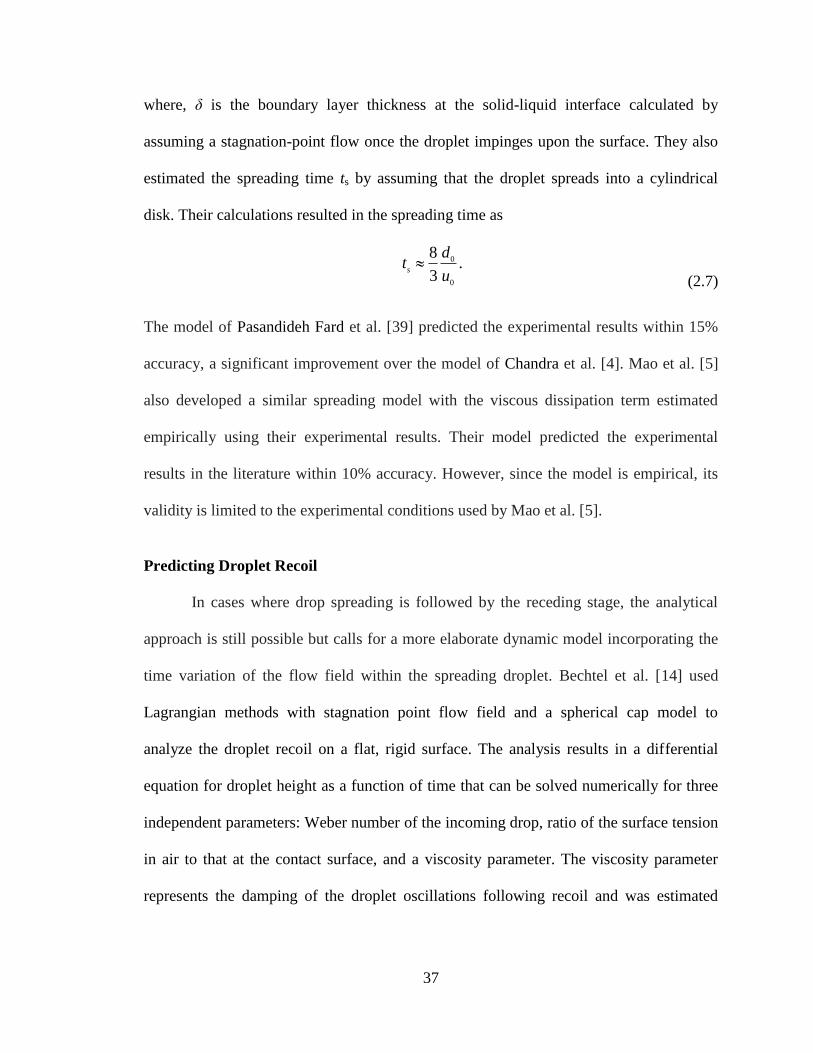
37
where, δ is the boundary layer thickness at the solid-liquid interface calculated by
assuming a stagnation-point flow once the droplet impinges upon the surface. They also
estimated the spreading time ts by assuming that the droplet spreads into a cylindrical
disk. Their calculations resulted in the spreading time as
0
0
8.
3s
dt
u
(2.7)
The model of Pasandideh Fard et al. [39] predicted the experimental results within 15%
accuracy, a significant improvement over the model of Chandra et al. [4]. Mao et al. [5]
also developed a similar spreading model with the viscous dissipation term estimated
empirically using their experimental results. Their model predicted the experimental
results in the literature within 10% accuracy. However, since the model is empirical, its
validity is limited to the experimental conditions used by Mao et al. [5].
Predicting Droplet Recoil
In cases where drop spreading is followed by the receding stage, the analytical
approach is still possible but calls for a more elaborate dynamic model incorporating the
time variation of the flow field within the spreading droplet. Bechtel et al. [14] used
Lagrangian methods with stagnation point flow field and a spherical cap model to
analyze the droplet recoil on a flat, rigid surface. The analysis results in a differential
equation for droplet height as a function of time that can be solved numerically for three
independent parameters: Weber number of the incoming drop, ratio of the surface tension
in air to that at the contact surface, and a viscosity parameter. The viscosity parameter
represents the damping of the droplet oscillations following recoil and was estimated
38
analytically by considering frictional stresses at an oscillating fluid boundary. Bechtel et
al. [14] used the results of Wachters and Westerling [30] to test the accuracy of the
model. Although their model did not predict the exact variation of droplet diameter with
time, they were able to capture the trend in the time evolution of droplet diameter.
Kim and Chun [40] extended the model of Bechtel et al. [14] by including the
case wherein the droplet spreads in form of a cylindrical disk (Fig. 2.18). They
experimentally studied the recoiling of droplet of different liquids on varying solid
surfaces. The viscous parameter of Bechtel et al. [14] was modified by including an
empirically determined dissipation factor. It was shown that the model closely predicts
the experimental results obtained for the varying dynamic impact conditions and surface
conditions. Based on their results, it was found that the spherical cap model and the
cylindrical disk model are valid for varying impact conditions. The spherical cap model
was observed to be appropriate for cases where the recoiling is resisted by viscosity and
the cylindrical disk model for cases where recoiling is resisted by inertia. The Ohnesorge
number was determined to be the parameter that governs the recoiling dynamics, with
high Oh number (>0.006) indicating recoil resisted by viscosity and low Oh number
(<0.006) indicating recoil resisted by inertia.
Figure 2.18 Geometry of the (a) spherical cap model (b) cylindrical disk model [40]
39
2.4 Droplet Behavior on a Rotating Surface
2.4.1 Droplet Impingement Dynamics
While the above modeling studies provide valuable insight into the droplet
dynamics upon impingement, these studies were limited only to stationary surfaces. The
presence of a rotating surface in a machining process is expected to change the dynamics
of the spreading process imposing a need to study droplet impingement on rotating
surfaces. A limited number of studies have been conducted for investigating the transition
criteria for droplets impinging upon a rotating surface. Povarov et al. [10] studied the
regimes of interaction of normal impact of droplets of diameter 0.3-4.0 mm and velocity
0.1-10 m/s with the boundary layer on a surface rotating at high speed of 10-120 m/s. In
their experiments, three types of interaction of the droplet with the rotating surface were
distinguished: 1) the droplet is captured by the surface on contact and spreads out over its
surface; 2) the droplet enters the boundary layer on the surface, is slightly deformed, and
is partially spread out over the surface and partially reflected from it; 3) the droplet is
strongly deformed in the boundary layer and, without touching the surface, is reflected
away from it. The solution of Navier-Stokes equation for boundary layer on an infinitely
large disk showed that the behavior of a droplet in the boundary layer is determined
mainly by the gradient of the normal velocity component of the impinging droplet.
The study of Povarov et al. [10] showed that the first form of interaction between
droplet and a rotating surface (no reflection from the surface) corresponds to a low
droplet velocity u0. The droplet passes through the boundary layer and, still undeformed,

40
enters into contact with the surface, gradually spreading out in the direction of rotation of
the surface. At higher values of surface speed (us) but for the same droplet velocity, the
second type of interaction is observed (Fig. 2.19a). As shown in Fig. 2.19a, for this case
a part of the droplet is reflected from the surface. As it approaches the surface, the droplet
is slightly deformed; the lower part of the drop contacts the disk surface and is carried
along with it, but the upper part is hardly displaced in the direction of rotation (frames 1-
3). Similar to the case of collision with a fixed surface, the bottom part of the droplet is
spread out in the region of contact. The motion of the surface promotes the spreading of
the contacting part of the drop. As a result of the velocity gradient in the boundary layer,
a wedge of air forms under the drop, which begins to rise (frames 4-8). Further increase
in surface speed leads to total reflection of the droplet on interaction with the boundary
layer of the rotating surface (Fig. 2.19b). In this case the droplet is significantly deformed
as it enters the boundary layer (frames 2 and 3), as a result both of the dynamic pressure
difference exerted on the droplet by the flow gradient and also of the reduction in static
pressure close to the surface of the rotating disk. The lower part of the droplet is
displaced in the direction of rotation of the surface, and under the action of the increasing
lift force begins to rise above the surface.

41
Figure 2.19 Drop trajectory and cine-film frames for collision of droplet (d0 = 2 mm,
u0 = 1.2 m/sec) with surface of rotating sphere: a) for us = 30 m/sec; b) for us = 60
m/sec [10]
In the study of Povarov et al. [10] it was further shown that the droplet-surface
interaction conformed to a similar pattern for the entire droplet diameters investigated:
0.5 < d0 < 4.0 mm. The boundaries between the observed types of collision for droplets of
various diameters are shown in Fig. 2.20. The boundary between interactions of types I
(complete "adherence") and II (partial reflection) was found to be practically independent
of the droplet diameter. In the experiments, type-I collisions were observed over the
whole range of droplet diameters tested when u0/us < 0.15. The position of the boundary
between types II and III (complete reflection) is determined by the droplet diameter.
Figure 2.20 shows that for surface speeds under 10 m/s and droplet speeds over 1 m/s, the

42
droplet collision lies in region I irrespective of the droplet diameter showing that the
droplet undergoes complete adherence upon impact.
Figure 2.20 Effect of velocity ratio on reflection of droplet from a rotating surface:
1) droplet diameter d0 = 0.3 mm; 2) 0.8 mm; 3) 4 mm. I) region of complete
adherence; II) partial reflection; III) total reflection [10]
Mundo et al. [11] investigated the transition from deposition to splashing for
droplets impinging upon a rotating surface. The experiments were conducted for varying
initial droplet diameters (60 < d0 < 150 µm), velocities (12 < u0 < 18 m/s), fluid
viscosities (1.0 < µ < 2.9 cP) and surface tensions (22 < σ < 72 mN/m). The liquids used
to establish the different viscosities and surface tensions were ethanol, water and a
mixture of water-sucrose-ethanol. The experiments showed that for droplet impact at high
Reynolds numbers (Re > 500) splashing is observed whereas for low Reynolds number

43
deposition is observed as shown in Fig. 2.21. A schematic view of the splashing and
deposition process is shown in Fig. 2.22.
Figure 2.21(a) Splashing of a liquid droplet with Re = 598.8, Oh = 0.0518 on a
smooth surface, (b) Deposition of a liquid droplet with Re = 251.4, Oh = 0.0492
smooth surface [11]
Figure 2.22 Schematic of the (a) splashing process, (b) deposition process [11]
Mundo et al. [11] showed that at high Re numbers, as the droplet touches the
surface, a liquid film spreads outwards. A corona around the deforming droplet is formed
and grows in time as the droplet fluid continues to feed the film. Once the lower half of
the droplet has undergone deformation, the total volume flow rate into the wall film
44
begins to decrease. Thus the corona, having been stretched in its radial expansion, also
now has less fluid feeding the film and hence becomes thinner. An instability develops
leading to a circumferential wreath which propagates upward in the corona and finally
results in a disintegration into secondary droplets. At low Re numbers, the liquid film
spreads around the point of impingement, but there is not enough momentum normal to
the wall to form a corona. Rather, the kinetic energy necessary to overcome surface
tension and gravity to form a corona is dissipated during the deformation process. The
deposition of a droplet on a rough surface at low Reynolds number was found to be
similar to the deposition process for the technically smooth surface. It was concluded that
an increase in the surface roughness suppresses the splashing of the impinging droplet.
The observed limits of deposition and splashing in Mundo et al. [11] were
correlated in terms of the Re and Oh numbers. A remarkably strong correlation was
observed given by the relation K = OhRe1.25
. A value of K exceeding 57.7 leads to
incipient splashing, whereas K less than 57.7 leads to complete deposition of the liquid,
as illustrated in Fig. 2.23. The strong correlation shown in Figure 2.23 indicates that in
the case of splashing, the influencing factor is the momentum of the primary droplets in
the direction normal to the surface and not the total momentum vector.

45
Figure 2.23 Limits for splashing and deposition of droplets on a rotating surface
[11]
2.4.2 Droplet Spreading Behavior
In order to understand the effect of surface speed on the impingement behavior of
droplets for spray coating and spray cooling applications, Chen and Wang [12] studied
the impact of water droplets with sizes 500-900 μm upon a rotating Teflon surface.
Figure 2.24 shows the coordinate system used to study the droplet impact. If the impact
angle relative to the rotating surface is θ then in frame of reference of the surface the
normal and tangential droplet speeds are given, respectively, by
0 sinnu u , and 0 costu R u (2.8)
where R is radius of the workpiece, is rotational speed of the workpiece. The velocity
expressions in Eqn. 2.8 are used to define modified Weber numbers given by
2 200 sinn
dWe w
(2.9)

46
0 20( cos )t
dWe R w
(2.10)
where, Wen is the normal Weber number, Wet is the tangential Weber number. The
normal Weber number represents the ratio of the normal-direction collisional energy to
the surface energy of the drop before impact and the tangential Weber number represents
the ratio of the tangential-direction collisional energy to the surface energy of the drop
before impact. Based on the relative values of Wen and Wet three impingement regimes,
viz., partial rebound, deposition, and split deposition were observed. The photographic
representation of these three regimes is shown in Fig. 2.25. Figure 2.26 shows the
observed impact patterns are plotted as a function of Wen and Wet.
Figure 2.24 Variables and coordinates system [12]

47
Figure 2.25 Impact regimes for varying values of Wen and Wet numbers [12]
Figure 2.26 Impact regimes (a) Partial rebound (b) Deposition (c) Split deposition
[12]
48
As shown in Fig. 2.26, partial rebound results from close-to-normal impacts with
medium to high Weber numbers. The droplet hits the surface and spreads radially into a
rather axi-symmetric disk. The retraction of the disk generates an upward internal flow,
which stretches the end of the liquid rod into one drop jumping off the surface; while
leaving a portion of the liquid on the surface, as shown in Fig. 2.25a. Deposition refers to
an impact in which the drop simply spreads and retracts into one drop sticking to the
surface (see Fig. 2.25b). Deposition happens in low-energy impacts or impacts with a
medium tangential Weber number. Split deposition denotes an impact which results in
the drop being split into two droplets, as shown in Fig. 2.25c. This type of impact
happens at a high tangential Weber number; the high tangential speed stretches the drop
into an elliptical disk, if the elongation is sufficient, the retraction of the disk would
generate a necking in the middle to produce two droplets. In Fig. 2.26 the broken lines
show the transition between the three regimes. For small Wet, if Wen <10, all impacts
resulted in deposition. For Wen>10, as Wet was increased, the minimal Wen required for
the onset of rebound was seen to increase almost linearly. In other words, it is more
difficult for a drop to rebound from a moving surface, as the surface speed goes up. As to
the split deposition regime, for Wen<40, the Wet required to split the drop remained about
the same (i.e. Wet ~100). Then for Wen>40, the Wet required for split deposition rapidly
increased, again almost linearly.
In order to find the relationship between droplet elongation and Wet, Chen and
Wang [12] defined dimensionless excess spread area as
2
2
0
m mA
bd dX
d
(2.11)

49
where, b is the droplet contact length at the condition of maximum spread and dm is
droplet contact length on a stationary surface calculated for same impact conditions.
Figure 2.27 shows the dimensionless excess spread area plotted against tangential Weber
number for varying values of normal Weber number (23<Wen<81) in the range. An
almost linear relationship exists between XA and Wet showing that higher Wet induces
more dimensionless excess spread area. This implies that for higher Wet or higher droplet
velocity, the droplet spreads more on a rotating surface in comparison to a stationary
surface.
While the above studies give insight into the regime in which droplet impact will
lie once it hits a rotating surface, no investigation was made to study the droplet
spreading behavior on the rotating surface. The experiments of Chen and Wang [12]
showed that the contact area of droplet spreading upon a rotating surface is different from
the droplet impinging under the same conditions upon a stationary surface. However, no
relationship between the spread area and droplet characteristics and fluid properties was
derived. Further droplet study needs to be conducted to understand the effect of droplet
characteristics, cutting fluid properties, and surface speed on the droplet spreading
behavior on a rotating surface so as to elucidate the physics underlying cooling and
lubrication performance of ACF systems in micromachining.

50
Figure 2.27 Dimensionless excess spread area versus Wet [12]
2.5 Performance Evaluation of an ACF System in
Micromachining Processes
In order to predict the cooling and lubrication performance of ACF systems in
micromachining processes, droplet cooling and lubrication models need to be applied to
the machining system. Sections 2.5.1-2.5.2 reviews the models developed in the
literature.
2.5.1 Evaporative Cooling Models
The study of Jun et al. [2] showed that the cooling effect of atomized droplets is
attributed to evaporation of the impinging droplets. Study of heat transfer from a solid
surface to droplets has been the subject of many experimental and analytical

51
investigations [41-42]. The analytical models capturing the heat transferred from surface
to droplet require droplet contact area, height and contact angles along with other
physical inputs. Based on the boundary condition at the solid-liquid interface (constant
heat flux or constant temperature) different mathematical formulations are available. For
ACF systems, heat is continuously being lost from the cutting zone resulting in a drop in
the temperature, indicating that constant temperature boundary condition cannot be
applied rather constant heat flux is more appropriate.
di Marzo et al. [41] developed a semi-analytical model for heat transfer from a
solid surface to a droplet for constant and uniform heat flux at the solid-liquid boundary
and found it to accurately capture the transient surface temperature distribution. They
further commented that for multi-droplet systems, the temperature distribution can be
predicted by super-position of the transient surface thermal behavior due to a single
evaporating droplet. The temperature at a point situated at distance r from the center of
the droplet base was given by
0 0 1
0
( ) ( ) ( )e
s
s
h V dT T J r J R erf
R k
(2.12)
where, eh is the latent heat of vaporization of the droplet, V is the droplet volume, R is
radius of droplet base, sk is the thermal conductivity of the solid surface, is the thermal
diffusivity of the solid surface, is the total time taken for droplet to evaporate, 0J and 1
J
are the Bessel functions and erf is the error function. A drawback of the above model is
that it requires the evaporation time of the droplet to be estimated experimentally.
Therefore, the applicability of the above model is limited.

52
Sadhal and Plesset [42] derived an approximate solution for overall heat flow
from a solid surface to a droplet by solving the steady heat-conduction equation. The
geometry consisted of a spherical segment droplet on a semi-infinite solid. In obtaining
the solution it was assumed that heat is transported to or from the solid only through the
droplet and that there is perfect thermal contact at the solid-liquid interface. The model of
Sadhal and Plesset [42] yield simple mathematical expression for predicting the heat flow
to the droplet thereby being an attractive model that can be used for estimating cooling in
micromachining processes. The heat transferred from the surface to one droplet is given
by
0
0 1sk T A Aq
h (2.13)
where, sk is the thermal conductivity of the surface, 0T is the ambient air temperature, A
is the contact area at the droplet base.0
1A is the integral given by
2
0
1
0 0
/ sech2 d
[tanh tanh / ]
f s
f s
k kA
k k
(2.14)
where, fk is the thermal conductivity of the cutting fluid, and 0 is the contact angle at the
solid-liquid interface.
The above studies show that the cooling effect generated by atomized droplets is
captured mathematically using evaporative cooling models. The model of Sadhal and
Plesset [42] can be applied directly to predict the heat transferred from a solid surface to
the droplet.

53
2.5.2 Lubrication Models
Limited experimental studies have been done to investigate the lubrication
mechanism when cutting fluid is applied in form of mist in machining processes. Liu et
al. [43] studied the effect of water vapor as a lubricant in machining and explained the
friction mechanism by assuming vapor access into the cutting zone through capillary
action. Their study showed that water vapor possesses better lubricating capacity because
of its excellent penetration performance and formation of low shear strength lubrication
layer. Machado and Wallbank [44] based on their experimental evidence for conditions at
the tool-chip interface argued that that penetration through capillary action is not likely. It
was suggested that a more probable mechanism appears to be formation of barrier layers
at the tool-chip interface resulting in reduced contact at the interface leading to reduction
in cutting forces.
Lubrication between two surfaces can be achieved by using a thin viscous film to
prevent solid to solid contact. The film must generate extremely large pressure
differences between the solids so that the friction generated due to contact is reduced.
Langlois [45] assumed a couette flow between two plates sliding over each other with
liquid in between and derived the expression for lubrication force generated by the liquid
(Fig. 2.28).
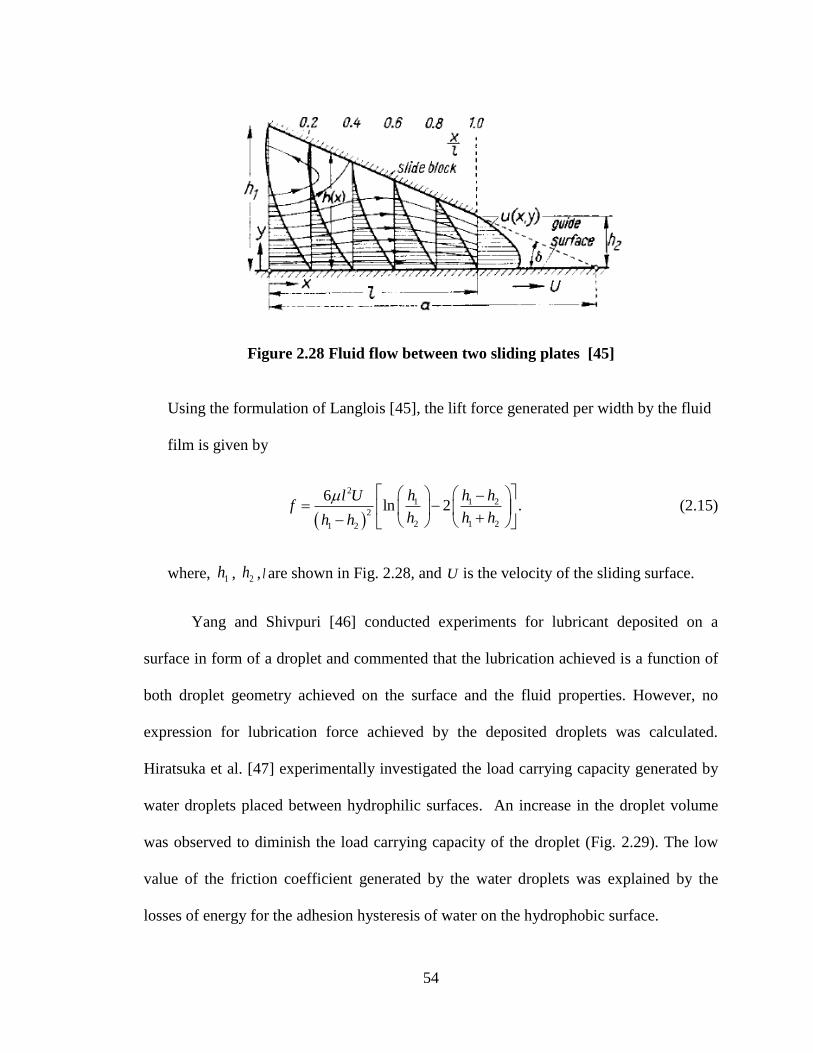
54
Figure 2.28 Fluid flow between two sliding plates [45]
Using the formulation of Langlois [45], the lift force generated per width by the fluid
film is given by
2
1 1 2
2
2 1 21 2
6ln 2 .
h h hl Uf
h h hh h
(2.15)
where, 1h , 2h , l are shown in Fig. 2.28, and U is the velocity of the sliding surface.
Yang and Shivpuri [46] conducted experiments for lubricant deposited on a
surface in form of a droplet and commented that the lubrication achieved is a function of
both droplet geometry achieved on the surface and the fluid properties. However, no
expression for lubrication force achieved by the deposited droplets was calculated.
Hiratsuka et al. [47] experimentally investigated the load carrying capacity generated by
water droplets placed between hydrophilic surfaces. An increase in the droplet volume
was observed to diminish the load carrying capacity of the droplet (Fig. 2.29). The low
value of the friction coefficient generated by the water droplets was explained by the
losses of energy for the adhesion hysteresis of water on the hydrophobic surface.

55
The above studies show that atomized droplets are capable of providing effective
lubrication between two solid surfaces. Though no specific models have been developed
that can be directly applied to predict lubrication achieved by a droplet, the lubrication
model of Langlois [45] appears to be capable of capturing the lubrication effect generated
by the droplet.
Figure 2.29 Load-carrying capacity R of the volume of water droplets V placed
between the hydrophobic surfaces [47]
2.6 Gaps in Knowledge
Atomization-based cutting fluid (ACF) systems have been found to be preferable
over the conventional flood cooling methods for improving the cutting performance in
micromachining operations as they effectively reduce the temperature at the workpiece-
tool interface through evaporative cooling and provide superior lubrication to the cutting
zone. While such ACF systems appear to be beneficial, there is a lack of a physics-based
understanding of the phenomena underlying cooling and lubrication performance of ACF
systems in micro-machining processes.

56
First, there is a lack of micro-machining studies that identify the combined effects
of droplet characteristics and cutting fluid properties on the cooling and lubrication
performance of ACF systems. Though the study of Jun et al. [2] established that the
droplet characteristics and cutting fluid properties effect the performance of ACF
systems, no investigation of their specific effect on the observed cutting performance was
made.
Second, there is a lack of understanding of droplet spreading behavior on a
rotating surface, in particular, as a function of droplet characteristics, fluid properties and
surface speed. A limited number of studies have been done to investigate the droplet
impingement dynamics on rotating surfaces. Although the experimental work of Chen
and Wang [12] showed that the contact area for the droplets is dependent on the surface
speed, they did not investigate the spreading behavior as a function of specific fluid
properties, viz., surface tension and viscosity. Further, the droplet diameters used in this
study were also significantly larger (about 10 times) to those encountered in the atomized
cutting fluid application.
Third, modeling work on droplet spreading on a rotating surface has not been
undertaken. A spreading model that predicts droplet geometry resulting from spreading
on a rotating surface will be important to predict the cooling achieved by a droplet in the
cutting zone and the lubrication force generated at the tool-chip interface. A large number
of analytical and numerical models have been developed for droplet impact on stationary
surfaces so as to enable design of better spray processes. Although these studies give
valuable insight into the methodology adopted for modeling droplet spreading behavior, a

57
spreading model which takes into account the speed of the rotating surface needs to be
developed.
Lastly, no study has been done to understand the relationship between droplet
spreading behavior on a rotating surface and the cooling and lubrication performance of
an ACF system in micro-machining processes. The mist-based cutting fluid applications
presented in the literature have mostly been experimental with little emphasis on
investigating the relationship between the system parameters and machining conditions
on the observed cooling and lubrication performance.
The limitations of the experimental work on the physics of droplet spreading on a
rotating surface and its relation to cooling and lubrication of ACF systems provide the
motivation for the research presented in the next four chapters. The first limitation is
addressed by conducting micro-turning experiments to understand the effect of droplet
speed and cutting fluid properties on cutting forces and cutting temperatures. Droplet
impingement experiments are then conducted on a rotating surface using fluids of
different surface tension and viscosity to address the second limitation. Next, a droplet
spreading model is developed to predict droplet spreading behavior on a rotating surface.
The last limitation is addressed by validating a micromachining model using the
spreading model to predict the cooling and lubrication performance of an ACF based
micro-turning application and conducting a parametric study to identify the significant
factors affecting the performance of an ACF system.
58
Chapter 3
Micro-turning experiments
Atomization-based cutting fluid (ACF) system was used by Jun et al. [2] in micro-
milling operation, with promising performance shown as compared to dry and flood
coolant applications. However, no investigation of effect of droplet characteristics and
cutting fluid properties on cutting performance was done. In this chapter, an ACF system
is used for micro-turning experiments to understand the effect of droplet speed and
cutting fluid properties on cutting forces and cutting temperatures. The chapter is divided
into three subsections. Section 3.1 presents the experimental setup and design, followed
by section 3.2 wherein experimental results are presented and discussed. The chapter
summary is presented in Section 3.3.
3.1 Experimental Setup and Design
3.1.1 Test-bed Design
A schematic of the ACF system employed for micro-turning operation is shown in
Fig. 3.1. This set-up is similar to that used in the study by Jun et al. [2]. The ACF system
consists of an ultrasonic vibration-based atomizer, a cutting fluid reservoir, and a
regulated air supply. The atomizer uses ultrasonic vibrations of frequency 1 kHz to
atomize the cutting fluid. Once the fluid atomizes, the droplets are carried through a pipe.
In the center of the pipe lies a smaller tube that carries regulated air supply. The droplets

59
flowing through the pipe are carried to the cutting zone by the air jet flowing through the
small tube. The inner diameter of the pipe and tube is 10 mm and 4 mm, respectively.
The diameter of the atomized droplets was measured using Hirox CX-10C optical
microscope and was observed to lie in the range 8-15 µm. The atomization rate of the
ultrasonic atomizer was measured to be about 1 ml/min. The air supply was regulated
using an external pressure control valve to maintain the air jet speed in the range 0.5-10
m/s.
Figure 3.1 Schematic of the ACF system used for micro-turning operation
The ACF system shown in Fig. 3.1 is used as a separate unit on Microlution Inc.’s
three-axis CNC micro-scale machine tool (mMT) developed at the Micro-Scale
Machining and Machining Tool Research Laboratory at the University of Illinois at

60
Urbana-Champaign. The testbed is equipped with AC linear motors and an electric NSK
spindle supported by air bearings. The maximum operational speed of the electric spindle
is 50,000 RPM. The axis encoders have a resolution of 0.02 µm. The mMT is typically
used for micro-milling and micro-drilling operations. In order to use it for a micro-tuning
operation, the workpiece is mounted in the spindle and the tool mounted on the xy stage
(Fig. 3.2). The system was installed in a room with ambient temperature 24±1ºC and
relatively humidity 60±1%. A photo of the experimental setup is shown in Fig. 3.2. The
mist is directed towards the cutting zone from below.
Figure 3.2 Setup of the micro-turning ACF system
Atomized Mist
Force Sensor (Behind)
Tool
Thermocouple
Steel Rod
0.9 mm
z
y x

61
3.1.2 Cutting Force and Temperature Measurement
The machinability measures for the micro-turning experiments were the cutting
force and cutting temperature. A Kistler load cell (9018 tri-axial) was used to measure the
cutting force along the x, y, and z axes during the turning process at a sampling frequency
of 30 kHz. The load cell was mounted behind the tool holder (Fig. 3.2). The magnitude of
cutting force measured in the direction of the feed motion (z-direction) has been seen to
best reflect the effect of cutting fluid penetration [48]. Therefore, the force in the feed
direction is used here as a measure to evaluate the machining performance of the various
cutting fluids.
An Omega SA1XL-J-SB type thermocouple (range 0-750°C) along with Analog
Devices 5B47 linearized thermocouple input module was used to measure the
temperatures during cutting at a sampling frequency of 800 Hz. Thermocouple with a
protective steel jacket was used to avoid interference with the electric voltage signals
from the machine tool. The thermocouple was calibrated using ice water and boiling
water and was found to have a calibration constant of 0.8 °C/volt. The thermocouple
junction was positioned 0.9 mm away from the nose of the cutting tool and thermocouple
wire attached to the shank of the cutting tool using superglue (Fig. 3.3). The maximum
temperature recorded during the cutting operation was used as the cutting temperature
measure for the associated test. Figures 3.4 and 3.5 show the typical cutting force and
cutting temperature plots for the experiments presented in this study.

62
Figure 3.3 Cutting tool- thermocouple assembly
Figure 3.4 Typical cutting force plot (in the direction of feed)
Wire glued to the tool shank
Tape Thermocouple
Cutting Tool

63
Figure 3.5 Typical cutting temperature plot
3.1.3 Experimental Design
Three test fluids are used here to study the effect of fluid properties on cutting
performance: De-ionized (DI) Water and the semi-synthetic fluids Castrol Clearedge
6519 at 12.5% dilution and Castrol Clearedge 6519 at 25% dilution. The Castrol
Clearedge 6519 at 12.5% dilution is prepared by adding 12.5 ml of Castrol Clearedge
6519 to 87.5 ml DI Water. Castrol Clearedge at 25% dilution is by adding 25 ml of
Castrol Clearedge 6519 to 75 ml DI Water. The physical properties of the three cutting
fluids are listed in Table 3.1. These cutting fluids were chosen to study separately the
effect of surface tension and viscosity on the cooling and lubrication performance. Note
that the 12.5% Castrol 6519 and 25% Castrol 6519 have the same surface tension but
different viscosities, whereas, DI water and 12.5% Castrol 6519 have similar viscosity
Maximum cutting
temperature

64
but varying surface tension. While a high concentration of 25% Castrol 6519 is not used
in flood-coolant applications, the atomization-based cutting fluid application consumes
only a very small amount of cutting fluid ( about 1 ml for each turning operation reported
here), which makes the use of such a high percentage of semi-synthetic fluids to be
economically viable. Furthermore, as borne out by the machining results in the following
section, such a high percentage of Castrol 6519 significantly reduces the cutting forces
encountered in micro-scale turning.
Table 3.1 Cutting Fluid Properties
Fluid Surface Tension
(mN/m)
Density
(kg/m3)
Viscosity
(cP)
Thermal Conductivity
(W/m-K)
DI water 72 1000 1.01 0.58
12.5% Castrol 6519 42 996.25 1.49 0.52
25% Castrol 6519 42 992.5 2.91 0.46
Micro-turning experiments were conducted on a 1018 steel rod of diameter 6 mm.
Since the minimum chip thickness ratio (λ) for 1018 steel is 0.6 [49], in order to keep
cutting in the shearing domain, turning experiments were conducted at a feed of 5
µm/rev, which corresponds to λ=1.4. A length of 1 mm was turned for each test. Tests
were conducted with the three cutting fluids at different droplet speeds in the range 0-10
m/s. A total of 18 of such experiments were conducted. A test was also conducted under
dry conditions. The distance between the plane where droplets exit the ACF system and
the cutting zone was maintained at 20 mm for all the tests. Table 3.2 lists the
experimental conditions used for the micro-turning tests.

65
Table 3.2 Experimental conditions for the micro-turning tests
Workpiece 6mm diameter 1018 steel rod
Tool Right-handed Cubic Boron Nitride (CBN), Edge Radius= 3.5 µm,
Nose Radius= 75 µm, Rake Angle= 0°, Included Angle= 60°
Cutting Speed 250 m/min
Radial Depth of Cut 45 µm
Feed-Per-Revolution 5 µm
Droplet Speed 0.5, 2, 4, 6, 8, 10 m/s
Droplet Size 8-15 µm
Atomization Rate 1 ml/min
Cutting Fluids DI Water, 12.5% Castrol 6519, 25% Castrol 6519
3.2 Experimental Results
3.2.1 Cutting Temperatures
Figure 3.6 shows the variation of cutting temperature with droplet speed for the
three cutting fluids. The data for cutting temperature is also listed in Table 3.3. Note that
the temperature for dry cutting is 91°C. All the fluids show significant temperature drop
when compared to dry cutting operation indicating effective cooling of the cutting zone.
It can be seen that 12.5% Castrol 6519 generates the lowest cutting temperatures, or cools
the cutting zone the most. At the same time, 25% Castrol 6519 cools more than DI water,
but less than 12.5% Castrol 6519.
The trend in the cutting temperatures suggests an interaction effect between the
fluid surface tension and viscosity. At low values of viscosity (DI Water, 12.5% Castrol
6519), lower surface tension (12.5% Castrol 6519) generates lower cutting temperatures.
However, as the viscosity of the cutting fluid increases from 1.49 cP (12.5% Castrol
6519) to 2.91 cP (25% Castrol 6519), it appears to offset the advantage offered by the
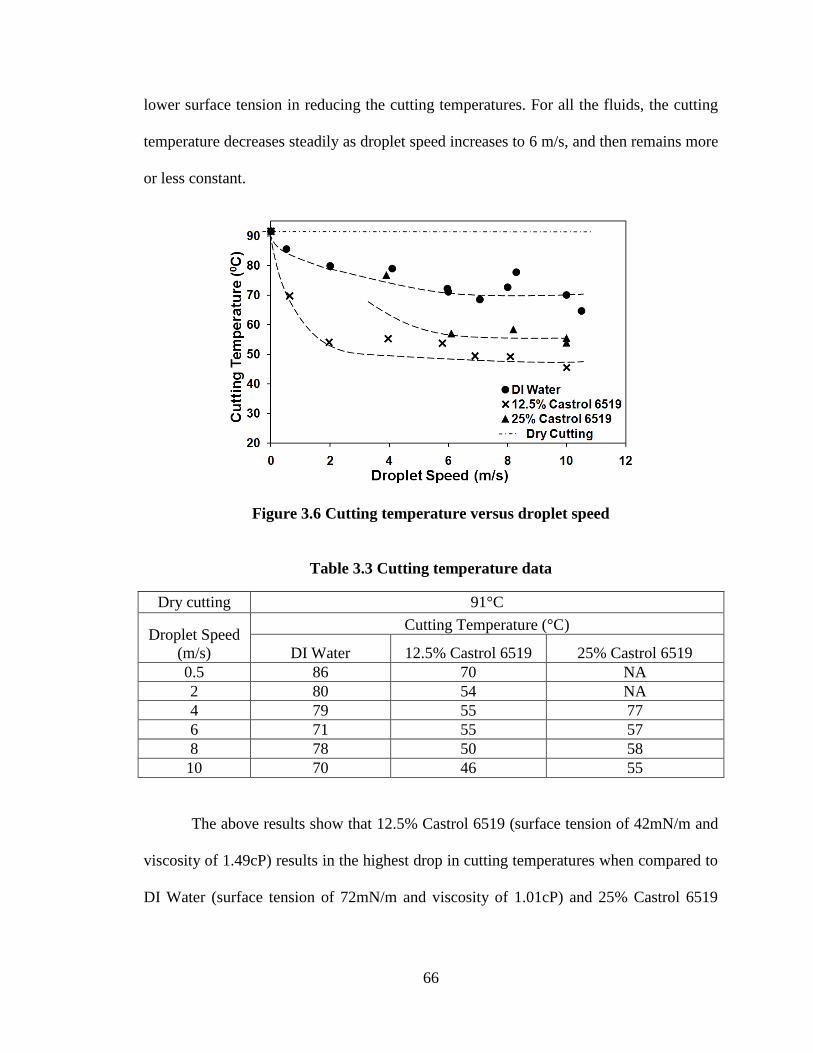
66
lower surface tension in reducing the cutting temperatures. For all the fluids, the cutting
temperature decreases steadily as droplet speed increases to 6 m/s, and then remains more
or less constant.
Figure 3.6 Cutting temperature versus droplet speed
Table 3.3 Cutting temperature data
Dry cutting 91°C
Droplet Speed
(m/s)
Cutting Temperature (°C)
DI Water 12.5% Castrol 6519 25% Castrol 6519
0.5 86 70 NA
2 80 54 NA
4 79 55 77
6 71 55 57
8 78 50 58
10 70 46 55
The above results show that 12.5% Castrol 6519 (surface tension of 42mN/m and
viscosity of 1.49cP) results in the highest drop in cutting temperatures when compared to
DI Water (surface tension of 72mN/m and viscosity of 1.01cP) and 25% Castrol 6519

67
(surface tension of 42mN/m and viscosity of 2.91cP). The study of Jun et al. [2] showed
that the cooling in atomized cutting fluid application is attributed to evaporative cooling.
The study of diMarzo et al. [41] showed that a faster evaporating droplet implies
increased heat transfer from the solid surface to the droplet. Thus, lowest cutting
temperatures are expected to be generated by the fluid that evaporates at the highest rate.
Based on the trends in cutting temperatures it is expected that droplets of 12.5% Castrol
6519 evaporate fastest and the droplets of DI Water evaporate at the slowest rate. The
study of Chandra et al. [49] showed that for fluids with varying surface tension, highest
evaporation rate is observed for droplets of fluids with lowest surface tension. Low
surface tension leads to more spreading generating droplets with larger spread area on the
surface and smaller thickness leading to faster transfer of heat from the surface and a
higher evaporation rate. Thus, it is expected that the droplets of 12.5% Castrol 6519
spread the most whereas the droplets of DI Water spread the least on the rotating surface.
The machining experiments reveal that the cutting temperatures reduce with an
increase in the droplet speed to about 6 m/s after which little change in temperature is
seen. Therefore, for the case in point it is likely that the evaporation rate increases with
increase in the droplet speed to about 6 m/s and remains more or less constant for droplet
speeds beyond 6 m/s. Based on the study of Mao et al. [5], an increase in droplet speed
leads to increased spreading on the surface. The evaporation rate, therefore, increases as
the speed of the impinging droplet increase. Further research is required to understand the
more and less constant cutting temperatures observed beyond the droplet speeds of 6 m/s.

68
3.2.2 Cutting Forces
Figure 3.7 shows the steady-state cutting force (measured in the direction of feed)
recorded at varying droplet speeds for the three cutting fluids. The cutting force data is
also listed in Table 3.4. The results suggest that for DI Water and 12.5% Castrol 6519
there is no significant effect of droplet speed on the cutting force. Therefore, the cutting
forces for these two fluids are averaged across droplet speeds. The average cutting force
with 90% statistical confidence intervals was found to be 1.367 + 0.118 N for DI water
and 1.255 + 0.173 N for 12.5% Castrol 6519. The corresponding value for dry cutting
conditions is 1.55 N.
Figure 3.7 Cutting force versus droplet speed

69
Table 3.4 Cutting force data
Dry cutting 1.55 N
Droplet Speed
(m/s)
Cutting Force (N)
DI Water 12.5% Castrol 6519 25% Castrol 6519
0.5 1.39 1.09 NA
2 1.32 1.12 NA
4 1.18 1.28 0.44
6 1.43 NA 0.60
8 1.26 1.15 1.25
10 1.44 1.15 0.93
The average cutting force values indicate that there is no strong evidence of
reduction in forces with the use of DI Water or 12.5% Castrol 6519. However, as the
fluid viscosity increases to 2.91cP (due to increase in oil content) for 25% Castrol 6519,
the cutting forces are seen to be significantly lower (almost 50%). Further, it appears that
for this fluid the cutting forces are lowest for low droplet speed and while increasing as
droplet speed increases are still lower than for the other two fluids. This indicates that
even at high cutting speeds encountered in micro-machining, atomized cutting fluid can
have effective penetration into the cutting zone and produce a lubricating effect.
As presented above, DI Water and 12.5% Castrol 6519 generate average cutting
force of 1.367 N and 1.255 N, respectively and 25% Castrol 6519 generates the lowest
cutting forces at all droplet speeds tested. Thus, for the fluids tested it appears that the
lubricity is a stronger function of the fluid viscosity (attributed to the oil content of the
cutting fluid) and a weaker function of the fluid surface tension. The study of Langlois
[45] showed that lubrication achieved between two sliding surfaces is a strong function of
the fluid viscosity and the area covered by the intermediate fluid film and its thickness.
Effective lubrication is achieved by a fluid with high viscosity indicating effective
70
friction reduction owing to the increased oil content. Thus, the lubrication force generated
in the cutting zone is a stronger function of the fluid viscosity and has a weaker
dependence on the spread area and height of the impinging droplets.
Based on above observations, it can be concluded that for atomized cutting fluid
application, choice of the cutting fluid is dependent on the desired machining
performance. Although, low surface tension fluid is observed to reduce the cutting
temperatures, a change in viscosity owing to oil content appears to have differing effects
on cutting force and on cutting temperature. For a given surface tension, the fluid with
higher viscosity generates lower cutting forces but higher cutting temperatures. However,
the reduction in cutting forces is much greater than the modest increase in cutting
temperature.
3.3 Chapter Summary
Micro-turning experiments are conducted to examine the effect of fluid properties
on cutting forces and cutting temperatures. The experiments indicate that a cutting fluid
with low surface tension and low viscosity generates lower cutting temperatures. Cutting
temperatures are observed to decrease steadily with an increase in the droplet speed up to
6 m/s beyond which no significant reduction in temperature is seen. A fluid with low
surface tension and high viscosity is observed to generate lower cutting forces. The
experimental results indicate that fluid surface tension and viscosity (owing to increased
oil content) values result in a trade-off in the machining performance for the atomized
cutting fluid application. A decrease in surface tension is observed to aid cooling in the

71
cutting zone. However, for a given surface tension value, the fluid with higher viscosity
significantly reduces the cutting force but results in a modest increase in the cutting
temperatures.
The micro-turning experiments reported here give valuable insight into the
dependence of the cutting performance on the droplet speed and the fluid properties for
atomized cutting fluid application. The experiments also give useful information about
the spreading behavior underlying the observed cooling and lubrication performance. In
order to better understand the physics underlying cooling and lubrication in ACF
systems, spreading and evaporation behavior of droplets impinging upon a rotating
surface needs to be studied. In chapter 4, single droplet impingement experiments are
conducted on a rotating surface using fluids of different surface tension and viscosity
values to understand the spreading and ensuing evaporative behavior of a droplet
impinging upon a rotating surface.

72
Chapter 4
Single Droplet Impingement Experiments
The micro-turning experiments presented in Chapter 3 suggest that the cooling
and lubrication performance of ACF systems is determined by the spreading behavior of
the droplets impinging upon the cutting zone. To better understand the physics
underlying the cooling and lubrication mechanism of ACF systems, the droplet spreading
behavior on a rotating surface needs to be studied. To this end, in this chapter controlled
single droplet impingement experiments are designed and conducted to understand the
spreading behavior of a droplet impinging upon a rotating surface. These experiments are
designed such that the droplet speed, surface speed, and fluid physical properties can be
controlled independently to study their effect on the droplet spreading behavior. Such
insights will make it possible to better design both the cutting fluids and the atomization
process for efficient performance of ACF systems in micromachining processes. The
chapter is divided into three subsections. Section 4.1 presents the experimental setup and
design, followed by section 4.2 wherein experimental results are presented. Section 4.3
discusses the result of the micro-turning experiments of chapter 3 in light of the single
droplet impingement experiments. The chapter summary is presented in Section 4.4
.
73
4.1 Experimental Setup and Design
4.1.1 Test-bed Design
The experimental setup to study the single droplet behavior on rotating surfaces is
shown schematically in Fig. 4.1. The experimental setup consists of a droplet-on-demand
(DOD) unit comprising of a droplet dispense head (1) and a signal driver (2) (supplied by
Engineering Arts, Phoenix, AZ) along with an electric motor and a spindle (3), a high-
speed video camera (4) with light source (5). The DOD unit works in conjunction with a
flexible waveform signal driver that generates on command either a single droplet or a
stream of droplets. The signal driver feeds a non-contact glass piezo-dispenser with an
orifice. An orifice of diameter 32 µm is used that generates droplets in the size range of
30-50 µm depending on the fluid type and the driver amplitude. The droplet velocities
range from 2 m/s to 3 m/s depending on the amplitude of the signal produced by the
driver.
The rotating workpiece is a 3 mm diameter steel rod with surface roughness (Ra)
of 0.035 µm. The rotational speed of the spindle is 1000-32,000 RPM and is used to
control the speed of the rotating workpiece. A Phantom v7.0 high speed camera is used
with a 20X magnification lens to capture the droplet impact. The camera is tilted at 5°
with respect to the axis of the rotating cylinder so as to capture clearly the droplet
interacting with the moving surface. The system was installed in a room with ambient
temperature 24±1 ºC and relatively humidity 60±1 %. A photo of the setup is provided in
Fig. 4.2.

74
Figure 4.1 Schematic of the single droplet generator experimental setup
4.1.2 Experimental Design
The three fluids used in the micro-turning experiments reported in chapter 3 (viz.,
DI water, 12.5% and 25% Castrol 6519) were used for the single droplet impingement
experiments. Apart from the three cutting fluids, three additional fluids, viz., 0.0001%
Steel Rod
Lens
Droplet Generator
Nozzle
Light Source
3 mm
Figure 4.2 Experimental setup for single droplet impingement study

75
Neodol-6, 2% Pluronic L-64, and 0.01% Neodol-6 (listed in Table 4.1 with physical
properties) were used to identify the effect of fluid properties on the spreading and
evaporative behavior of droplets impinging on a rotating surface. The additional fluids
were prepared by adding varying quantities of surfactants (percentage and chemical type
listed in Table 4.1) to DI water. These additional fluids were chosen to study separately
the effect of surface tension and viscosity on the droplet behavior. Note that the 12.5%
Castrol 6519, 25% Castrol 6519, and 2% Pluronic L-64 have the same surface tension but
different viscosities, whereas, DI water, 0.0001% Neodol-6, 2% Pluronic L-64, and
0.01% Neodol-6 have the same viscosity but varying surface tension. Single droplet
impingement experiments were conducted with all the six fluids at three surface speeds
of 0.8, 2.5 and 4.2 m/s. These speeds were chosen to capture the speed range encountered
in micro-machining commonly.
A burst of 200 droplets at a frequency of 50 Hz was used for the videography of
droplet impact at a rate of 24,000 frames-per-second with 2 µs exposure. The images
were captured at a resolution of 320x240 pixels with 42 µs time difference between
consecutive images. Approximately 9000 frames were captured for each experimental
condition. The images from the videos were then extracted and the size measurements
made using Vision Gauge Imaging & Measuring Software.
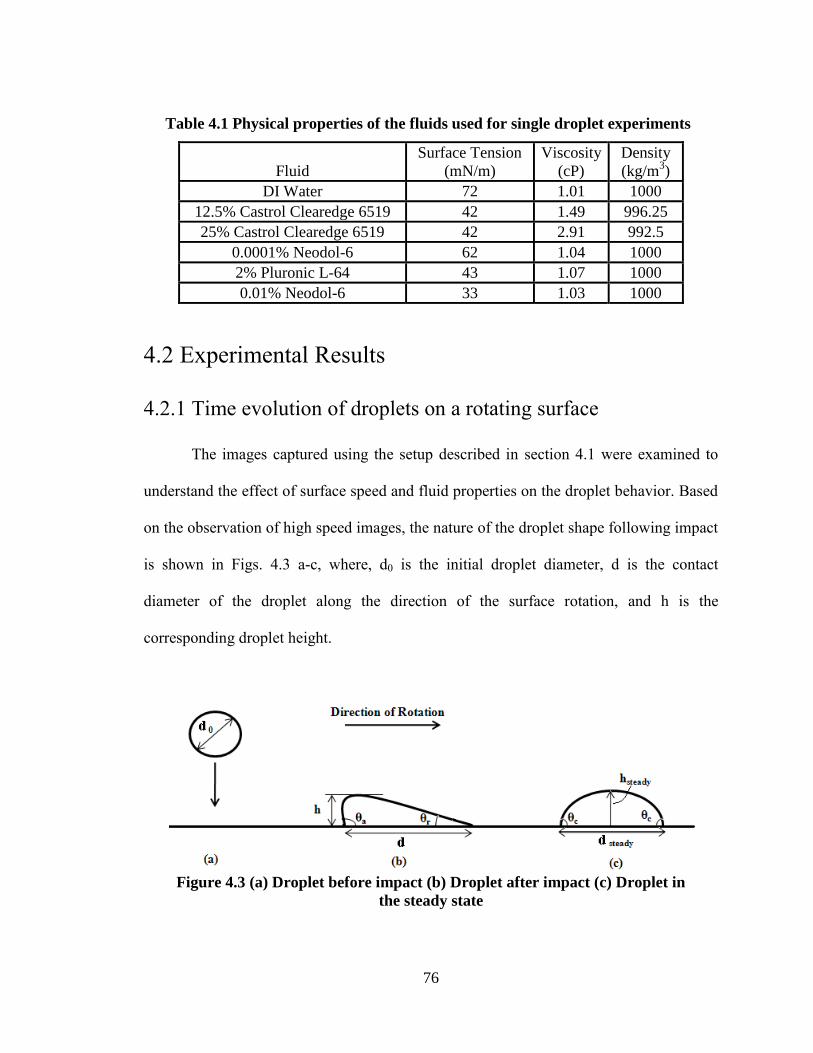
76
Table 4.1 Physical properties of the fluids used for single droplet experiments
Fluid
Surface Tension
(mN/m)
Viscosity
(cP)
Density
(kg/m3)
DI Water 72 1.01 1000
12.5% Castrol Clearedge 6519 42 1.49 996.25
25% Castrol Clearedge 6519 42 2.91 992.5
0.0001% Neodol-6 62 1.04 1000
2% Pluronic L-64 43 1.07 1000
0.01% Neodol-6 33 1.03 1000
4.2 Experimental Results
4.2.1 Time evolution of droplets on a rotating surface
The images captured using the setup described in section 4.1 were examined to
understand the effect of surface speed and fluid properties on the droplet behavior. Based
on the observation of high speed images, the nature of the droplet shape following impact
is shown in Figs. 4.3 a-c, where, d0 is the initial droplet diameter, d is the contact
diameter of the droplet along the direction of the surface rotation, and h is the
corresponding droplet height.
Figure 4.3 (a) Droplet before impact (b) Droplet after impact (c) Droplet in
the steady state
77
After impact, the droplet takes the shape of an asymmetrically-deformed
ellipsoidal cap as it spreads on the surface, as shown in Fig. 4.3 b. The advancing and
receding contact angles are shown as θa and θr. In the steady state, the droplet is observed
to have the shape of a spherical cap with contact angle, θc, as shown in Fig. 4.3 c. The
ratios d/d0 and h/d0 are used here to study the evolution of the droplet shape with time on
a rotating surface.
The temporal evolution of droplets impacting a dry, stationary surface has been
characterized through four distinct phases, viz., kinetic phase, spreading phase, relaxation
phase, and evaporation phase [36]. Similar phases are observed here for droplets
impacting a rotating surface. The boundaries of these four distinct phases along with the
ratios d/d0 and h/d0 for DI Water droplets impacting a surface rotating at speeds of 0.8
m/s and 2.5 m/s are shown in Figs. 4.4a-b, respectively. The time scale in Figs. 4.4a-b is
logarithmic. It is observed that for a given droplet (fluid properties, droplet size, and
droplet speed) and surface characteristics (material and surface roughness), the phase
duration and the ratios d/d0 and h/d0 are a strong function of the surface speed. The initial
droplet diameter in this case is 50 m and the impact velocity is 2 m/s.

78
(a) surface rotating at 0.8m/s
(b) surface rotating at 2.5m/s
Figure 4.4 Time evolution for DI Water droplet on a surface rotating (scale bar=
20µm)
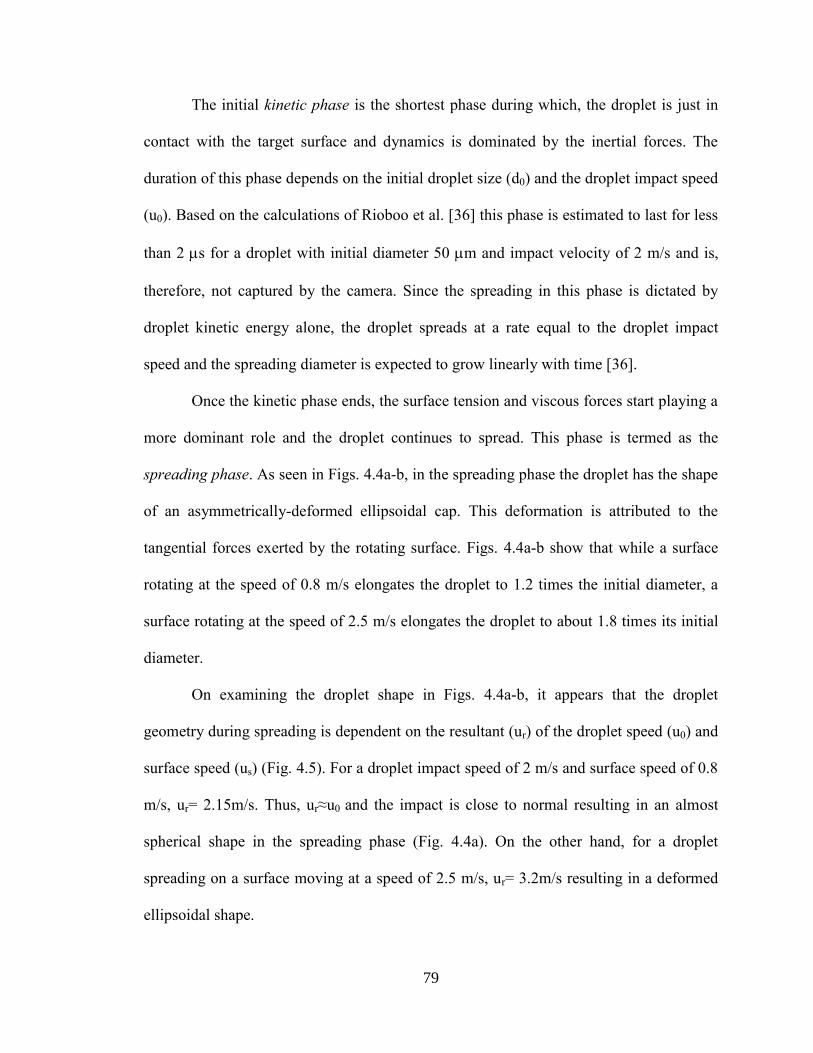
79
The initial kinetic phase is the shortest phase during which, the droplet is just in
contact with the target surface and dynamics is dominated by the inertial forces. The
duration of this phase depends on the initial droplet size (d0) and the droplet impact speed
(u0). Based on the calculations of Rioboo et al. [36] this phase is estimated to last for less
than 2 s for a droplet with initial diameter 50 m and impact velocity of 2 m/s and is,
therefore, not captured by the camera. Since the spreading in this phase is dictated by
droplet kinetic energy alone, the droplet spreads at a rate equal to the droplet impact
speed and the spreading diameter is expected to grow linearly with time [36].
Once the kinetic phase ends, the surface tension and viscous forces start playing a
more dominant role and the droplet continues to spread. This phase is termed as the
spreading phase. As seen in Figs. 4.4a-b, in the spreading phase the droplet has the shape
of an asymmetrically-deformed ellipsoidal cap. This deformation is attributed to the
tangential forces exerted by the rotating surface. Figs. 4.4a-b show that while a surface
rotating at the speed of 0.8 m/s elongates the droplet to 1.2 times the initial diameter, a
surface rotating at the speed of 2.5 m/s elongates the droplet to about 1.8 times its initial
diameter.
On examining the droplet shape in Figs. 4.4a-b, it appears that the droplet
geometry during spreading is dependent on the resultant (ur) of the droplet speed (u0) and
surface speed (us) (Fig. 4.5). For a droplet impact speed of 2 m/s and surface speed of 0.8
m/s, ur= 2.15m/s. Thus, ur≈u0 and the impact is close to normal resulting in an almost
spherical shape in the spreading phase (Fig. 4.4a). On the other hand, for a droplet
spreading on a surface moving at a speed of 2.5 m/s, ur= 3.2m/s resulting in a deformed
ellipsoidal shape.

80
Figure 4.5 Relationship between droplet and surface velocities
At the end of the spreading phase, the surface forces may or may not cause the
droplet to recoil. This phase is known as the relaxation phase (Figs. 4.4a-b). In the
relaxation phase shown in Fig. 4.4a, the droplet does not recoil and no change in either
droplet diameter (d) or height (h) is observed. However, for the relaxation phase depicted
in Fig. 4.4b, the droplet is observed to recoil. There is decrease in the droplet diameter (d)
that results in a corresponding increase in the height (h) of the droplet in order to keep its
volume constant (the evaporation has not yet started). It is observed that in either case, at
the end of the relaxation phase, the droplet takes the shape of a spherical cap (Fig. 4.4a-b)
similar to that observed for droplets on a stationary surface [4-5]. However, the droplet
diameter after retraction depends on the surface speed. In Fig. 4.4a, where surface speed
is 0.8 m/s, at the end of the relaxation phase d/d0=1.2 while in Fig. 4.4b where surface
speed is 2.5 m/s, d/d0=1.7 at the end of the relaxation phase.
In the next phase, viz., the evaporative phase, the droplet volume begins to reduce
owing to evaporation. The evaporation phase may or may not coincide with the relaxation
phase depending on the thermodynamical fluid properties, the area occupied by the
droplet on the surface, the droplet thickness, and the surface temperature [49]. As can be
seen in Figs. 4.4a-b, in these single droplet experiments the evaporation of DI water
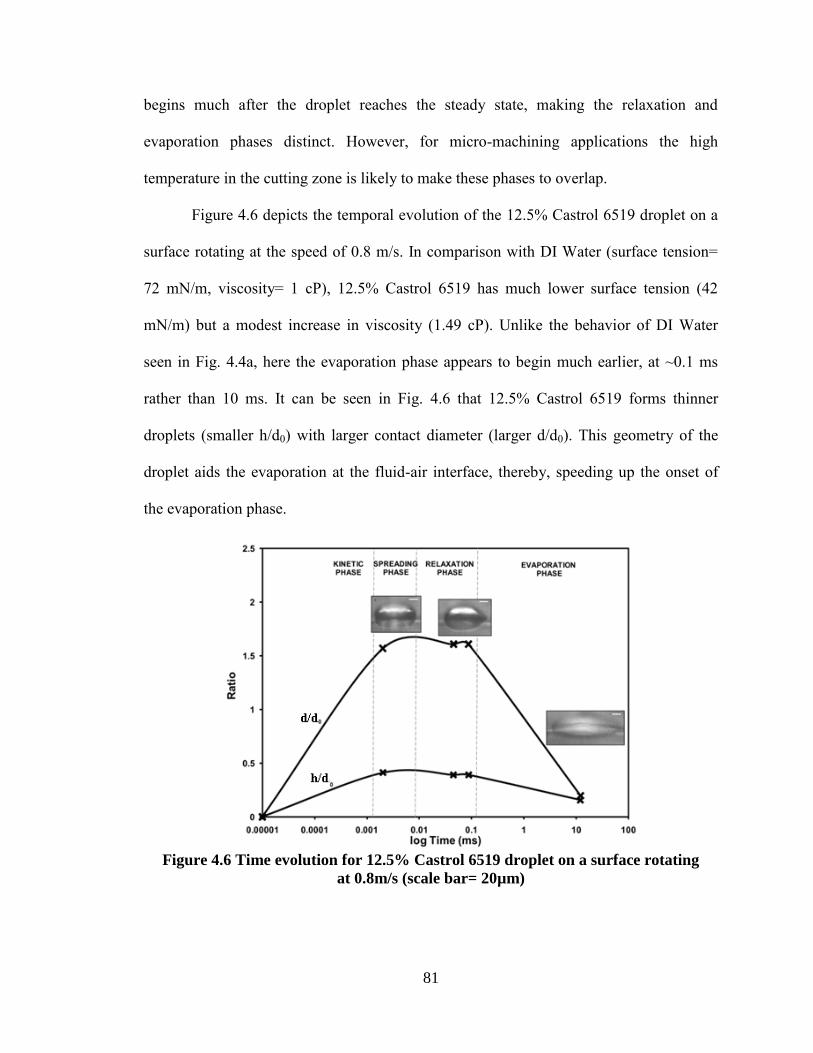
81
begins much after the droplet reaches the steady state, making the relaxation and
evaporation phases distinct. However, for micro-machining applications the high
temperature in the cutting zone is likely to make these phases to overlap.
Figure 4.6 depicts the temporal evolution of the 12.5% Castrol 6519 droplet on a
surface rotating at the speed of 0.8 m/s. In comparison with DI Water (surface tension=
72 mN/m, viscosity= 1 cP), 12.5% Castrol 6519 has much lower surface tension (42
mN/m) but a modest increase in viscosity (1.49 cP). Unlike the behavior of DI Water
seen in Fig. 4.4a, here the evaporation phase appears to begin much earlier, at ~0.1 ms
rather than 10 ms. It can be seen in Fig. 4.6 that 12.5% Castrol 6519 forms thinner
droplets (smaller h/d0) with larger contact diameter (larger d/d0). This geometry of the
droplet aids the evaporation at the fluid-air interface, thereby, speeding up the onset of
the evaporation phase.
Figure 4.6 Time evolution for 12.5% Castrol 6519 droplet on a surface rotating
at 0.8m/s (scale bar= 20µm)

82
The spreading and evaporative behavior of a droplet sheds light on the extent of
lubrication and heat transfer from the rotating surface. This behavior is discussed in the
following two sections.
4.2.2 Droplet Behavior in the Spreading Phase
In order to evaluate the effect of surface speed on the droplet spreading behavior,
droplet contact diameter (d) is measured in the spreading phase. The dimensionless
diameter (d/d0) is compared for fluids of varying surface tension and viscosity to
understand the combined effect of surface speed and fluid properties on the droplet
spreading behavior. For all the data presented in this section, the contact diameter is
measured ~30 µs after impact for a surface rotating at 0.8 m/s and 2.5 m/s. For a surface
rotating at 4.2 m/s, the contact diameter is measured ~15 µs after the impact as the high
surface speed makes the droplet go out of the field view of the camera rendering no
information of the contact diameter at 30 µs.
Figures 4.7a-c shows the contact diameter of droplets of 12.5% Castrol 6519
impinging on surface of varying speed. An increase in surface speed from 0.8 m/s to 2.5
m/s increases the contact diameter from 80 µm to 102 µm. On further increasing the
surface speed to 4.2 m/s, the contact diameter is observed to increase to 140 µm in just
half the time. Thus, for a rotating surface the spreading behavior is a function of the
surface speed.
Figures 4.8a-b show the contact diameter of droplets of DI water and 12.5%
Castrol 6519 impinging on a surface rotating at 4.2 m/s. While DI water droplet spreads

83
to 112 µm in 12 µs, the droplet of 12.5% Castrol 6519 spreads to 145 µm in about the
same time, 15 µs. Figure 4.8 shows that fluids with varying physical properties have
different contact diameter even at a relatively high surface speed of 4.2 m/s.
Figure 4.7 Droplets of 12.5% Castrol 6519 spreading on a surface moving at (a)
0.8 m/s (b) 2.5 m/s (c) 4.2 m/s
t= 15µs
140µm
(c)
46µm
(a)
47µm
t= 30µs
80µm
(b
) t= 30µs
102µm 47µm

84
Figure 4.8 (a) Droplet of DI Water spreading on a surface moving at 4.2 m/s (b)
Droplet of 12.5% Castrol 6519 spreading on a surface moving at 4.2 m/s
Figure 4.9 shows the variation of dimensionless diameter (d/d0) with surface
tension for fluids with viscosity ~1 cP. The droplet speed is 2 m/s for all the data points
presented in Fig. 4.9. In general, the dimensionless diameter decreases with an increase in
surface tension, which is similar to the droplet behavior on stationary surface [37]. The
dimensionless diameter is observed to have a direct dependence on the surface speed as
well. Irrespective of the surface tension value, an increase in surface speed is seen to
increase the dimensionless diameter, which implies more spreading on the surface.
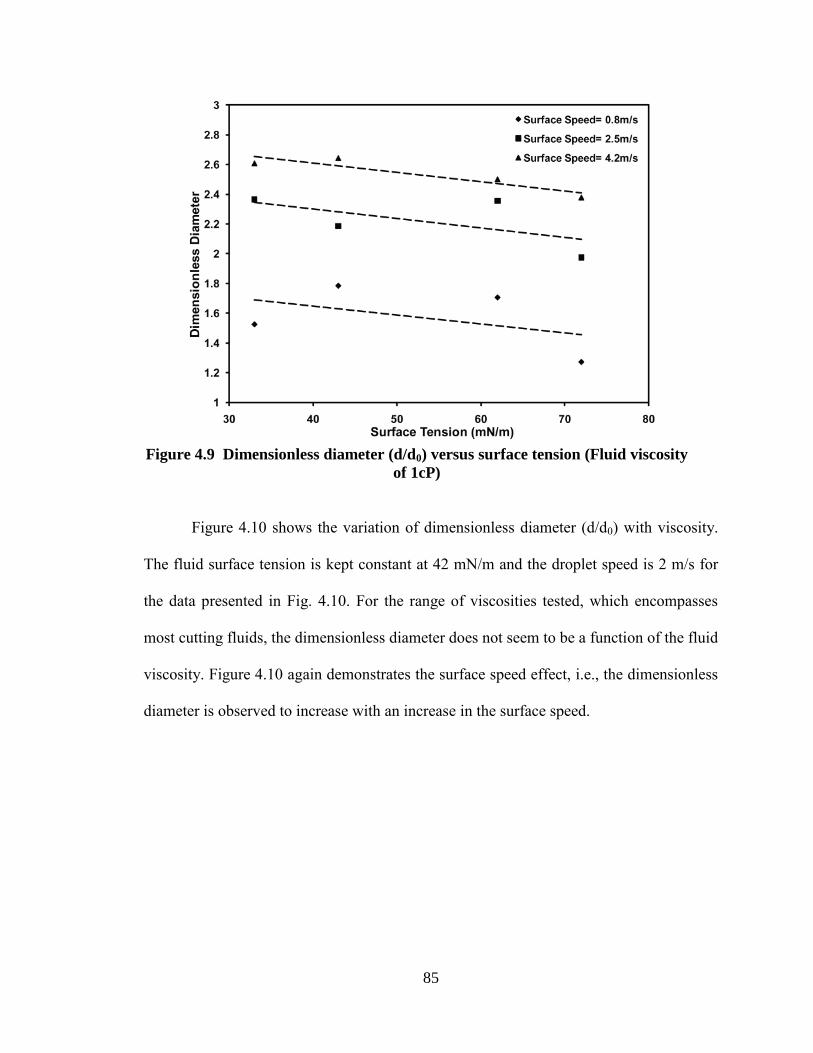
85
Figure 4.10 shows the variation of dimensionless diameter (d/d0) with viscosity.
The fluid surface tension is kept constant at 42 mN/m and the droplet speed is 2 m/s for
the data presented in Fig. 4.10. For the range of viscosities tested, which encompasses
most cutting fluids, the dimensionless diameter does not seem to be a function of the fluid
viscosity. Figure 4.10 again demonstrates the surface speed effect, i.e., the dimensionless
diameter is observed to increase with an increase in the surface speed.
Figure 4.9 Dimensionless diameter (d/d0) versus surface tension (Fluid viscosity
of 1cP)

86
Figure 4.10 Dimensionless diameter (d/d0) versus viscosity
(Surface tension of 42mN/m)
In summary, the droplet contact diameter (d) decreases with increase in fluid
surface tension but does not change much with a change in the viscosity. Irrespective of
the fluid properties, surface speed is observed to increase the droplet contact diameter.
Figures 4.9-4.10 show that a change in the surface speed from 0.8 m/s to 4.2 m/s doubles
the droplet contact diameter in the direction of rotation of the surface.
4.2.3 Droplet Behavior in the Evaporative Phase
Since in the evaporation phase droplet is in form of a spherical cap, measurement
of two geometric parameters, viz., the radius of curvature (R) and the droplet height (h),
enables the calculation of the droplet volume (V). The initial droplet volume (V0) is
calculated by measuring the initial droplet diameter (d0). The droplet volume (V) was

87
measured after each rotation of the rod and compared with the initial droplet volume (V0)
to study the change of droplet volume with time. Figure 4.11 shows the reducing droplet
volume for DI water evaporating from a surface rotating at 2.5 m/s. The figure shows that
over a period of 212 ms, the droplet has evaporated to one fourth its original volume. On
the other hand, 12.5% Castrol 6519 was observed to evaporate to one fourth its original
volume in only 45 ms, which is approximately 1/5th
the time taken by DI Water. The
volume calculations were performed for all the fluids listed in Table 4.1 to understand the
relationship between evaporation behavior and fluid properties.
Figure 4.11 Evaporation of droplet of DI water
Figure 4.12 shows the plot of the dimensionless volume (V/V0) versus time for a
droplet of DI water, at different surface speeds. The droplet speed is 2 m/s for the data
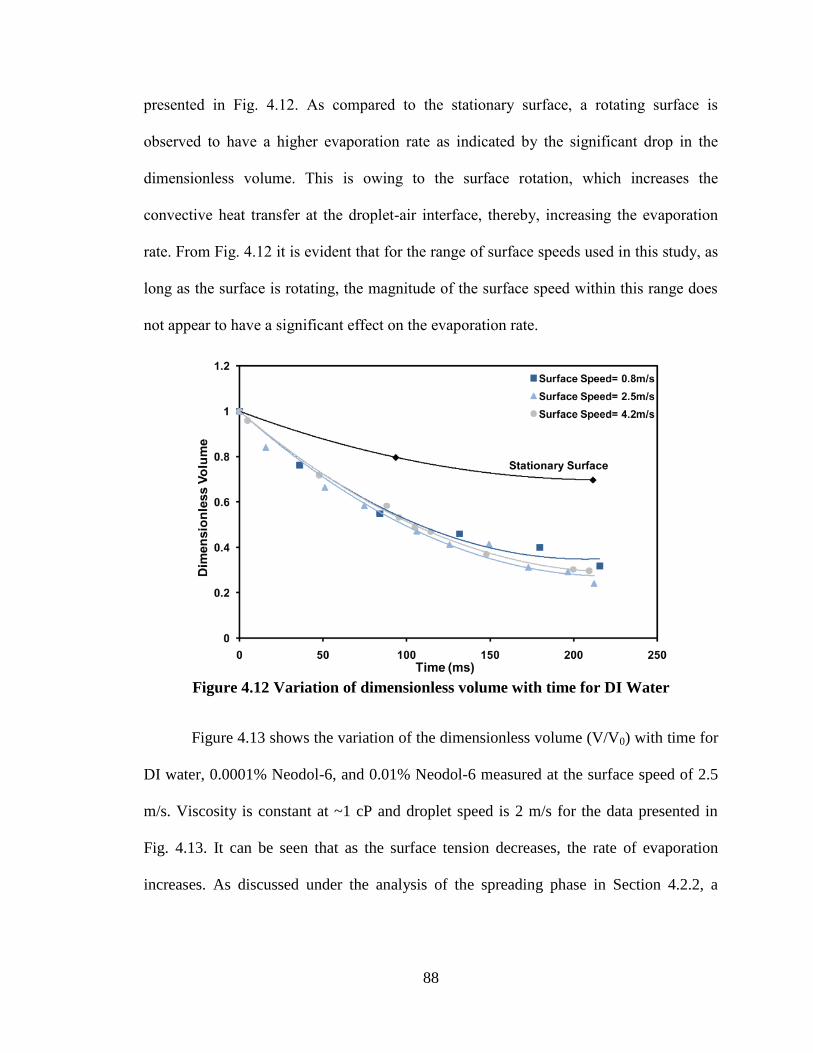
88
presented in Fig. 4.12. As compared to the stationary surface, a rotating surface is
observed to have a higher evaporation rate as indicated by the significant drop in the
dimensionless volume. This is owing to the surface rotation, which increases the
convective heat transfer at the droplet-air interface, thereby, increasing the evaporation
rate. From Fig. 4.12 it is evident that for the range of surface speeds used in this study, as
long as the surface is rotating, the magnitude of the surface speed within this range does
not appear to have a significant effect on the evaporation rate.
Figure 4.12 Variation of dimensionless volume with time for DI Water
Figure 4.13 shows the variation of the dimensionless volume (V/V0) with time for
DI water, 0.0001% Neodol-6, and 0.01% Neodol-6 measured at the surface speed of 2.5
m/s. Viscosity is constant at ~1 cP and droplet speed is 2 m/s for the data presented in
Fig. 4.13. It can be seen that as the surface tension decreases, the rate of evaporation
increases. As discussed under the analysis of the spreading phase in Section 4.2.2, a
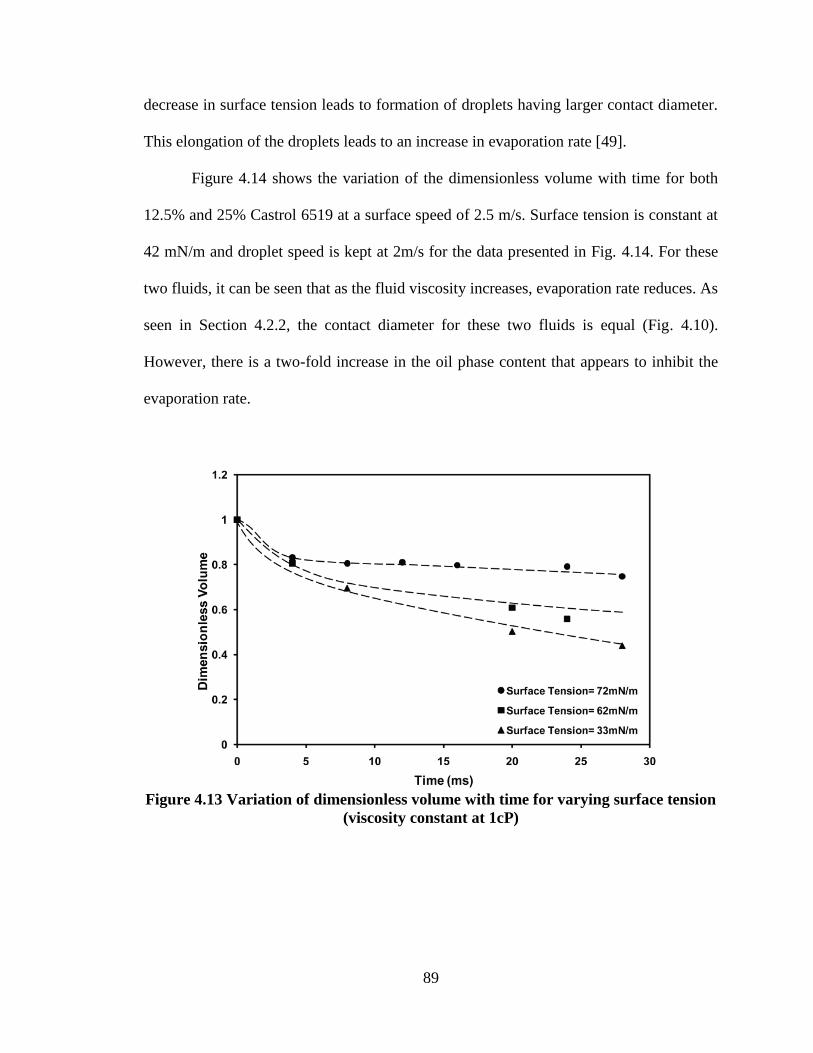
89
decrease in surface tension leads to formation of droplets having larger contact diameter.
This elongation of the droplets leads to an increase in evaporation rate [49].
Figure 4.14 shows the variation of the dimensionless volume with time for both
12.5% and 25% Castrol 6519 at a surface speed of 2.5 m/s. Surface tension is constant at
42 mN/m and droplet speed is kept at 2m/s for the data presented in Fig. 4.14. For these
two fluids, it can be seen that as the fluid viscosity increases, evaporation rate reduces. As
seen in Section 4.2.2, the contact diameter for these two fluids is equal (Fig. 4.10).
However, there is a two-fold increase in the oil phase content that appears to inhibit the
evaporation rate.
Figure 4.13 Variation of dimensionless volume with time for varying surface tension
(viscosity constant at 1cP)
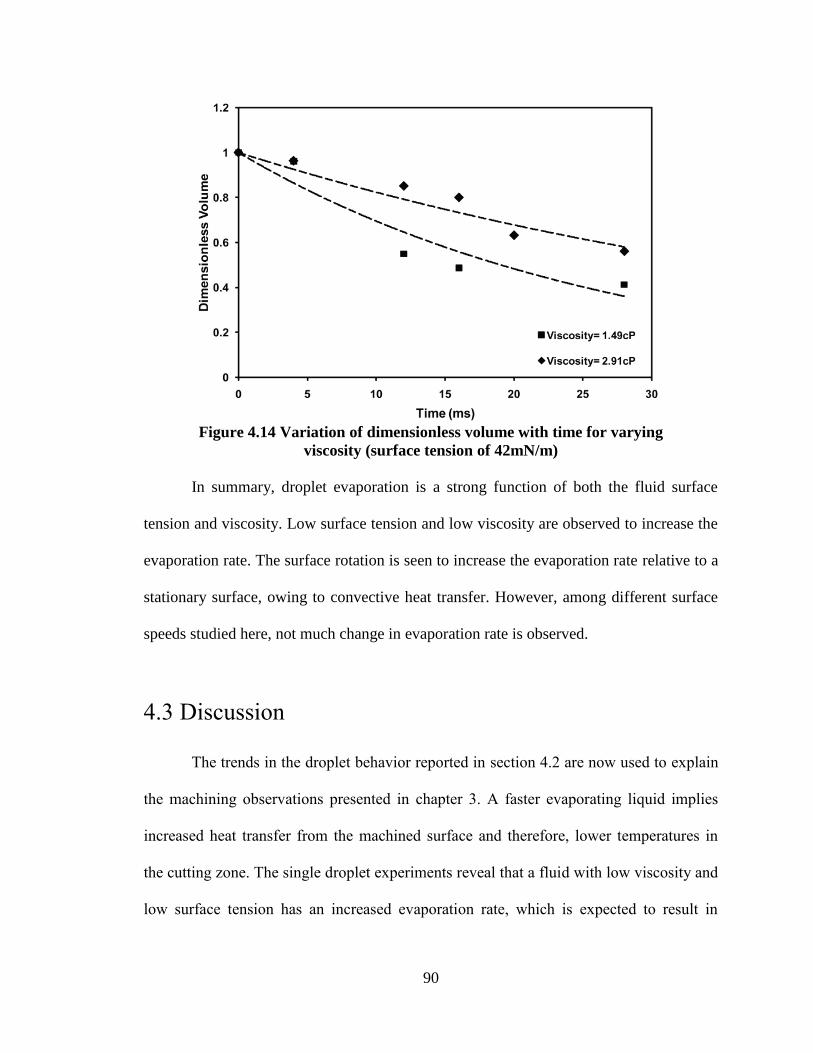
90
Figure 4.14 Variation of dimensionless volume with time for varying
viscosity (surface tension of 42mN/m)
In summary, droplet evaporation is a strong function of both the fluid surface
tension and viscosity. Low surface tension and low viscosity are observed to increase the
evaporation rate. The surface rotation is seen to increase the evaporation rate relative to a
stationary surface, owing to convective heat transfer. However, among different surface
speeds studied here, not much change in evaporation rate is observed.
4.3 Discussion
The trends in the droplet behavior reported in section 4.2 are now used to explain
the machining observations presented in chapter 3. A faster evaporating liquid implies
increased heat transfer from the machined surface and therefore, lower temperatures in
the cutting zone. The single droplet experiments reveal that a fluid with low viscosity and
low surface tension has an increased evaporation rate, which is expected to result in

91
better cooling of the surface. This is supported by the results presented in chapter 3,
where 12.5% Castrol 6519 (surface tension of 42 mN/m and viscosity of 1.49 cP) results
in the highest drop in cutting temperatures when compared to DI Water (surface tension
of 72 mN/m and viscosity of 1.01 cP) and 25% Castrol 6519 (surface tension of 42 mN/m
and viscosity of 2.91 cP). While the single droplet experiments did not study the effect of
droplet speed on evaporation, the machining experiments reveal that the cutting
temperatures reduce with an increase in the droplet speed to about 6 m/s after which little
change in temperature is seen. Therefore, for the case in point it is likely that the
evaporation rate increases with increase in the droplet speed to about 6 m/s.
As presented in chapter 3, DI Water and 12.5% Castrol 6519 generate average
cutting force of 1.367 N and 1.255 N, respectively and 25% Castrol 6519 generates the
lowest cutting forces at all droplet speeds tested. In the single droplet experiments
reported in section 4.2.2, DI Water droplet was observed to spread to 2.3 times its initial
diameter, whereas both 12.5% and 25% Castrol 6519 droplets spread to 2.7 times the
initial diameter. Although both 12.5% and 25% Castrol 6519 have same spread diameter,
the viscosity of 25% Castrol is much higher. Thus, for the fluids tested it appears that the
lubricity is a stronger function of the fluid viscosity (attributed to the oil content of the
cutting fluid) and not strongly dependent on the spread diameter. The lubrication
achieved in the cutting zone is a function of both the droplet geometry and the fluid
properties [46]. Effective lubrication is achieved by a fluid with low surface tension
(effective wetting) and high viscosity (effective friction reduction). Furthermore, the
single droplet experiments showed that the 25% Castrol 6519 evaporates slower so this
should further contribute to the lubrication effect.

92
Based on above observations, it can be concluded that for atomized cutting fluid
application, choice of the cutting fluid is dependent on the desired machining
performance. Although, low surface tension fluid is observed to reduce the cutting
temperatures, a change in viscosity owing to oil content appears to have differing effects
on cutting force and on cutting temperature. For a given surface tension, the fluid with
higher viscosity generates lower cutting forces but higher cutting temperatures. However,
the reduction in cutting forces is much greater than the modest increase in cutting
temperature.
4.4 Chapter Summary
The spreading and evaporative behavior of droplets impacting a rotating surface
has been investigated with an aim to better understand the lubricating and cooling effect
of atomized droplets in micro-machining. The single droplet experiments show that the
droplet evolution on a rotating surface occurs in four phases, viz., kinetic, spreading,
relaxation and evaporation which is similar to the evolution observed in case of a
stationary surface. In the spreading phase, the droplets are observed to take either the
shape of a spherical cap or a deformed-ellipsoidal cap based on the resultant of the
droplet impact speed and the surface velocity. The droplet spreading is observed to
increase with an increase in the surface speed. It is also observed to increase with a
decrease in surface tension but does not appear to change with the fluid viscosity. The
evaporation rate of a droplet on a rotating surface is observed to be higher than that of a
droplet on a stationary surface owing to increased convective heat transfer. A fluid with

93
low surface tension and low viscosity is observed to have higher evaporation rate than a
fluid with high surface tension and/or high viscosity. The micro-turning experiments and
the single droplet experiments indicate that the cutting temperatures are a strong function
of the droplet evaporation behavior. On the other hand, the cutting forces appear to be
dependent on the fluid viscosity and do not exhibit strong dependence on the droplet
contact diameter. The fluid surface tension and viscosity (owing to increased oil content)
values appear to result in a trade-off in the machining performance for the atomized
cutting fluid application. A decrease in surface tension is observed to aid cooling in the
cutting zone. However, for a given surface tension value, the fluid with higher viscosity
significantly reduces the cutting force but results in a modest increase in the cutting
temperatures.
In the study reported here, single droplet impingement experiments are conducted
on a rotating surface using fluids of different surface tension and viscosity values to
understand the spreading and ensuing evaporative behavior of a droplet impinging upon a
rotating surface. The above study gives useful insight into the physics underlying cooling
and lubrication mechanism in ACF systems. In order to design efficient ACF systems,
droplet spreading on a rotating surface needs to be modeled so that cooling and
lubrication performance of an ACF system in micro-machining processes can be
predicted

94
Chapter 5
Modeling Droplet Spreading on a Rotating
Surface
The experiments presented in Chapter 4 show that the cooling and lubrication
performance of atomization-based cutting fluid (ACF) systems are dependent on the
spreading behavior of the droplets impinging upon the cutting zone. Therefore it appears
that the design of an efficient ACF system can benefit greatly from the development of a
model for predicting spreading behavior of droplet on a rotating surface. To this end, an
energy-based spreading model for droplet impinging upon a rotating surface has been
developed here.
The experiments conducted in Chapter 4 show that the presence of a rotating
surface changes the dynamics of the spreading process imposing a need to develop a 3D
spreading model to capture the asymmetric ellipsoidal-cap geometry of the droplet upon
impact. Thus, additional single droplet impingement experiments are required to capture
the 3D shape of a droplet impinging upon a rotating surface that can then be used model
droplet spreading on a rotating surface.
In this chapter, single droplet impingement experiments are conducted to capture
the 3D shape of the droplet upon impact. A mathematical parameterization scheme is
then developed to characterize the 3D shape of a droplet impinging on a rotating surface.
The high-speed images from the single-droplet impingement experiments serve as a basis

95
to develop the mathematical equations describing this 3D shape. The mathematical
parameterization is then used as an input to an energy-based droplet spreading model.
The droplet spreading model uses the shape parameterization along with other parameters
including, fluid properties (viz., surface tension, viscosity, density), droplet
characteristics (viz., droplet diameter and droplet speed) and surface speed to calculate
the droplet energy and droplet volume after impact. Energy conservation and volume
conservation are then applied along with droplet shape geometry relationship to predict
the droplet contact lengths and height at the condition of maximum spread.
The chapter is divided into five subsections. Section 5.1 presents the experimental
set-up and design. The results of the single droplet experiments that depict the 3D shape
of the droplet upon impact are presented in section 5.2. Section 5.3 describes the
parameterization scheme developed to capture the 3D droplet shape. Section 5.4 presents
the development of an energy-based spreading model. This section also presents the
spreading model validation results using the single droplet experiments. Chapter
summary is presented in section 5.5.
5.1 Experimental Setup and Design
5.1.1 Test-bed Design
The experimental setup to study the droplet behavior on a rotating surface is
shown in Fig. 5.1. This set-up is similar to that used in Chapter 4. The set-up includes a
droplet-on-demand (DOD) unit comprised of a droplet dispense head (1) and a signal
driver (2) (supplied by Engineering Arts, Phoenix, AZ) along with an electric motor and a
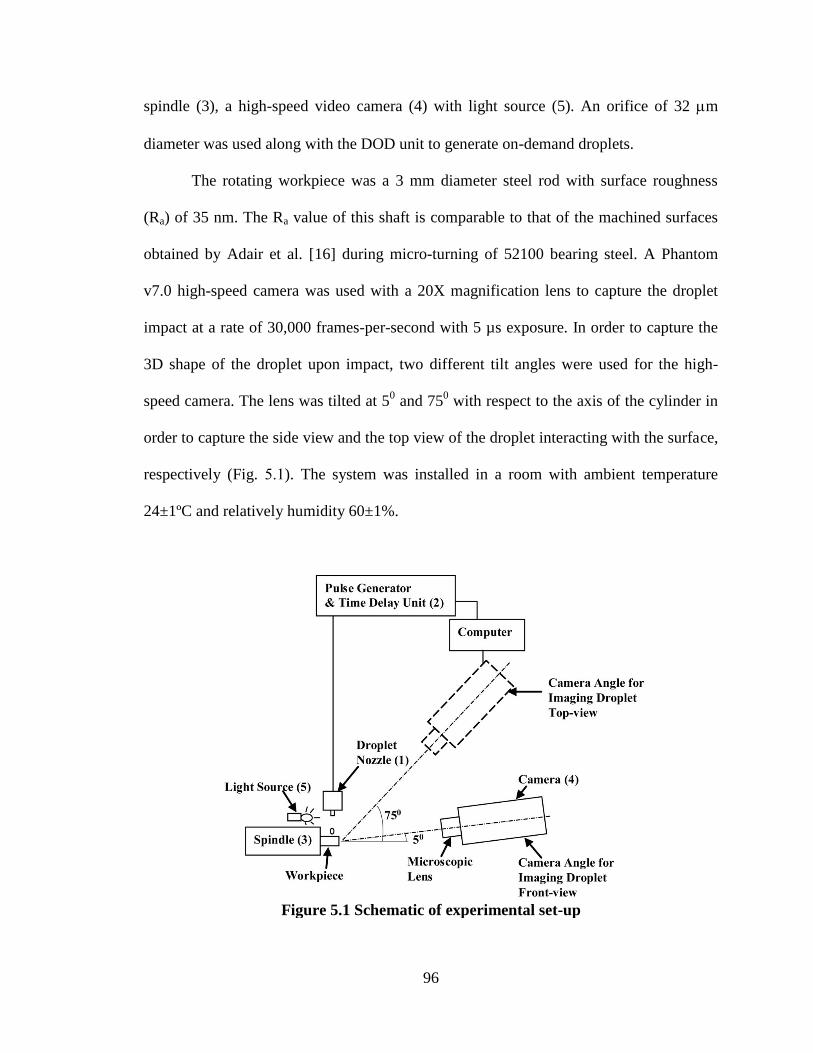
96
spindle (3), a high-speed video camera (4) with light source (5). An orifice of 32 m
diameter was used along with the DOD unit to generate on-demand droplets.
The rotating workpiece was a 3 mm diameter steel rod with surface roughness
(Ra) of 35 nm. The Ra value of this shaft is comparable to that of the machined surfaces
obtained by Adair et al. [16] during micro-turning of 52100 bearing steel. A Phantom
v7.0 high-speed camera was used with a 20X magnification lens to capture the droplet
impact at a rate of 30,000 frames-per-second with 5 µs exposure. In order to capture the
3D shape of the droplet upon impact, two different tilt angles were used for the high-
speed camera. The lens was tilted at 50 and 75
0 with respect to the axis of the cylinder in
order to capture the side view and the top view of the droplet interacting with the surface,
respectively (Fig. 5.1). The system was installed in a room with ambient temperature
24±1ºC and relatively humidity 60±1%.
Figure 5.1 Schematic of experimental set-up

97
5.1.2 Experimental Design
In order to examine the effect of surface tension and viscosity independently, four
fluids were specially engineered as listed in Table 5.1. Single droplet impingement
experiments were conducted with all four fluids at two droplet speeds of 1.2 m/s and 2.4
m/s and at two surface speeds of 1 m/s and 2 m/s. The chosen surface speed values are
typical of micro-machining of steel. A 24
full factorial design of experiments was
conducted. A burst of 200 droplets at a frequency of 50Hz was used for the videography
of droplet impact. The images were captured at a resolution of 456x96 pixels with 34 µs
time difference between consecutive images. Approximately 9000 frames were captured
for each experimental condition. The images from the videos were then extracted and
processed using MATLAB to measure the droplet contact lengths and characterize the
droplet shape. The gray scale image captured from the camera was converted to a binary
image using MATLAB to detect the droplet profile accurately. The droplet profile was
scanned to capture the pixels defining the droplet boundary. The captured pixel matrix
was then used to determine the mathematical equation defining the droplet profile.
Table 5.1 Physical properties of the fluids used for single droplet experiments
Fluid Surface
Tension (mN/m)
Viscosity
(cP)
Density
(kg/m3)
DI Water 72 1 1000
DI Water + Sucrose 72 2.9 1000
10% Ethanol 45 1 1000
10% Ethanol + Sucrose 45 2.9 1000
Figures 5.2a-c depict the axes convention followed for the droplet impingement
study. As depicted in Fig. 5.2, the axes are fixed in the frame of reference of the droplet
generator nozzle. The positive X-axis lies along the direction of rotation of the surface,
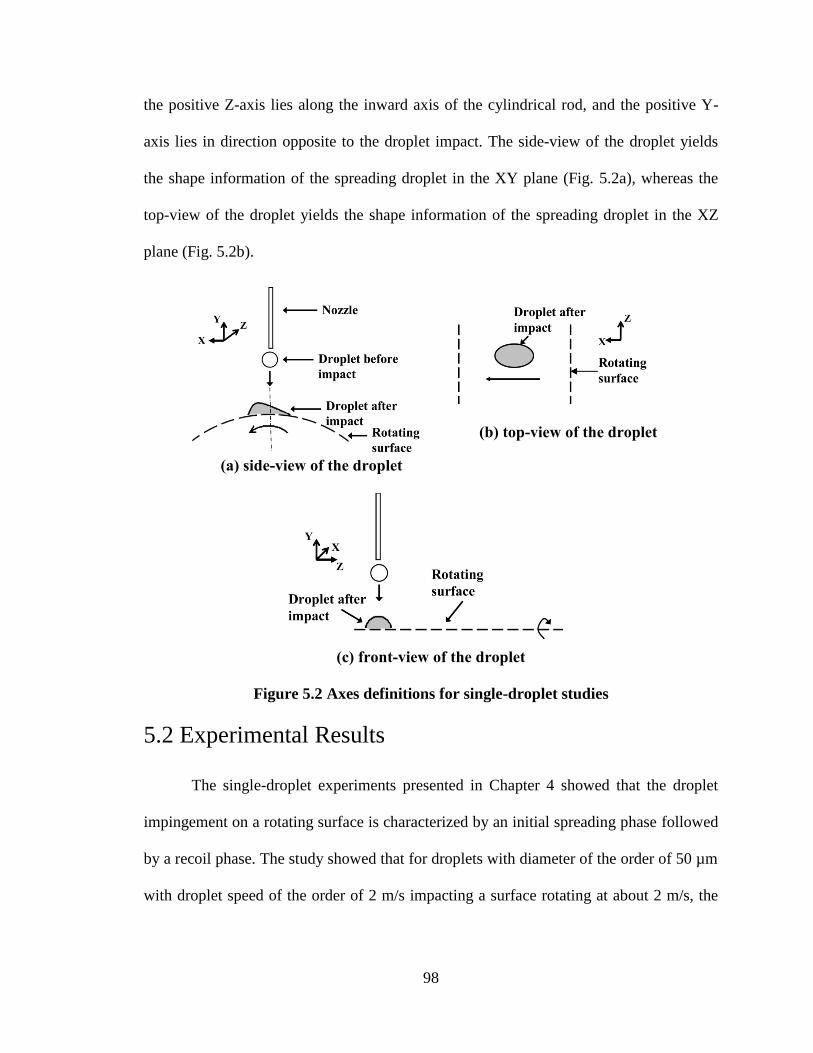
98
the positive Z-axis lies along the inward axis of the cylindrical rod, and the positive Y-
axis lies in direction opposite to the droplet impact. The side-view of the droplet yields
the shape information of the spreading droplet in the XY plane (Fig. 5.2a), whereas the
top-view of the droplet yields the shape information of the spreading droplet in the XZ
plane (Fig. 5.2b).
(a) side-view of the droplet
(b) top-view of the droplet
(c) front-view of the droplet
Figure 5.2 Axes definitions for single-droplet studies
5.2 Experimental Results
The single-droplet experiments presented in Chapter 4 showed that the droplet
impingement on a rotating surface is characterized by an initial spreading phase followed
by a recoil phase. The study showed that for droplets with diameter of the order of 50 µm
with droplet speed of the order of 2 m/s impacting a surface rotating at about 2 m/s, the
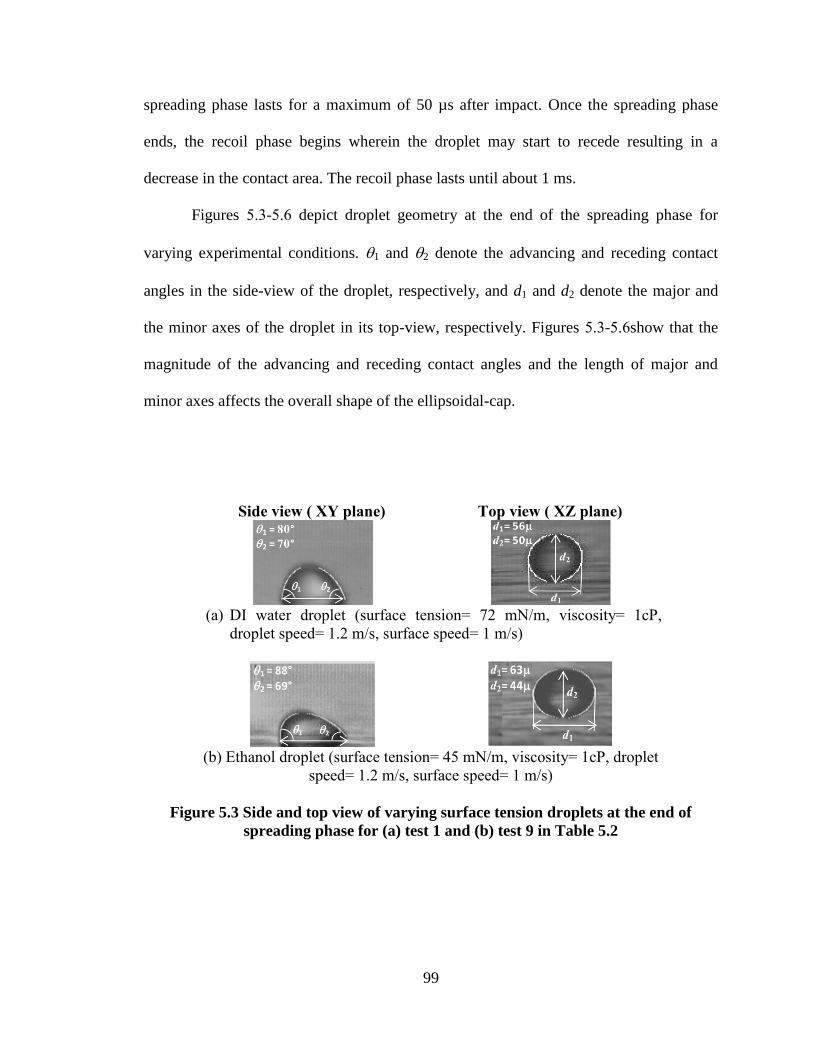
99
spreading phase lasts for a maximum of 50 µs after impact. Once the spreading phase
ends, the recoil phase begins wherein the droplet may start to recede resulting in a
decrease in the contact area. The recoil phase lasts until about 1 ms.
Figures 5.3-5.6 depict droplet geometry at the end of the spreading phase for
varying experimental conditions. 1 and 2 denote the advancing and receding contact
angles in the side-view of the droplet, respectively, and d1 and d2 denote the major and
the minor axes of the droplet in its top-view, respectively. Figures 5.3-5.6show that the
magnitude of the advancing and receding contact angles and the length of major and
minor axes affects the overall shape of the ellipsoidal-cap.
Side view ( XY plane) Top view ( XZ plane)
(a) DI water droplet (surface tension= 72 mN/m, viscosity= 1cP,
droplet speed= 1.2 m/s, surface speed= 1 m/s)
(b) Ethanol droplet (surface tension= 45 mN/m, viscosity= 1cP, droplet
speed= 1.2 m/s, surface speed= 1 m/s)
Figure 5.3 Side and top view of varying surface tension droplets at the end of
spreading phase for (a) test 1 and (b) test 9 in Table 5.2

100
Side view ( XY plane) Top view ( XZ plane)
(a) Ethanol droplet (surface tension= 45 mN/m, viscosity= 1cP, droplet
speed= 1.2 m/s, surface speed= 1 m/s)
(b) Ethanol + Sucrose droplet (surface tension= 45 mN/m, viscosity=
2.9 cP, droplet speed= 1.2 m/s, surface speed= 1 m/s)
Figure 5.4 Side and top view of varying viscosity droplets at the
end of spreading phase for (a) test 9 and (b) test 13 in Table 5.2
Side view ( XY plane) Top view ( XZ plane)
(a) Ethanol + Sucrose droplet (surface tension= 45 mN/m, viscosity=
2.9 cP, droplet speed= 1.2 m/s, surface speed= 1 m/s)
(b) Ethanol + Sucrose droplet (surface tension= 45 mN/m, viscosity=
2.9 cP, droplet speed= 1.2 m/s, surface speed= 2 m/s)
Figure 5.5 Side and top view of droplets impinging upon surfaces
of varying surface speed at the end of spreading phase for (a) test
13 and (b) test 14 in Table 5.2

101
Side view ( XY plane) Top view ( XZ plane)
(a) DI water droplet (surface tension= 72 mN/m, viscosity= 1cP,
droplet speed= 1.2 m/s, surface speed= 1 m/s)
(b) DI water droplet (surface tension= 72 mN/m, viscosity= 1cP,
droplet speed= 2.4 m/s, surface speed= 1 m/s)
Figure 5.6 Side and top view of droplets with varying droplet
speed at the end of spreading phase for (a) test 1 and (b) test 3 in
Table 5.2
Figures 5.3a-b show that the ethanol droplet has a higher d1 than the DI water
droplet under the same experimental conditions. This is attributed to the lower surface
tension value of ethanol. Figures 5.4a-b that higher viscosity leads to a decrease in values
of both d1 and d2 indicating that a more viscous droplet spreads to a smaller extent [5].
Figures 5.5a-b show that higher surface speed leads to an increase in values of both d1
and d2 indicating that the droplet spreads to a larger extent. The increase in surface speed
is expected to increase the spreading. Figures 5.6a-b show that a droplet with higher
droplet speed has a higher value of d1 and d2 indicating more spreading. In this case the
increase in spreading is attributed to higher droplet speed [5]. The complete set of
quantitative results from the single droplet experiments are presented in Table 5.2.

102
Table 5.2 Single droplet experiment results
Test Surface
Tension
(mN/m)
Viscosity
(cP)
Droplet
Speed
(m/s)
Surface
Speed
(m/s)
At Maximum
Spread
d1/d0 d2/d0 h/d0
1 72 1 1.2 1 1.46 1.29 0.58
2 72 1 1.2 2 1.54 1.46 0.54
3 72 1 2.4 1 1.79 1.53 0.57
4 72 1 2.4 2 2.00 1.71 0.52
5 72 3 1.2 1 1.94 1.52 0.38
6 72 3 1.2 2 1.72 1.57 0.46
7 72 3 2.4 1 1.67 1.56 0.41
8 72 3 2.4 2 1.70 1.24 0.39
9 45 1 1.2 1 1.96 1.65 0.42
10 45 1 1.2 2 2.04 1.59 0.39
11 45 1 2.4 1 2.28 2.13 0.31
12 45 1 2.4 2 2.37 2.08 0.34
13 45 3 1.2 1 2.10 1.47 0.39
14 45 3 1.2 2 2.00 1.82 0.34
15 45 3 2.4 1 2.33 1.68 0.34
16 45 3 2.4 2 2.08 1.63 0.32
5.3 Droplet Shape Parameterization
In order to model the 3D shape of the droplet, both the side-view and the top-view
of the droplet need to be parameterized mathematically.
5.3.1 Side-view parameterization
Figure 5.7 shows the geometry for parameterizing the side-view of the droplet.
The droplet profile ABCDA is marked in bold lines. The droplet contact length (ADC) is
l1+l2 and the droplet height (BD) is h. The contact angle at A is 1 and the contact angle
at C is 2. The two constituent ellipses E1F and E2F are shown in dashed lines. The ellipses
E1F and E2F share a common tangent at point B. The equation of droplet profile AB is
given by ellipse E1F and the equation of droplet profile BC is given by ellipse E2F. The
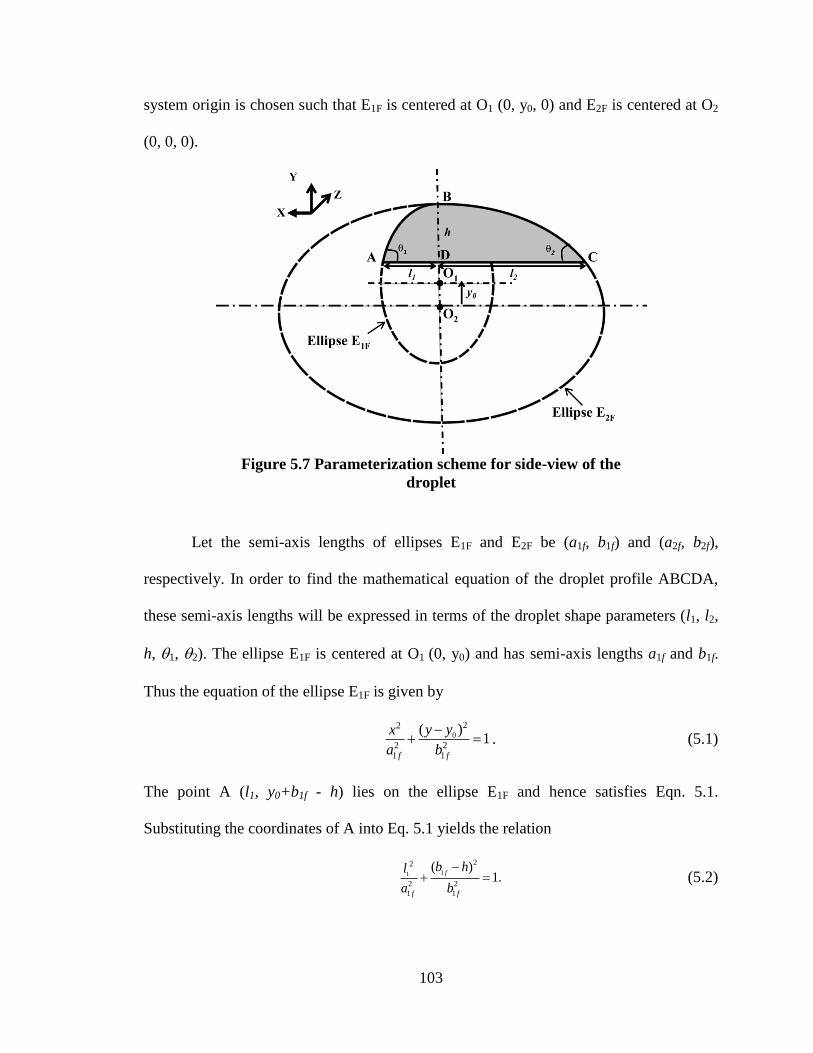
103
system origin is chosen such that E1F is centered at O1 (0, y0, 0) and E2F is centered at O2
(0, 0, 0).
Figure 5.7 Parameterization scheme for side-view of the
droplet
Let the semi-axis lengths of ellipses E1F and E2F be (a1f, b1f) and (a2f, b2f),
respectively. In order to find the mathematical equation of the droplet profile ABCDA,
these semi-axis lengths will be expressed in terms of the droplet shape parameters (l1, l2,
h, 1, 2). The ellipse E1F is centered at O1 (0, y0) and has semi-axis lengths a1f and b1f.
Thus the equation of the ellipse E1F is given by
0
22
2 21 1
( )1
f f
y yx
a b
. (5.1)
The point A (l1, y0+b1f - h) lies on the ellipse E1F and hence satisfies Eqn. 5.1.
Substituting the coordinates of A into Eq. 5.1 yields the relation
11
22
2 2
1 1
( )1.
f
f f
b hl
a b
(5.2)
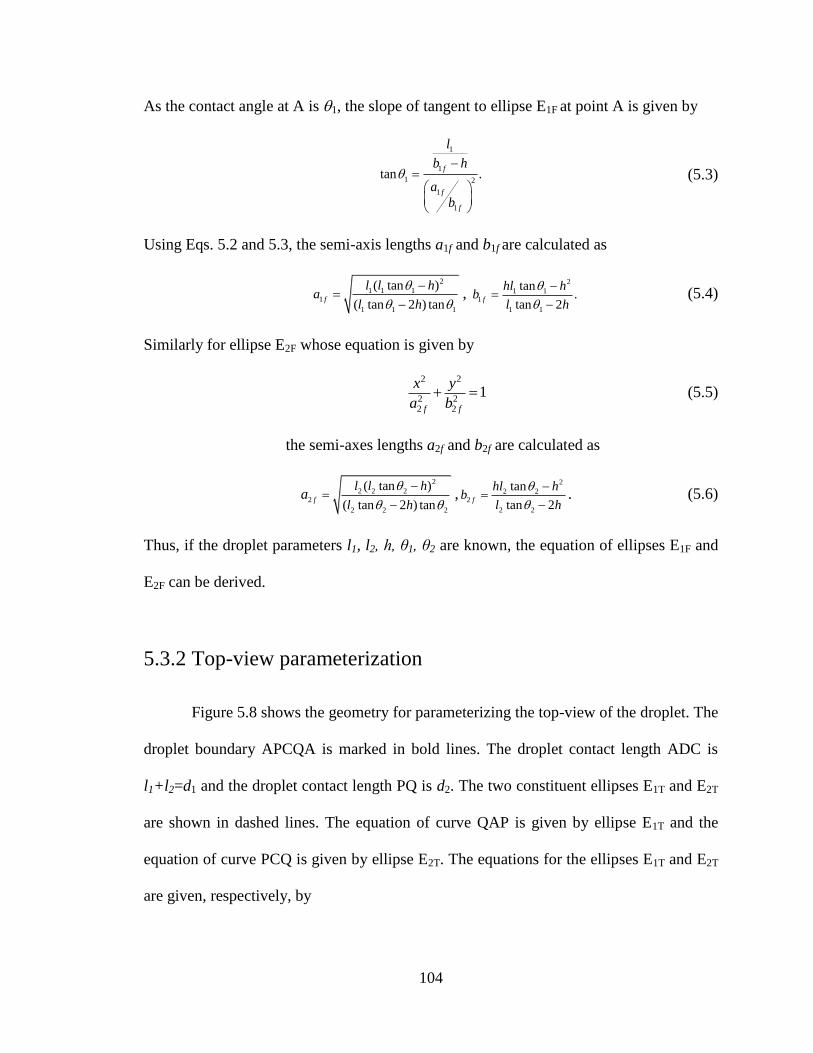
104
As the contact angle at A is 1, the slope of tangent to ellipse E1F at point A is given by
1
1
1 2
1
1
tan .f
f
f
l
b h
a
b
(5.3)
Using Eqs. 5.2 and 5.3, the semi-axis lengths a1f and b1f are calculated as
2
1 1 1
1
1 1 1
( tan )
( tan 2 ) tanf
l l ha
l h
,
2
1 1
1
1 1
tan.
tan 2f
hl hb
l h
(5.4)
Similarly for ellipse E2F whose equation is given by
22
2 22 2
1f f
yx
a b (5.5)
the semi-axes lengths a2f and b2f are calculated as
2
2 2 2
2
2 2 2
( tan )
( tan 2 ) tanf
l l h
l ha
,
2
2 2
2
2 2
tan
tan 2f
hl hb
l h
. (5.6)
Thus, if the droplet parameters l1, l2, h, θ1, θ2 are known, the equation of ellipses E1F and
E2F can be derived.
5.3.2 Top-view parameterization
Figure 5.8 shows the geometry for parameterizing the top-view of the droplet. The
droplet boundary APCQA is marked in bold lines. The droplet contact length ADC is
l1+l2=d1 and the droplet contact length PQ is d2. The two constituent ellipses E1T and E2T
are shown in dashed lines. The equation of curve QAP is given by ellipse E1T and the
equation of curve PCQ is given by ellipse E2T. The equations for the ellipses E1T and E2T
are given, respectively, by
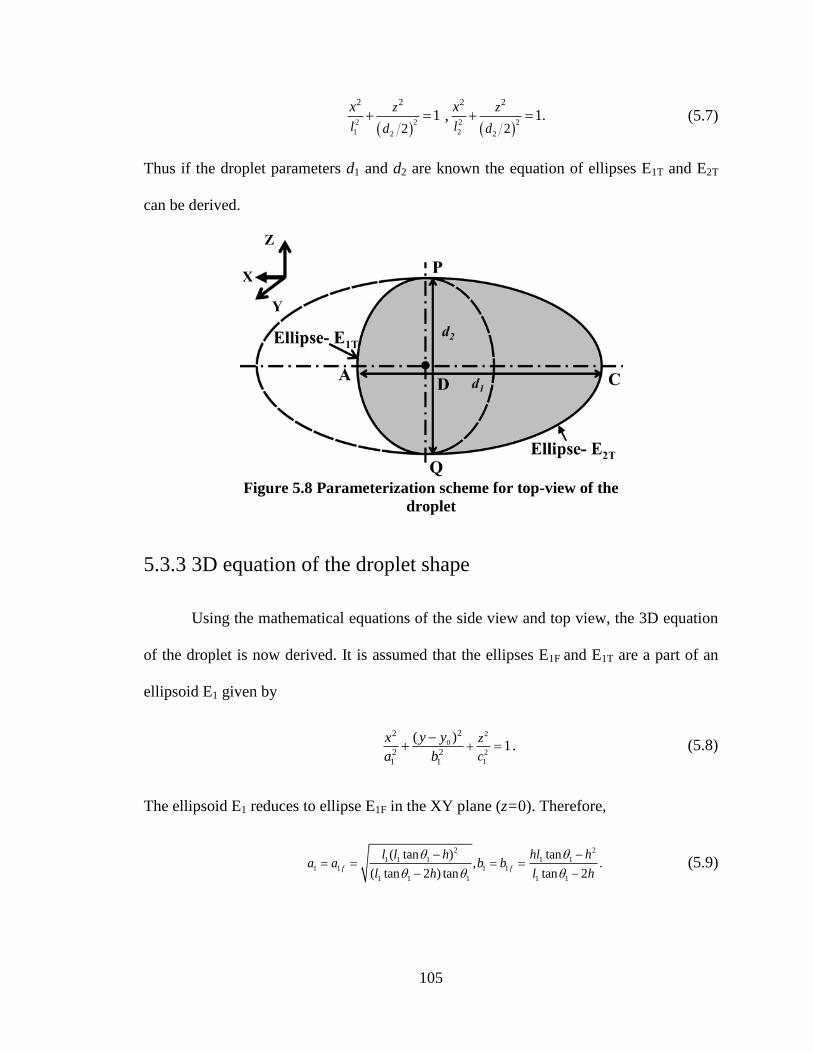
105
2 2
1 2
2 2
21
z
l d
x ,
2 2
2 2
2 2
21.
z
l d
x (5.7)
Thus if the droplet parameters d1 and d2 are known the equation of ellipses E1T and E2T
can be derived.
Figure 5.8 Parameterization scheme for top-view of the
droplet
5.3.3 3D equation of the droplet shape
Using the mathematical equations of the side view and top view, the 3D equation
of the droplet is now derived. It is assumed that the ellipses E1F and E1T are a part of an
ellipsoid E1 given by
2
0
2
1
22
2 21 1
( )1
z
c
y yx
a b
. (5.8)
The ellipsoid E1 reduces to ellipse E1F in the XY plane (z=0). Therefore,
2 2
1 1 1 1 1
1 1 1 1
1 1 1 1 1
( tan ) tan, .
( tan 2 ) tan tan 2f f
l l h hl ha a b b
l h l h
(5.9)
106
The ellipsoid E1 reduces to ellipse E1T in the XZ plane (y=yo+b1-h). This yields the
expression for c1 as
2
12 2
1 1
2.
1 ( )
dc
b h b
(5.10)
Similarly, it is assumed that the ellipses E2F and E2T are part of an ellipsoid E2 given by
2
2
2
22
2 22 2
1z
c
yx
a b (5.11)
where,
2
2 2 2
2
2 2 2
( tan )
( tan 2 ) tan
l l ha
l h
,
2
2 2
2
2 2
tan
tan 2
hl hb
l h
, and 2
22 2
2 2
2.
1 ( )
dc
b h b
(5.12)
Thus, if the lengths l1, l2, h, d2 and contact angles 1, 2 are known then the 3D equation
of the droplet surface is given by the ellipsoid E1 for 0x and by ellipsoid E2 for 0x .
The parameterization scheme is used to generate the 3D shape of the droplet
corresponding to the conditions shown in Fig. 5.3a-b. Figures 5.9a-b depict the shape of
the simulated droplets. They are comparable to the experimental images shown in Fig.
5.3a-b.

107
Side view ( XY plane) Top view ( XZ plane)
(a) DI droplet at the end of the spreading phase
(b) Ethanol droplet at the end of the spreading phase
Figure 5.9 Parameterized images of the side and top view of droplets corresponding
to conditions in Fig. 5.3a-b
5.3.4 Validation of the droplet parameterization scheme
In order to examine the numerical accuracy of the proposed parameterization
scheme, the volume of experimentally observed droplets was calculated and compared
with the measured droplet volume. The side-view and top-view of the droplet was
captured at the end of the spreading phase for all the 16 conditions presented in Table 5.2.
The lengths l1, l2, h, d2 and contact angles 1 and 2 were extracted from the side-view
and top-view images and used to calculate the droplet volume upon impact.
The volume of the ellipsoidal cap APBQA (Figs. 5.7-5.8) is given by
2
11 1 1 1 1 1(1 ) (2 )6
V a b c r r
(5.13)
108
where, 1 1 1( ) /r b h b . Using Eqs. 5.9-5.10 the expressions for a1, b1 and c1 are substituted
into Eq. 5.13 to give
2 1 1
11
1
(2 tan )
12 tan
hd l hV
. (5.14)
Using similar analysis, the volume of ellipsoidal cap CPBQC is given by
2 2 2
22
2
(2 tan )
12 tan
hd l hV
. (5.15)
Thus, the total volume of the droplet after impact is given by
2
2
2 11 22 1 2
1 2
1 1
6 2 tan tan
h dV V V hd d
. (5.16)
Since no significant evaporation occurs the droplet volume calculated using Eq. 5.16
should be equal to the droplet volume before impact. Figure 5.10 shows the comparison
of the calculated droplet volume against the experimentally observed droplet volume. The
45° line in Fig. 5.10 indicates that the droplet volume is estimated well when compared
with the measured volume values. The average and maximum error between the
calculated and the measured value of the droplet volume were found to be 3% and 9%,
respectively, thereby confirming that the proposed parameterization accurately captures
the droplet shape upon impact.
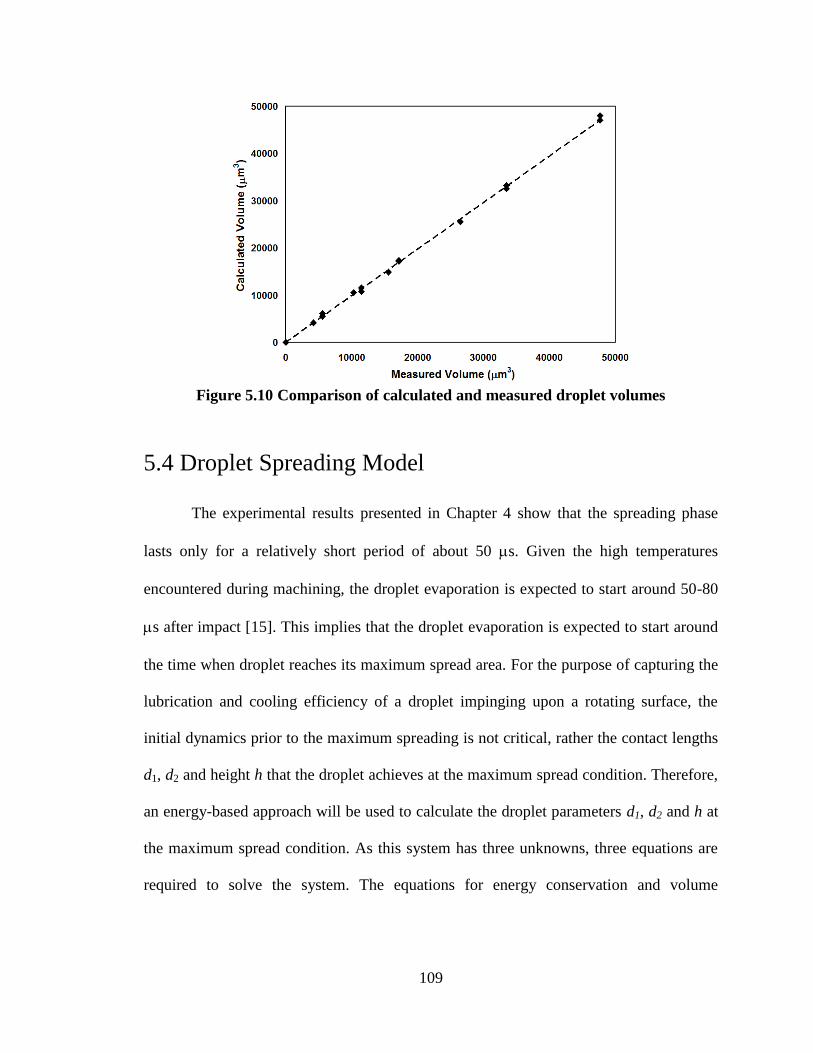
109
Figure 5.10 Comparison of calculated and measured droplet volumes
5.4 Droplet Spreading Model
The experimental results presented in Chapter 4 show that the spreading phase
lasts only for a relatively short period of about 50 s. Given the high temperatures
encountered during machining, the droplet evaporation is expected to start around 50-80
s after impact [15]. This implies that the droplet evaporation is expected to start around
the time when droplet reaches its maximum spread area. For the purpose of capturing the
lubrication and cooling efficiency of a droplet impinging upon a rotating surface, the
initial dynamics prior to the maximum spreading is not critical, rather the contact lengths
d1, d2 and height h that the droplet achieves at the maximum spread condition. Therefore,
an energy-based approach will be used to calculate the droplet parameters d1, d2 and h at
the maximum spread condition. As this system has three unknowns, three equations are
required to solve the system. The equations for energy conservation and volume

110
conservation provide two of the required expressions. The third expression connecting d1
and d2 is empirically determined from the experimental data.
5.4.1 Energy conservation equation
The energy conservation approach assumes that the initial kinetic energy and
surface energy of the droplet are partly converted into final kinetic and surface energy
and partly dissipated by viscous forces. Before impact, the kinetic energy (KE1) and
surface energy (SE1) of a spherical droplet are given by
3 2 3 2
1 0 0 0 0 ,1
2 6 12KE d u d u
(5.17)
and 21 0 lvSE d (5.18)
where, is the density of the fluid, u0 is the droplet speed, d0 is the initial diameter of the
droplet, and lv is the surface tension between the fluid and air. After impact, when the
droplet is at its maximum spread, the kinetic energy is zero with respect to the rotating
surface and the surface energy (SE2) is given by
2 1 2 3( ) ( )svlv slSE A A A (5.19)
where, A1 is the surface area of the ellipsoidal cap APBQA (Fig. 5.7-5.8), A2 is the
surface area of the ellipsoidal cap CPBQC (Fig. 5.7-5.8), A3 is the surface area of the
droplet base APCQA, sl is the surface tension between the fluid and the solid surface,
and sv is the surface tension between the solid and air. The sl and sv values are the
solid-fluid and fluid-air interface properties that need to be known for calculating SE2.
The areas A1, A2 and A3 are given by

111
2 2 2 2 2 2 2 2 2
1 1 1 1 1
2 2 2 2 2 2 2 2 2
2 2 2 2 2
1
1
1
2
0tan (1 )
0tan (1 )
1 2
1
2
3
,sin cos ( cos sin ) sin
sin cos ( cos sin ) sin2
.4
2
,
h
b
h
b
d d
d d
a b c b a
a b c b a
d d
A
A
A
(5.20)
Using Young-Laplace equation [50] the relationship between , , svlv sl is given by
,cos csv sl lv (5.21)
where, c is the steady state (after the spreading and recoil phases) contact angle between
the droplet and the solid surface. Substituting Eq. 5.21 into Eq. 5.19 yields
31 22 .cos c lvASE A A
(5.22)
In the spreading phase, energy is expended in form of viscous dissipation within the
droplet as it deforms to its maximum spread state. The work done in deforming the
droplet against viscous forces is given by
0
,V
s
st
v
V
E dVdt dVt (5.23)
where is the viscous dissipation function, V is the droplet volume and ts is the time
taken by the droplet to spread to its maximum spread state. In order to calculate the
viscous dissipation, stagnation point flow on a moving surface by Wang [51] is used.
Since the viscous dissipation occurs only in the boundary layer, it is given by
2 22 2
22 2
20 0 01 21 2 1
0 0 0
2 2
0.22 2 16 4
V
x xz z
V
ss
v vv vdV
x z y y
u u u ud dd d u d
d d d
dV
(5.24)

112
where, vx and vz are the components of fluid velocity in x and z directions, respectively,
and su is the surface speed. The time taken by the droplet to spread on the surface is
approximated as [4]
0
0
.s
dt
u (5.25)
Therefore, the energy lost to viscous dissipation is estimated as
22 2
20 0 01 21 2 1
0 0 0
.0.22 2 16 4
sv s
d u u ud dE d d u d
u d d
(5.26)
Energy is added to the droplet by the rotating surface in form of kinetic energy given by
3 2 3 2
0 0
1.
2 6 12s s s
E d u d u
(5.27)
Using energy conservation equation,
1 1 2 .s vKE SE E SE E (5.28)
where KE1, SE1, SE2, Ev and Es are given by Eqs. 5.18, 5.19, 5.23, 5.26 and 5.27,
respectively.
5.4.2 Volume conservation equation
The initial volume of the spherical droplet is given by
3
1 06
.V d
(5.29)
Using volume conservation V1 = V2, where V2 is given by Eq. 5.17. Thus,
2
3 2
0 1 2
1 2
1 1
2 tan tan.
h dd hd d
(5.30)
113
Using geometry, approximate relations for 1tan and 2tan are given by
1 2 2 2
1 22 2
1 2 2 2
8 8tan , tan .
2 2
h l d h l d
l d h l d h
(5.31)
Equations 5.30-5.31 yield the equation for volume conservation.
5.4.3 Relation between d1 and d2
The droplet dynamics in the initial spreading phase are characterized primarily by
the droplet Weber number (We) and the Ohnesorge number (Oh) defined as
2
0 0Welv
u d
,
0
Oh
lvd
. (5.32)
Schiaffino and Sonin [38] identified two regimes of droplet spreading based on the values
of We and Oh, viz., (1) almost-inviscid regime (Oh<< We0.5
); and (2) highly-viscous
regime (Oh>>We0.5
). For all the experiments presented in Section 2, the range of values
calculated for Oh and We show that here the droplet spreading lies in the almost-inviscid
regime. Therefore, as identified by Schiaffino and Sonin [38], the spreading length of the
drople is directly proportional to We and inversely proportional to Oh. In addition, the
droplet extension (d1/d2) is also expected to be proportional to the surface speed, with
extension equal to unity when the surface is stationary (us=0). Therefore, the overall
expression for 1 2d d is formulated as
4
321
1
2 0
1 Oh We .sud
d u
(5.33)
Using least-square fit on the experimental data presented in Table 5.2, the coefficients 1,
2, 3 and 4 are estimated to be 0.16, 0.1, 0.23 and 0.11, respectively. Equations 5.28,

114
5.30, and 5.33 can now be solved simultaneously to find the droplet parameters d1, d2 and
h.
Based on Eqs. 5.28, 5.30, and 5.33 d1, d2 and h values are calculated for
conditions listed in Table 5.2. The average and maximum errors in the model predictions
are noted to be 6% and 13% for d1, 8% and 20% for d2, and 10% and 17% for h.
5.5 Chapter Summary
An energy-based approach is adopted to model the spreading behavior of a
droplet impinging a rotating surface that can then be used in-conjunction with cooling
and lubrication models to predict the performance of an ACF system. In particular, a
parameterization scheme has been developed to characterize the 3D shape of a droplet
impinging upon a rotating surface. Given the droplet contact lengths, contact angles, and
height, the equation defining the droplet surface is derived. This parameterization scheme
is capable of capturing droplet volume on average within 3% accuracy. An energy-based
spreading model has been developed to predict the droplet contact lengths and height at
the maximum spread condition. Expressions for droplet surface energy, viscous energy
dissipation and relation between contact lengths have been developed. The spreading
model predicts the droplet lengths and height on average within 10% accuracy. What
remains is to use this spreading model to develop ways of improving the performance of
ACF systems.
115
Chapter 6
Prediction of Cooling and Lubrication
Performance of Atomization-based Cutting
Fluid System
This chapter presents the approach adopted to use the droplet contact lengths and
height predicted by the spreading model as input to heat transfer and lubrication
equations, so as to predict the cooling and lubrication performance of the ACF system.
The results of the micro-turning experiments presented in Chapter 3 are used to validate
the model predictions of cooling and lubrication performance. The chapter is divided into
four subsections. Section 6.1 presents the evaporative model used for predicting cooling
performance of an ACF system. Section 6.2 presents the lubrication force model used to
predict the lubrication performance of an ACF system. Section 6.3 presents a parametric
study conducted to identify the critical factors affecting the cooling and lubrication
performance of ACF systems. The chapter summary is presented in section 6.4.
6.1 Cooling performance of an ACF system
As droplets impinge upon the rotating workpiece, heat transfer occurs from the
cutting zone to the impinging droplets resulting in reduction of the surface temperature.

116
The heat transfer from the cutting zone to the ACF system consists of two components:
(1) heat transfer from the surface to the impinging droplets through conduction, and (2)
heat transfer from the surface to the air through forced convection. Calculations based on
the study of Li and Liang [51] show that forced convection heat transfer contributes only
to about 0.1% of the total heat transferred, and is neglected for the purpose of model
validation.
6.1.1 Calculating heat transfer from surface to the droplets
Using the analysis of Tio and Sadhal [53], the heat transferred from the surface to
one droplet is given by
0
0 1sk T A Aq
h (6.1)
where, sk is the thermal conductivity of the surface, 0T is the ambient air temperature, A
is the contact area at the condition of maximum spread and h is the droplet height at the
condition of maximum spread.0
1A is the integral given by
2
0
1
0 0
/ sech2 d
[tanh tanh / ]
f s
f s
k kA
k k
(6.2)
where, fk is the thermal conductivity of the cutting fluid, and0 is the equivalent contact
angle given by
1 20
2
(6.3)

117
where, 1 and
2 are the advancing and receding contact angles, respectively. The
contact area of the droplet at maximum spread is given by
1 24
A d d
(6.4)
where, d1 and d2 are the contact lengths at the condition of maximum spread calculated
for a given cutting fluid using Eqs. 5.28, 5.30, and 5.33. Once q is known from Eqs. 6.1-
6.4, the total heat transferred from the cutting zone to the impinging droplets is given by
Q Nq (6.5)
where N is the number of droplets reaching the cutting zone per second at droplet speed
u0. Higher values of Q imply better cooling performance of the ACF system.
The ability of the ACF system to carry atomized droplets to the cutting zone is a function
of the penetration coefficient c given by
0/
m
n Nc
v (6.6)
where vm is the velocity at which the droplets exit the atomizer, n is the number of
droplets reaching the cutting zone per second measured at vm, and N0 is the number of
droplets emitted per second by the atomizer. If M is the volume flow rate specification of
the atomizer, N0 is given by
0 3
0
6.
MN
d (6.7)
Assuming a conical flow out of the nozzle, n is given by
2
020( tan )
rn N
l r
(6.8)
118
where is the angle at which the flow exits the nozzle, r is the nozzle radius and l0 is the
distance of nozzle from cutting zone. As soon as the droplets exit the atomizer, they meet
with an air jet, which carries them to the cutting zone at a droplet speed u0 equal to the
speed of the air jet [2]. As the speed of the air jet increases, the number of droplets
reaching the cutting zone reduces due to the diffusive action of the air jet [54]. The
variation of N with droplet speed is given by
0 0exp( ).N N cu (6.9)
Equation 6.9 shows that as c increases, the number of droplets reaching the cutting zone
per second decreases. A higher value of c characterizes an ACF system with a highly
diverged droplet flow wherein the number of droplets reaching the cutting zone is
reduced greatly with increase in droplet speed. The experiments of Rukosuyev et al. [25]
showed that the extent of divergence of the droplet flow is dependent on both distance of
atomizer from the cutting zone and the nozzle geometry. These two factors are captured
in c.
6.1.2 Predicting cooling performance of an ACF system
The above cooling model is now used to predict the performance of three cutting
fluids used in the micro-turning study presented in Chapter 3. The overall machining
conditions for the micro-turning experiments and the values of the various parameters
needed for calculating the total heat transferred from the surface to the droplets are listed
in Table 6.1. Eqs. 5.28, 5.30, and 5.33 are solved simultaneously using the fluid
properties and droplet characteristics listed in Table 6.1 to obtain the d1, d2 and h values

119
at maximum spread condition as presented in Table 6.2. The data in Table 6.2 is used in
conjunction with the atomizer specifications and the workpiece properties (Table 6.1) in
Eqs. 6.1-6.9. Thus, the heat transferred from the surface to the droplets (Q) for each of
the three cutting fluids is calculated.
Table 6.1 Conditions for the micro-turning tests
Workpiece 6 mm diameter 1018 steel rod,
Thermal Conductivity( ks)= 52 W/m-K
Cutting Conditions T0= 298K
Depth of cut = 45 m
Surface Speed (us) 4.2 m/s
Droplet Speed (u0) 0.5-10 m/s
Droplet Diameter 12 µm
Cutting Fluid
Properties Fluid
Surface
Tension
()
(mN/m)
Density ()
(kg/m3)
Viscosity ()
(cP)
Thermal
Conductivity
(kf) (W/m-K)
DI water 72 1000 1.01 0.58
12.5%
Castrol 6519 42 996.25 1.49 0.52
25% Castrol
6519 42 992.5 2.91 0.46
Contact angles Fluid c 1 2
DI water 75° 90° 60°
12.5% Castrol 6519 60° 90° 30°
25% Castrol 6519 60° 90° 30°
Atomizer
Specifications
N0 = 2x10⁷, α= 45º, r= 0.5 cm, l0= 2 cm, vm= 1 m/s, c = 0.04
(m/s)-1
0
1A calculated using
Eq. 6.2
DI water: 0.21,
Castrol Clearedge 6519 at 12.5% dilution: 0.24
Castrol Clearedge 6519 at 25% dilution: 0.23

120
Table 6.2 Single droplet normalized contact lengths and height at maximum
spreading
Droplet Speed (m/s) 0.5 2 4 6 8 10
d1/d0
DI Water 1.56 1.73 1.87 2.04 1.83 1.93
12.5% Castrol 6519 1.53 1.80 2.00 2.30 2.20 2.35
25% Castrol 6519 1.42 1.63 1.87 2.15 2.10 2.35
d2/d0
DI Water 1.38 1.42 1.46 1.54 1.67 1.75
12.5% Castrol 6519 1.33 1.46 1.54 1.71 1.83 2.04
25% Castrol 6519 1.25 1.33 1.46 1.63 1.75 1.96
h/d0
DI Water 0.67 0.53 0.51 0.47 0.35 0.3
12.5% Castrol 6519 0.53 0.36 0.27 0.21 0.17 0.16
25% Castrol 6519 0.5 0.38 0.34 0.26 0.21 0.2
Figure 6.1 is a plot of heat transferred to the droplets (Q) as a function of droplet
speed for each of the three cutting fluids. The model predictions in Fig. 6.1 show that
12.5% Castrol 6519 is most effective whereas DI Water is least effective in providing
cooling to the cutting zone. As the fluid viscosity increases for 25% Castrol 6519, the
contact diameters decrease and the height increases resulting in a decrease in the amount
of heat transferred from the surface to the droplet. For DI Water, the contact diameters
are the smallest and height largest due to high surface tension, resulting in smallest
amount of heat transferred from the surface. Even though the thermal conductivity of
both 12.5% Castrol 6519 and 25% Castrol 6519 are smaller than of DI Water, the contact
angles of the latter result in a smaller value of 0
1A (Table 6.1) indicating reduced
capability of transferring heat from the surface. Figure 6.1 further shows that for a given

121
fluid the heat transfer increases with increase in the droplet speed. As presented in Table
6.2, the contact diameters increase and the height decreases with increase in droplet speed
resulting in increase in the heat transfer. Figure 6.1 also shows that the rate of increase of
heat transfer with droplet speed is lowest for DI Water and almost comparable for 12.5%
Castrol 6519 and 25% Castrol 6519.
Figure 6.1 Model prediction of heat transfer vs. droplet speed
Figure 3.6 in Chapter 3 shows the experimental cutting temperatures for the conditions
used by the model in Fig. 6.1 (repeated here as Fig. 6.2). As seen by the trends in the
cutting temperatures in Fig. 6.2, the minimum cutting temperature occurs when 12.5%
Castrol 6519 is used. This indicates that 12.5% Castrol 6519 takes maximum amount of
heat from the cutting zone, as predicted by the model results in Fig. 6.1. Figure 6.2
further shows that DI Water results in the least drop in the temperature in cutting zone
(i.e., the least heat transferred to the droplet) as again confirmed by the model predictions
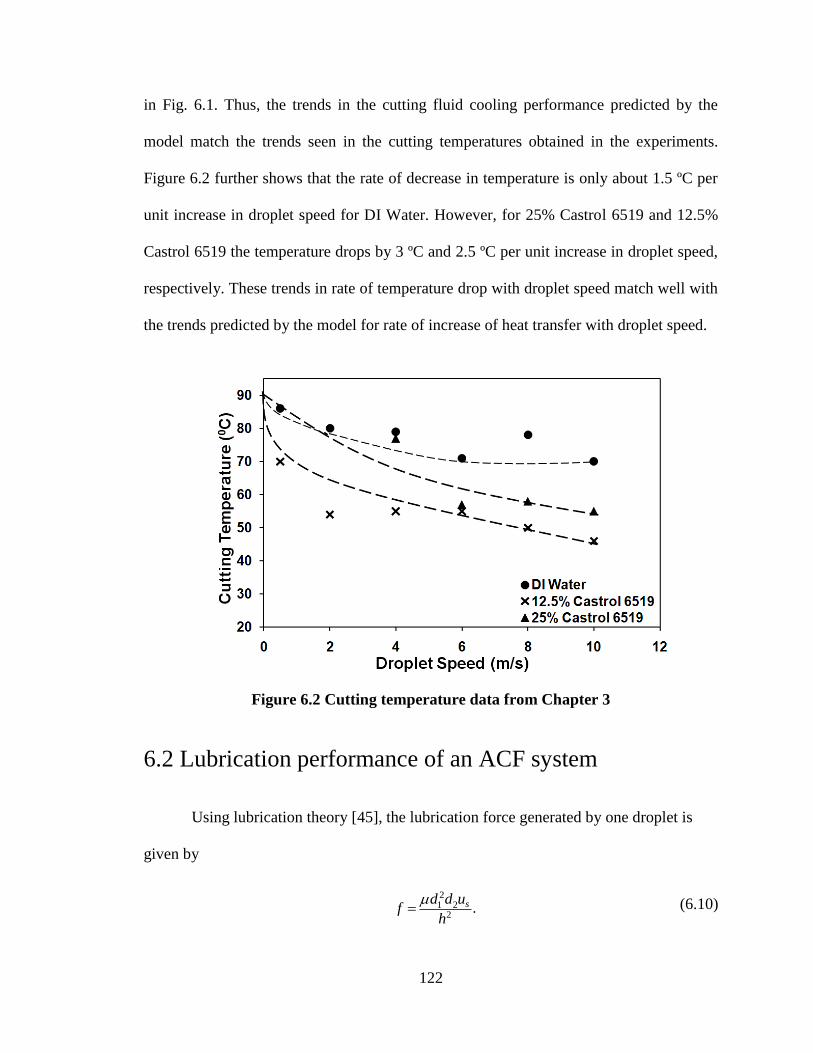
122
in Fig. 6.1. Thus, the trends in the cutting fluid cooling performance predicted by the
model match the trends seen in the cutting temperatures obtained in the experiments.
Figure 6.2 further shows that the rate of decrease in temperature is only about 1.5 ºC per
unit increase in droplet speed for DI Water. However, for 25% Castrol 6519 and 12.5%
Castrol 6519 the temperature drops by 3 ºC and 2.5 ºC per unit increase in droplet speed,
respectively. These trends in rate of temperature drop with droplet speed match well with
the trends predicted by the model for rate of increase of heat transfer with droplet speed.
6.2 Lubrication performance of an ACF system
Using lubrication theory [45], the lubrication force generated by one droplet is
given by
21 2
2.sd d u
fh
(6.10)
Figure 6.2 Cutting temperature data from Chapter 3

123
In order to estimate the total lubrication force generated by the fluid, f should be
multiplied by the number of droplets in the tool-chip interface. While it is difficult to
know the exact number of droplets that are penetrating the tool-chip interface, it can be
assumed that this number is proportional to the number of droplets reaching the vicinity
of the cutting zone (N). Therefore, the total lubrication force is given by
F Nf (6.11)
where, is a proportionality constant. The magnitude of the lubrication force indicates
the extent to which the fluid is capable of reducing friction force in the cutting zone. High
lubrication force implies large reduction in friction and thus reduced magnitude of the
cutting forces. The droplet contact diameter and height values listed in Table 6.2 are used
to calculate the lubrication force F. In order to compare the trends in the lubrication
force, F is normalized using the lubrication force produced by DI Water droplets at a
droplet speed of u0=0.5 m/s. Figure 6.3 shows the variation of normalized lubrication
force with droplet speed for the three cutting fluids. Figure 6.3 shows that 25% Castrol
6519 generates the highest lubrication force whereas DI Water generates the lowest
lubrication force. Due to larger oil content the viscosity of 25% Castrol 6519 is higher
which results in maximum lubrication force generated as shown by Eq. 6.10. For each of
three fluids, an increase in lubrication force with increase in droplet speed is observed. As
the spreading increases with increase in droplet speed, higher lubrication force is
generated.
Table 3.4 in Chapter 3 shows the experimental cutting forces obtained for the
conditions simulated by the model in Fig. 6.3 (repeated here as Table 6.3). Table 6.3

124
shows that 25% Castrol 6519 is most effective in lubricating the cutting zone and DI
Water is the least effective. This trend is same as that predicted by the lubrication model
above. Note in Table 6.3, that the measured cutting force for dry machining was 1.55 N.
Figure 6.3 Model prediction of lubrication force vs. droplet speed
Table 6.3 Cutting force data
Dry
cutting 1.55 N
Droplet
Speed
(m/s)
Cutting Force (N)
DI Water 12.5% Castrol 6519 25% Castrol 6519
0.5 1.39 1.09 NA
2 1.32 1.12 NA
4 1.18 1.28 0.44
6 1.43 NA 0.60
8 1.26 1.15 1.25
10 1.44 1.15 0.93

125
6.3 Predicting Cooling and Lubrication for ACF-based
Micro-turning Process: A Parametric Study
In this section, a parametric study is presented to identify the significant factors
affecting the cooling and lubrication performance of an ACF system. The control
variables of an ACF system are the cutting fluid properties (viz., surface tension and
viscosity), droplet characteristics (viz., droplet diameter and droplet speed) and the
number of droplets reaching the cutting zone per second (inversely proportional to the
penetration coefficient). The cutting fluid properties are dependent on the type of cutting
fluid used and the concentration of the base fluid used for dilution as shown in Chapter 3.
The droplet characteristics are determined by the type of atomizer used for the ACF
system. For a given atomizer the volume flow rate is fixed and the droplet size can be
adjusted by changing the frequency of the atomizer [55]. The droplet speed can be
independently adjusted by changing the speed of the air jet [54]. The penetration
coefficient can be changed by changing the distance of nozzle from the cutting zone or by
changing the nozzle geometry.
Table 6.4 shows the factor levels for analyzing the effect of cutting fluid surface
tension, viscosity, droplet diameter, droplet speed, and penetration coefficient on the
cooling and lubrication performance of an ACF system. The values chosen are the low
and high levels of the typical parameters used in an ACF system [2]. A surface speed (us)
of 2 m/s and ambient temperature (T0) of 25°C were chosen for calculating the cooling
and lubrication response.

126
Table 6.4 Factor levels for 25
design
Factor Low High
Surface Tension (σ) 42 mN/m 72 mN/m
Viscosity (µ) 1 cP 3 cP
Droplet Diameter (d0) 12 µm 20 µm
Droplet Speed (u0) 2 m/s 10 m/s
Penetration Coefficient (c) 0.01 (m/s)-1
0.04 (m/s)-1
A 25 full factorial design analysis was conducted for the above listed conditions.
Using Eqs. 6.5 and 6.11, heat transfer and normalized lubrication force were calculated
and effect estimates were then determined. Based on the normal probability plots of the
estimated effects, the significant main and interaction effects were identified and used to
interpret the effect of control variables on the ACF system performance.
6.3.1 Cooling Performance
The analysis of the 25
design reveals five main effects and two two-factor
interaction effects to be significant as presented in Table 6.5. The main effects of the
variables involved in the two-factor interactions should be interpreted with caution.
Figures 6.4a-b show the two-way diagrams for droplet speed-penetration coefficient
interaction and surface tension-droplet speed interaction.
Figure 6.4a shows that the increase in heat transfer with reduction in penetration
coefficient is much larger at higher droplet speed. As presented in Section 6.1, an
increase in droplet speed leads to increase in heat transfer. Furthermore for a given
droplet speed, reduction in the penetration coefficient leads to increased droplet number
density in the cutting zone resulting in a large overall increase in heat transfer. Figure
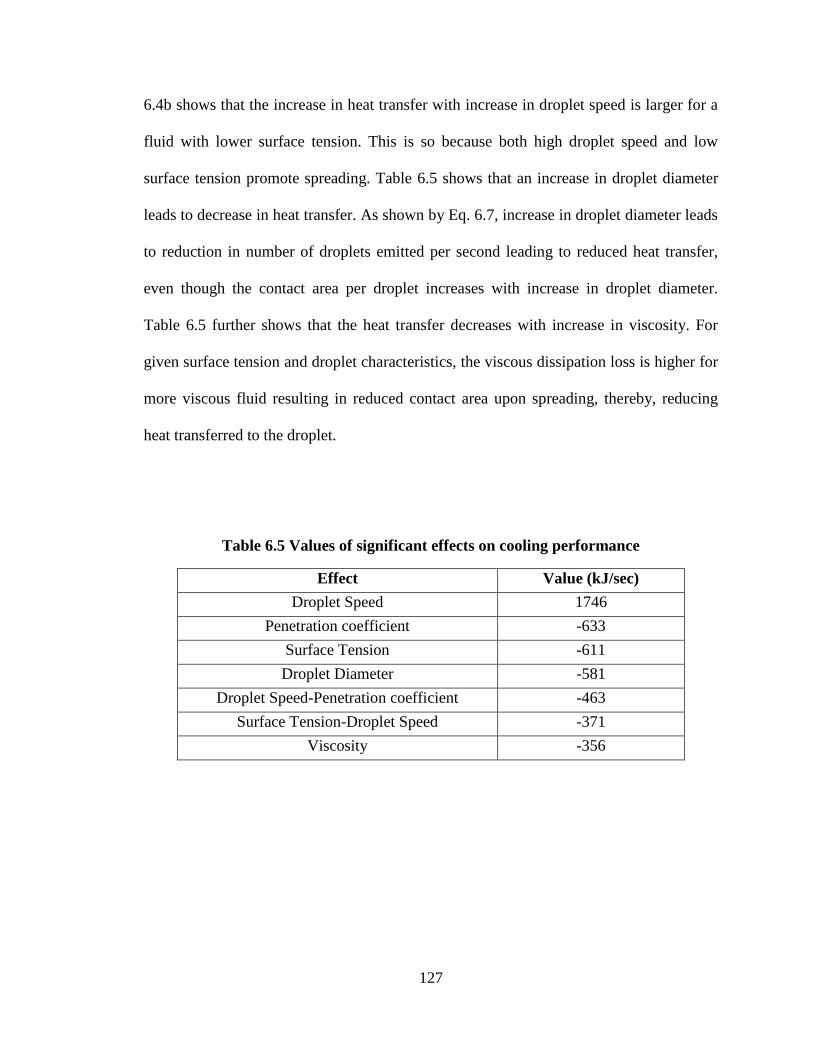
127
6.4b shows that the increase in heat transfer with increase in droplet speed is larger for a
fluid with lower surface tension. This is so because both high droplet speed and low
surface tension promote spreading. Table 6.5 shows that an increase in droplet diameter
leads to decrease in heat transfer. As shown by Eq. 6.7, increase in droplet diameter leads
to reduction in number of droplets emitted per second leading to reduced heat transfer,
even though the contact area per droplet increases with increase in droplet diameter.
Table 6.5 further shows that the heat transfer decreases with increase in viscosity. For
given surface tension and droplet characteristics, the viscous dissipation loss is higher for
more viscous fluid resulting in reduced contact area upon spreading, thereby, reducing
heat transferred to the droplet.
Table 6.5 Values of significant effects on cooling performance
Effect Value (kJ/sec)
Droplet Speed 1746
Penetration coefficient -633
Surface Tension -611
Droplet Diameter -581
Droplet Speed-Penetration coefficient -463
Surface Tension-Droplet Speed -371
Viscosity -356

128
Figure 6.4 Two-way diagrams for cooling performance
In summary, for maximum cooling performance the ACF system should be
designed such that the penetration coefficient is low, droplet speed is high, droplet
diameter is small and the cutting fluid has low surface tension and low viscosity values.
Penetration coefficient can be increased by decreasing the distance of the nozzle from the
cutting zone and/or by changing the nozzle geometry to produce a less divergent flow.
6.3.2 Lubrication Performance
The analysis of the 25 design reveals three main effects and two two-factor
interaction effects to be significant as presented in Table 6.6. As all of the main effects
are found to be included in significant two-factor interaction effects, their effects must be
interpreted in concert with each other. Figures 6.5a-b show the two-way diagrams for
viscosity-droplet speed interaction and surface tension-droplet speed interaction. As
(a) (b)

129
shown by Fig. 6.5a increase in lubrication force with increase in viscosity is much larger
at higher droplet speed. Increase in viscosity (attributed to larger oil content) leads to an
increase in the lubrication force. As shown in Table 6.2, at higher droplet speed the
contact lengths are larger and height is smaller resulting in a further increase in
lubrication force. Figure 6.5b shows that the increase in lubrication force with decrease in
surface tension is again greater at high droplet speed. As shown in Table 6.2, low surface
tension coupled with high droplet speed leads to increased spreading resulting in higher
lubrication force.
It is noted that while the number of droplets reaching the cutting zone per second
is important to cooling it does not show significant effect on lubrication. This appears to
reflect the fact that cooling occurs over a larger area in the general vicinity of the cutting
zone while lubrication and its effect on cutting force is a much more localized
phenomena, viz., at the tool-chip interface.
Table 6.6 Values of significant effects on lubrication performance
Effect Value
Viscosity 1.92
Droplet Speed 1.77
Surface Tension -0.92
Viscosity-Droplet Speed 0.90
Surface Tension-Droplet Speed -0.60

130
Figure 6.5 Two-way diagrams for lubrication performance
6.4 Chapter Summary
The output of the droplet spreading model is used as input to a system of
equations to model the cooling and lubrication performance of an ACF-based micro-
machining process. The quantitative results obtained from the cooling and lubrication
models, when compared to the performance trends observed in the micro-turning
experiments presented in Chapter 3 show good agreement lending credence to the ability
of the model to predict the cooling and lubrication performance of an ACF system.
Droplet speed is observed to have a dominant effect on the cooling performance of an
ACF system with high droplet speed greatly increasing the heat transfer. A decrease in
fluid surface tension at high droplet speed further increases the cooling performance. It is
noted that the cooling performance is directly proportional to the number of droplets
(a) (b)

131
reaching the cutting zone per second and inversely proportional to the droplet diameter.
The lubrication performance of an ACF system is also greatly increased by an increase in
the droplet speed. A fluid with low surface tension and high viscosity further increases
the lubrication performance.

132
Chapter 7
Conclusions and Recommendations
7.1 Conclusions
This thesis investigates the effect atomization-based cutting fluid (ACF) system
parameters and machining conditions on the cooling and lubrication performance in
micro-machining processes in order to enable the design of efficient ACF systems.
The research was carried out in two phases. First, droplet behavior on a rotating
surface was investigated experimentally to better understand the physics underlying the
cooling and lubrication performance of ACF systems. Micro-turning experiments were
conducted and the cutting performance was evaluated for cutting fluids with varying
physical properties and at different droplet speeds. Single droplet impingement
experiments were then conducted on a rotating surface for fluids with different surface
tension and viscosity values to study the droplet spreading and evaporation behavior. The
machining results were interpreted in light of results from single droplet experiments to
identify the factors affecting the performance of an ACF system.
Second, model development was undertaken to predict the cooling and lubrication
performance of ACF systems. Single droplet impingement experiments were conducted
to capture the 3D shape of droplet upon impact on a rotating surface. A parameterization
scheme was developed to define the 3D shape of a droplet and use it to model droplet
spreading on a rotating surface. The output of the spreading model was used to predict
133
the heat transferred from the cutting zone to the droplets and the lubrication force
generated by the droplets at the tool-chip interface.
7.1.1 Experimental Investigation
The following conclusions can be drawn from the experimental work conducted in
this thesis:
1. Micro-turning experiments indicate that a cutting fluid with low surface tension
and low viscosity generates lower cutting temperatures. Cutting temperatures are
observed to decrease steadily with an increase in the droplet speed up to 6 m/s
beyond which no significant reduction in temperature is seen. A fluid with low
surface tension and high viscosity is observed to generate lower cutting forces.
2. The single droplet experiments show that the droplet evolution on a rotating
surface occurs in four phases, viz., kinetic, spreading, relaxation and evaporation
which is similar to the evolution observed in case of a stationary surface. In the
spreading phase, the droplets are observed to take either the shape of a spherical
cap or a deformed-ellipsoidal cap based on the resultant of the droplet impact
speed and the surface velocity.
3. The droplet spreading is observed to increase with an increase in the surface
speed. It is also observed to increase with a decrease in surface tension but does
not appear to change with the fluid viscosity.
4. The evaporation rate of a droplet on a rotating surface is observed to be higher
than that of a droplet on a stationary surface owing to increased convective heat
134
transfer. A fluid with low surface tension and low viscosity is observed to have
higher evaporation rate than a fluid with high surface tension and/or high
viscosity.
5. The micro-turning experiments and the single droplet experiments indicate that
the cutting temperatures are a strong function of the droplet evaporation behavior.
On the other hand, the cutting forces appear to be dependent on the fluid viscosity
and do not exhibit strong dependence on the droplet contact diameter.
6. The fluid surface tension and viscosity (owing to increased oil content) values
appear to result in a trade-off in the machining performance for the atomized
cutting fluid application. A decrease in surface tension is observed to aid cooling
in the cutting zone. However, for a given surface tension value, the fluid with
higher viscosity significantly reduces the cutting force but results in a modest
increase in the cutting temperatures.
7.1.2 Model Development and Interpretation
1. A parameterization scheme has been developed to characterize the 3D shape of a
droplet impinging upon a rotating surface. Given the droplet contact lengths,
contact angles, and height, the equation defining the droplet surface is derived.
This parameterization scheme is capable of capturing droplet volume on average
within 3% accuracy.
2. An energy-based spreading model has been developed to predict the droplet
contact lengths and height at the maximum spread condition. Expressions for

135
droplet surface energy, viscous energy dissipation and relation between contact
lengths have been developed. The spreading model predicts the droplet lengths
and height on average within 10% accuracy.
3. The output of the droplet spreading model is used as input to a system of
equations to model the cooling and lubrication performance of an ACF-based
micro-machining process. The quantitative results obtained from the cooling and
lubrication models, when compared to the performance trends observed for the
micro-turning experiments show good agreement lending credence to the ability
of the model to predict the cooling and lubrication performance of an ACF
system.
4. Based on the model predictions, droplet speed is observed to have a dominant
effect on the cooling performance of an ACF system with high droplet speed
greatly increasing the heat transfer. A decrease in fluid surface tension at high
droplet speed further increases the cooling performance. It is noted that the
cooling performance is directly proportional to the number of droplets reaching
the cutting zone per second and inversely proportional to the droplet diameter.
5. Lubrication performance of an ACF system is also greatly increased by an
increase in the droplet speed. A fluid with low surface tension and high viscosity
further increases the lubrication performance.

136
7.2 Recommendations for Future Work
Below are suggestions for extending the research in order to better understand and
implement the use of ACF systems in micromachining operations.
7.2.1 Further experimentation to improve the design of ACF
systems
1. Further micro-machining experiments should be carried out to examine the
effect of nozzle angle and distance of nozzle from the cutting zone on the
cooling and lubrication performance.
2. The study of effect of spray pattern (full cone, hollow cone, flat stream) on the
machining performance should be carried out. Spray pattern that ensures
maximum penetration of the droplets into the cutting zone is desired for
efficient performance of ACF systems. A study of effect of spray pattern on
the machining performance will yield useful information regarding the type of
spray nozzles to be used for improved performance of ACF systems.
3. The effect of angle at which spray is directed with respect to the feed direction
should be investigated. Some prior studies on the use of MQL in machining
indicate that the angle at which the spray is injected into the cutting zone
affects the machining performance. Further experimentation to understand the
relation between angle at which spray is directed with respect to the feed
direction will enable improved design of ACF systems.
137
4. The exact mechanism of lubrication in ACF systems is not very well
understood. Prior studies on use of MQL in machining hypothesize that the
lubrication action occurs either by capillary action of the fluid droplets into
the tool-chip interface or by formation of barrier layers at the tool-chip
interface to reduce friction. High-speed imaging of the micro-machining
operation should be conducted to better understand the lubrication mechanism
at the tool-chip interface. The knowledge can be further used to develop better
models to capture the tribology of atomized cutting fluid application in micro-
machining processes.
7.2.2 Further modeling studies to capture the mechanism of ACF
systems
1. The spreading model should be modified to account for the surface roughness
of the solid surface so that the model can be applied to micro-machining
processes wherein the ridges on the surface are of the order of the diameter of
the impinging droplets.
2. Further modeling studies need to be undertaken to predict the cutting
temperature and cutting force for use of ACF systems in micro-machining.
Models that predict the cutting temperature and cutting force can be used to
determine the desired value of the design parameters (droplet diameter,
droplet speed, fluid surface tension, fluid viscosity, penetration coefficient) of
an ACF system for a given micro-machining operation.

138
7.2.3 Implementation of improved ACF system
The parametric study presented in Chapter 6 identified the design parameters that
determine the cooling and lubrication performance of an ACF system. The design of an
ACF system should be undertaken to test the predictions of the parametric study. This
ACF system should be equipped with control of droplet characteristics (viz., droplet
diameter and droplet speed), fluid properties (viz., surface tension and viscosity) and
penetration coefficient so that the effect of independent parameters on the machining
performance can be identified.

139
Bibliography
1. Jun, M.B.G., Liu, X., DeVor, R.E., and Kapoor, S.G., 2006, “Investigation of the
dynamics of micro-end milling, Part 1: Model development,” Journal of
Manufacturing Science and Engineering, Transactions of the ASME, 128(4), pp.
893–900.
2. Jun, M.B.G., Suhas, S.J., DeVor, R.E., and Kapoor, S.G., 2008, “An experimental
evaluation of an atomization-based cutting fluid application system for
micromachining”, Journal of Manufacturing Science and Engineering,
Transactions of the ASME, 130(3), pp. 0311181-8.
3. Sirignano, W.A., 1999, “Fluid dynamics and transport of droplets and sprays,”
Cambridge University Press.
4. Chandra, S., and Avedisian, C.T., 1991, “On the collision of a droplet with a solid
surface,” Proceedings of the Royal Society (London), 432(A), pp.13–41.
5. Mao, T., Kuhn, D.C.S. and Tran, H., 1997, “Spread and rebound of liquid droplets
upon impact on flat surfaces,” AIChE Journal, 43(9), pp. 2169-2179.
6. Pautsch, A.G. and Shedd, T.A., 2004, "Correlation of heat transfer data to film
thickness data of the thin film found in spray cooling", 2004 ASME International
Mechanical Engineering Congress and Exposition, IMECE, Nov 13-19 2004,
Anaheim, CA, United States, pp. 525-532.

140
7. Mathews, W.S., Lee, C.F. and Peters, J.E., 2003, "Experimental investigations of
spray/wall impingement," Atomization and Sprays: Journal of the International
Institutions for Liquid Atomization and Spray Systems, 13, no. 2-3, pp. 223-242.
8. Stanton, D. W., and Rutland, C. J., 1998, “Multi-dimensional modeling of thin
liquid films and spray-wall interactions resulting from impinging sprays,” Int. J.
Heat Mass Transfer, 41(20), pp. 3037–3054.
9. Stow, C. D., and Hadfield, M. G., 1980, “An experimental investigation of fluid
flow resulting from the impact of a water drop with an unyielding dry surface,”
Proc. R. Soc. London, Ser. A, 373(1755), pp. 419–441.
10. Povarov, O.A., Nazarov, O.I., Igant’evskaya, L.A., and Nikol’skii, A.I., 1976,
“Interaction of drops with boundary layer on rotating surface”, Journal of
Engineering Physics, 31, pp 1453–1456.
11. Mundo, C., Sommerfeld, M. and Tropea, C., 1995, "Droplet-wall collisions:
Experimental studies of the deformation and breakup process," International
Journal of Multiphase Flow, 21, no. 2, pp. 151-173.
12. Chen, R.H. and Wang, H.W., 2005, “Effects of tangential speed on low-normal-
speed liquid drop impact on a non-wettable solid surface,” Experiments in fluids,
39(4), 754-760.
13. Attané, P., Girard, F., and Morin, V., 2007, “An energy balance approach of the
dynamics of drop impact on a solid surface,” Physics of Fluids, 19, pp. 012101-
17.
14. Bechtel, S.E., Bogy, D.B. and Talke, F.E., 1981, "Impact of liquid drop against a
flat surface," IBM Journal of Research and Development, 25(6), 963-971.

141
15. Lim, T., Han, S., Chung, J., Chung, J. K., Ko, S., Grigoropoulos, C. P., 2009,
“Experimental study on spreading and evaporation of inkjet printed pico-liter
droplet on a heated substrate,” International Journal of Heat and Mass Transfer,
52, pp. 431-441.
16. Adair, K.G., 2009, “Development of a unique topology for a hard turning micro-
scale machine tool,” M.S. Thesis, University of Illinois at Urbana-Champaign.
17. Weinert, K., Inasakiz, I., Sutherland, J.W., Wakabayashi, T., 2004, “Dry
machining and minimum quantity lubrication,” CIRP Annals- Manufacturing
Technology, 53(2), pp. 551-537.
18. Brinksmeier, E., Walter, A., Janssen, R., Diersen, P., 1999, “Aspects of cooling
lubrication reduction in machining advanced materials,” Proceedings of the
Institution of Mechanical Engineers, 213, pp. 769-778.
19. Lacalle, Lopez de L.N., Angulo, C., Lamikiz, A., S´anchez, J.A., 2006,
“Experimental and numerical investigation of the effect of spray cutting fluids in
high speed milling,” Journal of Materials Processing Technology, 172, 11-15.
20. Ueda, T., Hosokawa, A., Yamada, K., 2006, “Effect of oil mist on tool
temperature in cutting,” Journal of Manufacturing Science and Engineering,
Transactions of the ASME, 128, 130-135.
21. Liao, Y.S., and Lin, H.M., 2007, “Mechanism of minimum quantity lubrication in
high-speed milling of hardened steel,” International Journal of Machine Tools &
Manufacture, 47, pp. 1660-1666.

142
22. Dhar, N.R., Ahmed, M.T., and Islam, S., 2007, “An experimental investigation on
effect of minimum quantity lubrication in machining AISI 1040
steel,”International Journal of Machine Tools & Manufacture, 47, pp. 748-753.
23. Vogler, M. P., DeVor, R. E. and Kapoor, S. G., 2001, "Microstructure-level force
prediction model for micro-milling of multi-phase materials", 2001 ASME
International Mechanical Engineering Congress and Exposition, Nov 11-16 2001,
New York, NY, United States, pp. 3-10.
24. Vogler, M. P., Kapoor, S. G. and DeVor, R. E., 2004, "On the modeling and
analysis of machining performance in micro-endmilling, part II: Cutting force
prediction," Journal of Manufacturing Science and Engineering, Transactions of
the ASME, 126, no. 4, pp. 695-705.
25. Rukosuyev, M., Goo, C.S., Jun, M.B.G., and Park, S.S., 2010, “Design and
development of cutting fluid system based on ultrasonic atomization for micro-
machining,” Transactions of the North American Manufacturing Research
Institution of SME, 38, pp. 97-104.
26. Bittorf, P. J., S. G. Kapoor, R. E. DeVor, and N. Rajagopalan, 2006, “Effect of
Water Phase Surface Tension and Viscosity on Metalworking Fluid
Functionality,” Transactions of the North American Manufacturing Research
Institution of SME, 34, pp. 555-562.
27. Lacas, F., Versaevel, P., Scouflaire, P., and Coeur-Joly, G., 1993, “Design and
Performance of an Ultrasonic Atomization System for Experimental Combustion
Applications,” Particle & Particle Systems Characterization, 11, pp. 166-171.

143
28. Bouse, L.F., 1994, “Effect of nozzle type and operation on spray droplet size,”
Transactions of the ASAE, 37, pp. 1389-1400.
29. Yarin, A.L., 2006, “Drop impact dynamics: Splashing, Spreading, Receding,
Bouncing”, Annual Review of Fluid Mechanics, 38, pp. 159-192.
30. Wachters, L.H.J., and N. A. J. Westerling, N.A.J., 1966, “The heat transfer from
a hot wall to impinging water drops in the spherical state,” Chemical Engineering
Science, 21, pp. 1047-1056.
31. Levin, Z., and Hobbs, P.V., 1971, “Splashing of water drops on solid and wetted
surfaces: hydrodynamics and charge separation,” Transactions of Royal Society
of London, 269(A), pp. 555-585.
32. Trujillo, M. F., Mathews, W. S., Lee, C. F. and Peters, J. E., 2000, "Modelling
and experiment of impingement and atomization of a liquid spray on a wall,"
International Journal of Engine Research, 1, pp. 87-105.
33. Jayaratne, O.W., and Mason, B.J., 1964, “The coalescence and bouncing of water
drops at an air/water interface,” Proceedings of the Royal Society of London,
280(A), pp. 545-565.
34. Rodrigues, F., and Mesler, R., 1985, “Some drops don’t splash,” Journal of
Colloid and Interface Science, 106(2), 347-352.
35. Yarin, A.L., and Weiss, D.A., 1995, “Impact of drops on solid surfaces: self-
similar capillary waves, and splashing as a new type of kinematic discontinuity,”
Journal of Fluid Mechanics, 283, pp.141-173.
36. Rioboo, R., Marengo, M., Tropea, C., 2002, “Time evolution of liquid drop
impact onto solid, dry surfaces,” Experiments in fluids, 33, pp. 112–124.

144
37. Zhang, X, and Basaran, O.A., 1997, “Dynamic surface tension effects in impact
of a drop with a solid surface,” Journal of Colloids and Interface Science,187,
pp.166–178.
38. Schiaffino, S. and Sonin, A.A., 1997, “Molten droplet deposition and
solidification at low Weber numbers,” Physics of Fluids, 9(11), pp. 3172-3187.
39. Pasandideh-Fard, M., Qiao, Y.M., Chandra, S., and Mostaghimi, J., 1996,
“Capillary effects during droplet impact on a solid surface,” Physics of Fluids,
8(3), pp. 650–659.
40. Kim, H.Y., and Chun, J.H.,2001, “The recoiling of liquid droplets upon collision
with solid surfaces,” Physics of Fluids,13(3), pp. 643-659.
41. diMarzo, M., Tartarini, P., Liao, Y., Evans, D., and Baum, H., 1993, “Evaporative
cooling due to a gently deposited droplet,” International Journal of Heat and Mass
Transfer, 17, pp. 4133-4139.
42. Sadhal, S.S., and Plesset, M.S., 1979, “Effect of solid properties and contact angle
in dropwise condensation and evaporation,” Journal of Heat and Mass transfer,
101, pp. 48-54.
43. Liu, J., Han, R. and Sun, Y., 2005, “Research on experiments and action
mechanism with water vapor as coolant and lubricant in Green cutting,”
International Journal of Machine Tools & Manufacture, 45, pp. 687-694.
44. Machado, A.R., and Wallbank, J., 1996, “The effect of low lubricant volumes in
machining,” Wear, 210, pp. 76-82.
45. Langlois, W.E., 1965, “A wedge-flow approach to lubrication theory,” Quarterly
of Applied Mathematics, 23(1), pp. 39-45.

145
46. Yang, L., Shivpuri, R., 2006, “Spreading behavior of water based graphite
lubricants on hot die surfaces,” CIRP Annals-Manufacturing Technology, 55(1),
pp. 299-302.
47. Hiratsuka, K., Bohno, A., and Mendo, H., 2007, “Water droplet lubrication for
micromachines,” Materials Science, 43(3), pp. 423-428.
48. Ramamoorthy, B., and Kumar, C.R.V., 2007, "Performance of Coated Tools
During Hard Turning under Minimum Fluid Application," Journal of Materials
Processing Technology, 185(1-3), pp. 210-216.
49. Chandra, S., di Marzo, M., Qiao, Y.M., Tartarini, P., 1996, “Effect of liquid-solid
contact angle on droplet evaporation,” Fire Safety Journal, 27, pp. 141-158.
50. Chow, T.S., 1998, “Wetting of rough surfaces, “ Journal of Physics: Condensed
Matter, 27, pp. 445-451.
51. Wang, C.Y., 1973, “Axisymmetric stagnation point flow over a moving plate,”
AIChe Journal, 19, pp. 1080-1081.
52. Li, K.M., and Liang, S.Y., 2006, “Modeling of Cutting Temperature in Near Dry
Machining,” Journal of Manufacturing Science and Engineering, Transactions of
the ASME , 128, pp. 416-424.
53. Tio, K.K. and Sadhal, S.S., 1992, “Dropwise evaporation- thermal analysis of
multidrop systems,” International Journal of Heat and Mass Transfer, 35(8), pp.
1987-2004.
54. Walklate, P.J., Weiner, K.L., and Parkin, C.S., 1996, “Analysis of and
experimental measurements made on a moving air-assisted sprayer with two-

146
dimensional air-jets penetrating a uniform crop canopy,” Journal of Agriculture
Engineering Research, 63(4), pp. 365-377.
55. Dobre, M. and Bolle, L., 2002, “Practical design of ultrasonic spray devices:
experimental testing of several atomizer geometries,” Experimental Thermal and
Fluid Science, 26(2), pp. 205-211.