Analysis of Doha Agriculture Negotiation Issues Relevant to Developing and Least Developed Countries...
27
Analysis of Doha Agriculture Negotiation Issues Relevant to Developing and Least Developed Countries Alexander Sarris February 2014
-
Upload
constance-goodwin -
Category
Documents
-
view
214 -
download
0
Transcript of Analysis of Doha Agriculture Negotiation Issues Relevant to Developing and Least Developed Countries...
Analysis of Doha Agriculture Negotiation Issues Relevant to
Developing and Least Developed Countries
Alexander Sarris
February 2014

Plan of Presentation
• World agricultural trade trends and prospects• Differential performance of developed and
developing countries in international agricultural trade
• Current patterns of protection of agricultural products in developing countries
• Policies to manage the transition to a a more developed agricultural sector
• WTO rules on agriculture of particular relevance to developing countries

Global food demand: growth is slowing and shifting composition
• Population growth slowing
• Income growth helps offset slower population growth
• Products more sensitive to income growth growing more rapidly
• Consumer preferences also shifting
• Greatest demand growth in developing countries, particularly Asia.

Slow down population growth
0.0
0.5
1.0
1.5
2.0
2.5
Afr
ica
As
ia a
nd
Pa
cif
ic
Eu
rop
e
La
tin
Am
eri
ca
an
dC
ara
bb
ea
n
No
rth
Am
eri
ca
Oc
ea
nia
De
ve
lop
ed
Wo
rld
1998 - 2007
2008 - 2017

Lower GDP Growthexpected to grow fast in Asia
0
2
4
6
8
10
12In
do
ne
sia
Ma
lay
sia
Ph
ilip
pin
es
Th
aila
nd
Vie
tna
m
Ind
ia
Ch
ina
Bra
zil
Au
str
alia
Ko
rea
Ja
pa
n
US
A
EU
15
Ru
ss
ia
2005-2007
2008-2011
2008-2017

World demand growth slows: income sensitive products grow most
-1.0%
0.0%
1.0%
2.0%
3.0%
4.0%
5.0%
6.0%
7.0%
Rice
Whea
t
Coars
e Gra
ins
Bovin
e mea
t
Pigmea
t
Poultr
y
Ovin
e mea
t
Veget
able
oils
Ave
rage
ann
ual g
row
th
1998-20072008-2017

Growth in food demand in 2008-17 much higher in developing countries
-1.0%
0.0%
1.0%
2.0%
3.0%
4.0%
Whea
tRice
Coarse Grains
Bovine meat
Ovine meat
Pigmeat
Poultry
CheeseButte
r
Whole
milk powder
Skim M
ilk Powder
Oilseeds
Vegetable oils
Oilmeal
Vegetable oils
Ann
ual a
vera
ge g
row
th
DevelopedDeveloping

Supply: Moderate rate of growth
• Real prices firmness continue over medium term – Moderate level of technical progress (crop yield growth
continues, livestock revolution)– Further trade liberalization unlikely to reverse the price
trend
• Competition in export-supply is increasing– Low cost, low policy support countries increase supply
most– South America, especially Brazil has great potential
• Uncertain: energy prices, demand for biofuel

In the next ten years trade will continue to grow faster than
production…
0.0%
1.0%
2.0%
3.0%
Wheat Rice CoarseGrains
Meat, Total Oilseeds
Ann
ual a
vera
ge g
row
th %
ProductionTrade

Nominal commodity prices have risen to record highs and will likely stay high
0
200
400
600
800
1000
1200
Wheat
Rice
Maize
Oilseed
Veg Oil
Oilmeal

Real international prices:expected to decline (2005-07 average=1)
0.0
0.2
0.4
0.6
0.8
1.0
1.2
1.4
1.61995
1998
2001
2004
2007
2010
2013
2016
Wheat
Rice
Sugar
Beef
Veg. Oil
Dairy

Net grain imports other than rice have increased in Asia and Pacific
-20
-10
0
10
20
30
40
5019
86
1989
1992
1995
1998
2001
2004
2007
2010
2013
2016
mil
lio
n M
T
Wheat
Rice
Coarse Grains

Developing countries increase their
dependence on food imports
-100
-50
0
50
100
150
200
250
300
1995 2000 2005 2010 2015
$US billion (at 2004 prices)
Coarse Grains
Rice
Wheat
Vegetable oils
Oilseeds
Meat
Dairy Products
Total Net Imports
Net imports by commodity

Net imports of basic foods to grow over 3.6 % annually in LDCs
-20
0
20
40
60
80
100
120
1995 1998 2001 2004 2007 2010 2013 2016$US billion (at 2005 prices)
Dairy products
Meat
Oilseeds
vegetable Oil
Coarse Grains
Rice
Wheat
Total Net Imports
Net imports by commodity

In summary, over the next ten years….
• Global demand growth will slow. Per capita consumption continues to increase, with more growth in higher valued products.
• Supply potential continues to meet demand growth, at prices that decline in real terms
• Excess supply growth is coming more from low cost suppliers.
• Trade continues to grow, with developing country and least developed countries balance of trade in basic foods deteriorating.

Real agricultural commodity prices have declined in past 40 years.

Almost all basic food commodities have seen their international prices rise significantly over the past two
years(Commodity price indices: 1998-2000=100)
0
50
100
150
200
250
300
350
1990
1991
1992
1993
1994
1995
1996
1997
1998
1999
2000
2001
2002
2003
2004
2005
2006
2007
2008
MEAT DAIRY CEREALS OILS SUGAR

Recent basic food price developments in perspective: Nominal and real food price index
1980-2007
FAO Food Price Index 2000=100
0.00
50.00
100.00
150.00
200.00
250.00
300.00
Real: deflated by US PPI
Nominal

However, the income terms of trade for agriculture (purchasing power of agricultural exports) have evolved differently for developed, developing and least developed
countries. Why?
Income terms of trade for agriculture
0
1
2
3
4
5
6
7
8
9
1961 1966 1971 1976 1981 1986 1991 1996 2001
$US
Bil
- LD
Cs
0
20
40
60
80
100
120
140
160
180
200
$US
Bil
Oth
er d
evel
opin
g an
d In
dust
rializ
ed
LDCs
Other developing countries
Industrialized countries
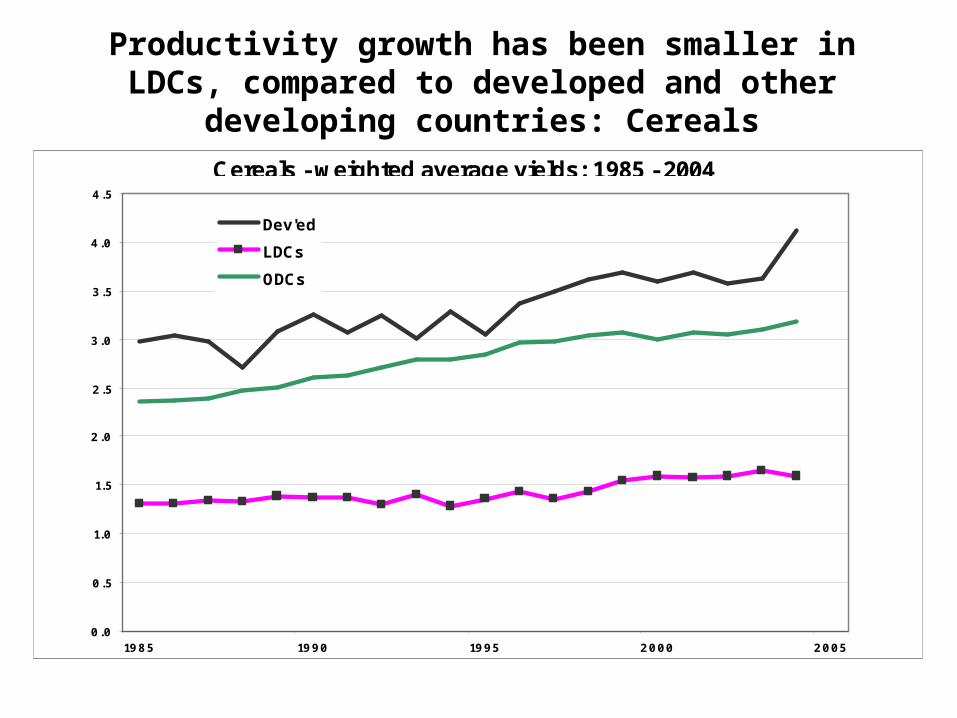
Productivity growth has been smaller in LDCs, compared to developed and other developing
countries: Cereals
0.0
0.5
1.0
1.5
2.0
2.5
3.0
3.5
4.0
4.5
1985 1990 1995 2000 2005
Dev'ed
LDCs
ODCs
Cereals - weighted average yields: 1985 - 2004

Productivity growth has been smaller in LDCs compared to developed and other developing countries:
Oilcrops
0.0
0.1
0.2
0.3
0.4
0.5
0.6
0.7
1985 1990 1995 2000 2005
Dev'ed
LDCs
ODCs
Oilcrops - weighted average yields: 1985 - 2004

Productivity growth has been smaller in LDCs compared to developed and other developing countries: Fiber
crops
0.4
0.5
0.6
0.7
0.8
0.9
1.0
1985 1990 1995 2000 2005
Dev'ed
LDCs
ODCs
Fiber crops - weighted average yields: 1985 - 2004

Productivity growth has been smaller in LDCs compared to developed and other developing
countries: Fruits
4.0
5.0
6.0
7.0
8.0
9.0
10.0
11.0
12.0
13.0
14.0
1985 1990 1995 2000 2005
Dev'ed
LDCs
ODCs
Fruits - weighted average yields: 1985 - 2004

Productivity growth has been smaller in LDCs comapred to developed and other developing
countries: Vegetables
5.0
10.0
15.0
20.0
25.0
1985 1990 1995 2000 2005
Dev'ed
LDCs
ODCs
Vegetables - weighted average yields: 1985 -2004 2004

What determines long term commodity prices?
• Cost of production of marginal producer• Marginal producers still in developing countries using
labour intensive technology with labour paid subsistence wages
• Supply of agricultural commodities highly elastic at low wages
• Demand for agricultural commodities quite inelastic• Opposite case for non-agriculture• Implication: Differential productivity gains can alter terms
of trade between agriculture and non-agriculture

How do productivity gains affect agriculture and non-agriculture?
• Productivity affects agriculture differently than non-agriculture
P
Q
p
c
p’
d
Q
P
S
S’
a
b
Panel A. Agricultural Commodity Sector Panel B. Non-agricultural sector
p
p’
a
S S’
b
D
D

Declining terms of trade for agricultural commodities due to faster rates of total factor productivity growth for agricultural than non-
agricultural products
• Rate of growth of TFP has been faster in agriculture than in non-agriculture in both developed and developing countries
• “Globalization” of agricultural research, has contributed to faster TFP growth in agriculture,
• Incidence of productivity advances largely on consumers (through lower prices) and little to producers.