Analysis of Distresses in Asphalt Pavement Transitions on ...
53
University of South Florida Scholar Commons Graduate eses and Dissertations Graduate School November 2017 Analysis of Distresses in Asphalt Pavement Transitions on Bridge Approaches and Departures Manvitha Rajalingola University of South Florida, [email protected] Follow this and additional works at: hps://scholarcommons.usf.edu/etd Part of the Civil Engineering Commons is esis is brought to you for free and open access by the Graduate School at Scholar Commons. It has been accepted for inclusion in Graduate eses and Dissertations by an authorized administrator of Scholar Commons. For more information, please contact [email protected]. Scholar Commons Citation Rajalingola, Manvitha, "Analysis of Distresses in Asphalt Pavement Transitions on Bridge Approaches and Departures" (2017). Graduate eses and Dissertations. hps://scholarcommons.usf.edu/etd/7437
Transcript of Analysis of Distresses in Asphalt Pavement Transitions on ...

University of South FloridaScholar Commons
Graduate Theses and Dissertations Graduate School
November 2017
Analysis of Distresses in Asphalt PavementTransitions on Bridge Approaches and DeparturesManvitha RajalingolaUniversity of South Florida, [email protected]
Follow this and additional works at: https://scholarcommons.usf.edu/etd
Part of the Civil Engineering Commons
This Thesis is brought to you for free and open access by the Graduate School at Scholar Commons. It has been accepted for inclusion in GraduateTheses and Dissertations by an authorized administrator of Scholar Commons. For more information, please contact [email protected].
Scholar Commons CitationRajalingola, Manvitha, "Analysis of Distresses in Asphalt Pavement Transitions on Bridge Approaches and Departures" (2017).Graduate Theses and Dissertations.https://scholarcommons.usf.edu/etd/7437

Analysis of Distresses in Asphalt Pavement Transitions on
Bridge Approaches and Departures
by
Manvitha Rajalingola
A thesis submitted in partial fulfillment
of the requirements for degree of
Master of Science in Civil Engineering
Department of Civil and Environmental Engineering
College of Engineering
University of South Florida
Major Professor: Qing Lu, Ph.D.
Fred L. Mannering, Ph.D.
Manjriker Gunaratne, Ph.D.
Date of Approval:
October 31, 2017
Keywords: Distress Types, Random Parameter Linear Regression Model
Copyright © 2017, Manvitha Rajalingola

DEDICATION
I dedicate this thesis to my family especially my parents Mr. Ganga Prathap Rajalingola
and Mrs. Anuradha Rajalingola. Because of their hard work, I was able to study in abroad. My
major professor, Dr. Qing Lu, taught me how to think critically, how to understand and explore
research topics clearly in my entire graduate study period. I really feel that without their
inspiration, guidance, and dedication, I would not be able to go through the strenuous process to
complete my thesis.

ACKNOWLEDGMENTS
I am very much thankful to my major advisor Dr. Qing Lu, for his endless support,
collegiality, and mentorship throughout the thesis work, and to all other faculty members from
whom I acquired great knowledge throughout my graduate studies.
I am very much thankful to Dr. Fred Mannering and Dr. Manjriker Gunaratne for serving
on my thesis committee. Special thanks go to my research group members, Chunfu Xin and MD
Mokaddesul Hoque, who assisted me tremendously in completing the research.
I would like to extend thanks to my friends Raghu Baireddy, Ashok Sampath, Surya
Balusu for helping me in proofreading, and for their extreme support that made me stronger and
to finish my thesis in the given period of time. I am also thankful to all the University of South
Florida (USF) library writing studio members for their helpful thesis/dissertation sessions.
I would like to thank Ms. Catherine Burton for her patience and help on my thesis format
and thesis preparation process.
My thanks also go to my family members (Mr. Ganga Prathap, Mrs. Anuradha, Ms.
Harshitha, and Ms. Nihitha) for their support from India which helped me to feel safe and stay
focused on studies.
I would like to extend my thanks to all faculty and staff in the Department of Civil and
Environmental Engineering at the USF for their help and co-operation throughout my study
program.

i
TABLE OF CONTENTS
LIST OF TABLES ......................................................................................................................... iii
LIST OF FIGURES ....................................................................................................................... iv
ABSTRACT .................................................................................................................................... v
CHAPTER 1: INTRODUCTION .................................................................................................. 1
CHAPTER 2: LITERATURE REVIEW ....................................................................................... 5
2.1 Introduction .................................................................................................................. 5 2.2 Common Types and Primary Causes of Asphalt Pavement Distresses on Bridge
Approaches and Departures .......................................................................................... 6
2.3 Nationwide Questionnaire Survey ............................................................................... 8 2.4 Previous Investigation Suggestions on Mitigation of Pavement Distresses .............. 11
CHAPTER 3: DATA COLLECTION AND DESCRIPTIVE ANALYSIS ................................ 16
3.1 Introduction ................................................................................................................ 16
3.2 Pavement Condition Analysis Based on Video Log Data ......................................... 16 3.2.1 Analysis Results of Pavement Distresses Based on Video Log
Images ........................................................................................................ 19
3.2.2 Overall Analysis and Results ..................................................................... 19 3.3 Pavement Condition Analysis Based on 2015 Pavement Condition Data ................. 22
3.3.1 Evaluation Procedure of Pavement Distresses Based on Condition
Data ............................................................................................................ 22 3.3.2 Analysis Results of Pavement Distresses Based on Condition Data ......... 23 3.3.3 Overall Analysis and Results ..................................................................... 23
3.4 Asphalt Layer Thickness Analysis............................................................................. 26 3.4.1 Selection Method of GPR Data.................................................................. 27 3.4.2 Asphalt Layer Thickness Trends ............................................................... 27
3.5 Summary of Pavement Data Analysis ....................................................................... 28
CHAPTER 4: STATISTCAL MODELLING OF BRIDGE APPROACH PAVEMENT DISTRESSES ....................................................................................................... 30
4.1 The Linear Regression with Random Parameters Model Structure ........................... 30 4.2 Other Detailed Data Collected for Modelling ............................................................ 31
4.3 Results ........................................................................................................................ 32
CHAPTER 5: CONCLUSIONS AND FUTURE RESEARCH .................................................. 37
5.1 Conclusions ................................................................................................................ 37

ii
5.2 Future Research ......................................................................................................... 39
REFERENCES ............................................................................................................................. 40
APPENDIX A: COPYRIGHT PERMISSIONS ........................................................................... 42

iii
LIST OF TABLES
Table 1 Common Types and Potential Causes of Asphalt Pavement Distresses on Bridge
Approaches/Departures .................................................................................................. 12
Table 2 Average Pavement Condition Indices for all Bridges ................................................... 24
Table 3 GPR Data Point Spacing ............................................................................................... 27
Table 4 Descriptive Statistics of Potential Variables Influencing the IRI or RUT Values
of an Asphalt Pavement ................................................................................................. 34
Table 5 Estimated Parameters for Bridge Approach and Departure Pavement Roughness
Models............................................................................................................................ 35
Table 6 Estimated Parameters for RUT on Bridge Approach and Departure Models ................ 36

iv
LIST OF FIGURES
Figure 1 Schematic Diagram of Bridge Approach/Departure Slab and Pavement Sections ........ 1
Figure 2 Elements of Typical Bridge Approach System .............................................................. 6
Figure 3 Frequencies of Reported Distresses................................................................................ 9
Figure 4 Schematic Depiction of Survey Area in One Lane around a Bridge ............................ 17
Figure 5 Wheel Path Designation in a Lane ............................................................................... 17
Figure 6 Summary of Crack Rating (CR) of Asphalt Pavements on all Bridges ....................... 20
Figure 7 Summary of Crack Rating (CR) of Asphalt Pavements on Bridges Showing
Pavement Distresses ..................................................................................................... 21
Figure 8 Distribution of Crack Rating (CR) ............................................................................... 21
Figure 9 Schematic Depiction of Survey Area in one Lane around a Bridge ............................. 23
Figure 10 Summary of Rut Rating for all Bridges ........................................................................ 24
Figure 11 Summary of IRI for all Bridges .................................................................................... 25
Figure 12 Summary of Ride Rating for all Bridges ...................................................................... 25
Figure 13 Number of Bridges with Pavement Condition Indices Indicating Distresses .............. 26
Figure 14 Comparison of Asphalt Layer Thickness ..................................................................... 28

v
ABSTRACT
Some highway agencies in the United States are experiencing frequent distresses in asphalt
pavements on bridge approaches/departures. Commonly observed distresses include alligator
cracking and rutting, which reduce roadway smoothness and safety. To lessen the distresses in
pavements it is needed to investigate the extent and root causes of the problem. Based on Florida
highway conditions, this research study mainly focused on: 1. Literature review and identification
of the extent of the problem; 2. Collection of relevant pavement condition data and descriptive
analysis; 3. Development of statistical models to determine factors influencing the distresses in
asphalt pavements on bridge approaches/departures. To the best of my knowledge, this is the first
study that uses a statistical model to determine the factors that are responsible in causing asphalt
pavement distresses on bridge approaches/departures.
As part of the literature review a nationwide questionnaire survey was targeted towards
U.S state DOTs. The data collection and analysis specific to the Florida highways found that in
2015 on Florida Interstate highways, about 27% bridges with asphalt pavements on their
approaches/departures showed signs of cracking, and about 20% bridges have noticeable rutting
in their approach or departure pavements.
A random parameter linear regression model was applied to examine the factors that may
influence distresses in asphalt pavements in Florida. Pavement condition was evaluated based on
the Florida Department of Transportation (FDOT) 2015 pavement condition data and video log
images, and other relevant data were collected from various sources such as FDOT Roadway

vi
Characteristics Inventory (RCI) database, FDOT pavement management reports, and FDOT
Ground Penetrating Radar (GPR) survey reports. A constraint existed in the availability of the
GPR data that can give pavement layer thickness, which limited the number of bridge approach
pavement sections included in the statistical modeling. Based on the limited data, the estimated
results from the random parameter linear regression model showed that the variables influencing
distresses in asphalt pavements on bridge approaches/departures, in terms of rutting and roughness,
may include pavement age, annual average daily truck traffic, and surface friction course.
1
CHAPTER 1: INTRODUCTION
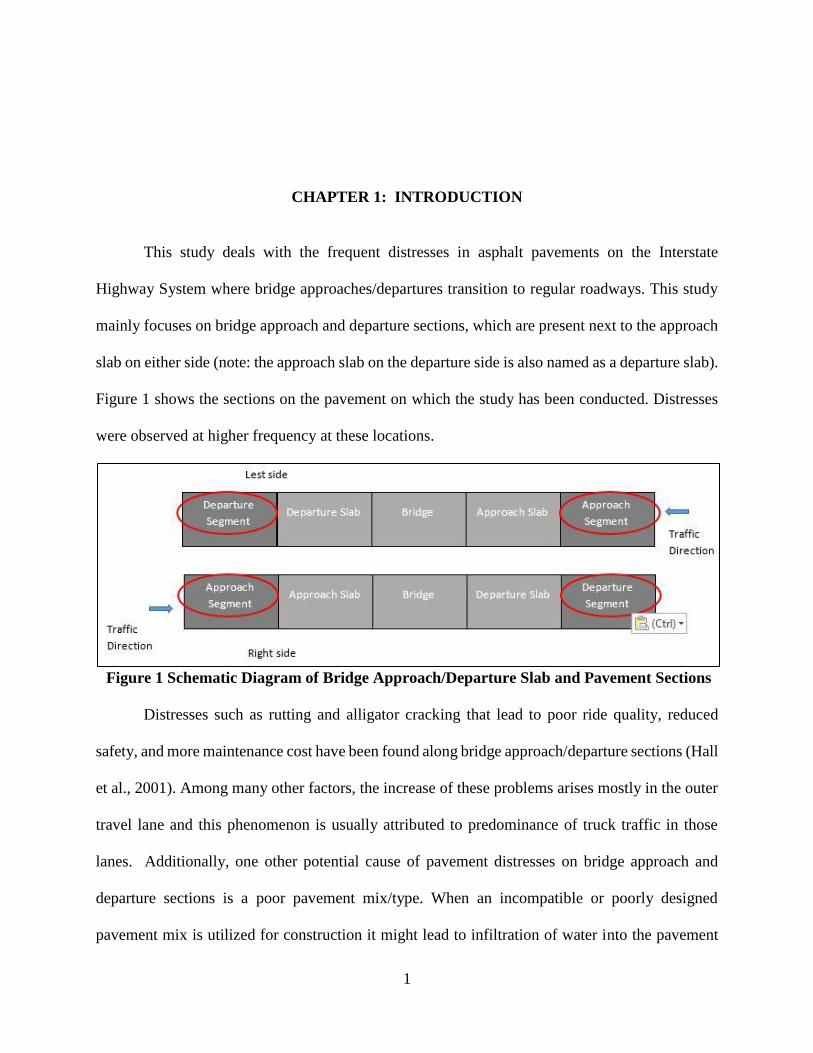
This study deals with the frequent distresses in asphalt pavements on the Interstate
Highway System where bridge approaches/departures transition to regular roadways. This study
mainly focuses on bridge approach and departure sections, which are present next to the approach
slab on either side (note: the approach slab on the departure side is also named as a departure slab).
Figure 1 shows the sections on the pavement on which the study has been conducted. Distresses
were observed at higher frequency at these locations.
Figure 1 Schematic Diagram of Bridge Approach/Departure Slab and Pavement Sections
Distresses such as rutting and alligator cracking that lead to poor ride quality, reduced
safety, and more maintenance cost have been found along bridge approach/departure sections (Hall
et al., 2001). Among many other factors, the increase of these problems arises mostly in the outer
travel lane and this phenomenon is usually attributed to predominance of truck traffic in those
lanes. Additionally, one other potential cause of pavement distresses on bridge approach and
departure sections is a poor pavement mix/type. When an incompatible or poorly designed
pavement mix is utilized for construction it might lead to infiltration of water into the pavement

2
which will subsequently cause cracks to form inside the pavement structure (Christoper et al.,
2006). Such cracks will then lead to pumping of pavement as traffic moves over the pavement.
One other likely cause of distresses on the bridge approach/departure pavement is insufficient
thickness of the asphalt pavement layer. Such deficiencies in thickness will also lead to premature
pavement failure.
A nationwide survey was conducted towards various transportation departments/agencies
regarding this topic in 2016. The results of this survey revealed that most of the state DOTs have
dealt with pavement distress issues at asphalt pavement locations adjacent to the approach slab.
Many survey participants opined that distresses are caused by poor compaction, which
leads to a weak base, insufficient drainage, and settlement issues. In states with cold climate where
snowing is common, pavement damages due to plows and studded tires are also reported. It was
also reported that, generally, cracking on these sections occurs due to inadequate drainage behind
the abutments and inadequate usage of non-erodible bases.
Few other survey participants reported that, according to them, pavement distresses occur
due to improperly placed asphalt mixtures as well as poorly maintained joint seals. Joint seals in
bad condition inhibit proper expansion and contraction of joints at pavement/bridge interface,
leading to distresses such as grade settlement or pavement expansion. Another popular opinion
expressed by survey respondents is that, distresses also appear due to saturated or weak subgrade,
moisture infiltration into pavement (stripping), and differential loading responses between asphalt
section and bridge ends.
This survey also focused on identifying structural deficiencies prevalent at study locations.
Accordingly, some questions included in the survey aimed to obtain relevant information from
respondents. Some survey participants reported that, occasionally, the bridge approaches have

3
been evaluated as structurally deficient because of drastic temperature changes, and variations in
subgrade soil. Also, difficulty in achieving optimal compaction at problematic locations resulted
in poor pavement quality. In some cases, poor contractor workmanship, heavy traffic, inadequate
compaction efforts of the base near the bridge ends, and bumping of the pavement from the
movement of the approach/departure slabs over time may also be the causes. Few other survey
participants opined that insufficient compaction at the abutment gives raise to pavement damage
at bridge ends. In some states, it was also observed that thin asphalt structure and compression
failure of underlying concrete tend to result in damages in asphalt pavements on bridge
approaches/departures. More discussion of this survey is continued in further chapters.
In addition to investigating the causes of frequent damages in asphalt pavements on bridge
approaches and departures, an attempt was made to provide suggestions on how to improve
smoothness and ride quality at the study locations. For this study, data has been collected from
mainly three sources: FDOT video log image data which can found from FDOT website;
pavement characteristics data collected directly from FDOT materials office; and other relevant
data, such as bridge number, speed limit, number of lanes, widths of lanes, cross slope,
predominant subgrade soil type, base layer type, base layer thickness, annual average daily traffic
(AADT), and annual average daily truck traffic (AADTT), can be acquired from the FDOT
Roadway Characteristics Inventory (RCI) database (FDOT, 2016). Traffic input over design
periods expressed in terms of an equivalent number of 18-kip single-axle loads (ESAL) can be
achieved from FDOT Transportation Data and Analytics Office.
Therefore, to lessen distresses at the study locations specific research objectives are as
follows:
• Identifying the main causes of premature and excessive damages in asphalt

4
pavements on bridge approaches/departures,
• Developing performance models for asphalt pavements on bridge
approaches/departures based on field data.
A literature review of past research conducted on pavement distresses on bridge
approach/departures is necessary to understand how different studies have tackled this issue and
to give a focus to the present study. In the next section, an investigation of previous studies on this
topic is presented.

5
CHAPTER 2: LITERATURE REVIEW
2.1 Introduction
As mentioned earlier, this study focuses on identifying factors associated with asphalt
pavement distresses on bridge approaches and departures. To gain a deeper understanding of this
problem, it is necessary to investigate the previous studies that dealt with the same problem.
Unfortunately, there were not many studies that focused on the specific problem being discussed
here. This section summarizes the literature review conducted as a part of this study. Additionally,
a summary of a nationwide questionnaire survey is also included in this section.
Making a smooth transition from a roadway pavement to a bridge deck has traditionally
been somewhat of a challenge because the pavement side is relatively susceptible to settlement
while the bridge deck is not. A study by the Oregon Department of Transportation (ODOT) in
2011 opined that pavement sections on bridge approaches rapidly deteriorate for various reasons
(ODOT, 2011). The problems with bridge approach pavements are widespread and require
investigations inclusive of the approach pavement system (White et al., 2007). Frequent pavement
distresses on bridge approaches and departures will compromise ride quality, increase pavement
maintenance frequency and expenditure, and increase user cost such as delay due to traffic
interruption by maintenance work and added vehicle damage (Phares et al., 2011; Long et al.,
1998).
This literature review was performed to gather information related to asphalt pavements on
bridge approaches and departures, including pavement structures and materials used, common

6
types of pavement distresses, major factors contributing to pavement distresses. While the
objectives of this study focus on asphalt pavement transition sections adjacent to a bridge
approach/departure slab, the review includes not only the pavement transition sections but also the
pavements on bridge approach/departure slabs, due to the fact that they are sometimes included in
the same definition of “bridge approach pavement” in the literature. Moreover, “bridge approach
pavement” is also used to refer to a “bridge departure pavement” in some literature. In this review,
therefore, the discussion on bridge approach pavements also applies to bridge departure
pavements. The typical elements of a bridge approach system are shown in the Figure 2
(Bernadette, et al., 2002).
Figure 2 Elements of Typical Bridge Approach System (Bernadette et al., 2002)
2.2 Common Types and Primary Causes of Asphalt Pavement Distresses on Bridge
Approaches and Departures
There are various types of distresses that are common in asphalt pavements on bridge
approaches/departures and in regular pavements, such as cracking, rutting, and bleeding. The
common causes of distresses on bridge approach pavement are given in Table 1. The performance

7
of a bridge approach is affected by the design and construction of the bridge deck, abutment, and
foundation as well as the roadway pavement system, embankment, and embankment foundation.
Major problems usually are attributed to excessive compression of the embankment and
foundation soils or inadequate compaction of the approach embankment or both. Localized soil
erosion, usually associated with inadequate provisions for drainage, also may be a contributing
factor. Frost heave or swelling soils can also be problems in some areas (Wahls, 1990).
Depending on the gradation of the fill and foundation soils, erosion can occur beneath the
approach roadway, lowering the elevation of the approach when the drainage system is poor. The
severity of elevation difference between the bridge approach and deck may cause various levels of
damage to vehicles. Settlements may occur due to simple factors in design deficiency or the fact
that the approach pavement is not constructed according to the design specifications. Poor drainage
leads to fill washouts and develops voids under the approach pavements. Distresses may also occur
due to heavy trucks that move from bridge deck onto the approach which is a sudden change from
a rigid to a flexible surface (Wahls, 1990).
Distresses may be aggravated if there is a reduced thickness of approach asphalt pavement
when compared to the regular asphalt pavement. The bridge approach settlements appear due to
lack of sufficient compaction of the backfill materials and also difference in elevations of approach
pavements and the bridge deck caused by unequal settlement of embankments and abutments. Poor
performance of the approach/departure pavements is affected by mix design, environmental
factors, quality of materials, and construction (Wahls, 1990).
A recent study indicated that settlement on bridge approach pavements may be accelerated
due to consolidation of the backfill materials, consolidation of foundation soils, and poor drainage
(Helway et al., 2007). The same study also revealed that settlements on bridges cause rider

8
discomfort, failure of bridge structure, increase of long term maintenance cost and ultimately lead
to poor driving conditions. Also, they discussed some techniques to repair the bump by slab
jacking, overlays or asphalt patching and replacement of an approach slab. They also performed
two effective mitigations techniques (geosynthetic-reinforced fill and flowable fill) to lessen
settlements on approaches for two different foundation conditions: incompressible and
compressible.
A study conducted by Laguros et al. (1990) states that factors including expansion, age of
the approach slab and the height of embankment negatively impact the backfill performance.
Similarly, it was also revealed that poor drainage leads to soil erosion which might result in
skewness of the bridge. The same study also observed that flexible pavements are more susceptible
to more settlements than rigid pavements during initial stage of construction (short term
performance), while both pavement types performed similarly over the long term.
2.3 Nationwide Questionnaire Survey
In this study, a national level questionnaire survey was conducted to identify the asphalt
pavement transitions on bridge approaches and departures. The survey was targeted towards state
DOTs in the U.S. with the aim of collecting information on a variety of aspects related to bridge
approach/departure pavements in their respective states. The survey received responses from 33
states, among which over 60% respondents noticed more distresses in asphalt pavements adjacent
to bridge approach/departure slabs than on regular roadways. In about 30% of the states, thinner
asphalt layers were observed adjacent to a bridge approach/departure slab, primarily due to the
practice of feathering down the asphalt layer during resurfacing to tie in at the bridge end slab to
maintain longitudinal grade. Many states attributed the excessive distresses in bridge approach
pavements to inadequate compaction, insufficient drainage, and differential settlement. Over 30%

9
states perform maintenance and rehabilitation activities more frequently on bridge approach
pavements, and many states do not have special maintenance and rehabilitation strategies and
guidelines for bridge approach pavements.
Figure 3 Frequencies of Reported Distresses
The results shown in Figure 3 are obtained from the nationwide questionnaire survey. As
can be seen from the figure, thirteen types of pavement distresses were reported, including shoving,
stripping, bumps, deformations, poor drainage, bleeding, cracks, settlement issues, poor
compaction, potholes, pop-outs, rutting, and raveling.
In addition to collecting information on the types of pavement distresses on bridge
approaches and departures, this survey also attempted to identify what professionals from state
DOTs across the U.S. think are the most important factors that cause the distresses. The causes of
pavement distresses at problematic locations as reported by the respondents are summarized
below.
Engineers from Arizona DOT reported that the distresses in asphalt pavement transitions
are due to material change from rigid to flexible. Several other DOTs reported that damages on
bridge approaches and departures arose due to insufficient compaction that eventually led to a
10
15
2
811 12
19
2 13
6
2 3
23
18
31
2522 21
14
31 3230
27
31 30
0
5
10
15
20
25
30
35
Reporting States Unreporting States

10
weak base. Inadequate drainage and settlement issues are also reported by many states. Alaska
DOT opined that damages near problematic bridges are due to plows and studded tires, which are
commonly used in their jurisdiction. Caltrans answered that most of the cracks appear due to
inadequate drainage behind the abutments and insufficient usage of non-erodible base.
Similarly, Georgia and Hawaii DOTs reported that they have observed the main causes for
pavement distress as improperly placed asphalt mixtures as well as poorly maintained joint seal.
Illinois DOT reported that the main causes of distress are expansion and contraction of joints at
pavement/bridge interface, grade settlement, and pavement expansion.
Oregon DOT reported the potential causes of pavement distresses on bridge approaches
include a saturated and/or weak subgrade, moisture infiltration into pavement (stripping), and
differential loading responses between asphalt section and bridge ends. Occasionally, the bridge
approaches have been evaluated as structurally deficient. In South Carolina, the DOT reported that
temperature changes at problematic locations and variation in subgrade result in segregation. Also,
difficulty in achieving optimal compaction at problematic locations also results in poor pavement
quality.
Poor contractor workmanship was cited as a reason for distresses by MnDOT. In Rhode
Island the DOT engineers identified the potential causes of asphalt pavement damage as time and
traffic. Mississippi DOT gave two main causes of pavement distress near bridge ends, which are
inadequate compaction efforts of the base near the bridge ends and the bumping of the pavement
from the movement of the approach/departure slabs over time. Maryland DOT opined that
insufficient compaction at the abutment gives rise to pavement damage at bridge ends. NDOT said
that the cracks on bridge approaches and departures appear due to saturated subgrade. MODOT
and UDOT mentioned differential settlement between the pavement and bridge structures to be the

11
cause of distresses on bridge approaches and departures. In Washington and Wisconsin states, the
distresses are caused by thin asphalt structure and compression failure of underlying concrete.
The observations made by experienced pavement engineers from various state DOTs
provide valuable insight on what kind of factors might affect pavements on bridge approaches and
departures. The results of this survey along with a strong statistical analysis of pavement data
collected in Florida will help in achieving the prime objective of this study.
2.4 Previous Investigation Suggestions on Mitigation of Pavement Distresses
A study conducted by FHWA (James, et al., 1991) revealed that 70 percent of the bumps
at approach slabs can be reduced by better feathering. Removal of the discontinuity to a significant
level can be done by milling of existing asphalt pavements before the approach slabs for some
distance. However, it is not known whether a standard exists for such treatment. Pavement design
engineers should provide a desired profile to the maintenance personnel if there is no such specific
standard. During the field inspections discontinuities were observed at most of the instances, which
justified development of a better asphalt concrete overlay near approach slabs. The primary
function of the approach slab is to provide a gradual transition, or a ramp, between the fixed
superstructure and the settling embankment. Without an approach slab, the “bump” at the end of
the bridge becomes much more abrupt. However, to maintain the level of rider comfort at
approaches, Briaud et al. (1997) recommended a maximum allowable change in slope of 1/200,
based on studies by Wahls (1990) and Start et al.(1995). Long et al.(1998) also proposed a relative
gradient of less than 1/200 to ensure rider comfort and a gradient of between 1/100 and 1/125 as a
criterion for initiating remedial measures.
Moreover, Ohio State DOT stated that it is important to keep the approaches to the bridge
as smooth as possible. While new alignments (roads) will have some area where embankment will

12
not settle somewhat even after an optimum compaction, the pavement end of the approach slab
may still settle by creating uneven transitions onto the bridge from trucks.
The results of nationwide survey made it clear that there exist multiple contributing factors
to asphalt pavement distresses at bridge approaches and departures. These results would be helpful
in identifying what factors are responsible for the same problem in Florida. The next step in this
study is to analyze data collected from Florida DOT, results of the nationwide survey will aid in
interpretation of the results of data analysis task and consequently in identifying factors causing
asphalt distresses at bridge approaches and departures in Florida.
Table 1 Common Types and Potential Causes of Asphalt Pavement Distresses on Bridge
Approaches/Departures
Distress Description Possible Causes
Approach slab ramp
Differential settlement between
bridge and approach slab
• Consolidation of
foundation soil
• Embankment vertical
deformation
• Poor compaction of filler
Dip after approach
slab
Differential settlement between
approach slab and pavement
• Consolidation of
foundation soil
• Embankment vertical
deformation
• Poor compaction of filler
Differential
settlement at
pavement-bridge
interface
Differential settlement at
pavement-bridge interface • Consolidation of
foundation soil
• Embankment vertical
deformation
• Poor compaction of filler

13
Table 1 Continued
Distress Description Possible Causes
Alligator (fatigue)
cracking
Interconnected or interlaced
cracks in the wheel path, forming
a series of small polygons.
• Excessive loading
• Weak surface, base, or
subgrade
• Thin surface or base
layers
• Poor drainage
Longitudinal cracking
in wheel paths
Longitudinal cracks are
predominantly parallel to
pavement centerline.
• Aging effect of asphalt
• Excessive loading
• Impact factor
• Weak surface, base
• Thin surface or base
• Poor drainage
• Poorly constructed
paving joint
• Shrinkage of asphalt
layer
• Daily temperature
changes
• Cracks present in sub
layers reflect on to the surface
layer.
Transverse and map
cracking
Transverse cracks are
predominantly perpendicular to
the pavement centerline.
• Aging effect of asphalt
• Voids exist beneath the
slab
• Embankment
compression
Cracking at the
expansion joint
Tensile-extrusion failure • Expansion-contraction
cycle
• Impact load effect
• Expansion joints failure
Cracking at the
transition from
approach slab to
pavement
Reflective cracking at joints • Poor compaction
• Impact load effect
• Reflection cracks
• Settlement

14
Table 1 Continued
Distress Description Possible causes
Rutting (mix rutting
or subgrade rutting)
Surface depression in the wheel
paths
• Poor compaction
• Excessive loading
• Weak asphalt mixtures
• Insufficient design
thickness
• Moisture infiltration
Shoving
Longitudinal displacement of a
localized area of the pavement
• Braking or accelerating
effects
• Excessive moisture
• Low air voids
• Low vehicle speed
• Excessive loading
• Poor bond between
pavement layers
Bleeding or flushing
A film of asphalt binder on the
pavement surface.
• Mixture problems
• Improper construction
practices and high temperatures.
Bleeding or flushing
A film of asphalt binder on the
pavement surface.
• Mixture problems
• Improper construction
practices and high temperatures.
Raveling
Loss of bond between aggregate
particles and the asphalt binder
• Aggregate segregation
• Inadequate compaction
• Poor mixture quality
• Asphalt hardening
• Insufficient thickness
• Excess moisture in the
pavement layers weakens the
pavement structure.
• Consolidation or lateral
movement of any pavement
layers under traffic.

15
Sources: (Lenke, 2006; MDOT, 2002; White et al., 2005; Asphalt Institute, 2009; MDOT, 2016;
Phares et al., 2011; Scullion, 2001)
Table 1 Continued
Potholes
Depressions in the pavement
surface that penetrate all the way
through the HMA layer down to
the base layer
• Thin surface layer
• Moisture infiltration
• Excessive loading
• Poor surface mixtures
• Weak spots in the base or
subgrade
• Continued deterioration
of another type of distress.

16
CHAPTER 3: DATA COLLECTION AND DESCRIPTIVE ANALYSIS
3.1 Introduction
Pavement condition data pertinent to Florida highways were acquired and analyzed in order
to identify the extent and causes of asphalt pavement damages on bridge approaches and departures
present in Florida. In this chapter, the focus is on analyzing pavement condition data with the
purpose of identifying the extent of pavement distresses on bridge approaches/departures.
Additionally, an analysis of asphalt layer thickness was also done.
The sources for the data utilized in this study include FDOT highway video log images
available at FDOT website and 2015 pavement condition data provided directly by the FDOT State
Materials Office.
In total, 1155 bridges were identified on Florida interstate highways which have asphalt
pavements on bridge approaches/departures.
3.2 Pavement Condition Analysis Based on Video Log Data
FDOT maintains a searchable database consisting of roadway images that come under
FDOT’s jurisdiction. This database is managed by the FDOT’s video log program. The roadway
images can be searched and viewed based on the ID and mile posts of each roadway section.
Images collected by the FDOT 2016 video log program were utilized to evaluate the
conditions of asphalt pavements adjacent to the 1155 bridges of interest. The evaluation was done
in compliance to the FDOT 2015 Flexible Pavement Condition Survey Handbook (FDOT, 2015).
Main steps in the evaluation process are discussed in the following paragraphs.

17
The beginning point of a bridge, as depicted in Figure 4, were identified initially based on
the beginning mile post of the bridge. From the beginning point of a bridge, a rectangular segment
is surveyed backwards (i.e., against traffic direction). The first segment is the approach slab, and
the other segment is of approximately 26 feet long and 12 feet in wide. Similarly, a segment on
the other side of the bridge was analyzed, including the departure slab and one 26-ft segment. A
26 feet long segment can conveniently be identified using the video log images. Any image by
clicking the video images “Frame Forward” button moves to a 0.05 mile, which is 26.4 feet.
Similarly, each click on the ‘Frame Backward’ button makes a 26.4 feet movement of the image.
Figure 4 Schematic Depiction of Survey Area in One Lane around a Bridge
The 12 feet width segments before and after the slabs are virtually divided into five
longitudinal sections, as depicted in Figure 5. As a result, each survey segment has two sub-
segments: wheel path area and outside wheel path area.
Figure 5 Wheel Path Designation in a Lane (FDOT, 2015)

18
Each rectangular segment was visually recorded, for five different types of pavement
distresses including: 1B Cracking, II Cracking, III Cracking, raveling, and patching. A brief
description of each distress is provided as follows (FDOT, 2015).
• 1B Cracking: Hairline cracks that are less than or equal to ⅛ inch (3.18 mm) wide
in either the longitudinal or the transverse direction. These may have slight spalling and slight to
moderate branching.
• II Cracking: Cracks greater than ⅛ inch (3.18 mm) and less than or equal to ¼ inch
(6.35 mm) wide in either the longitudinal or the transverse direction. These may have moderate
spalling or severe branching. Also includes all cracks less than or equal to ¼ inch (6.35 mm) wide
that have formed cells less than 2 feet (0.61 m) on the longest side, also known as alligator
cracking.
• III Cracking: Cracks greater than ¼ inch (6.35 mm) wide that extend in a
longitudinal or transverse direction and cracks that are opened to the base or underlying material.
• Raveling: Raveling is the wearing away of the pavement surface caused by the
dislodging of aggregate particles.
• Patching: A patch is a portion of the pavement that has been replaced with a newer
material after the time of original construction. Patching should reflect a defect in the pavement
that has been repaired.
More details on the distress data collection procedure are available in the FDOT 2015
Flexible Pavement Condition Survey Handbook (FDOT, 2015).
A lane section of 26-ft length located far away from the bridge (usually 0.3 - 0.5 miles
away from the bridge) was chosen as the control section. Pavement distresses on this section were
assessed visually and recorded in the same manner as explained previously.

19
The recorded distress data were used to compute a crack rating (CR) for each segment on
a scale of 0 to 10, with 0 representing severe pavement damage and 10 meaning no visible distress
on the pavement. The average CR value of two approach segments is used to represent the CR of
the bridge approach pavement, while the average CR value of two departure segments represents
the CR of the bridge departure pavement.
One limitation of the video log data is that, it is not possible to identify or estimate the
rutting damage incurred by the pavement using the images/videos. Another constraint is that
patching, and raveling could not be separately recorded for within and outside wheel paths due to
the difficulty in identifying the wheel-path/outside-wheel-path areas precisely from images. To
overcome this, these defects were recorded for the entire segment. They were later assumed to be
evenly distributed across the lane width in the data analysis. In most cases, available video logs
are for only the outer lane of a highway. In few cases, the log is for the lane next to the outer lane.
These two cases were not distinguished in the visual assessment. Instead, it is assumed that all the
video logs are from the pavement design (truck) lane.
3.2.1 Analysis Results of Pavement Distresses Based on Video Log Images
The crack rating (CR) computed in the visual assessment reflects the degree of distress in
asphalt pavements on bridge approaches and departures. CR was used as the pavement condition
indicator for analyzing the extent of distresses. The analysis was performed for the entire state of
Florida. It was observed that nearly one third of bridge approaches and departures exhibited more
pavement distresses than regular roadway sections.
3.2.2 Overall Analysis and Results
Figure 6 portrays a summary of the CR for asphalt pavements at five distinct locations.
Clearly, overall the CR is similar for bridge approach pavements and departure pavements, with
an average value of 9.1. This value is lower than the average CR value of 9.5 from control sections

20
(i.e., regular roadway pavements). This fact shows that, the overall condition of bridge
approach/departure pavements is worse than that of regular roadway pavements. It should be noted
that the approach and departure pavement conditions have a little variation than those of control
sections.
Figure 6 Summary of Crack Rating (CR) of Asphalt Pavements on all Bridges
This study found that, 317 of the 1155 bridges evaluated have a CR value of 9 or less for
both approach and departure pavements. These approach and departure pavements showed a
general trend of lower CR compared to control sections. On an average, the CR is around 9.2 for
bridge approach or departure pavements, while it is 9.6 for control sections, as shown in Figure 6.
The overall CR difference between approach/departure pavements and control sections
goes up compared to the all-bridge scenario presented in Figure 7. More importantly, the average
control section CR drops from 9.6-inch Figure 6 to 9.5-inch Figure 7. This indicates that the
condition of approach/departure pavements deteriorated faster than that of control section (regular
roadway) pavements.
0
2
4
6
8
10
12
Approach Slab Approach Departure Slab Departure Control Location

21
Figure 7 Summary of Crack Rating (CR) of Asphalt Pavements on Bridges Showing
Pavement Distresses
Figure 7 illustrates the distribution of CR at approach, departure, and control sections. It
can be noted that the pavement is in a good condition overall. At approaches and departures, nearly
85 percent segments exhibited CR values within a range of 8-10. At control sections, this group
rises to over 90 percent which is even better. Figure 7 also reveals that nearly 15 percent of
approach and departure pavements have a CR value below 8.
Figure 8 Distribution of Crack Rating (CR)
0
2
4
6
8
10
12
Approach Slab Approach Departure Slab Departure Control Location
Ave
rage
CR
0
20
40
60
80
100
0-2 2-4 4-6 6-8 8-10
Re
lati
ve F
req
ue
ncy
%
Approach Departure Control Location

22
3.3 Pavement Condition Analysis Based on 2015 Pavement Condition Data
An annual pavement condition forecast is published by FDOT on their website every year.
That forecast report contains pavement condition data over the last 16 years for each pavement
section. The pavement sections included in that report, however, are generally several miles in
length, spanning over one or several bridges. The performance data from that report do not
differentiate bridge approach pavements from regular roadway pavements, and therefore cannot
be used in this study. Instead, a 2015 pavement condition data set with higher section resolution
was provided directly by the FDOT State Materials Office. This data set contains pavement
condition for each 0.001-mile (5.3 ft.) highway section, in terms of rut depth, IRI, and ride number,
and therefore is analyzed in this section.
3.3.1 Evaluation Procedure of Pavement Distresses Based on Condition Data
The beginning and ending mile posts of each of the 1155 bridges included in this study
were used to search for the needed pavement condition data from the given data set. Due to data
mismatching and missing, only 1013 bridges were identified in the data set. For each bridge, the
following steps were followed to evaluate pavement distresses.
First, the starting point of a bridge was identified, as shown in Figure 9. From this point
backwards, three rectangular segments were selected. The first segment is the approach slab, and
the other two segments (labelled as Approach Segment 1 and 2) are each approximately 95 feet in
length and usually 12 feet in width. Similarly, two more segments on the other side of the bridge
were selected, including the departure slab and two 95 feet segments (labelled as Departure
Segment 3 and 4). Choice of 95 feet as the length of each segment was made due to the convenience
of data collection from the FDOT pavement condition data set. Each approach or departure
segment consists of 18 0.001-mile highway sections, which leads to a length of 0.018 mile (95

23
feet). The control (regular roadway) section not shown in Figure 9 is usually 0.2 miles away from
bridge approach/departure and is 105 feet in length. Pavement condition data from the control
sections were used as benchmark for comparison with approach and departure pavement
conditions.
Second, the rut depth, international roughness index (IRI), and ride number information
was extracted for each bridge approach/departure segment and control section.
Figure 9 Schematic Depiction of Survey Area in one Lane around a Bridge
Third, Rut Rating and Ride Rating were computed for each segment from the rut depth,
IRI, and ride number data, following the procedures in FDOT 2015 Flexible Pavement Condition
Survey Handbook (FDOT, 2015). The Rut Rating is obtained by subtracting from ten (10) the
deduct value associated with the rut depth. A Rut Rating of 10 indicates a pavement with only
minor rutting. The Ride Rating is converted from IRI, and is based upon a scale of 0 (very rough)
to 10 (very smooth). A Ride Rating of 6 or less represents a relatively rough pavement. For the
IRI, a value less than 95 inches/mile is considered to represent good riding quality (FHWA, 2016).
3.3.2 Analysis Results of Pavement Distresses Based on Condition Data
The three pavement condition indices (i.e., Rut Rating, IRI, and Ride Rating) were used
for analyzing the extent of distresses in asphalt pavements on bridge approaches and departures.
3.3.3 Overall Analysis and Results
A summary of the three condition indices on bridge approach and departure pavements and
at control sections for all the 1013 bridges is presented in Table 2 and Figure 10 through Figure
12. It can be observed from Table 2 that the average Rut Rating is slightly higher on bridge
approach or departure pavements than on regular roadways, indicating slightly less rutting on

24
bridge approaches/departures. The average IRI and Ride Rating values, however, show that the
bridge approach/departure pavements are significantly rougher than regular pavements. It may also
be observed that the closer to the approach/departure slabs, the rougher the pavement becomes.
Table 2 Average Pavement Condition Indices for All Bridges
Figure 10 Summary of Rut Rating for all Bridges
8.5
8.6
8.7
8.8
8.9
9.0
9.1
9.2
9.3
9.4
9.5
9.6
9.7
9.8
9.9
10.0
Approach 1 Approach 2 Departure 3 Departure 4 ControlSection
AV
ERA
GE
RU
T R
ATI
NG
Condition Index Approac
h 1
Approac
h 2
Departur
e 3
Departur
e 4
Control
Section
Rut Rating 9.3 9.3 9.4 9.3 9.2
IRI 81 94 113 95 64
Ride Rating 7.7 7.5 7.3 7.5 7.9

25
Figure 11 Summary of IRI for all Bridges
Figure 12 Summary of Ride Rating for all Bridges
Figure 13 summarizes the number of bridges with either approach pavements or departure
pavements showing distresses (i.e., Rut Rating less than 9, IRI greater than 95 inches/mile, or Ride
Rating greater than 7). It can be seen that out of the 1013 bridges considered, around 200 bridges
have noticeable rutting in their approach or departure pavements, but there are around 290 bridges
whose corresponding control pavement sections have noticeable rutting. In terms of IRI, around
0
20
40
60
80
100
120
140
160
180
Approach 1 Approach 2 Departure 3 Departure 4 ControlSection
AV
ERA
GE
IRI,
IN
CH
ES/M
ILE
6.0
6.5
7.0
7.5
8.0
8.5
Approach 1 Approach 2 Departure 3 Departure 4 ControlSection
AV
ERA
GE
RID
E R
ATI
NG

26
370 bridge approach pavements and about 540 bridge departure pavements have rough condition
(IRI greater than 95 inches/mile), which are significantly more than the number of control
pavement sections (around 90). Among all the bridges whose control pavement sections have good
riding condition (i.e., IRI lower than 95 inches/mile), about 30% bridges showed worse riding
condition (i.e., IRI greater than 95 inches/mile) on their approach pavements, and about 50%
bridges showed worse riding conditions on their departure pavements.
Figure 13 Number of Bridges with Pavement Condition Indices Indicating Distresses
3.4 Asphalt Layer Thickness Analysis
As discussed in the literature review, one of potential causes of distresses is change in
thickness of the approach pavement. Moreover, in the nationwide survey it was observed that 30%
of the states surveyed had experienced the thin asphalt layer issue on their bridge
approach/departure pavements. It is, therefore, worthwhile to investigate the asphalt layer
thickness near the bridges analyzed in this study. This is discussed in this section. The correlation
between asphalt layer thickness and pavement distress is analyzed statistically in the next chapter.
0
100
200
300
400
500
600
Rut Rating < 9 IRI > 95 in/mile Ride Rating < 7
Approach Departure Control

27
FDOT does not maintain a statewide highway pavement structure database. Instead, a
ground penetration radar (GPR) data set is available from the FDOT State Materials Office. This
data set contains asphalt layer thickness for a portion of the state highway network, which includes
113 bridges with asphalt approach/departure pavements. This is about 10% of the Florida interstate
highway bridges with asphalt approach/departure pavements.
3.4.1 Selection Method of GPR Data
The GPR data were recorded at a varying spacing (i.e., pavement section length) on
different highways, as summarized in Table 4. For the GPR data recorded at a spacing of 100 feet,
only two data points were taken as representation of a bridge approach or departure pavement.
This is based on the assumption that at a distance of beyond 200 feet from the bridge approach or
departure slab, pavement sections may not well represent the bridge approach or departure
pavements. The two data points were used to calculate the average asphalt layer thickness on the
bridge approach or departure. For the GPR data recorded at a smaller spacing (5.28 feet), more
data points were used to calculate the average thickness. A control section was selected at a
distance of 0.3 mile away from each bridge to calculate the average asphalt layer thickness of
regular roadway pavements.
Table 3 GPR Data Point Spacing
Data Point
Spacing (feet)
Number of
Bridges
Number of Data Points on
Approach/Departure
Number of Data Points
on Control Section
100 83 2 3
47-50 25 2 3
5.28 5 6 6
3.4.2 Asphalt Layer Thickness Trends
The average asphalt layer thicknesses for different pavement sections are shown in Figure
14. It can be observed, for the 113 bridges investigated, the average asphalt layer thickness is

28
significantly lower (about 2 inches less) on bridge approaches or departures than on regular
roadway sections (Control Sections).
Figure 14 Comparison of Asphalt Layer Thickness
3.5 Summary of Pavement Data Analysis
The conditions of bridge approach and departure asphalt pavements in the outer (truck)
lane on FDOT interstate highways were analyzed in terms of one index (Crack Rating) based on
video log images, and three indices (Rut Rating, IRI, and Ride Rating) based on pavement
condition data.
It is found that generally bridge approach and departure pavements have more cracking
distress and higher roughness than regular roadway pavements. The difference in rutting distress,
however, is less significant than the differences in cracking and roughness. There is no significant
difference between approach pavements and departure pavements in terms of Crack Rating and
Rut Rating. The departure pavements, however, are generally rougher than the approach
pavements. Moreover, the roughness of a bridge approach/departure pavement generally increases
as it gets closer to the approach/departure slab.
0.0
2.0
4.0
6.0
8.0
10.0
12.0
14.0
Approach Approach_Control Departure Departure_Control
HM
A T
hic
kne
ss,
in

29
Among the 1155 interstate highways bridges with asphalt approach/departure pavements,
about 27% bridges showed signs of cracking distress in their approach or departure pavements.
About 20% bridges have noticeable rutting in their approach or departure pavements. Among all
the bridges whose control pavement sections have good riding condition (i.e., IRI lower than 95
inches/mile), there are about 30% bridges showing worse riding condition (i.e., IRI greater than
95 inches/mile) on their approach pavements, and about 50% bridges showing worse riding
conditions on their departure pavements.
Based on the GPR data for 113 bridges, it was found that the average asphalt layer thickness
is significantly lower on bridge approaches or departures than on regular roadway sections.

30
CHAPTER 4: STATISTCAL MODELLING OF BRIDGE APPROACH PAVEMENT
DISTRESSES
4.1 The Linear Regression with Random Parameters Model Structure
A linear regression model is used to explore the factors that affect the asphalt pavement
distress on bridge approaches, departures, and control sites. Distress measures such as international
roughness index (IRI) and rut depth (RUT) are continuous variables, and a linear regression
approach suits best for modelling such variables. Since the IRI and RUT values for a pavement
section are always positive, using a linear regression model results in the prediction of non-positive
values for the distress variables. So, a log-transformation is applied to the distress variables, and
the resultant variables are modelled using a linear regression method. In a linear regression model,
the dependent variable is expressed as a linear function of exogenous variables as shown in
equation (1).
𝑌𝑖 = ln (𝑦𝑖) = 𝛼0 + 𝛽𝑋𝑖 + 𝜀𝑖--------------- (1)
where i= 1, 2, 3…. n is an index for each pavement section, 𝑦𝑖 is the observed values for pavement
distress measures, 𝛼0 is a constant, 𝛽 is a vector of estimable parameters, 𝑋𝑖 is a vector of
exogenous variables and 𝜀𝑖 is a standard normally distributed error term. To account for the
heterogeneity in the parameter estimates due to unobserved factors, parameters are assumed to
vary across different pavement sections according to a pre-specified distribution. The resultant
expression for the dependent variable is shown in equation (2).
𝑌𝑖 = 𝛼0 + 𝛽𝑖𝑋𝑖 + 𝜀𝑖-------------------------- (2)

31
Assuming that random parameters are normally distributed and 𝑓(. ) is the probability
density function of a normal distribution, likelihood expression for an individual 𝑖 is expressed in
given equations (3) and (4).
𝑝(𝑌𝑖) = ∫ 𝑝 (𝑌𝑖
𝑋𝑖; 𝛼0, 𝛽𝑖⁄ ) 𝑓(𝛽)𝑑𝛽----------------- (3)
= ∫1
√2𝜋𝑒(
−(ln(𝑦𝑖)−(𝛽0+ 𝛽𝑖𝑥𝑖))2
2)𝑓(𝛽)𝑑𝛽--------------- (4)
The simulated maximum likelihood estimation approach is used to estimate the parameters
and 200 Halton draws are used to evaluate the multi-dimensional integral of the likelihood
function.
4.2 Other Detailed Data Collected for Modelling
Alligator cracking and rutting are the common pavement distresses observed on bridge
approach pavements which compromise roadway smoothness. Based on the FDOT survey reports
(Moseley, 2009, 2012, 2013), some bridge approach pavements are much thinner than their
adjacent regular pavements. The relationship between bridge approach pavement roughness and
inadequate pavement structure needs to be investigated.
To identify the factors influencing bridge approach pavement performance, relevant
information was collected from various sources (e.g., FDOT SMO, RCI database, FDOT pavement
management reports, GPR survey reports, etc.) and compiled together. The first source is FDOT
pavement condition database, which contains roughness data for bridge approach pavements in
2014. The second source is FDOT Roadway Characteristics Inventory (RCI) database, which
contains comprehensive roadway information, such as traffic-related information (e.g., AADT,
AADTT, and speed limit) and pavement structure information (e.g., base layer type, base layer
thickness, and friction course type). The third source is FDOT pavement management reports,
which contain information about recent maintenance year for each roadway section. The fourth

32
source is GPR survey reports, which contain the thickness of pavement surface layer. A total of 68
bridge approaches, bridge departures, and regular roadway pavement sections (control sites) are
identified simultaneously.
4.3 Results
This section presents the estimation results of Random Parameters Linear Regression
Model (RPLRM) for asphalt pavement distress obtained after extensive specification testing.
Pavement characteristics (surface type and thickness, base type and thickness, and pavement age),
traffic characteristics (AADT and AADTT), roadway characteristics were tried during the model
development. Environment related variables are not included in the modeling since it is assumed
that the climate condition is similar across the Florida highway network. Descriptive statistics of
variables present in the final linear regression model are shown in Table 4. The estimation results
of RPLRM for the IRI and RUT values of the pavement section on bridge approaches, departures,
and control site are presented in Table 5 and Table 6, respectively.
Factors influencing the IRI of the approach pavement section are the surface thickness and
pavement age. In specific, a section with surface thickness greater than 5 inches is more likely to
have higher IRI values, while all else remain the same. Moreover, the approach pavement section
with higher surface thickness might have higher IRI values. Such as, a section with higher
thickness might result in the height differences between the study section and adjacent section
(concrete or regular pavement) and lead to cracking due to the traffic movement. Most importantly,
the application of asphalt overlays, milling and digouts on existing conditions comprises a
significant effect on the smoothness (Hung, et al., 2014). That is why bridge approach/departure
pavements with inadequate and with excess thickness are more likely to experience severe
cracking than the regular asphalt Pavement. Thus, a proper design measure is to be followed.

33
Similarly, with increase in IRI of an approach pavement section the age of pavement results
in an increase in the IRI values. Such as, as the age of the section increases, the cracks in the
pavement might gradually increase due to its exposure to traffic and adverse weather conditions.
In addition to pavement age and surface layer thickness, it is found that annual average
daily truck traffic (AADTT) and pavement friction type have statistically significant effect on the
IRI values at the departure pavement section. In detail, a section with pavement course FC2 is
more likely to have lower IRI values as compared to the other pavement course types. It is found
that a section with AADTT greater than 15,000 is more likely to have higher IRI values as
compared to the counter group sections. The same finding is evident from the literature that
increase in the truck movements on a pavement section damages the pavement by causing cracks.
Whereas for the control sites, AADTT has heterogeneous effect on the IRI values. In specific, only
92.9% of sections with AADTT greater than 15,000 are more likely to have higher IRI values as
compared to the other group. Whereas for the rest 7.1% of the sections, the effect is vice-versa.
Moving to the RUT values on a pavement section, surface layer thickness of approach
section indicator variable (1 if the surface layer thickness is greater than 5 inches otherwise 0) is
found to have heterogeneous effect on the RUT values for approach sections. Approximately for
91% of the approach sections, sections with surface thickness greater than 5 inches is more likely
to have higher RUT values as compared to the other group. Similarly, for 75.8% of the sections,
as the pavement age increases, it is more likely that the RUT values of a departure pavement
section increase. Finally, none of the available variables are found to have statistically significant
effect on the RUT values at a control section.

34
Table 4 Descriptive Statistics of Potential Variables Influencing the IRI or RUT Values of an Asphalt Pavement
Variable description Mean
Value
Standard
Deviation
Minimum
Value
Maximum
Value
Dependent variables
IRI of Bridge approach pavement (inches/mile) 4.58 0.28 3.64 5.36
IRI of Bridge departure pavement (inches/mile) 4.66 0.29 3.76 5.35
IRI of Control site (inches/mile) 4.25 0.26 3.63 4.96
RUT of Bridge approach pavement (inches/mile) -3.17 1.40 -7.57 -0.98
RUT of Bridge departure pavement (inches/mile) -3.06 1.54 -6.88 -0.97
RUT of Control site (inches/mile) -3.13 1.80 -9.97 -0.94
Independent variables
Annual average daily traffic (AADT) (25,000 vehicles per day) 0.14 0.35 0 1
Annual average daily truck traffic (AADTT) (15,000 vehicles
per day) 0.13 0.34 0 1
Pavement age from the most recent pavement rehabilitation year
(years) 7.42 3.40 1 12
Friction course type indicator (1 if friction course of pavement
surface layer is friction course 2 (FC-2), 0 otherwise) 0.13 0.34 0 1
Surface layer thickness of bridge approach pavement (inches) 0.70 0.45 0 1
Surface layer thickness of bridge departure pavement (inches) 0.58 0.49 0 1
Surface layer thickness at control site (inches) 0.02 0.17 0 1

35
Table 5 Estimated Parameters for Bridge Approach and Departure Pavement Roughness Models. (Random parameters are in
parenthesis)
Variable Description
Log (IRI on Approach) Log (IRI on Departure) Log (IRI on Control site)
Parameter t-
statistic
P
Value Parameter
t-
statistic
P
Value Parameter
t-
statistic
P
Value
Constant 4.32 44.81 0.0 4.34 47.03 - 4.25 122.2 0.0
Surface layer thickness of bridge
approach pavement indicator (1 if
thickness is greater than 5 inches, 0
otherwise)
0.11 1.60 0.11 - - - - - -
Pavement age in years 0.02 2.52 0.014 0.03 3.28 0.001 - - -
Surface layer thickness of bridge
departure pavement indicator (1 if
thickness is greater than 8 inches, 0
otherwise)
- - - 0.2 1.95 0.05 - - -
Annual average daily truck traffic
indicator (1 if truck traffic is greater
than 15000, 0 otherwise)
- - - 0.47 4.31 0.0 0.22
(0.15)
0.23
(1.73) 0.08
Pavement friction indicator (1 if the
pavement type is FC2, 0 otherwise) - - - -0.35 -3.46 0.001 - - -
Number of observations 68 68 68
Log likelihood of constants only
model
-9.06 -13.28 -5.75
Log likelihood at convergence -5.01 -0.46 -5.52

36
Table 6 Estimated Parameters for RUT on Bridge Approach and Departure Models. (Random parameters are in parenthesis)
Variable Description
Log (RUT on Approach) Log (RUT on Departure) Log (RUT on Control site)
Paramet
er
t-
statistic P Value
Paramet
er
t-
statistic
P
Value
Paramet
er
t-
statistic
P Value
Constant -4.72 -9.16 0.0 -3.56 -9.97 0.0 -3.0 -5.37 0.0
Surface layer thickness of bridge
approach pavement indicator (1 if
thickness is greater than 5 inches, 0
otherwise)
1.55
(1.16)
2.95
(12.40) 0.0 - -
- - -
Pavement age in years - - 0.07
(0.10)
1.68
(4.64) 0.0 - - -
Number of observations 68 68 68
Log likelihood of constants only
model
-119.4 -121.89 -135.67
Log likelihood at convergence -117.10 -121.12 -135.67

37
CHAPTER 5: CONCLUSIONS AND FUTURE RESEARCH
5.1 Conclusions
This study analyzed the factors affecting asphalt pavement distresses on the approaches
and departures of highway bridges. There is no such vast body of knowledge, compared of several
past studies, concerning the identification of factors contributing to asphalt pavement distresses on
bridge approaches/departures. This study dealt on asphalt pavement transitions on bridge
approaches/departures on Florida Interstate Highways. Through preliminary survey it was found
that there are more distresses in pavements at bridge approaches/departures than regular asphalt
pavements.
As part of this study a nationwide questionnaire survey is conducted to collect information
from professionals with experience with pavements and bridges so that it would be helpful to
investigate the extent and causes of asphalt pavement distresses adjacent to bridge
approaches/departures. In this survey over 60% respondents noticed pavement distresses next to
bridge approach slabs. About 30% of the states noticed thinner asphalt pavements near bridges
when compared to regular pavement sections. In the survey, thirteen types of pavement distresses
were reported, including shoving, stripping, bumps, deformations, poor drainage, bleeding, cracks,
settlement issues, poor compaction, potholes, pop-outs, rutting, and raveling, which are generally
consistent with the findings in the literature review.
An analysis was carried out using pavement condition data to determine the extent of
pavement distresses on bridge approaches/departures. The data were collected mainly from two

38
sources: FDOT highway video log images and pavement condition data. It is found that among the
1155 Interstate Highways bridges with asphalt approach/departure pavements in Florida, about
27% bridges were affected with cracking distress in their approach/departure pavements. About
20% of bridges were identified with rutting distress in their approach or departure pavements.
Moreover, among all the bridges whose control pavement sections have good riding condition (i.e.,
IRI lower than 95 inches/mile), about 30% bridges showed worse riding condition (i.e., IRI greater
than 95 inches/mile) on their approach pavements. Similarly, about 50% bridges showed worse
riding conditions on their departure pavements. Based on the GPR data of 113 bridges, it was
noticed that the average asphalt layer thickness is lower on bridge approaches/departures than that
of regular roadway sections.
Finally, a statistical analysis was performed in this study. A linear regression with random
parameters model was applied to examine the factors that may influence asphalt pavement
distresses. The model was run for pavement roughness and rutting on bridge approaches/departures
as well as on control pavement sections. The model considers a comprehensive set of potential
determinants of distresses, including pavement characteristics, roadway characteristics and traffic
characteristics. The study appears to be the first to compare the effects of variables causing
distresses in asphalt pavement transitions next to approach/departure slabs. In the modeling, the
non-negative continuous dependent variables, including International Roughness Index (IRI) and
rut depth, were log-transformed.
This study focused on the impact of various factors on asphalt pavement transitions next
to bridge approach/departure slabs. The scope of the research is limited due to availability of
relevant pavement characteristics data. There is room for improving the model specification by
including each pavement layer thickness and type of material used, different compaction levels if

39
there any, detailed roadway geometry, thickness of actual asphalt layer before and after
construction.
5.2 Future Research
In future work, it is desirable to identify more detailed factors and develop a statistical
model with more independent variables relevant to the distresses in asphalt pavements on bridge
approaches and departures. Some variables that are not specifically considered in the statistical
modeling in this study due to availability issue may include: the thickness and material type of
each pavement layer, compaction level during construction, moisture content and settlement of
embankment soil, quality of drainage system, and climate features.

40
REFERENCES
[1] Asphalt Institute: Asphalt in Pavement Preservation and Maintenance. ISBN-193415458
[Report]. - 2009.
[2] Bernadette Dupont and David L.Allen Movements and Settlements of Highway Bridge
Approaches [Report]. - Lexington,Kentucky. : Kentucky Transportation Center, 2002.
[3] Briaud J-.l, James R.W and Hoffman S.B Settlement of Bridge Approches (The Bump at
the end of the Bridge) [Report]. - Washington,DC : Transportation Research Board, 1997.
[4] Christoper R. Barry, Schwartz Charles and Boudreau Richard Geotechnical Aspects of
Pavements [Report]. - washington,D.C : FHWA, 2006.
[5] Hall T. Kathleen [et al.] Rehabilitation Strategies for Highway Pavements [Report]. -
[s.l.] : NCHRP, 2001.
[6] Helway Sam, Koutnik Therese Ellen and Ghorbanpoor Al Evaluation of Bridge
Approach Settlement Mitigation Methods [Report]. - Milwaukee,WI : Wisconsin
Highway Research Program, 2007.
[7] James R.W [et al.] A Study of Bridge Approach Roughness [Report]. - Texas Department
of Transportation, Austin,116pp. : FHWA, 1991.
[8] Laguros J.G, M.M and Mahmood I.U Evaluation of Causes of Excessive Settlements of
Pavements behind Bridge Abutments and their Remedies [Report] : FHWA/OK
89(07),ORA 157-293. – Oklahoma,Ok USA : Oklahoma Department of Transportation,
1990.
[9] Lenke L.R Settlement Issues-Bridge Approach Slabs.(Final Report Phase 1) [Report]. -
[s.l.] : New Mexico Department of Transportation. Report Number. NM04MNT-02,
2006.
[10] Long J [et al.] Differential Movement at Embankment Bridge Structure Interface in
Illinois [Report]. - [s.l.] : Transporation Research Board, 1998.
[11] Long J and S. Stark,T and Samara,E Differential Movement at Embankment Bridge
Structure Interfact in Illinois [Report]. - [s.l.] :Transporation Research
Board,(1633),pp.53-60, 1998.

41
[12] MDOT Pavement Design Guide [Report]. - [s.l.] : Maryland Department of
Transportation;State Highway Administration.pp. 176-180, 2002.
[13] MDOT Project Scopping Manual [Book]. - [s.l.] : Michigan Department of
Transportation.pp.54-63, 2016.
[14] ODOT Pavement Design Guide [Book]. - [s.l.] : Oregan Department of Transporation,
2011.
[15] Phares B.M [et al.] Identification and Evaluation of Pavement Bridge Interface Ride
Quality Improvement and Corrective Strategies [Report]. - [s.l.] : FHWA, 2011.
[16] Scullion Thomas Selecting Rehabilitation Options for Flexible Pavements: Guidelines for
Field Investigations.pp. 1-28. [Report]. - 2001.
[17] Start T.D, Olson S.M and Long J.H Differential Movement at the Embankment/Structure
Interface-Mitigation and Rehabilitation [Report]. - Springfield,Illinois,297pp. : Illinois
Department of Transportation , 1995.
[18] Wahls Harvey E Design and Construction of Bridge Approaches [Report]. - [s.l.] :
NCHRP, 1990.
[19] Wahls Harvey E Design and Construction of Bridge Approaches [Report]. -
Washington,D.C. : NCHRP, 1990.
[20] White D. [et al.] Identification of the Best Practices for Design,Construction and Repair
of Bridge Approaches [Report]. - [s.l.] : (No. CTRE Project 02-118), 2005.

42
APPENDIX A: COPYRIGHT PERMISSIONS
Below is the permission for the use of figure 2 in chapter 2.

43
Below is the permission for the use of figure 5 in chapter 3.