Analysis of crystallization kinetics of poly(ether ether ketone)
14
Analysis of Crystallization Kinetics of Poly(ether ether ketone) MING CHEN, JANG-YANG CHEN Institute of Materials Science and Engineering, National Sun Yat-Sen University, Kaohsiung, Taiwan 80424, Republic of China Received 30 June 1997; revised 16 October 1997; accepted 5 November 1997 ABSTRACT: An optical microscope equipped with a video photograph system was used to follow the growth of spherulites. Under nitrogen atmosphere, the growth rates at 290 and 3007C suggest that when the melt of PEEK has been equilibrated for 15 min at 4007C, the subsequent crystallization behavior was nearly independent of the prior thermal history. Linear growth rates of crystallization of PEEK have been measured in the temperature range of 260 – 3257C for melt-pressed films and solvent cast films. Detailed kinetic analysis indicated that PEEK exhibited an unmistakable regime II r III transition at 296 { 17C. The II r III transition was clearly present irrespec- tive of the rather drastic changes in U *. It is interesting that the branching and crosslinking retarded the growth rate of PEEK, but a transition from regime II to regime III still existed. For melt-pressed films after equilibration at 4007C for 15 min, values of s and q suggest that U * should be taken nearer to 1500 cal/mol in the case of T ‘ Å T g 0 30 K and 2000 cal/mol in the case of T ‘ Å T g 0 51.6 K. The K g (III)/ K g (II) ratio (1.32) was not as close to the predicted value of 2 as was Hoff- man’s ratio. For PEEK, the Thomas-Staveley constant ( a ) should be closer to 0.25 or 0.3 instead of 0.1. q 1998 John Wiley & Sons, Inc. J Polym Sci B: Polym Phys 36: 1335– 1348, 1998 Keywords: PEEK; growth rate; crystallization; kinetics; regime INTRODUCTION well as their controlling variables, will be essen- tial if gaining control over final crystalline mor- phology and mechanical properties is a desirable The mechanical properties of poly ( ether ether ke- goal. tone ) ( PEEK ) and its composites depend crucially Very few researchers have reported experimen- on the crystallinity and morphology of the poly- tally determined spherulitic growth rates for mer. 1–10 It is well known that a polymer having PEEK. 11–13 One such has been Blundell and Os- small spherulites typically displays higher frac- born, 11 who reported studies on growth rate kinet- ture toughness than a polymer having larger ics. In that study, the spherulitic growth of a spherulites. Many polymeric objects may contain PEEK sample was measured at four isothermal considerable material with the molecular mor- temperatures ( 240, 260, 277, and 2877C). Using phology characteristic of regime III. It is therefore equilibrium values of T o m Å 3957C, Dh o f Å 130 J/ essential to understand the crystallization behav- g, the fold and lateral surface free energies, s e ior in order to produce materials with controlled and s, were estimated to be 49 and 38 erg cm 02 , and reproducible properties. Thus the detailed respectively. In the 1990s, two reports of overall characterization of spherulitic growth rates, as crystallization rates 14 and linear crystal growth rates 13 of PEEK fractions in the molecular-mass Correspondence to: M. Chen range 4,600 – 79,500 appeared, with polydispersit- Journal of Polymer Science: Part B: Polymer Physics, Vol. 36, 1335–1348 (1998) q 1998 John Wiley & Sons, Inc. CCC 0887-6266/98 / 081335-14 ies between 1.2 and 1.5. Day et al. 14 reported that 1335 9706037 / 8Q53$$6037 04-02-98 15:50:48 polpa W: Poly Physics
Transcript of Analysis of crystallization kinetics of poly(ether ether ketone)
Analysis of Crystallization Kineticsof Poly(ether ether ketone)
MING CHEN, JANG-YANG CHEN
Institute of Materials Science and Engineering, National Sun Yat-Sen University, Kaohsiung,Taiwan 80424, Republic of China
Received 30 June 1997; revised 16 October 1997; accepted 5 November 1997
ABSTRACT: An optical microscope equipped with a video photograph system was usedto follow the growth of spherulites. Under nitrogen atmosphere, the growth rates at290 and 3007C suggest that when the melt of PEEK has been equilibrated for 15 minat 4007C, the subsequent crystallization behavior was nearly independent of the priorthermal history. Linear growth rates of crystallization of PEEK have been measuredin the temperature range of 260–3257C for melt-pressed films and solvent cast films.Detailed kinetic analysis indicated that PEEK exhibited an unmistakable regimeII r III transition at 296 { 17C. The II r III transition was clearly present irrespec-tive of the rather drastic changes in U*. It is interesting that the branching andcrosslinking retarded the growth rate of PEEK, but a transition from regime II toregime III still existed. For melt-pressed films after equilibration at 4007C for 15min, values of s and q suggest that U* should be taken nearer to 1500 cal /mol inthe case of T` Å Tg 0 30 K and 2000 cal /mol in the case of T` Å Tg 0 51.6 K. TheKg ( III ) /Kg ( II ) ratio (1.32) was not as close to the predicted value of 2 as was Hoff-man’s ratio. For PEEK, the Thomas-Staveley constant (a ) should be closer to 0.25or 0.3 instead of 0.1. q 1998 John Wiley & Sons, Inc. J Polym Sci B: Polym Phys 36: 1335–1348, 1998Keywords: PEEK; growth rate; crystallization; kinetics; regime
INTRODUCTION well as their controlling variables, will be essen-tial if gaining control over final crystalline mor-phology and mechanical properties is a desirableThe mechanical properties of poly(ether ether ke-goal.tone) (PEEK) and its composites depend crucially
Very few researchers have reported experimen-on the crystallinity and morphology of the poly-tally determined spherulitic growth rates former.1–10 It is well known that a polymer havingPEEK.11–13 One such has been Blundell and Os-small spherulites typically displays higher frac-born,11 who reported studies on growth rate kinet-ture toughness than a polymer having largerics. In that study, the spherulitic growth of aspherulites. Many polymeric objects may containPEEK sample was measured at four isothermalconsiderable material with the molecular mor-temperatures (240, 260, 277, and 2877C). Usingphology characteristic of regime III. It is thereforeequilibrium values of To
m Å 3957C, Dhof Å 130 J/essential to understand the crystallization behav-
g, the fold and lateral surface free energies, seior in order to produce materials with controlledand s, were estimated to be 49 and 38 erg cm02 ,and reproducible properties. Thus the detailedrespectively. In the 1990s, two reports of overallcharacterization of spherulitic growth rates, ascrystallization rates14 and linear crystal growthrates13 of PEEK fractions in the molecular-massCorrespondence to: M. Chenrange 4,600–79,500 appeared, with polydispersit-
Journal of Polymer Science: Part B: Polymer Physics, Vol. 36, 1335–1348 (1998)q 1998 John Wiley & Sons, Inc. CCC 0887-6266/98/081335-14 ies between 1.2 and 1.5. Day et al.14 reported that
1335
9706037/ 8Q53$$6037 04-02-98 15:50:48 polpa W: Poly Physics

1336 CHEN AND CHEN
only one sample (Mw Å 32,000) showed a regime Ferry) energy term and WLF temperature, re-spectively, Tc is the crystallization temperature,II r III transition at about 2987C which was based
on the overall growth rate data and the assump- DT å (Tom 0 Tc ) is the undercooling, To
m is theequilibrium melting temperature, and f is a cor-tion that the Avrami exponent was normalized to
nÅ 2. This n value was less than the experimental rection term of the order of unity, usually repre-sented byvalue, among 2 and 3. Deslandes et al.13 also stud-
ied the effect of molecular weight on the spheru-litic growth rate of PEEK via polarized light mi-
f Å 2Tc / (Tom / Tc ) (2)croscopy for temperatures varying between 250
and 3007C. Because of the limitation of the hotstage, no data were available for temperatures andexceeding 3007C. These workers fitted the growthrate data to the Hoffman equation. The transitiontemperature from regime II to III was not found. Kg Å nb0sseTo
m /rkDhf (3)This raises the question: Can we observe a sim-
ilar regime phenomenon for PEEK with such awhere n Å 4 for regimes I and III and n Å 2 forbroad polydispersity? In this publication, the ther-regime II. b0 is the layer thickness, s is the lateralmal stability experiments indicated that PEEKsurface free energy, se is the fold surface free en-was stable in nitrogen up to a temperature ofergy, r is the density, k is the Boltzmann constant,4007C for 15 min holding. This treatment was ef-and Dhf is the heat of fusion per unit weight offective in reducing nucleation density to the pointcrystal at the equilibrium melting temperatureof allowing spherulitic growth rate measurementsTo
m . The pre-exponential factor G0 has only a weakand morphology control. Following this optimumdependence on temperature.melting condition, most of the specimens were
Appropriate extensions of the LH model of crys-treated for 15 min at 4007C. A wider range oftallization predict well-defined changes of slopecrystallization temperature of 325–2607C couldin plots of ln G versus 1/Tc (DT ) .17–24 Thesethereby be obtained, which is of primary impor-changes of slope are denoted ‘‘regime transitions.’’tance for a reliable analysis of growth rate dataThe procedure is to determine To
m and then toin terms of the nucleation theory, which was de-assume a set of values of T` and U* and from thisveloped mainly by Hoffman and co-workers.16–19
to fit log G / U*/[2.303 R (Tc 0 T` ) ] to a linearIt became evident that regime phenomena couldrelation in 1/Tc (DT ) f . Eq. (1) predicts that thebe observed in PEEK from commercial sources.growth rate data should result in a linear plot.The transition between regimes II and III was atThe parameters Kg and G0 in eq. (1) are given2967C. In the present work, we shall demonstrateby the slope and the intercept, respectively. Thisthat, in the range of crystallization temperatureanalysis produces values of G0 and Kg for each setconsidered in this work, uncertainties in U* andof U* and T` , and the precision of the fit may beT` in the transport term could have large effectsexpressed by a correlation coefficient.on Kg’s and G0 , but very little influence on the
The melting temperature Tm of the lamellartransition temperature. Finally, the a value incrystals should be related directly to the crystalthe modified Thomas-Staveley equation15 will bethickness l by the Thomson-Gibbs equation:16
discussed.
Tm Å TomF1 0 2se
(Dhf ) lG (4)BACKGROUND
According to the Lauritzen-Hoffman (LH) modelof polymer crystallization,16 the linear growth
in which it is assumed that the other lamellarrate G of a chain-folded polymer crystal isdimensions are much larger than the lamellarthickness l . A plot of Tm versus 1/ l has interceptG Å G0 exp[0U*/R (Tc 0 T` ) ]To
m and slope 02seTom /Dhf , from which se can be
1 exp[0Kg /Tc (DT ) f ] (1) determined if Dhf , is known. In this way Blundelland Osborn determined that To
m Å 3957C and se
Å 49 erg cm02 for PEEK.where U* and T` are the WLF (Williams-Landel-
9706037/ 8Q53$$6037 04-02-98 15:50:48 polpa W: Poly Physics

CRYSTALLIZATION KINETICS OF PEEK 1337
EXPERIMENTAL justable rate. The video photograph system ofPLM included a SONY DXC-755 CCD color videocamera, a color video monitor, a video cassetteMaterialsrecorder, and a Linkam VTO-232 video text over-
PEEK powder, commercial-grade 150P, was ob- lay. This system can perform real-time analysis attained from ICI. All samples were carefully dried a maximum rate of one picture per three seconds.under vacuum before investigation. Benzophe-none (99%; from Janssen Chimica) was used asreceived without further purification. Growth Rates
Growth rate measurements were conducted al-ways on freshly made films. In the study of ther-Melt-Pressed Filmmal stability of melt-pressed film, the equilibra-
The specimens were prepared by placing a small tion temperature (385, 390, 395, 400, 405, 410, oramount of the polymer (powder form) on a thin 4157C) was above the melting point of PEEK.circular cover glass and placing another circular After 15 min at the melt temperature, the heatingcover glass on top of the powders. The resulting stage was cooled to the crystallization tempera-sandwich was placed on a small hot block regu- ture (300 or 2907C) at a maximum controlled cool-lated at 395 { 17C for 3 min to melt PEEK under ing rate of 1307C/min. The heating stage con-nitrogen. A thin film was produced by applying a taining the specimen reached this temperature inslight pressure on the top cover glass. The mass approximately 1 min. In measurements of growthwas then slid off the melting block onto the heat- rate, process conditions are described separatelying stage under nitrogen atmosphere and heated in the above sections of melt-pressed film and sol-at 1007C/min from room temperature to 400 or vent-cast film. The development of the spherulites4157C. The samples were maintained at this mol- was recorded as a function of time during the crys-ten state for 15 min, and then cooled down rapidly tallization process and the data were saved forto the required isothermal crystallization temper- later analysis. The magnification of each run wasature range of 325–2707C. Below 2707C crystalli- calibrated by photographing a stage micrometerzation was too fast to be recorded. whose smallest division is 10 mm. After the heat-
ing stage had reached thermal equilibrium andthe radius of spherulite wasú 15 mm, the spheru-Solvent-Cast Filmlitic size was measured. Growth rates were al-
Thin films of PEEK were obtained using the fol- ways determined well below the point at whichlowing procedure: 0.06 wt % PEEK was dissolved the increase of spherulitic radius departed fromin boiling benzophenone at 2657C, then this solu- linearity. In each specimen, radii versus timetion was cast on a heated microscope slide. The were plotted for numerous spherulites.benzophenone was evaporated leaving a thin filmof PEEK that was finally dried under vacuum at1507C. These films were then cut and inserted RESULTSbetween two thin circular cover glass slides. Thissandwich was put onto the heating stage under
Thermal Stabilitynitrogen atmosphere and heated at 1007C/minfrom room temperature to 4007C. After holding Spherulitic growth was monitored at crystalliza-for 15 min at 4007C, the sample was quenched tion temperatures of 290 and 3007C. By measur-to the desired crystallization temperature range ing the spherulitic radii from a series of PLM mi-260–3157C, and allowed to crystallize isother- crographs taken at successive intervals, the radiimally. were plotted versus time. Figure 1 shows the typi-
cal plot at 3007C for the specimen after equilibra-tion at 4007C for 15 min. Growth rates were deter-Polarized Light Microscopy (PLM)mined by making a linear least-squares fit of thecurves before impingement. The slopes of theseA Nikon Optiphot-pol polarizing microscope was
used in conjunction with a Linkam THMS-600 linear lines were 0.236, 0.246, and 0.243 mm/s,respectively. The correlation coefficients of theseheating stage. This stage, equipped with a Lin-
kam TMS-91 temperature control system, en- lines were 0.999, 0.997, and 1.000, respectively.The average growth rate was 0.242 { 1.5% mm/s,abled samples to be heated and cooled at an ad-
9706037/ 8Q53$$6037 04-02-98 15:50:48 polpa W: Poly Physics

1338 CHEN AND CHEN
Figure 1. Variation of spherulitic radii with time at 3007C for melt-pressed film ofPEEK after equilibration for 15 min at 4007C. Different symbols represent differentspherulites.
which is thus the crystal growth rate of PEEK at increasing melting temperature, suggesting thatwithin 15 min PEEK was still stable on ap-3007C.
The isothermal spherulitic growth rates at 290 proaching 4007C in nitrogen. It also shows thatchanging the melting temperature from 400 toand 3007C as a function of melting temperature,
from 385 to 4157C, were obtained similarly. The 4157C decreased the growth rate at 3007C by 19%and that at 2907C by about 25%. These resultsresults of average growth rates and error bars are
plotted versus melting temperatures in Figure 2. indicate that the allowable maximum meltingtemperature of PEEK was about 4007C, which isIt was found that there was no difference between
the growth rates measured under nitrogen in the close to the reported thermodynamic meltingpoint, 3957C.melting temperature range 385–4007C. The aver-
age growth rates 0.528 { 0.8% mm/s at 2907C andGrowth Rates of Solvent-Cast Film0.243 { 0.9% mm/s at 3007C, are shown in two
solid lines across the ordinate. The growth rate Spherulites were always observed in the tempera-ture range 260–3157C. A series of PLM micro-leveled off around 4007C and then decreased with
Figure 2. Isothermal spherulitic growth rates at 290 and 3007C for melt-pressed filmof PEEK after equilibration at various temperatures for 15 min. The error bar is alsoshown for each point.
9706037/ 8Q53$$6037 04-02-98 15:50:48 polpa W: Poly Physics

CRYSTALLIZATION KINETICS OF PEEK 1339
Figure 3. Polarized light micrographs showing the isothermal spherulitic growth ofsolvent-cast film in an interval of (a) 0 s, (b) 30 s, (c) 60 s, and (d) 90 s, at 3007C. Thescale bar corresponds to 100 mm.
graphs (Fig. 3) illustrates the spherulitic mor- mined by making a linear least-squares fit of theinitial linear portion of the curves before impinge-phology of PEEK crystals at the crystallization
temperature of 3007C on which the linear growth ment. The slopes of these linear lines are 0.185,0.181, and 0.189 mm/s, respectively, which thusrates were measured. Only spherulitic textures
with branching fibrils were seen. The spherulitic determine the crystal growth rates of PEEK at3007C. The correlation coefficients of these linesmorphology was a more open texture with almost
complete loss of the Maltese cross, as compared are 1.000, 0.997, and 1.000, respectively. The av-erage growth rate was therefore 0.185{ 1.4% mm/with the spherulitic textures of melt-pressed film
at the same temperature. From measurements of s at 3007C.Spherulitic growth is monitored at the crystal-the spherulitic radii from PLM micrographs taken
at successive intervals of 30 s, the radii are plotted lization temperature of 3157C (Fig. 5), the highestcrystallization temperature studied for solvent-versus time in Figure 4. Growth rates were deter-
Figure 4. Variation of spherulitic radii with time at 3007C for solvent-cast film. Differ-ent symbols represent different spherulites.
9706037/ 8Q53$$6037 04-02-98 15:50:48 polpa W: Poly Physics

1340 CHEN AND CHEN
Figure 5. Polarized light micrographs showing the isothermal spherulitic growth ofsolvent-cast film in an interval of (a) 0 min, (b) 2 min, (c) 4 min, (d) 6 min, (e) 10min, (f ) 16 min, (g) 22 min, and (h) 26 min, at 3157C. The scale bar corresponds to100 mm.
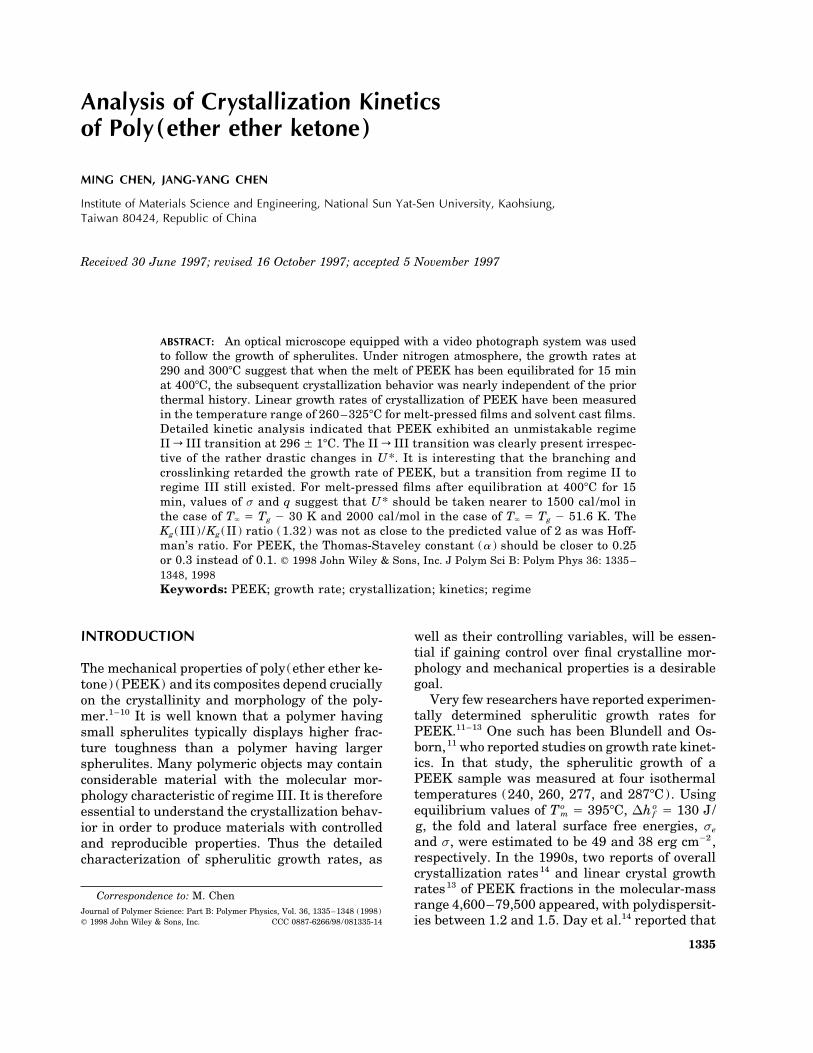
cast film. The spherulitic texture had become rela- zation appeared to slow down. This nonlineargrowth was due to the decrease in average concen-tively coarse with Maltese cross extinction. It was
also observed that the number of nuclei decreased tration of polymer caused by crystallization or toa diffusion process near the phase boundary. Theslightly with increasing crystallization tempera-
ture. By measuring the spherulitic radius from growth rate was determined from the initial lin-ear slope in radius versus time plot. The isother-PLM micrographs taken at successive intervals of
2, 4, or 6 min, the radii were plotted versus time mal spherulitic growth rates at other tempera-tures were obtained similarly. The results of aver-as seen in Figure 6. At 3157C the radii initially
increased linearly with time. When the radius of age growth rates and their errors are shown inthe second column of Table I.spherulite was beyond 30 mm, the rate of crystalli-
9706037/ 8Q53$$6037 04-02-98 15:50:48 polpa W: Poly Physics
CRYSTALLIZATION KINETICS OF PEEK 1341
Figure 6. Variation of spherulitic radius with time at 3157C for solvent-cast film.The radius of spherulite deviates from the initial linear line when the radius is largerthan 30 mm.
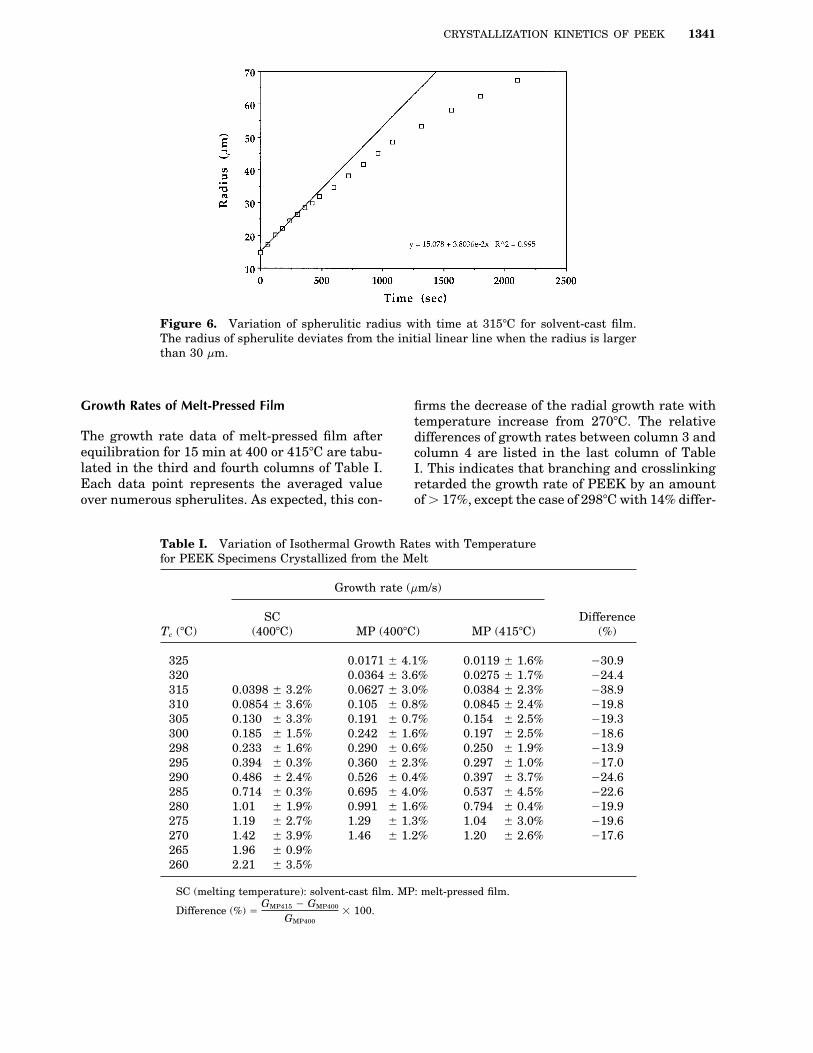
Growth Rates of Melt-Pressed Film firms the decrease of the radial growth rate withtemperature increase from 2707C. The relative
The growth rate data of melt-pressed film after differences of growth rates between column 3 andequilibration for 15 min at 400 or 4157C are tabu- column 4 are listed in the last column of Tablelated in the third and fourth columns of Table I. I. This indicates that branching and crosslinkingEach data point represents the averaged value retarded the growth rate of PEEK by an amount
ofú 17%, except the case of 2987C with 14% differ-over numerous spherulites. As expected, this con-
Table I. Variation of Isothermal Growth Rates with Temperaturefor PEEK Specimens Crystallized from the Melt
Growth rate (mm/s)
SC DifferenceTc (7C) (4007C) MP (4007C) MP (4157C) (%)
325 0.0171 { 4.1% 0.0119 { 1.6% 030.9320 0.0364 { 3.6% 0.0275 { 1.7% 024.4315 0.0398 { 3.2% 0.0627 { 3.0% 0.0384 { 2.3% 038.9310 0.0854 { 3.6% 0.105 { 0.8% 0.0845 { 2.4% 019.8305 0.130 { 3.3% 0.191 { 0.7% 0.154 { 2.5% 019.3300 0.185 { 1.5% 0.242 { 1.6% 0.197 { 2.5% 018.6298 0.233 { 1.6% 0.290 { 0.6% 0.250 { 1.9% 013.9295 0.394 { 0.3% 0.360 { 2.3% 0.297 { 1.0% 017.0290 0.486 { 2.4% 0.526 { 0.4% 0.397 { 3.7% 024.6285 0.714 { 0.3% 0.695 { 4.0% 0.537 { 4.5% 022.6280 1.01 { 1.9% 0.991 { 1.6% 0.794 { 0.4% 019.9275 1.19 { 2.7% 1.29 { 1.3% 1.04 { 3.0% 019.6270 1.42 { 3.9% 1.46 { 1.2% 1.20 { 2.6% 017.6265 1.96 { 0.9%260 2.21 { 3.5%
SC (melting temperature): solvent-cast film. MP: melt-pressed film.
Difference (%) Å GMP415 0 GMP400
GMP4001 100.
9706037/ 8Q53$$6037 04-02-98 15:50:48 polpa W: Poly Physics

1342 CHEN AND CHEN
Table II. Values of Kinetic Parameters Calculated from Growth Rate Data of Melt-Pressed Filmsa
Tc G log G(7C) (mm/s) (cm/s) log G / U*/2.303R(Tc 0 Tg / 30) f Å 2Tc/(To
m / Tc) 1/Tc(DT)f 1 105
270 1.460 03.836 01.721 0.897 1.643275 1.288 03.890 01.842 0.901 1.687280 0.991 04.004 02.018 0.906 1.736285 0.695 04.158 02.230 0.910 1.790290 0.526 04.279 02.406 0.915 1.849295 0.360 04.444 02.623 0.919 1.916298 0.290 04.538 02.747 0.922 1.959300 0.242 04.616 02.845 0.923 1.989305 0.191 04.720 02.995 0.928 2.072310 0.105 04.978 03.297 0.932 2.165315 0.0627 05.203 03.564 0.936 2.270320 0.0364 05.439 03.841 0.941 2.391325 0.0171 05.766 04.205 0.945 2.529
a In this case, U* Å 1500 cal/mol, T` Å Tg 0 30 K, melting temperature 4007C.
ence. It is also clear from the data of Table I that 2957C were used to fit a linear line in the higherthe relative differences of growth rates between undercooling region. The break in the curve oc-solvent-cast film and melt-pressed film after curs at Tc Å 2957C, and the ratio of the two slopesequilibration for 15 min at 4007C were higher is 1.32. The values of Kg are also tabulated inthan 18% at crystallization temperature above Table III.2957C. The relative differences were less than The kinetic analysis of the full growth rate data{10% below 2957C. for the solvent-cast film with the same values of
U* and T` is tabulated in the third row of TableIII, except the growth rate data were extended to
Regime Analyses2607C to fit a linear line in the higher undercool-ing region. Both correlation coefficients are aboutExistence of Regime II r III Transition0.993. The break in the curve occurs at TcÅ 3047C,
Let us first follow regime analyses to treat our and the ratio of the two slopes is 1.22. Similarexperimental data of melt-pressed film after analysis for the melt-pressed film after equilibra-equilibration at 4007C for 15 min, as shown in the
tion at 4157C for 15 min is listed in the ninth rowthird column of Table I. Generally the growth rateof Table I. The correlation coefficients were 0.9951of polymers during crystallization is described inand 0.9924, respectively, for regime III and II. Thea given regime by eq. (1). In the case of PEEK,transition temperature was 2927C from regime IIthe following values were tried: U* Å 1500 cal/to III, and the ratio of Kg was 1.25.mol, and T` Å Tg 0 30 K with the Tg of PEEK at
The last data point for the fitted linear line in418 K. The value Tom Å 3957C Å 668 K was em-
the higher undercooling region was then variedployed. The calculated values of log G / U*/separately to maximize the correlation coeffi-2.303R (Tc 0 Tg / 30), f , and 1/Tc (DT ) f arecients. Table III shows the results of these calcula-listed in columns 4, 5, and 6 of Table II, respec-tions. Any correlation coefficient above 0.99 repre-tively. It should be noted that the value of thesents an extremely good fit of the data. This showscorrection term, f , is less than 0.9 at such a highthat the growth rate data obtained from the melt-undercooling temperature (DT Å 1257C), so itpressed film after equilibration at 4007C for 15cannot be neglected. A plot of log G / U*/min have a better fit than the two other cases.2.303R (Tc0 Tg/ 30) versus 1/Tc (DT ) f , can pro-The best two fits are marked in bold font. In thevide the value of Kg (slope 1 2.303) and log G0
higher undercooling region if the last data point(intercept) for each regime. The best fit with twofor the fitted linear line is taken at 2957C, thenlines is reflected in the correlation coefficientsthe transition temperature would be 2957C, as(ú 99.8%), as shown in the sixth row of Table III.
In this case, the growth rate data from 270 to shown in the sixth row of Table III. Row 7 shows
9706037/ 8Q53$$6037 04-02-98 15:50:48 polpa W: Poly Physics

CRYSTALLIZATION KINETICS OF PEEK 1343
Table III. values of Kg, Correlation Coefficient and Transition Temperature Determinedfrom Kinetic Analysis Plotsa
Range TIIrIII
Specimen (7C) Kg(III) 1 1005 R2(III) Kg(II) 1 1005 R2(II) Kg(III)/Kg(II) (7C)
SC (4007C) 260–285 8.389 0.9924 7.135 0.9875 1.18 292260–290 8.371 0.9957 7.056 0.9823 1.19 293260–295 7.955 0.9931 6.541 0.9930 1.22 304260–298 8.132 0.9945 6.494 0.9896 1.25 302
MP (4007C) 270–290 7.860 0.9967 5.916 0.9985 1.33 295270–295 7.759 0.9981 5.891 0.9982 1.32 295270–298 7.628 0.9982 5.886 0.9977 1.30 296
MP (4157C) 270–290 8.279 0.9969 6.278 0.9940 1.32 290270–295 7.851 0.9951 6.271 0.9924 1.25 292270–298 7.531 0.9936 6.213 0.9901 1.21 296
SC (melting temperature): solvent-cast film. MP: melt-pressed film. Range (7C): Temperature range for fitted linear line in thehigher undercooling region.
a In this case, U* Å 1500 cal/mol, T` Å Tg 0 30 K.
that the data range 270–2987C for the higher un- changes in pre-exponential factor G0 with U* andT` . Only the trend need be considered, not thedercooling region would give a transition temper-
ature of 2967C. absolute values cited. The values of G0(III) ,G0(II) , and G0(III) /G0(II) are given in the sec-From the results of regime analysis listed in
Table III, the points do not lie on a single straight ond, fourth, and sixth columns of Table IV. Theratio of G0(III) /G0(II) is increased from 103 toline, but the data are satisfactorily fitted by a pair
of straight lines, one line to the data judged to be 1011, where the latter one is beyond a reasonablerange. U* Å 16,730 cal/mol is also beyond theabove the transition temperature and the second
to the data below the transition. We have thus reasonable value.Similarly in the case of T` Å Tg 0 30 K, theshown that PEEK exhibits an unmistakable re-
gime II r III rate transition. For melt-pressed ratio of Kg (III) /Kg (II) increases from 1.317 to2.000 when U* is changed from 1,500 to 11,690film after equilibration for 15 min at 4007C, the
transition temperature is ca. 2967C and the Kg cal/mol (see Table IV). The ratio of G0(III) /G0(II)changes from 101 to 1010, where the latter oneratios are õ 1.32.still is beyond the reasonable value. The resultsof Table IV indicate that, at low temperature,Transition Temperature of Regime II r IIIcrystallization is according to regime III, butHere we examine the ratio of Kg (III) /Kg (II) , above ca. 2967C according to regime II. The ratiowhich theory gives as 2. Only the melt-pressed Kg (III) /Kg (II) Å 2.000 corresponds to an unrea-film after equilibration at 4007C for 15 min will sonable U* and G0(III) /G0(II) ratio.be discussed here and the growth rate data from
270 to 2957C are used to fit a linear line in the Determination of sse and shigher undercooling region. Values of U* and T`
are then adjusted separately to make the ratio of Once the regimes have been established, thegrowth rate data can be used to obtain sse byKg (III) /Kg(II) exactly 2 as predicted by the the-
ory. Table IV shows the results of some calcula- using eq. (3) provided that Dhf and b0 are known.With values b0 Å 0.468 nm,25 To
m Å 3957C, Dhftions. All the correlation coefficients are above0.993, representing an extremely good fit of the Å 130 J/g as determined by Blundell and Os-
born11 and the corresponding values of Kg listeddata. The II r III transition at 296{ 17C is clearlypresent irrespective of the rather drastic changes in Table V, sse can be obtained for both regimes.
The density of PEEK at 32% crystallinity is esti-in U*. However, we observe that the ratio Kg (III) /Kg (II) changes from 1.509 to 2.000 when U* is mated to be 1.30 g/cm3.26 If one assumes that
the folding surface free energy of the lamellae ischanged from 4,160 to 16,730 cal/mol in the caseof T` Å Tg 0 51.6 K. Table IV also illustrates unlikely to change significantly with respect to
9706037/ 8Q53$$6037 04-02-98 15:50:48 polpa W: Poly Physics

1344 CHEN AND CHEN
Table IV. Values of Kinetic Parameters from Best Fit of Growth Rate Dataa,b
T`/U* G0(III) G0(II) TIIrIII
K/(cal/mol) (cm/s) R2(III) (cm/s) R2(II) G0(III)/G0(II) Kg(III)/Kg(II) (7C)
Tg-51.6/4160 7.980 1 108 0.9979 7.816 1 105 0.9982 1.02 1 103 1.509 296Tg-51.6/8000 1.413 1 1017 0.9961 4.169 1 1011 0.9971 3.39 1 105 1.732 296Tg-51.6/11690 1.175 1 1025 0.9947 1.318 1 1017 0.9958 8.92 1 107 1.872 296Tg-51.6/16730 7.943 1 1035 0.9933 4.365 1 1024 0.9942 1.82 1 1011 2.000 296Tg-55/4500 2.421 1 109 0.9978 1.832 1 106 0.9982 1.32 1 103 1.520 296Tg-30/1500 6.668 1 103 0.9981 1.832 1 102 0.9982 3.64 1 101 1.317 295Tg-30/4160 4.571 1 1010 0.9972 6.700 1 106 0.9979 6.82 1 103 1.606 295Tg-30/8000 3.388 1 1020 0.9948 2.570 1 1013 0.9962 1.32 1 107 1.853 296Tg-30/11690 1.023 1 1030 0.9932 5.495 1 1019 0.9945 1.86 1 1010 2.000 297Tg-30/1800 3.936 1 104 0.9982 5.984 1 102 0.9983 6.58 1 101 1.357 295
a In this case, melt-pressed film, melting temperature 4007C.b The growth rate data from 270 to 2957C are used to fit a linear line in the higher undercooling region.
temperature and that changes in the product can results of Blundell and Osborn.11 Growth ratedata from 260 to 3257C were in a temperaturebe assigned solely to s, it is possible to estimate
s as sse /se . The value seÅ 49 erg cm02 was deter- region far above the maximum in G . The regimeII to regime III transition occurs at an undercool-mined by Blundell and Osborn11 and are used in
this work. ing of 99 K (Tc Å 2967C), which is still well abovethe maximum in G (T ) and is, therefore, readilyWe have examined the effect of T` and U* on
analysis of the data. Detailed data of G0(III) / observable. A regime I r II transition was not de-tected, most likely because the highest growth tem-G0(II) , Kg (III) /Kg (II) , Kg’s, the products of lat-
eral and fold surface free energies, sse , and the perature employed (3257C) still corresponds to thequite large undercooling of DTÅ 707C. Thus, in thelateral surface free energy, s, are listed in Table
V. It can be seen that a corresponding change in range of the present data, the temperature depen-dence of G is almost entirely in the factor exp[Kg /U* from 1500 or 2000 to 4160 cal/mol, increases
Kg and sse by more than 35%. Little differences Tc(DT ) f ] of eq. (1), while the exp[0U*/R(T0 T`)] term behaves as a relatively unimportantin sse are reported between melt-pressed film and
solvent-cast film in regime III, but larger differ- correction term. Therefore, the II r III transition is296 { 17C and is clearly present irrespective of theences are observed in regime II. Judged in com-
parison with the undesirable feature that s ¢ se rather drastic changes in U*. This constant transi-tion temperature fits very well with the prediction(49 erg cm02) , only the two conditions with bold
font in Table V are acceptable. One is T` Å Tg of 2987C proposed by Day et al.,14 which was basedon the overall growth rate data of only one of the0 51.6 K, U* Å 2000 cal/mol, the other one is T`
Å Tg 0 30 K, U* Å 1500 cal/mol for melt-pressed narrow molecular weight samples and the assump-tion that the Avrami exponent was normalized tofilm after equilibration for 15 min at 4007C. Aver-
aging the values of sse and s for the above two n Å 2. This n value was less than the experimentalvalue, among 2 and 3.cases, we can find s is 29.8 erg cm02 in regime III
and s is 45.2 erg cm02 in regime II. Their average The effect of transition temperature can be de-tected by comparing the growth rates between sol-value, 37.5 erg cm02 , is in good agreement with
Blundell’s estimation of 38 erg cm02 . Their vent-cast film and melt-pressed film. Table Ishows that the relative differences of growth ratesKg (III) /Kg(II) ratios are only 1.32 and G0(III) /
G0(II) ratios are about 40. were higher than 18% above 2957C for melt-pressed film, and were less than {10% below2957C. In regime II, the developing spheruliteswere better formed than were those in regime IIIDISCUSSIONand the decrease in average concentration of poly-mer caused by crystallization was more evident.The maximum rate of crystallization for PEEK
occurred at around 2307C as determined by the Therefore the growth rate measured in a thinner
9706037/ 8Q53$$6037 04-02-98 15:50:48 polpa W: Poly Physics

CRYSTALLIZATION KINETICS OF PEEK 1345
Tab
leV
.V
alu
esof
Par
amet
ers
Det
erm
ined
from
Kin
etic
An
alys
isP
lots
T`/U
*S
ampl
eK
/(ca
l/mol
)G
0(II
)/G
0(II
)K
g(II
I)/K
g(II
)R
2 (III
)K
g(II
I)1
100
5ss
e(II
I)s
(III
)R
2 (II)
Kg(
II)1
100
5ss
e(II
)s
(II)
SC
(400
7C)
Tg-
51.6
/200
01.
921
101
1.21
70.
9934
8.06
315
0430
.70.
9933
6.62
624
7350
.5T
g-51
.6/4
160
6.901
102
1.41
90.
9910
11.2
621
0142
.90.
9962
7.93
629
6260
.4T
g-30
/150
01.
841
101
1.21
60.
9931
7.95
514
8430
.30.
9930
6.54
124
4149
.8T
g-30
/416
06.
141
103
1.52
50.
9890
13.0
224
2949
.60.
9970
8.53
731
8665
.0T
g-55
/450
09.
041
102
1.43
10.
9909
11.5
321
5143
.90.
9964
8.05
630
0661
.4M
P(4
007C
)T
g-5
1.6/
2000
3.901
101
1.31
90.
9981
7.87
214
6930
.00.
9983
5.96
722
6745
.4T
g-51
.6/4
160
1.021
103
1.50
90.
9979
10.6
519
8740
.60.
9982
7.06
126
3553
.8T
g-3
0/15
003.
641
101
1.31
70.
9981
7.75
914
4829
.50.
9982
5.89
121
9844
.9T
g-30
/416
06.
821
103
1.60
60.
9972
12.1
322
6346
.20.
9979
7.54
928
1757
.5T
g-55
/450
01.
321
103
1.52
00.
9978
10.8
920
3241
.50.
9982
7.16
226
7354
.5M
P(4
157C
)T
g-51
.6/2
000
2.101
101
1.25
40.
9952
7.96
114
8530
.30.
9925
6.34
723
6948
.3T
g-51
.6/4
160
5.501
102
1.44
40.
9950
10.7
420
0440
.90.
9933
7.43
927
7656
.7T
g-30
/150
01.
951
101
1.25
20.
9951
7.85
114
6529
.90.
9924
6.27
123
4047
.8T
g-30
/416
03.
661
103
1.54
10.
9943
12.2
222
8046
.50.
9932
7.92
929
5960
.4T
g-55
/450
07.
081
102
1.45
60.
9950
10.9
820
4941
.80.
9933
7.54
228
1557
.4
SC
(mel
tin
gte
mpe
ratu
re):
solv
ent-
cast
film
;M
P:m
elt-
pres
sed
film
;Un
it:
Kg
(K2 ),
ss
e(e
rg2
cm0
4 ),s
(erg
cm0
2 ).T
he
grow
thra
teda
tafr
om26
0to
2957
Car
eu
sed
tofi
ta
lin
ear
lin
ein
the
hig
her
un
derc
ooli
ng
regi
on.
9706037/ 8Q53$$6037 04-02-98 15:50:48 polpa W: Poly Physics

1346 CHEN AND CHEN
film (solvent-cast film) was slower than that of mate s of PEEK. These assumptions include thatall the spherulites were of identical size, the peakmelt-pressed film. However, no abrupt change in
macroscopic morphology was seen at the II r III crystallization time corresponded to the pointwhere the spherulite impinge, the data were fittedregime transition.
It is also interesting to examine the growth rate to regime I kinetics, U* Å 2000 cal/mol and Tm
Å 3437C. Their calculations led to a value of sdata measured in the melt-pressed film afterequilibration for 15 min at 4157C. The branching É 37 erg cm02 that is higher than is usually met
with polymer crystals. Deslandes et al.13 and Dayand crosslinking retarded the growth rate ofPEEK by an amountú 17%. From the differences et al. used this s value to estimate se . Analysis
of the Day’s data and the conclusion drawn from itillustrated in the fifth column of Table I, the retar-dation of growth rate was more evident at higher with regime behavior may depend on underlying
assumptions. The Avrami exponent was normal-temperature in both regimes. Therefore, a transi-tion from regime II to regime III still existed, but ized to n Å 2. A set of T` Å Tg 0 55 K and U*
É 4500 cal/mol, were chosen from the crystalliza-had moved from 295 to 2927C (see rows 6 and 9in Table III) . On the other hand, the thickness tion results obtained from the glass. In Table V,
we also include this set of T` Å Tg 0 55 K anddifference of the specimen significantly affectedthe growth rate in regime II, but was of very little U* É 4500 cal/mol for solvent-cast film and melt-
pressed films. The results indicate that this set isinfluence in regime III (see the second and thirdcolumns in Table I) . It is not surprising therefore not acceptable for PEEK 150P, because this as-
sumption has the undesirable feature that s ¢ sethat the transition temperature shifted to 3047C,as shown in the third row of Table III. (49 erg cm02) in regime II.
In the past, most assessments of the surfaceIn Table IV, one set values of U* Å 4160 cal/mol and T` Å Tg 0 51.6 K are taken from the free energy, s, have relied on the use of the modi-
fied Thomas-Staveley equation,15 where the valueWLF equation. While these values are generallyassociated with viscoelastic measurements, they a Å 0.1 was assumed to be universal. This expres-
sion isare less applicable to crystallization rate analyses(see Table V). In this case for PEEK, the lowesttemperature of isothermal crystallization was s Å arDho
f (a0b0)1/2 (5)2607C, which was 1107C above Tg . Therefore thesedata points are out of the application range of the where rDho
f and a0b0 are, respectively, the en-WLF equation. For polymers, most of the data thalpy of fusion per unit volume and the cross-from growth rate measurements is accounted for sectional area of a chain in the crystal. The resultsby values near U* à 1500 cal/mole and T` Å Tg of the Roitman et al.23 study demonstrated that0 30 K. Using these values for U* and T` did the Thomas-Staveley constant is not at all univer-bring the PEEK data much closer to the expected sal and depends strongly on the chemical naturework required for chain folding, but the Kg ratio of the polymer of interest. They proved the a valuestill was only 1.32. The only manner by which a for poly(pivalolactone) was 0.25.theoretical ratio of 2 may be forced, is to increase The work of chain folding q can be calculatedsubstantially the value of U*. As seen in Table fromIV, a significant increase of G0 ratio and Kg isobtained for PEEK with use of these uncommon q Å 2a0b0se (6)choices of U*. Also, quite incorrect values of thelateral surface free energy and the work of chain
Combining eqs. (5) and (6), we getfolding would be obtained. This constitutes an un-acceptable analysis of our data.
q Å 2se (s /arDhof )2 (7)For comparison, the values reported for s and
se by Blundell and Osborn11 for their sample yieldsseÅ 1862 erg2 cm04 , which falls within our inter- If one assumes that se à 49 erg cm02 for the fold-
ing surface free energy, eq. (7) becomes q Å 4.94val for both cases of U* à 1500 cal/mol, T` Å Tg
0 30 K and U* à 2000 cal/mol, T` Å Tg 0 51.6 1 1004 (s /a )2 kcal/mol, where s is in the unit oferg cm02 . From the average values of s givenK. That the authors assumed regime I mode of
crystallization does not change the value, since above or in Table V, we can find that the workshould be 43.9 kcal/mol in regime III, 101 kcal/the same numerical factor 4 is used here. Blundell
and Osborn11 made several assumptions to esti- mol in regime II if a Å 0.1, and should be 7.0 kcal/
9706037/ 8Q53$$6037 04-02-98 15:50:48 polpa W: Poly Physics

CRYSTALLIZATION KINETICS OF PEEK 1347
mol in regime III, 16.1 kcal/mol in regime II if a of exp[0U*/R (T 0 T` ) ] is minimal and the tem-perature dependence of growth rate is almost en-Å 0.25. The work of chain folding appears unrea-
sonably high for a Å 0.1. tirely in the factor exp[Kg /Tc (DT ) f ] . Therefore,the II r III transition is clearly present irrespec-As the melting temperature rises, the work of
chain folding increases because the stiffer chain tive of the rather drastic changes in U*. This con-stant transition temperature fits very well withis harder to bend to make the fold. Observe that
it is q , and not se , that scales smoothly upward the prediction of ca. 2987C proposed by Day et al.,which was based on the overall growth rate dataas To
m increases. Thus one would expect q to in-crease as To
m increases. Lovinger et al.21 estimated of one of the narrow molecular weight samplesand the assumption that the Avrami exponentthe work of chain folding for MMW PPS to be 9
kcal/mol by the selection of aÅ 0.3. Consequently, was normalized to n Å 2.The results show that the relative differenceshigh values should be expected from the quite stiff
molecules of PEEK. The choice of a Å 0.3 gives a of growth rate between solvent-cast film and melt-pressed film were higher than 18% in regime IIwork of 4.87 kcal/mol in regime III and 11.2 kcal/
mol in regime II. s and q values appear unreason- for melt-pressed film, and were less than {10%in regime III. In regime II, the developing spheru-ably high for a Å 0.1. Values of s and q again
suggest that U* should be taken nearer to 1500 lites were much better formed than those in re-gime III and the decrease in average concentra-cal/mol in the case of T` Å Tg 0 30 K and 2000
cal/mol in the case of T` Å Tg 0 51.6 K. The ratio tion of polymer caused by crystallization wasmore evident. However, there was no clear corre-of pre-exponential factors, G0(III) /G0(II) was de-
termined to be 40 for melt-pressed film after equil- lation between the regime transition and morpho-logical changes. It is also interesting to note thatibration at 4007C for 15 min. The Kg ratio was
only 1.32. This deviation from the theoretical ex- after equilibration at 4157C for 15 min, thebranching and crosslinking retarded the growthpectation of 2 may be accounted for by the broad
distribution of molecular weights present in the rate of PEEK byú 17%. A transition from regimeII to regime III still existed, but it moved fromcommercial samples. High molecular weight
tends to give a slower crystallization rate at a 295 to 2927C.Values of s and q suggested that U* should begiven undercooling. The other reason can be ar-
gued that se most probably is dependent on the taken nearer to 1500 cal/mol in the case of T`
Å Tg 0 30 K and 2000 cal/mol in the case of T`temperature of crystallization, as better crystalsurfaces are formed in regime II during slower Å Tg 0 51.6 K for melt-pressed film after equili-
bration for 15 min at 4007C. Averaging the valuescrystallization. The question that still remains iswhat are the correct values of a0 and a? of s derived from the above two cases, we found
the average value, 37.5 erg cm02 , was in goodagreement with Blundell’s estimation. The ratioof pre-exponential factors, G0(III) /G0(II) was de-CONCLUSIONtermined to be 40. Their Kg (III) /Kg (II) ratio(1.32) was not as close to the predicted value ofThis work has provided evidence that it is im-
portant to consider thermal history above the melt 2 as was Hoffman’s ratio. This deviation from thetheoretical expectation most likely would be ac-for the processing of PEEK. Under nitrogen atmo-
sphere, the growth rates at 290 and 3007C leveled counted for by the broad distribution of molecularweights present and the variation of se with tem-off around 4007C and then decreased with increas-
ing melting temperature. It has been demon- perature of crystallization. The work of chain fold-ing appeared unreasonably high for a Å 0.1.strated that under nitrogen atmosphere equili-
bration at 4007C for 15 min before crystallization Therefore, a is close to 0.25 or 0.3 instead of 0.1for the case of PEEK.was effective in reducing nucleation density with-
out polymer degradation. This treatment allowedThis work is financially supported by the National Sci-spherulitic growth rate measurements and mor-ence Council, ROC, under contract number NSC 82-
phology control. 0405-E110-014.We have shown that PEEK exhibits an unmis-
takable regime II r III transition at 296 { 17C. REFERENCES AND NOTESThe growth rate data from 260 to 3257C were ina temperature region far above the maximum 1. P. Cebe, S. Y. Chung, and S.-D. Hong, J. Appl.
Polym. Sci., 33, 487 (1987).growth rate, where the temperature dependence
9706037/ 8Q53$$6037 04-02-98 15:50:48 polpa W: Poly Physics

1348 CHEN AND CHEN
2. P.-Y. B. Jar, R. Mulone, P. Davies, and H. H. 15. D. G. Thomas and L. A. K. Staveley, J. Chem. Soc.,Kausch, Compos. Sci. Technol., 46, 7 (1993). 4569 (1952).
3. W. I. Lee, M. F. Talbott, G. S. Springer, and L. A. 16. J. D. Hoffman, G. T. Davis, and J. I. Lauritzen, Jr.,Berglund, J. Reinf. Plast. Compos., 6, 2 (1987). in Treatise on Solid State Chemistry, Vol. 3, N. B.
4. A. Lustiger, SAMPE J., 20, 13 (September/October Hannay, ed., Plenum Press, New York, 1976, Chap.1984). 7.
5. A. Lustiger, F. S. Uralil, and G. M. Newaz, Polym. 17. J. D. Hoffman, Polymer, 23, 656 (1982).Compos., 11, 65 (1990). 18. J. D. Hoffman, Polymer, 24, 3 (1983).
6. A. A. Ogale and R. L. McCullough, Compos. Sci. 19. E. J. Clark and J. D. Hoffman, Macromolecules, 17,Technol., 30, 185 (1987). 878 (1984).
7. S. Saiello, J. Kenny, and L. Nicolais, J. Mater. Sci., 20. E. N. Dalal and P. J. Phillips, J. Polym. Sci.: Part25, 3493 (1990). C: Polym. Lett., 22, 7 (1984).
8. M. F. Talbott, G. S. Springer, and L. A. Berglund, 21. A. J. Lovinger, D. D. Davis, and F. J. Padden, Jr.,J. Compos. Mater., 21, 1056 (1987). Polymer, 26, 1595 (1985).
9. F. S. Uralil, G. M. Newaz, and A. Lustiger, Polym.22. S. J. Organ and A. Keller, J. Polym. Sci.: Part B:Compos., 13, 7 (1992).
Polym. Phys., 24, 2319 (1986).10. P. Vautey, SAMPE Q., 21, 23 (January 1990).23. D. B. Roitman, H. Marand, R. L. Miller, and J. D.11. D. J. Blundell and B. N. Osborn, Polymer, 24, 953
Hoffman, J. Phys. Chem., 93, 6919 (1989).(1983).24. S. Z. D. Cheng, J. J. Janimak, A. Zhang, and H. N.12. Y. Deslandes, M. Day, F.-N. Sabir, and T. Suprun-
Cheng, Macromolecules, 23, 298 (1990).chuk, Polym. Compos., 10, 360 (1989).25. P. C. Dawson and D. J. Blundell, Polymer, 21, 57713. Y. Deslandes, F.-N. Sabir, and J. Roovers, Polymer,
(1980).32, 1267 (1991).26. J. N. Hay, D. J. Kemmish, J. I. Langford, and14. M. Day, Y. Deslandes, J. Roovers, and T. Suprun-
chuk, Polymer, 32, 1258 (1991). A. I. M. Rae, Polym. Commun., 25, 175 (1984).
9706037/ 8Q53$$6037 04-02-98 15:50:48 polpa W: Poly Physics