Analysis of causes for high organic and inorganic pollution in … · 2017-12-12 · Analysis of...
13
INTERNATIONAL JOURNAL OF ENVIRONMENTAL SCIENCES Volume 2, No 1, 2011 © Copyright 2010 All rights reserved Integrated Publishing Association Research article ISSN 0976 – 4402 Received on June 2011 Published on September 2011 315 Analysis of causes for high organic and inorganic pollution in denim processing effluent Rathinamoorthy. R 1 , Senthilkumar. P 2 1-Assistant Professor, Department of Fashion Technology, PSG College of Technology, Coimbatore - 641004, Tamilnadu, India 2- Assistant Professor (Sr.Gd), Department of Textile Technology, PSG College of Technology, Coimbatore - 641004,Tamilnadu, India [email protected] doi:10.6088/ijes.00202010032 ABSTRACT Textile industry is one of the most important and rapidly developing industrial sectors. It has a high importance in terms of its environmental impact, since it consumes considerably high amount of water and produces highly polluted discharge water in large amount. In this study, the pollution assessment was performed in various parts of denim processing textile wastewater in three steps. In the first step the wastewater samples were collected from the Denim processing industry. The pollution load was analysed in terms of Chemical Oxygen Demand (COD), pH, Conductivity, Total Dissolved Solid (TDS) as per standards. Higher Organic content in the Mercerizer effluent was identified which is due to the acidic nature of Neutralizing agents. As a second step, ANOVA and correlation coefficient analysis were performed to identify the significant differences, correlation between the properties of effluent respectively. In the final step the reductions in pollution load were achieved by applying suitable pollution prevention strategies. Keywords: Textile wastewater, pH, conductivity, COD, TDS, Pollution prevention 1. Introduction Amongst the top foreign exchange earning industries for India (Naik, 2001). The textile units are scattered all over India. The textile industry involves processing or converting raw material into finished cloth employing various operations. It consumes large quantities of water and produces polluted waste effluents (Karthikeyan et al, 1999). Water is used extensively throughout textile processing operations. Almost all dyes, specialty chemicals, and finishing chemicals are applied to textile substrates from water baths. In addition, most fabric preparation steps, including desizing, scouring, bleaching, and mercerizing, use aqueous systems. The amount of water used varies widely in the industry, depending on the specific processes operated at the mill, the equipment used. Typically 0.2–0.5 m 3 of water are needed to produce 1 kg of finished product (Marcucci et al, 2001). Reducing water consumption in textile processing is important aspect of pollution prevention efforts; the excess water uses dilutes pollutants and add to the effluent load. Interest in ecologically friendly, wet-processing textile techniques has increased in recent years because of increased awareness of environmental issues throughout the world. Consumers in developed countries are demanding biodegradable and ecologically friendly textiles (Chavan, 2001)
Transcript of Analysis of causes for high organic and inorganic pollution in … · 2017-12-12 · Analysis of...

INTERNATIONAL JOURNAL OF ENVIRONMENTAL SCIENCES Volume 2, No 1, 2011
© Copyright 2010 All rights reserved Integrated Publishing Association
Research article ISSN 0976 – 4402
Received on June 2011 Published on September 2011 315
Analysis of causes for high organic and inorganic pollution in denim
processing effluent Rathinamoorthy. R
1, Senthilkumar. P
2
1-Assistant Professor, Department of Fashion Technology, PSG College of Technology,
Coimbatore - 641004, Tamilnadu, India
2- Assistant Professor (Sr.Gd), Department of Textile Technology, PSG College of
Technology, Coimbatore - 641004,Tamilnadu, India
doi:10.6088/ijes.00202010032
ABSTRACT
Textile industry is one of the most important and rapidly developing industrial sectors. It has
a high importance in terms of its environmental impact, since it consumes considerably high
amount of water and produces highly polluted discharge water in large amount. In this study,
the pollution assessment was performed in various parts of denim processing textile
wastewater in three steps. In the first step the wastewater samples were collected from the
Denim processing industry. The pollution load was analysed in terms of Chemical Oxygen
Demand (COD), pH, Conductivity, Total Dissolved Solid (TDS) as per standards. Higher
Organic content in the Mercerizer effluent was identified which is due to the acidic nature of
Neutralizing agents. As a second step, ANOVA and correlation coefficient analysis were
performed to identify the significant differences, correlation between the properties of
effluent respectively. In the final step the reductions in pollution load were achieved by
applying suitable pollution prevention strategies.
Keywords: Textile wastewater, pH, conductivity, COD, TDS, Pollution prevention
1. Introduction
Amongst the top foreign exchange earning industries for India (Naik, 2001). The textile units
are scattered all over India. The textile industry involves processing or converting raw
material into finished cloth employing various operations. It consumes large quantities of
water and produces polluted waste effluents (Karthikeyan et al, 1999). Water is used
extensively throughout textile processing operations. Almost all dyes, specialty chemicals,
and finishing chemicals are applied to textile substrates from water baths. In addition, most
fabric preparation steps, including desizing, scouring, bleaching, and mercerizing, use
aqueous systems. The amount of water used varies widely in the industry, depending on the
specific processes operated at the mill, the equipment used. Typically 0.2–0.5 m3 of water are
needed to produce 1 kg of finished product (Marcucci et al, 2001).
Reducing water consumption in textile processing is important aspect of pollution prevention
efforts; the excess water uses dilutes pollutants and add to the effluent load. Interest in
ecologically friendly, wet-processing textile techniques has increased in recent years because
of increased awareness of environmental issues throughout the world. Consumers in
developed countries are demanding biodegradable and ecologically friendly textiles (Chavan,
2001)

Analysis of causes for high organic and inorganic pollution in denim processing effluent
Rathinamoorthy. R, Senthilkumar. P
International Journal of Environmental Sciences Volume 2 No.1, 2011 316
Due to the high water consumption in the textile industry it is essential to study its reuse.
Many processes have been studied to treat textile wastewaters (Balcioglu, 2001; Kent, 1974).
Because of the hazards associated with the large amounts of textile wastewater, several
studies were conducted worldwide resulting in a number of treatment techniques for this
wastewater. The complexity of these techniques depends, to a large extent, on the intended
fate of the treated water and the environmental laws of the country in which it exist
(Vandevivere et al, 1998; Tunay, et al, 1996; Slokar et al, 1998; Rott et al, 1999). The main
challenge for the textile industry today is to modify production methods, so they are more
ecologically friendly at a competitive price, by using safer dyes and chemicals and by
reducing cost of effluent treatment/disposal. Recycling has become a necessary element, not
because of the shortage of any item, but because of the need to control pollution (Ramesh
Babu et al, 2007). Textiles generally go through three or four stages of production that may
include yarn formation, fabric formation, wet processing, and textile fabrication.
This study was carried out in the finishing department of denim processing machines like
Mercerizer, Desizer and Finishing machines. From the each machine the effluents were
collected in all its outlets then those effluents were analyzed to identify the amount of
pollutants produced each part of the machine. In all the samples the pollutants were measured
by Chemical Oxygen Demand, pH, Conductivity, Total Dissolved Solid method. The aim of
this study is to identify the causes for high organic and inorganic load in the effluents, which
are generated from the finishing department machines and chemicals. Further from this
experimental study the reason for the causes of high pollution in each and every machine
effluent were identified.
2. Materials and Method
The first step in a pollution prevention strategy for water is a thorough audit and
characterization of wastewater from textile operations (Wood et al, 1992). In this study the
effluent were collected to identify the pollution level in the each finishing machine. The most
important parameters in wastewater from textile industry are COD (Chemical Oxygen
Demand), BOD5 (Biological Oxygen Demand), pH, fats, oil, nitrogen, phosphorus, sulphate,
Dissolved solids and SS (Suspended Solids) (Tufekci et al, 1998), all these parameters were
analyzed in this study. The test result values are average of at least 10 samples per machine
and taken at arbitrary times.
2.1 Desizing
After the fabric (Denim) formation different feels were imported to the fabric by pre
treatments and by adding different finishes. The presence of sizing ingredients in the fabric
hinders processes, such as dyeing, printing, and finishing. For example, the presence of starch
can hinder the penetration of the dye into the fiber, which necessitates removal of starch prior
to dyeing or printing (Batra et al, 1985). Before the finishing process the desizing process
were carried out to develop the proper penetration of the finishing chemicals.
The line diagram of Desizer is shown in Figure 1. In Desizer the effluent from the Closed
Washer Tank (CWT) 1- 4 and Open Tank chemicals where drained down the common out let,
which was piped to Effluent Treatment Plant (ETP). During this study the effluent were
collected in its each outlet separately as shown in Figure 1.

Analysis of causes for high organic and inorganic pollution in denim processing effluent
Rathinamoorthy. R, Senthilkumar. P
International Journal of Environmental Sciences Volume 2 No.1, 2011 317
Figure 1: Desizing effluent outlets
Figure 2: Mercerizer Effluent Outlets
2.2 Mercerizer
The line diagram of the continuous mercerizing machine was given in Figure 2. The samples
were collected from each outlet as shown in Figure 2. The effluent from steamer and open
tank contain high percentage of caustic, so these effluents were directly taken to caustic
recovery plant (CRP), other effluents are directly passed to effluent treatment plant as in
Figure 2.
2.3 Finishing machines
In finishing department there are three different machines are available with different make.
By using these machinery there are different kind of finishing are applied to the fabric like
Flat (Desize-Mercerization-Finishing), Semi flat (Mercerization - Finishing), Normal
(Singing - Finishing), Resin finish etc. Depending upon the finish the recipe and chemicals
will alter. From these machineries the sample were collected from its final drain point.
2.4 Pollution testing methods
The collected sample from finishing department was taken to the testing laboratory and the
analysis was made to identify the pollution level of each machine. Wastewater samples of
each outlet of each machine were taken and analyzed for Chemical oxygen demand (COD),
Total dissolved solids (TDS), pH and Conductivity levels. All the analyses were performed
according to Standard Methods for the Examination of Water and Wastewater15
. The methods
and procedure were discussed below.

Analysis of causes for high organic and inorganic pollution in denim processing effluent
Rathinamoorthy. R, Senthilkumar. P
International Journal of Environmental Sciences Volume 2 No.1, 2011 318
2.5 pH measurement
The homogeneously mixed final sample was collected for testing of pH. The pH was
measured using a Fisher, Accumet pH meter, model 610A. The pH meter was calibrated with
pH 7 and pH 4 buffers before the pH of samples was measured according to Standard
Methods for the Examination of Water and Wastewater (Lenore et al, 1996).
2.6 Total Dissolved Solid Measurement
Total dissolved solids (TDS) were measured by evaporation drying method according to
Section C of Standard Methods for the Examination of Water and Wastewater15
. A measured
amount of sample was pipetted onto a glass microfiber filter with a pore size 1.5 μm and
dried at 103o C for 1 hour. Before weighing, the samples were placed in a desiccator and
allowed to cool for 10 -15 min.
2.8 Conductivity Measurement
The homogeneously mixed final sample was collected for testing of conductivity. The
conductivity was measured using a Deluxe pH meter, model no 100. The conductivity meter
was calibrated with different conductivity level with standard solution before the
Conductivity of samples was measured according to Standard Methods for the Examination
of Water and Wastewater (Lenore et al, 1996).
2.9 Chemical Oxygen demand (COD) measurement
The COD of the samples was determined after making proper dilutions. The closed reflux,
titrimetric method was used. The digestion period was two hours. A description of the
method can be found in Standard Methods for the Examination of Water and Wastewater
(Lenore et al, 1996) and also in United States Environmental Protection Agency Methods for
Chemical Analysis of Water and Wastes (United States Environmental Protection Agency,
1979).
2.10 Statistical analysis
To identify the significance between pollution levels in difference operation of the machine
the statistical analysis were performed using ANOVA (Analysis of variance). Further to
confirm the differences, the Tukey HSD Test and Tukey B Tests were performed.
The correlation between variables was achieved by correlation co efficient value.
3. Result and discussion
During this study the effluents were collected from the each out let of the machine and the
detailed experimental work on the pollutant values like pH, Conductivity, COD and TDS
were conducted and discussed as follows.
3.1. Desizer
The tests were carried out to identify the pollutants values at each outlet point of the machine.
The results were analyzed as follows.
Analysis of causes for high organic and inorganic pollution in denim processing effluent
Rathinamoorthy. R, Senthilkumar. P
International Journal of Environmental Sciences Volume 2 No.1, 2011 319
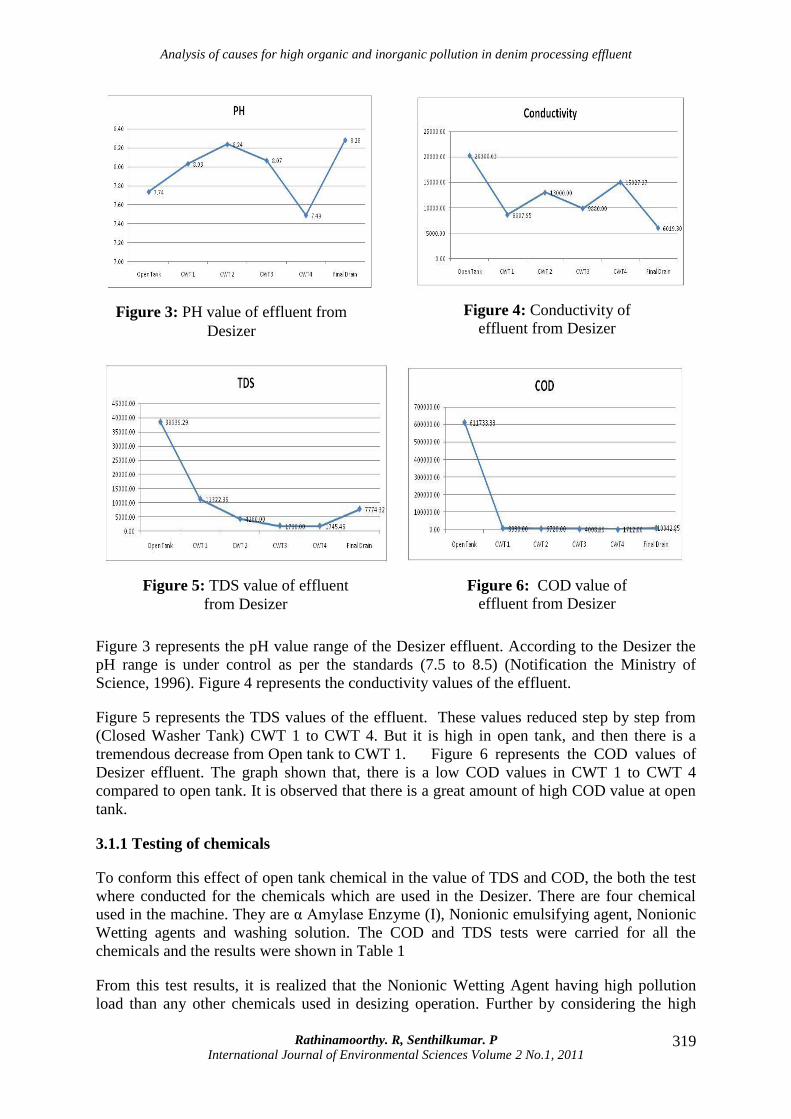
Figure 3 represents the pH value range of the Desizer effluent. According to the Desizer the
pH range is under control as per the standards (7.5 to 8.5) (Notification the Ministry of
Science, 1996). Figure 4 represents the conductivity values of the effluent.
Figure 5 represents the TDS values of the effluent. These values reduced step by step from
(Closed Washer Tank) CWT 1 to CWT 4. But it is high in open tank, and then there is a
tremendous decrease from Open tank to CWT 1. Figure 6 represents the COD values of
Desizer effluent. The graph shown that, there is a low COD values in CWT 1 to CWT 4
compared to open tank. It is observed that there is a great amount of high COD value at open
tank.
3.1.1 Testing of chemicals
To conform this effect of open tank chemical in the value of TDS and COD, the both the test
where conducted for the chemicals which are used in the Desizer. There are four chemical
used in the machine. They are α Amylase Enzyme (I), Nonionic emulsifying agent, Nonionic
Wetting agents and washing solution. The COD and TDS tests were carried for all the
chemicals and the results were shown in Table 1
From this test results, it is realized that the Nonionic Wetting Agent having high pollution
load than any other chemicals used in desizing operation. Further by considering the high
Figure 3: PH value of effluent from
Desizer
Figure 4: Conductivity of
effluent from Desizer
Figure 5: TDS value of effluent
from Desizer
Figure 6: COD value of
effluent from Desizer

Analysis of causes for high organic and inorganic pollution in denim processing effluent
Rathinamoorthy. R, Senthilkumar. P
International Journal of Environmental Sciences Volume 2 No.1, 2011 320
usage of Nonionic Wetting Agent, it is identified as the main reason for the both COD and
TDS values in the Desizer effluent. Further Nonionic emulsifying Agent plays the secondary
role in generation of COD.
Table 1: COD and TDS value of open tank chemicals
Sample ( At available
concentration) TDS in mg/l COD in mg/l
Usage in Kg
(Total
consumption for a
month)
Nonionic emulsifying Agent 200000 1464000 951
Nonionic Wetting Agent 900000 1720000 970
Washing Improving agent 600 15200 317
α Amylase Enzyme 417300 468000 1536
3.1.2 Application of Pollution Reduction Strategies
3.1.2.1 Substitution of low pollution load chemicals
In desizing Nonionic wetting agents and Nonionic emulsifying agent are used together, which
increases the pollution load in final desizing effluent. Instead of that another one wetting
agent was suggested from different manufacturer with low pollution level. The study results
was shown below
Figure 7: Wetting agent COD and TDS level
Further the α Amylase Enzyme (I) which currently in use was suggested to replace with
another α Amylase Enzyme (II) with different manufacturer, which having low TDS and
COD value. Figure 8 shows the pollution values.

Analysis of causes for high organic and inorganic pollution in denim processing effluent
Rathinamoorthy. R, Senthilkumar. P
International Journal of Environmental Sciences Volume 2 No.1, 2011 321
Figure 8: Enzymes for Desizing
3.2 Mercerizer
The tests were carried out to identify the pollutants values at each outlet point of the mercer
machine. The results were analyzed as follows.
Figure 9: PH value of effluent
from Mercerizer
Figure 10: Conductivity of
effluent from Mercerizer
Figure 11: TDS of effluent from
Mercerizer
Figure 12: COD of effluent
from Mercerizer

Analysis of causes for high organic and inorganic pollution in denim processing effluent
Rathinamoorthy. R, Senthilkumar. P
International Journal of Environmental Sciences Volume 2 No.1, 2011 322
Figure 9 represents the pH value range of the Mercer effluent. The effluent which obtained
from the CWT 1 was high alkaline nature. The pH value around 11.8, but the value reduced
step by step for the subsequent washes. At CWT 4 there is a great reduction of the pH value
due to the addition of acid for neutralization purpose. Further this avoids indigo back staining
on the fabric. Figure 10 represents the conductivity values of the effluent this value reduced
step by step from CWT 1 to CWT 4. The reduction in TDS value ultimately takes care of
conductivity. Figure 10 represents the TDS values of the effluent. These values reduced step
by step from CWT 1 to CWT 4. This can be understood from the figure. Figure 12 represents
the COD values of Mercer effluent. The graph shown that, there is a low COD values in
CWT 1 to CWT 3. But it is observed that there is a great increase in the COD value at CWT 4.
3.2.1 Testing of chemicals
To conform the effect of chemical in the value of TDS and COD of final effluent, the both
the test where conducted for the chemicals which are used in the Mercerizer. There are three
chemical used in the machine. They are. Pure Caustic solution, Washing improving agent
(Green pol), Neutralizing agent (Green Acid). The COD and TDS tests were carried for all
the chemicals and the results were shown in Table 2.
Table 2: Mercer chemical Pollution level
Sample ( At available
concentration)
TDS in
mg/l
COD in
mg/l
Usage in Kg
(Total consumption for a
month)
Neutralizing agent 3400 43600 10300
Washing improving agent 600 15200 430
Caustic solution 755000 26800 118200
The experimental results were shown in Figure 7-10. From the test it is confirmed that the
acidic nature of the neutralizing agent is the main causes for high COD value in the mercer
effluent. Table 5 shows that Neutralizing agent has the high amount of chemical oxygen
demand than any other chemical used in Mercerization. Further it is also identified from
Table 5; the caustic solution is the main reason for high TDS in the output values.
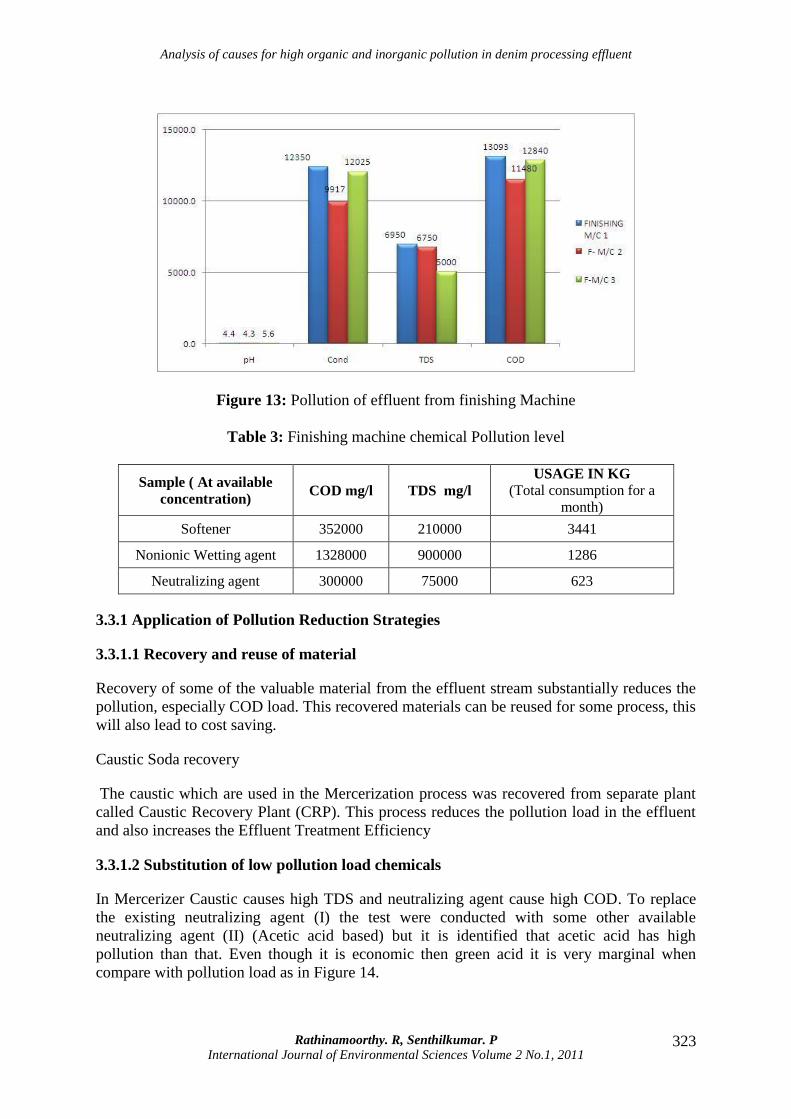
3.3 Finishing Machines
The effluent from final effluent out let of the machine was collected from each finishing
machine. Then the experiment was carried out to identify the pollution level of the effluent. It
was shown in Figure 13. In finishing machine the most commonly used chemicals are
Softener, wetting agents, neutralizing agent and fastness improver. The results of these
chemicals are shown in Table 3.
From the Figure 13 the pH values for the finishing machine are in the range of 4.5 – 5.6. The
conductivity values of the final drain effluent were around 12000. The TDS and COD values
of the final effluent also noticed high then the standards (Notification the Ministry of Science,
1996). The experimental results were shown in Table 6. From the results it is identified that
Nonionic wetting agent is the chemical which posses high COD and TDS value. Even though
softener used large quantity than Nonionic wetting agent, the pollution load is low for
softener. It is noted that Nonionic Wetting agent is the reason for the high pollution value in
the finishing machine effluent.
Analysis of causes for high organic and inorganic pollution in denim processing effluent
Rathinamoorthy. R, Senthilkumar. P
International Journal of Environmental Sciences Volume 2 No.1, 2011 323
Figure 13: Pollution of effluent from finishing Machine
Table 3: Finishing machine chemical Pollution level
Sample ( At available
concentration) COD mg/l TDS mg/l
USAGE IN KG
(Total consumption for a
month)
Softener 352000 210000 3441
Nonionic Wetting agent 1328000 900000 1286
Neutralizing agent 300000 75000 623
3.3.1 Application of Pollution Reduction Strategies
3.3.1.1 Recovery and reuse of material
Recovery of some of the valuable material from the effluent stream substantially reduces the
pollution, especially COD load. This recovered materials can be reused for some process, this
will also lead to cost saving.
Caustic Soda recovery
The caustic which are used in the Mercerization process was recovered from separate plant
called Caustic Recovery Plant (CRP). This process reduces the pollution load in the effluent
and also increases the Effluent Treatment Efficiency
3.3.1.2 Substitution of low pollution load chemicals
In Mercerizer Caustic causes high TDS and neutralizing agent cause high COD. To replace
the existing neutralizing agent (I) the test were conducted with some other available
neutralizing agent (II) (Acetic acid based) but it is identified that acetic acid has high
pollution than that. Even though it is economic then green acid it is very marginal when
compare with pollution load as in Figure 14.

Analysis of causes for high organic and inorganic pollution in denim processing effluent
Rathinamoorthy. R, Senthilkumar. P
International Journal of Environmental Sciences Volume 2 No.1, 2011 324
Figure14: Green Acid and Acetic acid Comparison
3.3.2 Process changes
To reduce the organic load in the final effluent some specific process changes are
recommended in particular machines.
Figure 15: COD Values based on alkalinity
1. In Mercerizer the acid is used for the neutralizing purpose. In washer tank 4 the
pH value maintained around 2 (To maintain the final output fabric pH).
2. Higher the acidic nature causes high COD value so it is recommended to maintain
in the range of 4- 5. To identify this test were carried out at different pH level and
the result was shown above. It conforms that the organic content increases in the
effluent when the acidic nature developed in the effluent, which is represented in
Figure 15.
3. Further the effluent from washer tank 1 (in case of Mercer) also having high
caustic content which leads high TDS value in final effluent. To avoid this, the
Effluent from washer tank 1 also recommended passing to CRP (Caustic
Recovery Plant).

Analysis of causes for high organic and inorganic pollution in denim processing effluent
Rathinamoorthy. R, Senthilkumar. P
International Journal of Environmental Sciences Volume 2 No.1, 2011 325
3.3.3 Waste segregation
The effluents from the different part of the industry are segregated based on its pollution load
and the concentration. The effluents which are segregated are
1. Effluent from Dyeing Department
2. Effluent from Pre treatment like Desizing and Mercerizing
3. Effluent from finishing machines
3.3.3.1 Economy in water use
If lower quantities of water are used for processing, lesser quantities of effluent only would
be generated. To avoid the excess usage of water the following procedures are followed.
1. Modulated water use depending upon the throughput material.
2. Reuse of treated and cooling waters where ever possible
3. Good maintenance practices of machines.
4. Use of automatic water controls where ever possible
3.4 Statistical result
From the ANOVA results it was identified that there is no significant different between the
variables within the machine. Further the correlation value was obtained. The results were
shown in Table 4 and 5.
Table 4: Correlation analysis between variables of different operation
Machine Variables Equation Correlation co-efficient
"r"
Mercerizer pH Vs COD 13526-835.2X -0.87
TDS Vs Conductivity 3.463X - 14820 0.98
Desizer TDS Vs Conductivity 0.752x - 4670 0.84
COD Vs TDS 1.034X - 1119 0.86
Finishing COD Vs TDS 2.26X-1148 0.94
pH Vs COD 124334-25225X -0.98
Table 5: ANOVA results for pollutants
Source of Variation d.f. SS MS F p-level
Between Groups 4 134.7145 33.6786 2.0389 0.105
Within Groups 45 743.3172 16.5182
Total 49 878.0317
It shows that the pH and COD have negative correlation. In the same way the TDS Vs
Conductivity and COD Vs TDS were performed. These results strengthen the experimental
results directly. The results indicates that in case of pH vs COD, the decrease in the pH
values (more the acidic nature) leads to the high COD values. It is noted from the Figure 9
and Figure 12. In Figure 9 at washer tank 4 the pH value is 3.99 at that time the COD value is

Analysis of causes for high organic and inorganic pollution in denim processing effluent
Rathinamoorthy. R, Senthilkumar. P
International Journal of Environmental Sciences Volume 2 No.1, 2011 326
around ten thousand, but in the same time at washer tank 3 the pH value is 10.81 at that place
the COD value around 2800.
Where in the case TDS vs Conductivity, they are directly related, When the dissolved solid
content increases the conductivity also increases (around 84%), this can be understand from
Figure 10, 11 and 4, 5. as stated by statistical result. At TDS vs. COD the correlation is
around 86%, the influence of dissolved solid also increases COD value.
4. Summary
In this study, the pollution level of denim processing industry was analysed using the
effluents from the different machines. The result shows that the Nonionic Wetting agent is
responsible for high COD and TDS value in effluent from Desizer, compared with other
chemicals. Acid, which is used as neutralizing agents, causes high COD value and Caustic
causes high TDS in the final effluent. Hence, it is suggested to maintain the water pH level
around 4 to 5 at the closed washer tank 4 and to bypass the effluent from closed washer tank
1 to Caustic recovery, which reduces the pollution level in the mercer effluent. Commonly in
all finishing machines, Nonionic wetting agent is identified as high polluted chemical than
others, which causes high COD and TDS value in finishing effluent. ANOVA and correlation
coefficient analysis confirms the inter-relationship between the various pollutants is
significant.
Acknowledgement
The authors are thankful to the Head of the department, Mr. Nitin Shrivastava and Mr.
Pramod Dubey, Raymond UCO Denim Pvt. Ltd. Yavatmal, India, for rendering his
continuous support throughout the study. The authors are also thankful to Dr. G.Thilagavathi,
Head, Department of Textile Technology, PSG College of Technology for generous consent
to execute this study.
5. References
1. Balcioglu, I.A. and Arslan I. (2001), partial oxidation of reactive dyestuffs and
synthetic textile dye-bath by the O3 and O3/H2O2 processes, Water Sci. Technol.
43(2); pp 221–228.
2. Batra, S.H. (1985), other long vegetable fibers: abaca, banana, sisal, henequen,
flax, ramie, hemp, sunn, and coir., In M. Lewin and E.M. Pearce (ed.). Handbook
of fiber science and technology. Vol. IV, Fiber Chemistry. Marcel Dekker, New
York. pp. 15-22.
3. Chavan, R.B. (2001), environment-friendly dyeing processes for cotton. Ind. J.
Fibre Textile Res. 4. Pp 239-242.
4. Karthikeyan, J. and Venkata Mohan, S. (1999), Color Pollution Control in Textile
Industry Effluents: a Review. Advances in Industrial Pollution Control, Techno
Science Publications, pp 250–25.
5. Kent, J. (1974), Riegel’s handbook of industrial chemistry, 7th edition. Van
Nostrand Reinhold, NewYork, N.Y. pp 676–717.

Analysis of causes for high organic and inorganic pollution in denim processing effluent
Rathinamoorthy. R, Senthilkumar. P
International Journal of Environmental Sciences Volume 2 No.1, 2011 327
6. Lenore S. Clescerl, Arnold E. Greenberg, Andrew D. Eaton. (1999), standard
Methods for Examination of Water & Wastewater (20th ed). Washington, DC:
American Public Health Association. ISBN 0-87553-235-7.
7. Marcucci M., Nosenzo G., Capanelli G., Ciabatti I., Corrieri D and Ciardelli G.,
(2001), treatment and reuse of textile effluents based on new ultrafiltration and
other membrane technologies, Desalination, 138, pp 75– 82.
8. Naik, M.A. (2001), effluent treatment for textile industry. Environmental
Pollution Control Journal. 4 (6), pp 56-60.
9. Notification the Ministry of Science, Technology and Environment. (1996). No. 3,
B.E.2539, issued under the Enhancement and Conservation of the National
Environmental Quality Act B.E.25 35, Vol. 113 Part 13 D, dated February 13,
B.E.2539.
10. Ramesh Babu B., Parande A.K., Raghu S., and Prem Kumar T. (2007), cotton
Textile Processing: Waste Generation and Effluent Treatment, The Journal of
Cotton Science 11: pp 141–153.
11. Rott, U., and Minke, R. (1999), overview of wastewater treatment and recycling in
the textile processing industry. Water Sci. Technol. 40(1), pp 137–144.
12. Slokar, Y.M., and Le Marechal, A.M. (1998), methods of decoloration of textile
wastewaters. Dye. Pigm. 37(4), pp 335–356.
13. Tufekci, N., San, H.A., Aydın, S., Ucar, S. and Barlas, H. (1998), wastewater
Treatment Problems in the Operation of Woven and Knit Fabric Industry, pp 795-
802.
14. Tunay, O., Kabdasli, I., Eremektar, G., and Orhon, D. (1996), color removal from
textile wastewaters. Water Sci. Technol. 34(11), pp 9– 16.
15. United States Environmental Protection Agency. (1979), methods for Chemical
Analysis of Water and Wastes. 1974 editorial revision. Method 405.1
16. Vandevivere, P.C., Bianchi, R., and Verstraete, W. (1998), treatment and reuse of
wastewater from the textile wet processing industry: review of emerging
technologies, J. Chem.Technol. Biotechnol. 72. pp 289–302.
17. Wood, K.N. and Bishop, A.L. (1992), effluent guidelines compliance through
waste minimization, Water Sci. Tech., 26(1-2). pp 301-307.