Analysis of Big Data - University of California, Berkeleyblfang/notes/notes... · 2018-02-02 ·...
41
Analysis of Big Data Billy Fang Instructor: Prof. Han Liu Spring 2015 The following are notes for a course taught by Prof. Han Liu. Any errors are my own. Contents 1 Theoretical foundation 2 1.1 Statistical models and parameter spaces .............................. 2 1.2 Limit theorems ............................................ 2 1.3 Estimation theory .......................................... 2 1.4 Likelihood-based estimation ..................................... 3 1.5 Likelihood-based model selection .................................. 5 1.6 Sufficient statistics .......................................... 7 2 Predictive analysis (supervised learning) 10 2.1 Regression ............................................... 10 2.2 High-dimensional data analysis ................................... 12 2.3 Classification and discriminant analysis .............................. 16 3 Generalized linear models 25 4 Exploratory analysis (unsupervised learning) 29 4.1 Graphical models ........................................... 29 4.2 Clustering, mixture models, and latent variable models ...................... 31 4.3 K-means algorithm .......................................... 38 4.4 Extensions ............................................... 40
Transcript of Analysis of Big Data - University of California, Berkeleyblfang/notes/notes... · 2018-02-02 ·...

Analysis of Big Data
Billy FangInstructor: Prof. Han Liu
Spring 2015
The following are notes for a course taught by Prof. Han Liu. Any errors are my own.
Contents
1 Theoretical foundation 21.1 Statistical models and parameter spaces . . . . . . . . . . . . . . . . . . . . . . . . . . . . . . 21.2 Limit theorems . . . . . . . . . . . . . . . . . . . . . . . . . . . . . . . . . . . . . . . . . . . . 21.3 Estimation theory . . . . . . . . . . . . . . . . . . . . . . . . . . . . . . . . . . . . . . . . . . 21.4 Likelihood-based estimation . . . . . . . . . . . . . . . . . . . . . . . . . . . . . . . . . . . . . 31.5 Likelihood-based model selection . . . . . . . . . . . . . . . . . . . . . . . . . . . . . . . . . . 51.6 Sufficient statistics . . . . . . . . . . . . . . . . . . . . . . . . . . . . . . . . . . . . . . . . . . 7
2 Predictive analysis (supervised learning) 102.1 Regression . . . . . . . . . . . . . . . . . . . . . . . . . . . . . . . . . . . . . . . . . . . . . . . 102.2 High-dimensional data analysis . . . . . . . . . . . . . . . . . . . . . . . . . . . . . . . . . . . 122.3 Classification and discriminant analysis . . . . . . . . . . . . . . . . . . . . . . . . . . . . . . 16
3 Generalized linear models 25
4 Exploratory analysis (unsupervised learning) 294.1 Graphical models . . . . . . . . . . . . . . . . . . . . . . . . . . . . . . . . . . . . . . . . . . . 294.2 Clustering, mixture models, and latent variable models . . . . . . . . . . . . . . . . . . . . . . 314.3 K-means algorithm . . . . . . . . . . . . . . . . . . . . . . . . . . . . . . . . . . . . . . . . . . 384.4 Extensions . . . . . . . . . . . . . . . . . . . . . . . . . . . . . . . . . . . . . . . . . . . . . . . 40

Introduction
We would like to analyze data that is massive, high-dimensional, and/or complex.
Perspective Machine learning Statistics
Foundation Concentration principle (LLN) Likelihood principleApproach risk minimization (model-free) maximum likelihood estimation (model-
based)Goal prediction, generalization consistency, model selection, understand-
ing/explaining
Definition 0.1 (General principles). The following are rough descriptions of three important principles.
1. Likelihood principle. Everything is model-based. This allows us to derive theory, such as asymptotictheory. It also provides the sufficiency principle (data reduction) which helps cope with massive data.
2. Concentration principle. We assume that data are noisy signals, and we want to recover the signalgiven the data. This inverse problem can be approached due to the concentration phenomena, which,loosely speaking, states that averaging over many samples gets rid of the noise. See the law of largenumbers (Theorem 1.6).
3. Regularization/parsimony principle. If two explanations are equally good at explaining a phe-nomenon, we prefer the simpler one. We always seek dramatically simplified models to analyze complexdata.
Warning: Many techniques that are good for “big” data may not be good for “small” data, e.g. theNaive Bayes classifier.
Warning: All the simple models that we use are wrong; true models are complex. However, simple modelsmay still be useful for inference, prediction, etc.
1

1 Theoretical foundation
1.1 Statistical models and parameter spaces
Definition 1.1. A statistical model P is a set of probability distributions indexed by a parameter spaceΘ.
P := {pθ : θ ∈ Θ}.
A statistical model is called a parametric model if it can be indexed by a finite-dimensional parameterspace Θ. If no finite-dimensional parameter space can index the model, then it is called a nonparametricmodel.
Example 1.2 (Gaussian model).
P :=
{pµ,σ2(x) :=
1√2πσ2
e−(x−µ)2
2σ2 , µ ∈ R, σ2 > 0
}.
Here, θ = (µ, σ2)> ∈ Θ := R× R+, so this is a parametric model.
Example 1.3 (Sobolev space).
P :=
{p(x) continuous density and
∫p′′(t)2 dt <∞
}.
This is a nonparametric model.
1.2 Limit theorems
Definition 1.4. A sequence of random variables (Xn)n is said to converge in probability to a randomvariable X if for any ε > 0,
limn→∞
P(|Xn −X| > ε) = 0.
We denote this by XnP−→ X.
Definition 1.5. A sequence of random variables (Xn)n (with corresponding cumulative distribution func-tions FXn) is said to converge in distribution to a random variable X (with cdf FX) if for every x atwhich FX is continuous,
limn→∞
FXn(x) = FX(x).
We denote this XnD−→ X.
Theorem 1.6 ([Weak] Law of Large Numbers). If X1, . . . , Xn are i.i.d. random variables with expectationµ, then
Xn :=1
n
n∑i=1
XiP−→ E[Xi] =: µ as n→∞.
Theorem 1.7 (Central Limit Theorem). If X1, . . . , Xn are i.i.d. random variables with expectation µ andvariance σ2, then
√n
(Xn − µ
σ
)D−→ N (0, 1) as n→∞.
1.3 Estimation theory
Definition 1.8. In point estimation of a parameter, we are given i.i.d. random variables X1, . . . , Xn
that follow a distribution pθ, and want to find a single best guess (estimate) for θ. An estimator is arule for computing an estimate, given random samples X1, . . . , Xn. We treat the estimator as a function ofX1, . . . , Xn (so it is a random variable), and denote it θn. We sometimes also let “estimator” refer to the
sequence (θn)n as well.
2

Definition 1.9.
• An estimator (θn)n is consistent if θnP−→ θ.
• An estimator (θn)n is unbiased if E[θn] = θ for all n. Otherwise, the bias of an estimator is E[θn]−θ.
Proposition 1.10. Neither consistency nor unbiasedness imply each other.
Proof. Let X1, . . . , Xn be i.i.d. following the distribution N (µ, 1), and consider estimation of µ. Theestimator µn := X1 is unbiased, but not consistent. On the other hand, the estimator µn := 1
n+1
∑ni=1Xi is
consistent, but not unbiased.
P
(∣∣∣∣∣µ− 1
n+ 1
n∑i=1
Xi
∣∣∣∣∣ > ε
)
≤ P
(∣∣∣∣∣n+ 1
nµ− 1
n
n∑i=1
Xi
∣∣∣∣∣ > ε
)
≤ P
(∣∣∣∣∣µ− 1
n
n∑i=1
Xi
∣∣∣∣∣ > ε/2
)for large n such that |µ|/n < ε/2
→ 0. as n→∞
Proposition 1.11. If an estimator (θn)n is consistent1, then limn→∞ E[θn] = θ. For this reason, wesometimes say consistent estimators are asymptotically unbiased.
We will see throughout the rest of the course that unbiasedness does not necessarily make an estimatorgood.
1.4 Likelihood-based estimation
Definition 1.12. The likelihood function of θ with respect to the random sample Xi is
L(Xi, θ) := pθ(Xi).
Although L is a function of Xi and θ, we typically keep Xi fixed and think of it as a function of θ. Nonetheless,it is still a random quantity because Xi is a random variable.
Definition 1.13. The joint likelihood function of θ with respect to the entire set of random samplesX1, . . . , Xn is
Ln(θ) := pθ(X1, . . . , Xn).
Note that this definition involves a general joint distribution of the random samples. In the special casewhere the samples are i.i.d. following distribution pθ, then we have
Ln(θ) =
n∏i=1
pθ(Xi).
Definition 1.14. The joint log-likelihood of θ with respect to X1, . . . , Xn is
`(θ) := log(Ln(θ)).
Again, if the samples are i.i.d., then
`(θ) =
n∑i=1
log(pθ(Xi)).
1Some other conditions are required. A uniform bound on variance of the θn suffices.
3
Because the logarithm is an increasing function,
argmaxθ∈Θ
Ln(θ) = argmaxθ∈Θ
`(θ).
Definition 1.15. If an estimator θ satisfies Ln(θn) ≥ Ln(θ) for any θ ∈ Θ, then we call it a maximumlikelihood estimator (MLE). Note that the MLE may not be unique, but in most cases it will be. If thelikelihood function attains a unique maximum (over θ ∈ Θ), we denote it by
θn := argmaxθ∈Θ
Ln(θ).
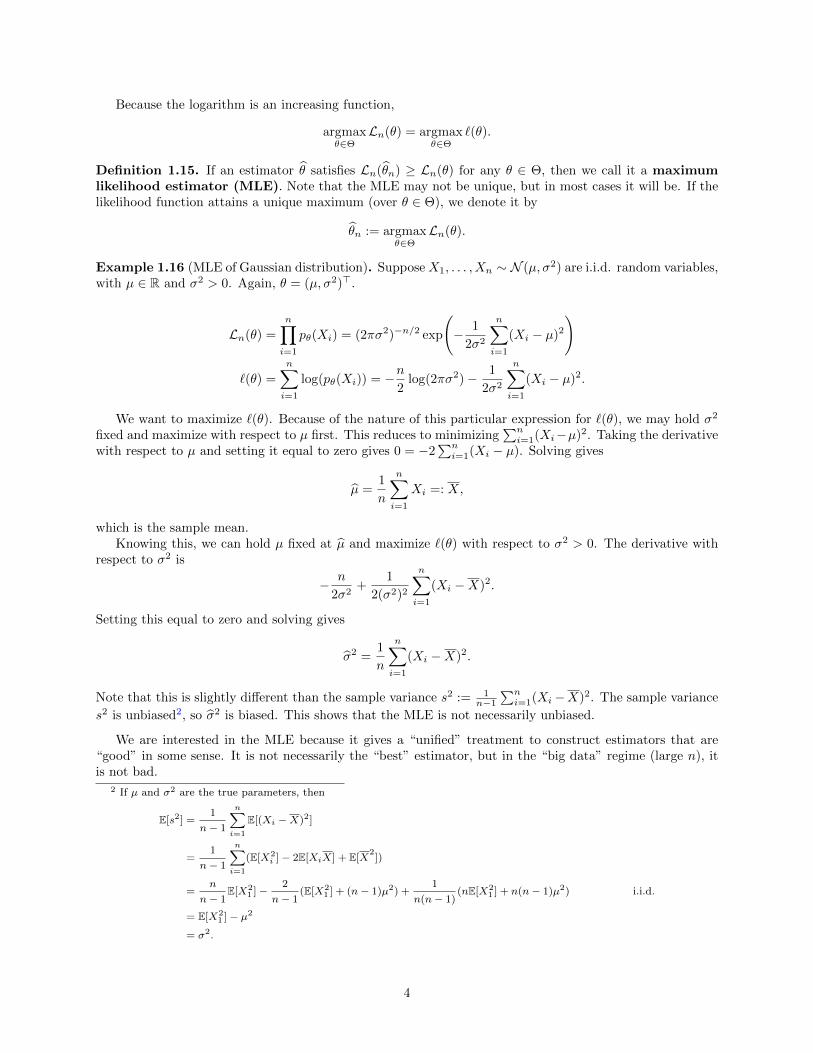
Example 1.16 (MLE of Gaussian distribution). Suppose X1, . . . , Xn ∼ N (µ, σ2) are i.i.d. random variables,with µ ∈ R and σ2 > 0. Again, θ = (µ, σ2)>.
Ln(θ) =
n∏i=1
pθ(Xi) = (2πσ2)−n/2 exp
(− 1
2σ2
n∑i=1
(Xi − µ)2
)
`(θ) =n∑i=1
log(pθ(Xi)) = −n2
log(2πσ2)− 1
2σ2
n∑i=1
(Xi − µ)2.
We want to maximize `(θ). Because of the nature of this particular expression for `(θ), we may hold σ2
fixed and maximize with respect to µ first. This reduces to minimizing∑ni=1(Xi−µ)2. Taking the derivative
with respect to µ and setting it equal to zero gives 0 = −2∑ni=1(Xi − µ). Solving gives
µ =1
n
n∑i=1
Xi =: X,
which is the sample mean.Knowing this, we can hold µ fixed at µ and maximize `(θ) with respect to σ2 > 0. The derivative with
respect to σ2 is
− n
2σ2+
1
2(σ2)2
n∑i=1
(Xi −X)2.
Setting this equal to zero and solving gives
σ2 =1
n
n∑i=1
(Xi −X)2.
Note that this is slightly different than the sample variance s2 := 1n−1
∑ni=1(Xi−X)2. The sample variance
s2 is unbiased2, so σ2 is biased. This shows that the MLE is not necessarily unbiased.
We are interested in the MLE because it gives a “unified” treatment to construct estimators that are“good” in some sense. It is not necessarily the “best” estimator, but in the “big data” regime (large n), itis not bad.
2 If µ and σ2 are the true parameters, then
E[s2] =1
n− 1
n∑i=1
E[(Xi −X)2]
=1
n− 1
n∑i=1
(E[X2i ]− 2E[XiX] + E[X
2])
=n
n− 1E[X2
1 ]−2
n− 1(E[X2
1 ] + (n− 1)µ2) +1
n(n− 1)(nE[X2
1 ] + n(n− 1)µ2) i.i.d.
= E[X21 ]− µ2
= σ2.
4

Definition 1.17. Given a statistical model {pθ : θ ∈ Θ} indexed by θ such that log pθ(x) is twice differen-tiable with respect to θ, the Fisher information is defined by
I(θ) := −Eθ[∂2
∂θ2log pθ(X)
]= −
∫ (∂2
∂θ2log pθ(x)
)pθ(x) dx .
One can think of the Fisher information as the “expected curvature” of log pθ(X). As we can see below,a higher curvature corresponds with higher confidence that we have maximized log pθ(X), which results ina lower variance in the limiting distribution.
Theorem 1.18 (Asymptotic normality of MLE). Let θ be the true parameter. Under certain conditions,3
the MLE is asymptotically normal, i.e.,
√n(θMLE
n − θ) D−→ N(
0,1
I(θ)
)as n→∞,
where 1/I(θ) denotes the inverse of the matrix I(θ).
In addition, the variance of any unbiased estimator is at least as high as that of the MLE. That is, if θ
is an unbiased estimator, then in general we will have√n(θn − θ)
D−→ N (0,Γ) as n→∞ for some Γ; thenΓ ≥ 1/I(θ).
When applying this theorem, we often use I(θ) or I(θ) in place of I(θ), since θ is unknown.
I(θn) = − Eθ[∂2
∂θ2log pθ(X)
]∣∣∣∣θ=θn
I(θ) = − 1
n
n∑i=1
[∂2
∂θ2log pθ(Xi)
]∣∣∣∣θ=θn
1.5 Likelihood-based model selection
Suppose we have i.i.d. random variables X1, . . . , Xn that follow a completely unknown distribution.Assume we have K candidate models
M1 := {p(1)θ1
(x)}...
MK := {p(K)θK
(x)}.
For example,M1 could be a family of Gaussian distributions,M2 could be a family of Poisson distributions,and so on. Our goal is to choose the model that “best” fits the data (even though it is possible that none ofthe models are “correct”).
Definition 1.19 (Akaike Information Criterion (AIC)). The AIC score for model Mk is
AIC(k) = −2 log p(k)
θk(X1, . . . , Xn) + 2dk,
where θk is the MLE under modelMk, and dk is the number of “free parameters” inMk. The AIC criterionselects the model with the lowest AIC score.
The first term in the AIC score rewards the fitness of the model, while the second term penalizes thecomplexity of the model. It turns out that the AIC criterion chooses the model that minimizes the Kullback-Leibler divergence with respect to the true joint density.
3The certain conditions are that I(θ) > 0 for all θ, and that the first derivative I′(θ) is continuous.
5

Definition 1.20. If f and g are densities, the Kullback-Leibler divergence (KL divergence) of g fromf is defined to be
D(f‖g) :=
∫f(x) log
f(x)
g(x)dx .
We also have D(f‖g) ≥ 0 (Gibb’s inequality, follows from Jensen’s inequality), with equality if and only iff = g. However, the KL divergence is generally not symmetric.
Proposition 1.21. The AIC criterion chooses the model that minimizes D(f∗‖p(k)
θk), where f∗ is the true
density.
Proof sketch.
D(f∗‖p(k)
θk) =
∫f∗(x) log f∗(x) dx−
∫f∗(x) log p
(k)
θk(x) dx
argmink
D(f∗‖p(k)
θk) = argmin
k
[−∫f∗(x) log p
(k)(x)
θkdx
]= argmax
kEf∗ [log p
(k)
θk(X)]︸ ︷︷ ︸
=:J(k)
Let J(k) := 1n
∑ni=1 log p
(k)
θk(Xi). By the law of large numbers (Theorem 1.6), J(k)
P−→ J(k) as n → ∞.
However, J(k) is highly biased because we use the data once to produce the MLE θk, and a second time to
compute J . Akaike proved that the “bias” is approximately dk/n. To correct this, we define
J(k) :=1
n
n∑i=1
log p(k)
θk(Xi)−
dkn
= −AIC(k)
2n.
Unfortunately, AIC requires many assumptions (in Akaike’s proof) and works only for large n.One way to avoid this issue is data splitting, in which we partition the data into two subsets D1 and
D2, get MLEs θ1, . . . , θK based only on D1, and pick the model that minimizes
DS(k) := − 1
|D2|∑i∈D2
log p(k)
θk(Xi).
This setup is unbiased because we do not use the data twice as in the AIC criterion.Going one step farther, we have cross-validation, in which we partition the data into subsets D1, . . . ,DJ .
We define
CVj(k) := − 1
|Dj |∑i∈Dj
log p(k)
θk(Xi),
where θk is the MLE based on D \ Dj . We then choose the model that minimizes
CV(k) :=1
J
J∑i=1
CVj(k).
Definition 1.22 (Bayesian Information Criterion (BIC)). The BIC score for model Mk is
BIC(k) := −2 log p(k)
θk(X1, . . . , Xn) + (log n)dk.
The BIC criterion selects the model with the smallest BIC score.
6

Note that the BIC score is simply the AIC score but with the second factor of 2 replaced by log n. Thisis a harsher penalty on the complexity of a model; in general BIC selects simpler models than AIC does.
The intuition for the BIC comes from the Bayesian approach.
P(Mj | X1:n) =P(X1:n | Mj)P(Mj)
P(X1:n). Bayes’s formula
One example of a prior distribution is the uniform prior P(M1) = · · · = P(MK) = 1K . In this case, the only
relevant term is P(X1:n | Mj).4 It turns out that the BIC score satisfies
2 logP(Mj | X1:n)
P(Mk | X1:n)≈ BIC(k)− BIC(j).
In applications, we use AIC and cross-validation if we care more about prediction, and we use BIC if wecare more about explanation or finding the “true” model. Adding junk features to the model may give AICmore predictive power even though in reality they may not have any real influence.
1.6 Sufficient statistics
Sufficient statistics are an effect approach to deal with massive data.
Definition 1.23. Data reduction is the process of minimizing the amount of data needed to be stored todo inference. There are two types of data reduction.
a) lossless (sufficient statistics, used for large n)
b) lossy (dimensionality reduction, used for large d)
Example 1.24. Let X1, . . . , Xn ∼ N (µ, σ2) be i.i.d., and suppose we want to estimate (µ, σ2). To find theMLE, we only need the first and second moments X := 1
n
∑iXi and 1
n
∑iX
2i , since
µ = X,
σ2 =1
n
∑i
(Xi −X)2 =1
n
∑i
X2i −
2
nX∑i
Xi +X2
=
(1
n
∑i
X2i
)−X2
.
Definition 1.25. A statistic T (X1:n) is a function of the random samples X1:n. A statistic is a sufficientstatistic for the parameter θ if the conditional distribution X1:n | T (X1:n) does not depend on θ.
In some sense, a sufficient statistic T (X1:n) contains all the information about θ that X1:n has. Notethat the trivial statistic T (X1:n) := X1:n is always sufficient.
Note that in the continuous case, we need Radon-Nikodym derivatives to justify using the density func-tions.
Example 1.26. If X1, . . . , Xn ∼ N (µ, 1) be i.i.d., we claim that T (X1:n) := X is sufficient.
4This term is not quite the likelihood; it is actually the expected likelihood.
P(X1:n | Mj) =
∫P(X1:n | θj ,Mj)P(θj | Mj) dPθj .
7

Note that X ∼ N (µ, 1/n).
p(X1:n = x1:n | T (X1:n) = T (x1:n)) =p(X1:n = x1:n, T (X1:n) = T (x1:n))
p(T (X1:n) = T (x1:n))
=p(X1:n = x1:n)
p(T (X1:n) = T (x1:n))
=
∏ni=1 p(Xi = xi)
p(X = x)
=(2π)−n/2 exp
(− 1
2
∑i(xi − µ)2
)√n2π exp
(−n2 (x− µ)2
)=
(2π)−n/2√n2π
exp
(−1
2
∑i
(xi − x)2
),
where the last equality is due to∑i
(xi − µ)2 =∑i
(xi − x+ x− µ)2
=∑i
(xi − x)2 + n(x− µ)2 + 2(x− µ)∑i
(xi − x)
=∑i
(xi − x)2 + n(x− µ)2.
The density function for the conditional distribution does not depend on µ, so X is indeed a sufficientstatistic.
Although the definition gives us a way to verify if something is a sufficient statistic, it does not provide amethod to find sufficient statistics. The following theorem gives an equivalent characterization of sufficientstatistics.
Theorem 1.27 (Fisher-Neyman Factorization Theorem). Let pθ(X1:n) be the joint density/mass functionof random samples X1, . . . , Xn. A statistic T (X1:n) is sufficient for parameter θ if and only if there existfunctions gθ (may depend on θ) and h (free of θ) such that for all empirical realizations x1:n and all θ, wehave
pθ(x1:n) = gθ(T (x1:n)) · h(x1:n).
Proof. We will only prove one direction. Suppose T (X1:n) is sufficient. We define
gθ(t) := pθ(T (X1:n) = t),
h(t) := p(X1:n = x1:n | T (X1:n) = T (x1:n)).
Note that h(t) is free of θ because T (X1:n) is a sufficient statistic. Then,
pθ(X1:n = x1:n) = h(x1:n) · gθ(T (x1:n)).
Example 1.28. Let X1, . . . , Xn ∼ N (µ, 1) be i.i.d., and suppose we are doing inference on µ.
pµ(x1:n) = (2π)−n/2 exp
(−1
2
∑i
(xi − µ)2
)= (2π)−n/2 exp
(−1
2
∑i
(xi − x)2
)︸ ︷︷ ︸
h(x1:n)
exp
(−1
2n(x− µ)2
)︸ ︷︷ ︸
gµ(x)
.
Definition 1.29. A sufficient statistic is minimal if it can be represented as a function of any other sufficientstatistic.
8

Definition 1.30. The sufficiency principle states that a sufficient statistic contains all information fromthe data relevant to inference about θ.
Definition 1.31. The likelihood principle states that the likelihood function contains all informationfrom the data relevant to inference about θ.
Note that the Fisher-Neyman factorization principle shows that if we assume the likelihood principle,then the sufficiency principle follows.
9

2 Predictive analysis (supervised learning)
Predictive analysis techniques analyze current and past data in order to make predictions about thefuture. A rough overview of a typical predictive analysis process is as follows. Given training data(Y1, X1), . . . , (Yn, Xn), build a prediction function f , then given a new observation x, predict y := f(x).
Two learning tasks are prediction (given new x predict y) and variable selection (find a small subsetof predictors that keep the most predictive power).
2.1 Regression
Regression analysis is the art of summarizing the relationship between two variables X and Y . Givenobserved data (Y1, X1), . . . , (Yn, Xn) ∼ PY,X , we want a function f such that f(X) is “close” to Y .
First, we need to identify the notion of closeness. Some examples of loss functions are L1 loss
L(f(X), Y ) := |f(X)− Y |,
and L2 lossL(f(X), Y ) := |f(X)− Y |2.
We will primarily study L2 loss here because it is mathematically simple and statistically justifiable (seebelow).
Second, note that the loss is still a random quantity. We define the risk function by
R(f) := EPY,X [L(f(X), Y )] = E[|Y − f(X)|2].
We would like to find f∗ := argminf R(f).
Theorem 2.1. The function that minimizes the L2 risk is the mean function (a.k.a. regression func-tion)
f∗(x) = E[Y | X = x].
Proof. Define f := E[Y | X = x]. We want to show f∗ = f .
R(f) = E[|Y − f(X)|2]
= E[|Y − f(X) + f(X)− f(X)|2]
= E[|Y − f(X)|2] + E[|f(X)− f(X)|2] + 2E[(Y − f(X))(f(X)− f(X))]︸ ︷︷ ︸=0
=⇒ argminf
R(f) = argminf
E|f(X)− f(X)|2 = f.
To show E[(Y − f(X))(f(X)− f(X))] = 0, note that
E[(Y − f(X))(f(X)− f(X))] = EX [E[(Y − f(X))(f(X)− f(X)) | X]]
= EX [(f(X)− f(X))E[(Y − f(X)) | X]︸ ︷︷ ︸=0
]
= 0
So, E[Y | X = x] minimizes L2-loss. To minimize R(f), the expectation is with respect to the truedistribution PY,X . Given data (X1, Y1), . . . , (Xn, Yn), we use the concentration principle to approximate thepopulation (true) risk R(f) by the empirical risk
R(f) :=1
n
n∑i=1
(Yi − f(Xi))2.
By the law of large numbers, R(f)P−→ R(f) as n→∞.
However, minimizing R(f) is without any further assumptions on f is problematic, as any function f
satisfying f(Xi) = Yi for each i will minimize R, regardless of how it acts outside of X1, . . . , Xn.
10

Definition 2.2. Overfitting is a phenomenon that occurs when a statistical model has too many parametersor degrees of freedom, so that the model not only fits the signal, but also the noise.
One solution is regularization, where we introduce additional constraints to control the degrees offreedom of a statistical model.
Example 2.3. We can consider functions f(x) := E[Y | X = x] that satisfy one of the following.
• f(x) = β>x, where β ∈ Rd (linear model)
• f(x) = Poly(x) (polynomial model)
• f satisfies∫
(f ′′(x))2 dx <∞ (nonparametric model)
• f(x) = β>x where many components of β are zero (sparse linear model)
2.1.1 Ordinary least squares (OLS) regression
Let Xi ∈ {1} × Rd−1 (the first component is the bias term) and Yi ∈ R. We define
βOLS := argminβ
1
n
n∑i=1
(Yi − β>Xi)2.
We can rewrite this in vector/matrix notation. Let
Y := (Y1, . . . , Yn)>,
X := [Xi,j ] ∈ Rn×d,
where the first column of X is (1, . . . , 1)>. If we define ‖β‖2 =√β>β, we have
βOLS = argminβ‖Y −Xβ‖22.
LetF (β) := ‖Y −Xβ‖22 = Y >Y + β>X>Xβ − 2Y >Xβ.
Then the gradient of F is∂F (β)
∂β= 2X>Xβ − 2X>Y = 0.
βOLS = (X>X)−1X>Y.
We will assume d < n and that X>X ∈ Rd×d is invertible.We have defined βOLS to be the minimizer of the empirical risk. It turns out that βOLS also naturally
appears as the MLE of the Gaussian noise model
Y = β>X + ε, ε ∼ N (0, σ2).
In other words, we assumeP (Y,X) = P (Y | X)P (X)
where
Y | X ∼ N (β>X,σ2),
X ∼ PX ,
where PX is an arbitrary distribution.
11

The log-likelihood is
`(β, σ2) =
n∑i=1
log pβ,σ2(Yi, Xi)
=
n∑i=1
log pβ,σ2(Yi | Xi) +
n∑i=1
log p(Xi),
and the MLE is
βMLE = argmaxβ,σ2
`(β, σ2)
= argmaxβ,σ2
n∑i=1
log pβ,σ2(Yi | Xi)
= argmaxβ,σ2
[− 1
2σ2
(n∑i=1
(Yi − β>Xi)2
)− n log
√2πσ2
]
= argminβ
n∑i=1
(Yi − β>Xi)2 only concerned with β
This is the objective function in the definition of βOLS.
2.2 High-dimensional data analysis
High-dimensional data involves data with many features (d > n). When d > n, what happens tothe OLS? The system Y = Xβ becomes underdetermined, so there are infinitely many β that perfectlydetermine Y = Xβ. Also, since rank(X>X) = rank(X) ≤ min{n, d} ≤ n < d and X>X ∈ Rd×d, the matrixX>X is not invertible.
We have various regularization techniques to cope with this issue.
2.2.1 Ridge estimator
The ridge estimator with parameter λ > 0 is defined as
βRidge,λ := (X>X + λId)−1X>Y.
The matrix X>X + λId is invertible because X>X is positive semidefinite, so adding λId makes it positivedefinite and thus invertible.
Note that the ridge estimator satisfies
βRidge,λ = argminβ‖Y −Xβ‖22 + λ‖β‖22.
Indeed, letting F (β) := ‖Y −Xβ‖22 + λ‖β‖22, we have
0 =∂F (β)
∂β= −2X>(Y −Xβ) + 2λβ
(X>X + λId)β = X>Y
β = (X>X + λId)−1X>Y.
We can interpret the ridge estimator in yet another way by using Lagrangian duality.
Lemma 2.4. For each λ > 0, there exists unique t such that
βRidge,λ = argminβ‖Y −Xβ‖22 s.t. ‖β‖22 ≤ t.
12

Figure 1: Ridge regression for d = 2. The countour lines for ‖Y −Xβ‖22 are ellipses because the objectivefunction is quadratic in β. The minimum of the objective function is the OLS estimate, but we are restrictedto the constraint region ‖β‖22 ≤ t.
This is a “regularized” version of OLS because there is an additional constraint on the parameter β. Thisinterpretation has a simple geometric interpretation, for example see Figure 1.
We typically use cross validation to choose the tuning parameter λ: if we select a set of candidates for λ(about thirty or so), each defines a model, so we may perform cross validation to select a model (and thusa λ).
2.2.2 Bridge estimator
The bridge estimator with parameters p ∈ (0,∞) and λ > 0 is defined as
βBridge,λ := argminβ‖Y −Xβ‖22 + λ‖β‖pp,
where ‖β‖pp :=∑i|βi|p. Note that the ridge estimator is the bridge estimator with p = 2.
We remark that if 1 ≤ p <∞, then ‖·‖p is a norm, but if 0 < p < 1, is not a norm (the triangle inequalityfails).
2.2.3 Lasso estimator
The lasso estimator (Least Absolute Shrinkage and Selection Operator) is the bridge estimator withp = 1, defined as
βLasso,λ := argminβ‖Y −Xβ‖22 + λ‖β‖1.
Similar to the case of the ridge estimator, Lagrangian duality implies that for each λ > 0, there exists aunique t such that
βLasso,λ = argminβ‖Y −Xβ‖22 s.t. ‖β‖1 ≤ t.
See Figure 2 for a geometric interpretation when d = 2.When d = 2, the lasso estimate tends to be a corner of constraint region, which makes one component
equal to zero. In higher dimensions, the lasso estimate also tends to have several components equal to zero;this property is called sparsity. Sparsity helps with the task of variable selection and also is aligned withthe parsimony principle.
Consider the different shapes of the constraint regions when p varies (Figure 3).
13

Figure 2: Lasso (left) and ridge (right) regression for d = 2. The countour lines for ‖Y −Xβ‖22 are ellipsesbecause the objective function is quadratic in β. The minimum of the objective function is the OLS estimate,but we are restricted to the constraint regions ‖β‖1 ≤ t and ‖β‖22 ≤ t.
Figure 3: The constraint region ‖β‖pp ≤ t when d = 3.
We see that with 0 < p ≤ 1, we have sparsity because the estimator will tend to be on corners or edgeswhere several components are zero. However, only for 1 ≤ p < ∞ is the objective function is convex, inwhich case we may use convex optimization techniques. The lasso estimator satisfies both these properties,which is why it is a particularly notable case of the bridge estimator.
Sparsity can help with prediction and cope with noise accumulation. Note that if we have an estimateβ, our prediction function is
f(x) =
d∑i=1
βixi.
Each βi contributes a little bit of noise/error, but when d is large, this accumulates significantly. Sparsitylimits the number of dimensions and helps avoid this issue. One might raise the question that it is badto make the assumption that the underlying model is sparse, but even so, the estimator works well forprediction, even if the underlying model is not truly sparse.
Ridge Lasso
not sparse < sparse, good for variable selection
closed form solution: (X>X + λI)−1X>Y > optimization: argminβ‖Y −Xβ‖22 + λ‖β‖1computationally difficult < computationally easy (sparsity makes optimization easier)
can handle multicollinearity > cannot handle multicollinearity
Multicollinearity occurs when predictor variables are highly correlated with each other, meaning thatone can be linearly predicted from the others with reasonable accuracy. Handling multicollinearity is the
14

biggest advantage of ridge over lasso.It is relatively easy to detect the existence of multicollinearity, but hard to determine the cause because
there are too many possible combinations (e.g., two variables are correlated with linear combination of threeother variables, etc.).
Consider d = 2.
X =
x1,1 x1,2
......
xn,1 xn,2
If the two columns of X are highly correlated, the contour plot of ‖Y −Xβ‖22 is a very “flat” ellipse. If thecontours are “parallel” to edge of the lasso constraint, the system is unstable (small change in λ result in bigchanges in β), and moreover the estimate may not be sparse. However, ridge regression maintains stability.
The following estimator combines the advantages of ridge and lasso.
Definition 2.5. The elastic net estimator is defined by
βElastic,λ,α := argminβ‖Y −Xβ‖22 + λ(α‖β‖1 + (1− α)‖β‖22).
Note that when α = 1, we have the lasso estimator, and when α = 0, we have the ridge estimator. Bydefault, typically use α = 0.63.
Regularization paths show the value of the components of the lasso, bridge, ridge, or elastic netestimator as function of λ. In lasso, variables are sent to zero one at a time, and result in a sparse estimatewhen λ is large. In ridge, components appraoch zero as λ increases, but are never zero. Note that whenλ = 0, we have the OLS estimate. The elastic net regularization path resembles that of the lasso estimator.
Regularization paths can be used to detect multicollinearity.
1. Set α = 1, fit lasso, visualize regularization path.
2. Set α = 0.6, fit elastic net, visualize regularization path.
3. Compare these two plots, look for any “dramatic” change. If no, then there is probably no multi-collinearity, so we use α = 1 to take the full advantage of the lasso estimator. If yes, it is probably dueto the instability of lasso under multicollinearity, so we use α = 0.6 to cope.
4. Then, choose λ by cross validation.
The linear model is not as restrictive as it seems. We describe a few methods of moving from linearmodels to nonlinear models.
1. Inputs can be transformations of original features. For example, consider
Y ∼ β1f(X1) + · · ·+ βdf(Xd),
where f can be the logarithm, square root, square, etc.
2. Inputs can have interaction terms. For example, in addition to X1, . . . , Xd, we can also include
X1X2, X1X3, . . . , Xd−1Xd
as variables. However, we pay the price of adding more variables (bivariate interaction adds ∼ d2/2,trivariate interaction adds ∼ d3/6). Including interaction terms naturally transforms the data intohigh-dimensional data even if they were not originally so.
3. Inputs can have basis expansions. For example, for each Xi, include X2i , X
3i , . . .. If the number of basis
elements is allowed to increase, we enter the world of nonparametric models. For example, can usepolynomial basis to approximate functions in the Sobolev space
{f :∫
(f ′′)2 <∞}
. Instead of using
f(X) =∑dj=1 βjXj , we can consider f(X) =
∑pj=1 βjhj(X). If p → ∞, we have a nonparametric
model.
15

Example 2.6 (Tree regression). Let d = 1. Let hi(x) := 1{x ≤ ti} for 1 ≤ i ≤ p, where t1, . . . , tp ∈ R aregiven. Then Y =
∑pj=1 βjhj(X) + ε is tree model.
We can also handle situations where the input variable is categorical.
Definition 2.7. A categorical variable is a variable that takes on values from a finite [typically unordered]set.
Dummy coding Given a categorical random variable with K categories, encode it using K − 1 dummyvariables.
1 = (0, 0, 0, . . . , 0)
2 = (1, 0, 0, . . . , 0)
3 = (0, 1, 0, . . . , 0)...K = (0, 0, 0, . . . , 1)
2.3 Classification and discriminant analysis
We quickly summarize our discussion of regression so far. The intuition behind regression is to minimizethe risk
R(f) := E[|Y − f(X)|2],
and that this perspective is completely model-free (i.e., we assume nothing about the joint distribution(X,Y ) ∼ PX,Y ). We showed that the minimizing f is f∗(x) := E[Y | X = x]. Because we cannot observeR(f), we instead consider the empirical risk
R(f) =1
n
n∑i=1
|Yi − f(X)|2.
However, minimizing empirical risk leads to overfitting. To combat this issue, we regularize by consideringlinear models f(X) = β>X. This gives the OLS β = (X>X)−1X>Y ; we also showed that this solutioncan be derived from a model-based perspective (the Gaussian noise model). This approach fails with high-dimensional data, so we consider ridge, bridge, and lasso, as well as elastic-net. We discussed how to movefrom from linear to nonlinear models, parametric to nonparametric models, and numerical to categoricaldata.
Definition 2.8. Classification is regression with a categorical response variable Y = {1,−1}.
The goal of classification is still the same as in general regression; we want to find a mapping h suchthat Y and h(X) are “close” to each other. Unlike general regression however, here we may assume that therange of h is {1,−1}.
We may use the L2 loss as before, but in classification it is equivalent to 0-1 loss up to a scalar multiple.
L(h) := ‖Y − h(X)‖22 = 4 · 1{Y 6= h(X)}.
We will only use 0-1 loss for classification.The risk function is again defined by
R(h) := E[L(h)] = E[1{Y 6= h(X)}] = P(Y 6= h(X)).
Definition 2.9. The Bayes classification rule is defined by
h∗ = argminh
R(h).
The Bayes risk is R∗ := R(h∗).
16

Theorem 2.10 (Bayes classification rule). The risk-minimizing function is
h∗(x) =
{1 P(Y = 1 | X = x) > 1
2 ,
−1 otherwise.
Proof.
R(h) = P(Y 6= h(X))
= 1− P(Y = h(X))
= 1−∑
y∈{1,−1}
P(Y = y, h(X) = y)
= 1−∑
y∈{1,−1}
E[1{Y = y, h(X) = y}]
= 1−∑
y∈{1,−1}
EX [E[1{Y = y} · 1{h(X) = y} | X]]
= 1−∑
y∈{1,−1}
EX [1{h(X) = y}E[1{Y = y} | X]]
= 1−∑
y∈{1,−1}
EX [1{h(X) = y}P(Y = y | X)]
= 1−∫
(1{h(x) = 1}P(Y = 1 | X = x) + 1{h(x) = −1}P(Y = −1 | X = x)) · p(x) dx
We want to maximize the integrand, so we want
h(x) =
{1 P(Y = 1 | X = x) > P(Y = −1 | X = x),
−1 otherwise.
Noting that P(Y = 1 | X = x) + P(Y = −1 | X = x) = 1 finishes the proof.
Recall that the function that minimized the L2 risk in general regression is E[Y | X = x] (Theorem 2.1).In the classification setting, this function takes the form
E[Y | X = x] = P(Y = 1 | X = x)− P(Y = −1 | X = x)
= 2P(Y = 1 | X = x)− 1.
So,signE[Y | X = x] = h(x),
where we define
sign(t) :=
{1 t > 0,
−1 t ≤ 0.
This result is intuitive. Without the restriction to the class of functions whose range is {−1, 1}, the risk-minimizing function would be E[Y | X = x]. The “closest” function in the restricted class is the one thatmatches the sign of E[Y | X = x].
Definition 2.11. Let r(x) := P(Y = 1 | X = x). We define the decision boundary by
D(r) := {x : r(x) = 1/2}.
The empirical risk is defined by
R(h) :=1
n
n∑i=1
1{Yi 6= h(Xi)}.
17

Again, minimizing empirical risk leads to overfitting, since any function that is correct on the observed datawill minimize empirical risk, regardless of how it behaves on unobserved inputs.
As before, we turn to regularization to deal with this issue. We impose the restriction that h is of theform h(X) = sign(β>X).
β = argminβ
n∑i=1
1{Yi 6= sign(β>Xi)}.
Unfortunately, this optimization problem is hard to compute, since the indicator function is nonconvex! Thisis in contrast to the OLS from earlier where we were even able to have a closed-form solution.
We leave the risk-based approach for the moment and consider the model-based approach. How do wemodel r(x) := P(Y = 1 | X = x)? We consider logistic modeling. The logistic function is defined byg(t) := 1
1+e−t . This is a “smooth” version of the sign function (see Figure 4). Given a function f : Rd → R,we consider the model where
Pf (Y = 1 | X = x) :=1
1 + e−f(x),
which consequently implies
Pf (Y = −1 | X = x) =1
1 + ef(x).
We can combine these two expressions into the following form.
Pf (Y = y | X = x) =1
1 + e−yf(x).
-20 -15 -10 -5 0 5 10 15 20
0.5
1
Figure 4: Plot of 11+e−t
Other possible models include inverse tangent, cdf of normal, etc. However, these examples still sufferfrom nonconvexity. The logistic model has “won” in popularity due to its convexity which leads to lowcomputational complexity.
Restricting the type of functions f allows for different types of logistic models.
Example 2.12 (Linear logistic regression).
f(x) := β0 + β>1 x
P (Y = 1 | X = x) =1
1 + e−β0+β>1 x
Example 2.13 (Nonparametric logistic regression). Let f(x) be “smooth”, e.g.∫
(f ′′)2 <∞.
However, note that choosing a class of functions f does not yet fully define the joint distribution of Xand Y . The statistical model of logistic regression is
{p(y, x) := Pf (Y = y | X = x)pX(x) : f, pX},
where pX is the marginal density of X, and Pf (Y = y | X = x) := 11+e−yf(x)
. The pX is called a “nuisanceparameter” because it is needed to make the model valid, but we do not want to infer it at all. The f is the“parameter of interest” because it is the parameter we want to infer.
18

Given the random samples {(Xi, Yi)}ni=1, we compute the MLE under this statistical model.
L(f) :=
n∏i=1
Pf (Yi | Xi)pX(Xi)
L(f) =
n∏i=1
1
1 + e−Yif(Xi)pX(Xi)
`(f) = −n∑i=1
log(1 + e−Yif(Xi)) +
n∑i=1
log pX(Xi)
f := argmaxf
`(f) = argminf
n∑i=1
log(1 + e−Yif(Xi))
This motivates the definition of the following new loss function, which we call logistic loss, induced bythe logistic model.
`Logistic(y, f(x)) := log(1 + e−yf(x)).
-10 -7.5 -5 -2.5 0 2.5 5 7.5 10
0.8
1.6
2.4
3.2
4
4.8
Figure 5: Plot of log(1 + e−yf(x)) vs. y · f(x)
The quantity y · f(x) is called the functional margin, and we want it to be large to incur less loss, i.e.,we encourage Yi and f(Xi) to have the same sign. Alternatively, consider
P(Yi = 1 | Xi = xi) =1
1 + e−f(Xi)
=⇒ logP(Yi = 1 | Xi = xi)
P(Yi = −1 | Xi = xi)= f(xi).
This also captures the idea that we want f(Xi) and Yi to have the same sign. Note that the logistic loss notonly encourages Yif(Xi) to be positive, but also to be far away from zero.
To handle high-dimensional data, the ridge, bridge, lasso, and elastic net regressions are still applicableand effective. For instance, the ridge estimator for linear logistic regression is
βRidge,λ := argminβ
n∑i=1
log(1 + e−Yi(β>Xi)) + λ‖β‖22.
19

[Note that β0 still exists above, but we suppress it as an appended component to the Xi for ease of notation.]
Even though∑ni=1 log(1 + e−Yi(β
>Xi)) is not quadratic, it is still convex, so the contours still look similarto those of ‖Y −Xβ‖22 from the previous section. The other approaches are analogous.
How does this compare to the OLS estimator, which is derived from using L2-loss? Recall that βOLS :=argminβ
1n
∑ni=1(Yi − β>Xi)
2. Because (βOLS)>x is a real number, our estimator is sign((βOLS)>x). Note
however that we can rewrite the definition of βOLS as
βOLS := argminβ
1
n
n∑i=1
(1− Yiβ>Xi)2
because Y ∈ {1,−1}. Then Yiβ>Xi is the functional margin, and the summand corresponds to a quadratic
loss function `(u) = (1 − u)2. This loss function is small when the functional margin is near 1, but whenthe functional margin Yiβ
>Xi is large, it still incurs a large loss despite being correct. This is a significantdrawback of L2 loss.
However, using L2 loss not only encourages the functional margin to be away from the negative horizontalaxis (misclassification), but also to be far from the ambiguous zone near zero on the horizontal axis; itconstrains the functional margin to be in a small region, but it is in the correct region. Logistic lossencourages the functional margin to be large, but does a worse job of keeping it away from the ambiguousregion near zero.
L2 loss leads to linear discriminant analysis (LDA), which is powerful. Moreover, using logistic loss mightrequire more data than L2 loss. Neither L2 loss or logistic loss is clearly better than the other.
We could also combine the two loss functions by considering considering the truncated quadratic loss`(u) := (1−u)21{u ≤ 1}; this is sometimes better and sometimes worse than the previous two loss functions.In short, the question of whether a loss is good or not depends on the context and various other factors. Insome applications, a certain loss function has been empirically shown to be better than others.
• Text mining: sparse logistic regression
• Image analysis: boosting (exponential loss)
• Genomics : LDA (quadratic loss)
The hinge loss is defined by [x]+ := max(x, 0). Then the SVM estimator is defined by
βSVM = argminβ
1
n
n∑i=1
[1− Yiβ>Xi]+ + λ‖β‖22.
There are more involved interpretations of SVM that involve hyperplanes and margins, but from a statisticalperspective, SVM is simply ridge logistic regression with hinge loss.
In boosting we consider the exponential loss e−Yif(Xi). Again, there are more involved interpretationsof boosting, but from a statistical perspective it simply uses a different loss function.
Recall that in the statistical model of logistic regression, we model the distribution of Y | X, but notof X; this is a discriminative model, and we are unable to generate new data (Y,X) due to our lack ofknowledge of the distribution of X. On the other hand, in generative modeling we model X | Y and Y ,and then use Bayes formula to model Y | X; note that we can generate new data (Y,X) because we modelthe joint distribution.
P(Y = 1 | X = x) =p(x | Y = 1)P(Y = 1)
p(x | Y = 1)P(Y = 1) + p(x | Y = −1)P(Y = −1)
=:p+(x)η
p+(x)η + p−(x)(1− η),
where we let p+(x) := p(x | Y = 1), p−(x) := p(x | Y = −1), and η := P (Y = 1).We need to model P(Y = ±1), p(x | Y = 1), and p(x | Y = −1). Clearly Y ∼ Ber(η) for some η (note,
we let Bernoulli to take on values ±1 rather than 1 and 0); this is the only way we can model Y .
20

-5 -4 -3 -2 -1 0 1 2 3 4 5
0.5
1
1.5
2
2.5
3
3.5
4
Figure 6: Plots of logistic loss log(1 + e−yf(x)), quadratic loss (1 − yf(x))2, hinge loss [1 − yf(x)]+, andexponential loss e−yf(x) vs. y · f(x)
We have more freedom in modeling X. In Gaussian discriminant analysis (GDA) we have
X | (Y = 1) ∼ N (µ+,Σ+)
X | (Y = −1) ∼ N (µ−,Σ−),
i.e.,
p+(x) = (2π)−d/2|Σ+|−1/2 exp
(−
(x− µ+)>Σ−1+ (x− µ+)
2
)
p−(x) = (2π)−d/2|Σ−|−1/2 exp
(−
(x− µ−)>Σ−1− (x− µ−)
2
)
Note again that we are not assuming the true conditional distributions are Gaussian; we are using asimplified model for the sake of regularization.
Logistic regression and other discriminative models care only about prediction, and thus only modelY | X and disregard the marginal distribution of X. Generative modeling involves a belief/philosophy ofhow the data was generated. In this sense, discriminative modeling relies on fewer assumptions.
The Bayes Rule under GDA can be rewritten as follows.
P(Y = 1 | X = x) > P(Y = −1 | X = x)
⇐⇒ p+(x)η > p−(x)(1− η)
⇐⇒ logp+(x)
p−(x)+ log
η
1− η> 0
The first term is
p+(x)
p−(x)=|Σ−|1/2
|Σ+|1/2exp
(−
(x− µ+)>Σ−1+ (x− µ+)
2+
(x− µ−)>Σ−1− (x− µ−)
2
)
logp+(x)
p−(x)=
1
2log|Σ−|1/2
|Σ+|1/2−
(x− µ+)>Σ−1+ (x− µ+)
2+
(x− µ−)>Σ−1− (x− µ−)
2
21

If we define the Mahalanobis distances
γ2+(x) := (x− µ+)>Σ−1
+ (x− µ+),
γ2−(x) := (x− µ−)>Σ−1
− (x− µ−),
we have
h∗(x) =
{1 if 1
2γ2−(x)− 1
2γ2+(x) + 1
2 log |Σ−||Σ+| + log η1−η > 0
−1 otherwise
The condition is a quadratic form of x, i.e., it is of the form x>Ax + b>x + c. For this reason, GDA issometimes called quadratic discriminant analysis (QDA).
Given only the data, how to estimate µ+, µ−, Σ+, Σ−, η? MLE.
n+ :=
n∑i=1
1{Yi = 1}
n− := n− n+
µ+ :=1
n+
∑i:Yi=1
Xi
µ− :=1
n−
∑i:Yi=−1
Xi
η :=n+
n
Σ+ :=1
n+
∑i:Yi=1
(Xi − µ+)(Xi − µ+)>
Σ− :=1
n−
∑i:Yi=−1
(Xi − µ−)(Xi − µ−)>
Linear discriminant analysis (LDA) is the special case of QDA with the extra condition of a commoncovariance matrix: Σ+ = Σ− = Σ.
(x− µ−)>Σ−1(x− µ−)− (x− µ+)>Σ−1(x− µ+)
= x>Σ>x− 2µ>−Σ−1x+ µ>−Σ−1µ− − x>Σ>x+ 2µ>+Σ−1x− µ>+Σ−1µ+
= −2µ>−Σ−1x+ µ>−Σ−1µ− + 2µ>+Σ−1x− µ>+Σ−1µ+
So, if we define
β := Σ−1(µ+ − µ−) (1)
β0 :=1
2µ>−Σ−1µ− −
1
2µ>+Σ−1µ+ + log
η
1− η, (2)
we have
h∗(x) =
{1 if β>x+ β0 > 0
−1 otherwise
The decision boundary is linear in x, hence the name “linear discriminant analysis.”
22

Let us return to the condition distribution Y | X under the LDA framework.
P(Y = 1 | X = x) =p(x | Y = 1)P(Y = 1)
p(x | Y = −1)P(Y = −1) + p(x | Y = 1)P(Y = 1)
=1
1 + p(x|Y=−1)(1−η)p(x|Y=1)η
=1
1 + exp(log p(x|Y=1)p(x|Y=−1) − log η
1−η )
=1
1 + e−β0+β>x.
This appears to be precisely the conditional distribution in the setting of linear logistic regression. How-ever in LDA, the β0 and β are constrained to take the particular form (see equations (1) and (2)) in termsof the parameters of the Gaussian distributions, whereas in logistic regression, β0 and β are arbitrary. Thus,LDA is a special case of linear logistic regression; the assumption of the Gaussian conditional distributionsmakes it more regularized than linear logistic regression.
We already know the logistic model corresponds to logistic loss; it turns out that the LDA model corre-sponds to quadratic loss (difficult topic). If the true model does involve the extra assumption of conditionalGaussian, then both losses give the right parameters.
This leads us to the question of which technique we should use: logistic regression or LDA? In applica-tions, we generally use logistic regression. In most applications, if LDA assumption is correct, then logisticregression works and is usually more efficient than LDA.
In high dimensions (d > n), we use diagonal linear discriminant analysis (DLDA), which is LDAwith the further assumption that the covariance matrix is diagonal.
Σ =
σ2
1
σ22
. . .
σ2d
Note that a Gaussian distribution with a diagonal covariance matrix has contours that are ellipses/ellipsoidswhose axes are parallel to the component axes. In particular, the components are independent of each other,so we may
Y ∼ Ber(η)
Xj | (Y = 1) ∼ N (µ+,j , σ2j )
Xj | (Y = −1) ∼ N (µ−,j , σ2j )
Even though independence of the components conditioned on the class Y (this is known as the “NaıveBayes assumption”) may not actually hold, using dramatically simplified (and wrong) models often stillworks well.
p(x | Y = 1) =
d∏j=1
p(xj | Y = 1) =
d∏j=1
exp(− (xj−µ+,j)
2
2σ2j
)√
2πσ2j
.
The MLEs µ+ and µ− are the same as for LDA/QDA. For the covariance matrix, we have
σ2j =
n+S+,j + n−S−,jn
,
where n+ :=∑ni=1 1{Yi = 1} and S+,j := 1
n+
∑i:Yi=1(Xi,j − µ+,j)
2, with analogous definitions for n− and
S−,j .DLDA is a special case of LDA, but is also a special case of a Naıve Bayes classifier.
23

Definition 2.14. The Naıve Bayes classifiers form a family of generative classification methods thatexploit the regularization “X1, . . . , Xd (components) are conditionally independent given Y ,” or more ex-plicitly,
p(x1, . . . , xd | Y ) =
d∏j=1
p(xj | Y ).
We describe classification in general under the Naıve Bayes assumption. Recall the Bayes classificationrule
h∗(x) =
{1 f(x) > 0
−1 otherwise
where
f(x) := logP(Y = 1 | X = x)
P(Y = −1 | X = x).
Then,
f(x) = logP(Y = 1 | X = x)
P(Y = −1 | X = x)
= logP(Y = 1)
P(Y = −1)+ log
p(x | Y = 1)
p(x | Y = −1)
= logη
1− η+
d∑i=1
logp(xj | Y = 1)
p(xj | Y = −1)Naıve Bayes assumption
=: β0 +
d∑j=1
fj(xj),
where we have defined fj(xj) := logp(xj |Y=1)p(xj |Y=−1) .To compute the MLE, we can consider each component
separately.
• In full QDA, we have µ+, µ−, Σ+, Σ−, and η, so total number of parameters is d+d+d(d+1)2 +d(d+1)
2 +1 =d(d+ 1) + 2d+ 1.
• In LDA, we have µ+, µ−, Σ, and η, so total number of parameters is d(d+1)2 + 2d+ 1.
• In DLDA, same as LDA, but Σ is diagonal, so the number of parameters is 3d+ 1.
• In DQDA (two diagonal covariance matrices), the number of parameters is 4d+ 1.
24

3 Generalized linear models
Generalized linear models give a systematic view of regression and classification. We have seen a fewtypes of regression already, like Gaussian linear regression and logistic regression.
These models can be decomposed into the following components
1. Stochastic component.
2. Systematic component
3. Link function
We first state the components for Gaussian linear regression and logistic regression in order to motivatethe generalization.
Gaussian linear regression Logistic regression
Model Yi = β>Xi + εi, εi ∼ N (0, σ2) P(Yi = 1 | Xi) = 1
1+e−β>Xi
Stochastic component Yi | Xi ∼ N (µi, σ2) where µi := β>Xi Yi | Xi ∼ Ber(µi), where µi := E[Yi | Xi]
Systematic component ηi := β>Xi ηi := β>XiLink function ηi = g(µi), with g the identity ηi = g(µi), with what g?
The link function g for logistic regression is derived as follows.
µi = E[Yi | Xi]
µi = P(Yi = 1 | Xi)− P(Yi = −1 | Xi)
µi =1
1 + e−ηi− 1
1 + eηi
µi =eηi − 1
1 + eηi
µi + µieηi = eηi − 1
(1− µi)eηi = 1 + µi
ηi = log1 + µi1− µi
g(t) = log1 + t
1− t
This g is known as the logit function.
Remark: why not set ηi := e−β>Xi in logistic regression? We could model it this way, but when we try
to use inference, we will run into computational issues (non-convexity causes intractability etc.)Note that the link function links the systematic component (which is the input with possibly a transfor-
mation) to the mean of the stochastic component (the expected response of the input).Generalized linear models (GLMs) are an extension of the three-component modeling scenario above.
1. We allow the stochastic components to follow any distribution, not just Gaussian or Bernoulli.
2. We allow the link functions to be more general, not just identity or logit.
3. We allow ηi = f(xi) where f is more general, not just β>xi.
In practice,
1. Stochastic component: exponential dispersion family.
2. Link function: canonical link.
3. Systematic component: general.
25

Definition 3.1. The exponential dispersion family (EDF) contains any univariate distribution whosedensity takes the form
pθ,τ (y) = hτ (y) exp
(θy −A(θ)
τ
).
The parameter θ is the canonical parameter, τ is the dispersion parameter. The function A(θ) is thenormalization function and may depend on τ . The function hτ (y) is called the base measure and mustbe free of θ.
In the Gaussian distribution, τ is the variance, which is some sense the reasoning behind the term“dispersion.”
The exponential dispersion family is more general than the exponential family.The exponential dispersion family is in some sense the largest family of distributions for which any
computation involving inference is tractable. In the past, people tried larger families of distributions, butran into issues with non-convexity making problems intractable.
Example 3.2 (Gaussian distribution belongs to the EDF).
p(y) =1√
2πσ2exp
(− (y − µ)2
2σ2
)=
1√2πσ2
exp
(−y
2 + µ2 − 2yµ
2σ2
)=
(1√
2πσ2e−
y2
2σ2
)exp
(µy − µ2
2
σ2
)
=
1√2πτ
exp
(− y
2
2τ
)︸ ︷︷ ︸
hτ (y)
exp
(θy −A(θ)
τ
)θ := µ,A(θ) := θ2/2, τ = σ2
Example 3.3 (Bernoulli distribution belongs to the EDF). P(Y = 1) = q and P(Y = −1) = 1− q.
p(y) = q1+y2 (1− q)
1−y2
= (q(1− q))1/2
(q
1− q
)y/2= exp
((1
2log
q
1− q
)y +
1
2log(q(1− q))
).
We let θ := 12 log q
1−q , which implies
q
1− q= e2θ
q = e2θ − qe2θ
q =e2θ
1 + e2θ.
Thus,
A(θ) = −1
2log(q(1− q))
= −1
2log
(e2θ
1 + e2θ· 1
1 + e2θ
)=
1
2(log(1 + e2θ) + log(1 + e−2θ)).
Letting τ := 1 and hτ (y) := 1 gives the EDF form.
26

Example 3.4 (Poisson distribution belongs to the EDF).
p(y) =1
y!e−λλy =
1
y!exp(−λ+ y log λ).
This is clear with θ := log λ, A(θ) := eθ, τ := 1, and hτ (y) := 1/y!.
Most familiar distributions are in the EDF with the exception of the uniform distribution.We call θ the canonical parameter but call η the natural parameter. The exponential dispersion family
requires a special link function called the canonical link function which is necessary to lead to convexoptimization in inference.
Canonical link principle: we always use the link function
η = g(µ) := (A′)−1(µ).
For instance, in the Gaussian distribution, A(θ) = 12θ
2, so A′(θ) = θ, and finally g(µ) = (A′)−1(µ) = µ,as seen in the beginning of the section.
In the Bernoulli distribution,
A(θ) =1
2(log(1 + e2θ) + log(1 + e−2θ))
A′(θ) =1
2
(2e2θ
1 + e2θ+−2e−2θ
1 + e−2θ
)A′(θ) =
e2θ − 1
e2θ + 1
µ =e2θ − 1
e2θ + 1inverting
µe2θ + µ = e2θ − 1
1 + µ
1− µ= e2θ
θ =1
2log
1 + µ
1− µ.
This is almost the same as the link function considered at the beginning; the factor of 1/2 is inconsequential.In the Poisson distribution, A(θ) = A′(θ) = eθ, so g(µ) = logµ.Again, the reason for choosing the canonical link instead of an arbitrary link function is to ensure
tractability: we want to avoid non-convex optimization problems.Note that we only need to involve µ (mean of distribution) in link function.The goal of canonical link theory is to have g(µ) be the canonical parameter θ.
θ = η = g(µ)
The following theorem shows that we achieve this goal if we take g(µ) := (A′)−1(µ).
Theorem 3.5. If Y follows a distribution p(y) = hτ (y) exp(θy−A(θ)
τ
)from the EDF, we have
µ := E[Y ] = A′(θ).
Consequently, (A′)−1(µ) = θ.
27

Proof.
1 =
∫p(y) dy
1 =
∫hτ (y) exp
(θy −A(θ)
τ
)dy
1 = e−A(θ)/τ
∫hτ (y)eθy/τ dy
A(θ) = τ log
∫hτ (y)eθy/τ dy
A′(θ) = τ
∫hτ (y) yτ e
θy/τ dy∫hτ (y)eθy/τ dy
Leibniz rule or Fubini’s theorem
= τ
∫hτ (y) yτ e
θy/τ dy
eA(θ)/τ
=
∫yhτ (y) exp
(θy −A(θ)
τ
)dy
= E[Y ]
To fit the GLM, maximize the log-likelihood log∏ni=1 P(Yi = yi | Xi = xi); to predict, report µi =
g−1(ηi).
28

4 Exploratory analysis (unsupervised learning)
4.1 Graphical models
In this section we introduce Gaussian graphical models. Note that these are different from “Bayesiannetwork” graphical models that appear in other literature.
Let X1, . . . , Xn ∼ N (µ,Σ) be i.i.d. random variables, with µ ∈ Rd and Σ ∈ Rd×d. We aim to find asparse estimate for Θ := Σ−1, called the precision matrix.
Given X1, . . . , Xd and A ⊂ {1, . . . , d}, we let XA := {Xj : j ∈ A} and X\A := {Xj : j /∈ A}.
Definition 4.1. Let A,B ⊂ [1, . . . , d]. We say XA and XB are independent if for any realizations xA andxB , we have p(xA, xB) = p(xA) · p(xB). We denote this XA |= XB .
We say XA and XB are conditionally independent given XC if for any realizations xA, xB , and xC ,then p(xA, xB | xC) = p(xA | xC) · p(xB | xC). In some sense, XC “explains” the dependency between XA
and XB .
Independent random variables need not always be conditionally independent: if X and Y are independent,they are not independent given Z := X + Y .
Conditionally independent random variables need not be independent either: letX,Y1, Y2 be independent.Then X + Y1 and X + Y2 are conditionally independent given X, but are not independent.
If we have the influences A −→ B −→ C, then A 6 |= B, but A |= C | B.Conditional independence relationships help represent joint distributions more efficiently. For instance,
if X1, . . . , Xd are all binary random variables, we need 2d − 1 numbers to store the joint distribution. If weknow that there are conditional independence relationships, we can factorize the joint distribution and useless space to store it.
Theorem 4.2.Θj,k = 0 ⇐⇒ Xj |= Xk | X\{j,k}.
Proof. We want to show that Θ1,2 = 0 =⇒ X1 |= X2 | X\{1,2}. It suffices to show the factorizationp(x1, x2 | x3, . . . , xd) = p(x1 | x3, . . . , xd)p(x2 | x3, . . . , xd). Without loss of generality we assume µ = 0.
p(x1, . . . , xd) =1
(2π)d/2|Θ|1/2 exp
(−1
2x>Θx
)
p(x) ∝ exp
−1
2Θ1,1x
21 −
1
2Θ2,2x
22 −
d∑j=3
Θ1,jx1xj −d∑k=3
Θ2,kx2xk − f(Θj,k, xj , xk; 3 ≤ j ≤ k ≤ d)
,where the function f contains the remaining terms in the expansion of x>Θx, which will cancel out in thecalculation below because they are free of x1 and x2. Note that we used the fact that Θ1,2 = 0.
p(x1, x2 | x3, . . . , xd)
=p(x1, . . . , xd)∫ ∫
p(x1, . . . , xd) dx1 dx2
=exp(− 1
2Θ1,1x21 − 1
2Θ2,2x22 −
∑dj=3 Θ1,jx1xj −
∑dk=3 Θ2,kx2xk
)∫ ∫
exp(− 1
2Θ1,1x21 − 1
2Θ2,2x22 −
∑dj=3 Θ1,jx1xj −
∑dk=3 Θ2,kx2xk
)dx1 dx2
=exp(− 1
2Θ1,1x21 − 1
2Θ2,2x22 −
∑dj=3 Θ1,jx1xj −
∑dk=3 Θ2,kx2xk
)∫
exp(− 1
2Θ1,1x21 −
∑dj=3 Θ1,jx1xj
)dx1 ·
∫exp(− 1
2Θ2,2x22 −
∑dk=3 Θ2,jx2xk
)dx2
This gives the desired factorization.
29

In Homework 3 a proof for both directions is outlined; we sketch the argument here. Again we assumewithout loss of generality that µ = 0. Letting A := {1, 2}, we can partition Σ into
Σ =
[ΣAA ΣAAc
ΣAcA ΣAcAc
].
It turns out thatXA | XAc ∼ N (0,ΣAA − ΣAAcΣ
−1AcAcΣAcA).
From the fact that ΣΘ = I, we have Θ−1AA = ΣAA−ΣAAcΣ
−1AcAcΣAcA, so XA | XAc ∼ N (0,Θ−1
AA). Using thefact that the components of a multivariate Gaussian are independent if and only if their covariance is zero,we easily have Θ1,2 = 0 if and only if X1 |= X2 | X\{1,2}.
We construct a graphical representation of Θ. Let G := (V,E) with V := {1, . . . , d} and E ⊂ V ×V . Weplace an edge (j, k) ∈ E (where j 6= k) whenever Θj,k 6= 0. This is called graphical model learning or graphestimation.
Estimating the precision matrix: maximum penalized likelihood estimation (MPLE).
p(x) =1
(2π)d/2|Θ|1/2 exp
(−1
2(x− µ)>Θ(x− µ)
)We already know µ = 1
n
∑ni=1Xi.
Ln(Θ) :=1
(2π)d/2|Θ|n/2 exp
(−1
2
n∑i=1
(Xi −X)>Θ(Xi −X)
)
`(Θ) = −1
2
n∑i=1
(Xi −X)>Θ(Xi −X) +n
2log|Θ| − nd
2log(2π)
= C +n
2log|Θ| − 1
2
n∑i=1
(Xi −X)>Θ(Xi −X)
= C +n
2log|Θ| − 1
2
n∑i=1
Tr((Xi −X)>Θ(Xi −X)
)= C +
n
2log|Θ| − 1
2
n∑i=1
Tr(Θ(Xi −X)(Xi −X)>
)= C +
n
2log|Θ| − n
2Tr
(Θ
1
n
n∑i=1
(Xi −X)(Xi −X)>
)= C +
n
2log|Θ| − n
2Tr(ΘSn).
Note that the sample covariance matrix Sn is the sufficient statistic for Θ. We impose sparsity by imposinga constraint on Θ.
Θ := argmaxΘ
`(Θ) s.t. ‖Θ‖1 :=∑j,k
|Θj,k| ≤ L
Θ = argmaxΘ
`(Θ)− λ‖Θ‖1
= argminΘ
Tr(ΘSn)− log|Θ|+ λ‖Θ‖1
This optimization problem is called the graphical lasso.We now define the graph induced by Θ and discuss how it represents conditional independence relation-
ships. Let G be a graph with vertices {1, . . . , d}, and let there be an [undirected] edge between distinctvertices i and j if and only if Θi,j 6= 0.
Let A,B,C ⊂ V . We say C separates A and B (denoted A ⊥ B | C) if removing C separates A and B(no path between A and B after removing C). This turns out to be equivalent to XA |= XB | XC .
30

Graph theory Probability theory
G = (V,E); V = [d] p(x1, . . . , xd)separation A ⊥ B | C conditional independence XA |= XB | XC
Separation and conditional independence are connected by the Markov properties
Definition 4.3 (Pairwise Markov Property).
Xj |= Xk | X\{j,k} ⇐⇒ (j, k) /∈ E.
For the Gaussian model we have defined, Theorem 4.2 and the definition of the graph immediately implythat the Gaussian model has the pairwise Markov property.
Definition 4.4 (Global Markov Property). For A,B,C ⊂ V = [d],
XA |= XB | XC ⇐⇒ A ⊥ B | C.
Clearly, the global Markov property implies the pairwise Markov property, but surprisingly, the converseoften holds.
Theorem 4.5 (Lauritzen, 1996). If p(x) > 0, then the pairwise Markov property is equivalent to the globalMarkov property.
This theorem is proved by induction on the number of nodes d.
4.2 Clustering, mixture models, and latent variable models
Clustering is a classification problem but with hidden/unobserved/latent class labels. Our goal is torecover the latent class labels.
Example 4.6 (Mixture of two Gaussians). Let Z equal 1 with probability η and 2 otherwise. Let X | (Z =1) ∼ N (µ1, 1) and X | (Z = 2) ∼ N (µ2, 1). We observe only the observed random samples X1, . . . , Xn, andnot the latent variables Z1, . . . , Zn.
Given X1, . . . , Xn, we aim to infer η, µ1, and µ2, and Z1, . . . , Zn. We would also like to compute theprobability P(Zi = 1 | X1, . . . , Xn), the probability that Xi is sampled from distribution 1. [Note that if theZi are observed, we can do Gaussian discriminant analysis as before, but here the Zi are unobserved.]
For the mixture of two Gaussians, the parameter is θ := (η, µ1, µ2)> and the model is the family ofdistributions of the form
pθ(x) =
2∑j=1
pθ(x, Z = j) =
2∑j=1
pθ(x | Z = j)P(Z = j) = ηpµ1(x) + (1− η)pµ2
(x),
for all η ∈ [0, 1], µ1, µ2 ∈ Rd. Here, η is called the mixing coefficient.
The above example is a type of mixture model.
Definition 4.7. A mixture model has a density that is a convex combination of a set of component densi-ties. It is finite if there are finitely many components and infinite if there are infinitely many components.
We continue with the mixture of two Gaussians before moving to general mixture models.The log-likelihood does not involve the Zi because they are unobserved. The following is the marginal
log-likelihood; this is contrast to the complete log-likelihood which replaces pθ(xi) with pθ(xi, zi).
`M(θ) :=
n∑i=1
log pθ(xi)
=
n∑i=1
log(ηpµ1(xi) + (1− η)pµ2
(xi))
=
n∑i=1
log
(η
1√2πe−(xi−µ1)2/2 + (1− η)
1√2πe−(xi−µ2)2/2
)
31

However, this function is non-convex and difficult to maximize using previous approaches. What alternativesdo we have? Guess and check is a simple method. Gradient ascent is better (but requires several trials toattempt to avoid local optima). In applications, we typically use the EM algorithm.
Remark: the EM algorithm is not theoretically better than guess and check or gradient ascent, but inpractice it is better. Moreover, it relies on the structure of the log-likelihood and the statistical model;although unlike the other two methods, the EM algorithm cannot be used to maximize general functions, itdoes utilize the structure of the log-likelihood much better.
We provide the intuition of the EM algorithm in two equivalent forms.
• Block coordinate ascent. Suppose we want to solve maxx,y f(x, y). Initialize y(1) randomly. Fort = 1, 2, . . ., perform the following updates repeatedly until convergence.
x(t+1) ← argmaxx
f(x, y(t))
y(t+1) ← argmaxy
f(x(t+1), y)
By the monotone convergence theorem, convergence is guaranteed if f is bounded from above. Notehowever this only guarantees convergence to a local maximum and not necessarily to the global maxi-mum.
• Minorization-maximization strategy. Let f be a function we want to maximize. Initialize x(1),find a function ψ1 that is easy to maximize and everywhere less than or equal to f . Let x(2) be themaximizer of ψ1, and continue.
We now provide the rough intuition behind the EM algorithm for the mixture of two Gaussians.Part 1. If Z1, . . . , Zn are known, how do we update θ? Then this is simply classification; use MLE with
the complete likelihood. Let n1 :=∑ni=1 1{Zi = 1} and n2 := n− n1.
`C(θ) :=
n∑i=1
log pθ(Xi, Zi)
=∑i:Zi=1
[log pθ(Xi | Zi = 1)Pη(Zi = 1)] +∑i:Zi=2
[log pθ(Xi | Zi = 2)Pη(Zi = 2)]
=∑i:Zi=1
log(ηpµ1(Xi)) +∑i:Zi=2
log((1− η)pµ2(Xi))
= n1 log η + n2 log(1− η) +∑i:Zi=1
log pµ1(Xi) +∑i:Zi=2
log pµ2(Xi)
∂`C(θ)
∂η=n1
η− n2
1− η∂`C(θ)
∂µ1=∑i:Zi=1
∂
∂µ1
(−1
2(Xi − µ1)2 + log
1√2π
)
=
n∑i=1
1{Zi = 1}(Xi − µ1)
= −n1µ1 +
n∑i=1
1{Zi = 1}Xi
Setting the partial derivatives to zero gives
η :=n1
n=
1
n
n∑i=1
1{Zi = 1}
µ1 :=
∑ni=1 1{Zi = 1}Xi
n1=
∑ni=1 1{Zi = 1}Xi∑ni=1 1{Zi = 1}
µ2 :=
∑ni=1 1{Zi = 2}Xi
n2=
∑ni=1 1{Zi = 2}Xi∑ni=1 1{Zi = 2}
32

Part 2. If we are only given θ, how can we update Z1, . . . , Zn? An obstacle is that the Z1, . . . , Zn arerandom variables, not fixed quantities like parameters. Instead, we could seek something like P(Zi = 1 |X1, . . . , Xn) or E[Zi | X1, . . . , Xn]. Note that if we know the probability distribution we can compute theexpectation, but the reverse is only possible in the case when Zi takes on two values. In the EM algorithmwe seek the probability distribution, not the expectation.5
Pθ(Zi = 1 | X1, . . . , Xn) = Pθ(Zi = 1 | Xi)
=pµ1
(Xi | Zi = 1)Pη(Zi = 1)
pµ1(Xi | Zi = 1)Pη(Zi = 1) + pµ2(Xi | Zi = 2)Pη(Zi = 2)
=ηpµ1
(Xi)
ηpµ1(Xi) + (1− η)pµ2(Xi)
=ηe−(xi−µ1)2/2
ηe−(xi−µ1)2/2 + (1− η)e−(xi−µ2)2/2
Pθ(Zi = 2 | X1, . . . , Xn) =(1− η)e−(xi−µ2)2/2
ηe−(xi−µ1)2/2 + (1− η)e−(xi−µ2)2/2
So, we have found P(Zi = 1 | X1, . . . , Xn) = E[1{Zi = 1} | X1, . . . , Xn].Part 3. If we only know the value of P(Zi = 1 | X1, . . . , Xn) = E[1{Zi = 1} | X1, . . . , Xn], how do we
update θ? If we make a choice of Zi (either by choosing the more likely outcome or by sampling) and repeatPart 1, convergence of the whole algorithm is unfortunately not guaranteed. Instead, we take the results ofPart 1, and replace all the indicator random variables with expectations. [We will justify this later.]
η :=1
n
n∑i=1
E[1{Zi = 1} | X1, . . . , Xn]
µ1 :=
∑ni=1 E[1{Zi = 1} | X1, . . . , Xn]Xi∑ni=1 E[1{Zi = 1} | X1, . . . , Xn]
µ2 :=
∑ni=1 E[1{Zi = 1} | X1, . . . , Xn]Xi∑ni=1 E[1{Zi = 1} | X1, . . . , Xn]
Example 4.8 (Complete EM algorithm for mixture of two Gaussians). Initialize θ(1) := (η(1), µ(1)1 , µ
(1)2 )>.
For t = 1, 2, . . .,
• E step.
γ(t+1)i,1 := Pθ(t)(Zi = 1 | X1, . . . , Xn) =
η(t)pµ(t)1
(Xi)
η(t)pµ(t)1
(Xi) + (1− η(t))pµ(t)2
(Xi)
γ(t+1)i,2 := 1− γ(t+1)
i,1 .
• M step.
η(t+1) :=1
n
n∑i=1
γ(t+1)i,1
µ(t+1)1 :=
∑ni=1 γ
(t+1)i,1 Xi∑n
i=1 γ(t+1)i
µ(t+1)2 :=
∑ni=1 γ
(t+1)i,2 Xi∑n
i=1 γ(t+1)i,2
5Why is the EM algorithm called “expectation maximization” then? It may be because P(Zi = 1 | X1, . . . , Xn) = E[1{Zi =1} | X1, . . . , Xn]. It may also be because we maximize the expected complete log likelihood, as we will see later.
33

Repeat until convergence of the marginal log-likelihood.
Example 4.9 (Mixture of K Gaussians). Let Z ∼ Multi(η0, . . . , ηK−1), i.e., P(Z = j) = ηj for j =
0, . . . ,K − 1 where ηj ≥ 0 and∑K−1j=0 ηj = 1.
We will also extend to multivariate Gaussian distributions with unknown covariance. X | (Z = j) ∼Nd(µj ,Σj).
Note that taking K = 2 will give exactly the same algorithm as the previous example.Let
θ := (η0, . . . , ηK−1, µ0, . . . , µK−1,Σ0, . . . ,ΣK−1).
Initialize θ(1). For t = 1, 2, 3 . . .,
• E step. For all 1 ≤ i ≤ n and 0 ≤ j ≤ K − 1, define
γ(t+1)i,j := Pθ(t)(Zi = j | X1, . . . , Xn) =
η(t)j p
µ(t)j ,Σ
(t)j
(Xi)∑K−1`=0 η
(t)` p
µ(t)` ,Σ
(t)`
(Xi).
• M step. For each j = 0, . . . ,K − 1,
η(t+1)j :=
1
n
n∑i=1
γ(t+1)i,j
µ(t+1)j :=
∑ni=1 γ
(t+1)i,j Xi∑n
i=1 γ(t+1)i,j
Σ(t+1)i,j :=
∑ni=1 γ
(t+1)i,j (Xi − µ(t+1)
j )(Xi − µ(t+1)j )>∑n
i=1 γ(t+1)i,j
Repeat until convergence of the marginal log-likelihood.
Formal derivation of the EM algorithm (minorization-maximization perspective). We wantto maximize `M(ψ). We initialize ψ(0). We find a “lower bound” function F0(ψ) that satisfies
• F0 ≤ `M,
• F0(ψ(0)) = `M(ψ(0)).
Let ψ(1) := argmaxψ F0(ψ). Define F1 in a similar way, repeat.Our goal is, given random samplesX1, . . . , Xn, to fit a finite mixture model where Z ∼ Multi(η0, . . . , ηK−1)
and X | (Z = j) ∼ pθj .
pψ(X) =
K−1∑j=0
pθj (X) · ηj
ηj = P(Z = j)
pθj (x) = p(x | Z = j).
We want to infer ψ := (θ0, η0, θ1, η1, . . . , θK−1, ηK−1)> and Z1, . . . , Zn by maximizing the marginal log-likelihood
`M(ψ) :=
n∑i=1
log pψ(Xi).
For j = 0, . . . ,K − 1 we will defineγi,j := Pψ(Zi = j | Xi). (3)
Note that∑K−1j=0 γi,j = 1, and moreover, for each fixed i, the vector (γi,0, . . . , γi,K−1) is a distribution for
Zj .
34

Theorem 4.10 (Jensen’s inequality).logE[X] ≥ E[logX].
For intuition, it is easy to see from a plot of the log function that log x1+x2
2 ≥ log(x1)+log(x2)2 , due to the
concavity of the log function.
-1 -0.5 0 0.5 1 1.5 2 2.5 3 3.5 4 4.5 5
-1
-0.5
0.5
1
Figure 7: log 2+42 ≥
log(2)+log(4)2
Given the current parameter ψ(t), we want to find a lower bound function Ft(ψ) such that
• Ft ≤ `M,
• Ft(ψ(t)) = `M(ψ(t)).
The following holds for any γ := {{γi,j}ni=1}K−1j=0 satisfying γi,j ≥ 0 and
∑K−1j=0 γi,j = 1, so in particular
it holds for γi,j as defined in (3).
`M(ψ) =
n∑i=1
log pψ(Xi)
=
n∑i=1
log
K−1∑j=0
pψ(Xi, Zi = j)
=
n∑i=1
log
K−1∑j=0
γi,jpψ(Xi, Zi = j)
γi,j
=
n∑i=1
logEZi[pψ(Xi, Zi)
γi,j
]“let” Zi ∼ Mult(γi,0, . . . , γi,K−1)
≥n∑i=1
EZi[log
pψ(Xi, Zi)
γi,j
]Jensen’s inequality
=
n∑i=1
K−1∑j=0
γi,j logpψ(Xi, Zi = j)
γi,j
=: Q(γ, ψ)
35

Thus, Q(γ, ψ) is a lower bound for `M , for any ψ and any γ satisfying γi,j ≥ 0 and∑K−1j=0 γi,j = 1.
In general, Q(γ, ψ) is easy to maximize, especially for distributions from the exponential family.
We define Ft(ψ) := Q(γ(t+1), ψ), where γ(t+1)i,j := Pψ(t)(Zi = j | Xi). Note that we have shown that
Ft ≤ `M, but we have not yet shown that the choice of γ(t+1) gives Ft(ψ(t)) = `M(ψ(t)).
Ft(ψ(t)) =
n∑i=1
K−1∑j=0
Pψ(t)(Zi = j | Xi) logpψ(t)(Xi, Zi = j)
Pψ(t)(Zi = j | Xi)
=
n∑i=1
K−1∑j=0
Pψ(t)(Zi = j | Xi) log pψ(t)(Xi)
=
n∑i=1
log pψ(t)(Xi)
K−1∑j=0
Pψ(t)(Zi = j | Xi)
=
n∑i=1
log pψ(t)(Xi)
= `M(ψ(t)).
In particular, our definition of γ(t+1)i,j := Pψ(t)(Zi = j | Xi) is precisely argmaxγ Q(γ, ψ(t)).
This yields the block coordinate ascent interpretation of the EM algorithm. Initialize ψ(0). For t =1, 2, . . .,
• E step.γ(t+1) := argmax
γQ(γ, ψ(t)) = Pψ(t)(Zi = j | Xi).
• M step.ψ(t+1) := argmax
ψQ(γ(t+1), ψ).
The minorization-maximization perspective is similar.
• E step.
γ(t+1) := argmaxγ
Q(γ, ψ(t)) = Pψ(t)(Zi = j | Xi).
We define Ft(ψ) := Q(γ(t+1), ψ), and note that we have shown that Ft ≤ `M and that Ft(ψ(t)) =
`M(ψ(t)).
• M step.
ψ(t+1) := argmaxψ
Ft(ψ).
Theorem 4.11. Under the finite mixture model pψ(x) =∑K−1j=0 ηj · pθj (x) (see above), at the tth iteration
of the EM algorithm (where we know ψ(t)) we do the following.
• E step. Compute γ(t+1)i,j = Pψ(t)(Zi = j | Xi).
• M step. Set
η(t+1)j :=
1
n
n∑i=1
γ(t+1)i,j
θ(t+1)j := argmax
θj
n∑i=1
γ(t+1)i,j log pθj (Xi)
36

[Note that pθj (Xi) := pψ(Xi | Z = j).]
Note that the M step is simply maximizing the expected complete log-likelihood.
Proof. The E step is clear from the above derivation. For the M step,
Ft(ψ) =
n∑i=1
K−1∑j=0
γ(t+1)i,j log
pψ(Xi, Zi = j)
γ(t+1)i,j
.
We can optimize the θj separately.
θ(t+1)j := argmax
θj
n∑i=1
γ(t+1)i,j log pθj ,ηj (Xi, Zi = j)
= argmaxθj
n∑i=1
γ(t+1)i,j log pθj (Xi | Zi = j) · ηj
= argmaxθj
n∑i=1
γ(t+1)i,j log pθj (Xi | Zi = j)
= argmaxθj
n∑i=1
γ(t+1)i,j log pθj (Xi). definition
For η,
Ft(ψ) =
n∑i=1
K−1∑j=0
γ(t+1)i,j log
pψ(Xi | Zi = j)ηj
γ(t+1)i,j
,
so
η(t+1) = argmaxη0,...,ηK−1
n∑i=1
K+1∑j=0
γ(t+1)i,j log ηj subject to
K−1∑j=0
ηj = 1.
The Lagrangian form is
n∑i=1
K−1∑j=0
γ(t+1)i,j log ηj − α
−1 +
K−1∑j=0
ηj
.Taking the derivative w.r.t. ηj and setting it equal to zero gives
α =1
ηj
n∑i=1
γ(t+1)i,j ,
and this holds for all j. Noting that
1 =
K−1∑j=0
ηj =1
α
K−1∑j=0
n∑i=1
γ(t+1)i,j =
n
α,
we have
ηj =1
n
n∑i=1
γ(t+1)i,j .
37

Finally, we would like to show that the EM algorithm converges.
Theorem 4.12. Let (ψ(t))∞t=0 be the sequence generated by the EM algorithm. Then
`M(ψ(t)) ≤ `M(ψ(t+1)).
Proof.
`M(ψ(t)) = Ft(ψ(t)) def. of Ft
≤ Ft(ψ(t+1)) ψ(t+1) := argmaxψ
Ft(ψ)
≤ `M(ψ(t+1)). def. of Ft
Corollary 4.13 (Convergence of the EM algorithm). When the marginal likelihood `M is bounded fromabove, then the EM algorithm converges.
Proof. This is immediate from the previous theorem and the monotone convergence theorem.
Example 4.14 (EM algorithm for the mixture of K Gaussians).
Z ∼ Multi(η0, . . . , ηK−1)
X | (Z = j) ∼ N (µJ ,Σj).
Want to infer θ := {η0, . . . , ηK−1, µ0, . . . , µK−1,Σ0, . . . ,ΣK−1).Initialize θ(0).
• E step.
γ(t+1)i,j := Pθ(t)(Zi = j | Xi) =
η(t)pµ(t)j ,Σ
(t)j
(Xi)∑K−1`=0 η(t)p
µ(t)` ,Σ
(t)`
(Xi)
• M step.
η(t+1)j :=
1
n
n∑i=1
γ(t+1)i,j
µ(t+1)j :=
∑ni=1 γ
(t+1)i,j Xi∑n
i=1 γ(t+1)i,j
Σ(t+1)i,j :=
∑ni=1 γ
(t+1)i,j (Xi − µ(t+1)
j )(Xi − µ(t+1)j )>∑n
i=1 γ(t+1)i,j
4.3 K-means algorithm
Definition 4.15. The K-means algorithm is the limiting procedure by applying the EM algorithm ona sequence of mixtures of K isotropic (spherical) Gaussians which become degenerate (variance shrinks tozero).
An isotropic (spherical) Gaussian distribution is a Gaussian distribution whose covariance matrix isof the form σ2Id.
Let
Z ∼ Multi(η0, . . . , ηK−1)
X | (Z = j) ∼ N (µj , σ2I).
38

Note that not only is each conditional distribution isotropic, but also all the conditional distributions havethe same covariance matrix σ2I.
Taking σ2 → 0 will make the mixture of Gaussians tend to K point masses (degenerate).For the “E step” of the K-means algorithm,
γ(t+1)i,j :=
ηj exp(−‖Xi−µj‖22
2σ2
)∑K−1`=0 η` exp
(−‖Xi−µ`‖22
2σ2
)= ηj
(K−1∑`=0
η` exp
(‖Xi − µj‖22 − ‖Xi − µ`‖22
2σ2
))−1
Taking σ2 → 0 gives
γi,j = 1{‖Xi − µj‖22 < ‖Xi − µ`‖22 for every ` 6= j},
i.e., let γi,j be 1 if and only if µj is the closest cluster center to Xi. [In the unlikely case where there is morethan one index that give the smallest 2-norm, then just randomly pick one.] Then, P(Zi = j | Xi) is either0 or 1, so we can just “set” the value of Zi at this step. This is a “hard” assignment of Zj in contrast to the“soft” assignment in the EM algorithm, where the condition distribution is more general.
So, we define γi,j := 1{Zi = j}. Note that to do the E-step, the only information we need is µ(t)0 , . . . , µ
(t)K−1.
We do not need η(t)0 , . . . , η
(t)K−1 or σ2.
For the “M step” of the K-means algorithm, the updating rule is the same as the EM algorithm, butonly needed for µ0, . . . , µK−1.
µ(t+1)j :=
∑ni=1 γi,jXi∑ni=1 γi,j
=
∑ni=1 1{Zi = j}Xi∑ni=1 1{Zi = j}
The formal description of the K-means algorithm is as follows. Initialize µ(0)0 , . . . , µ
(0)K−1. For t =
0, 1, 2, 3 . . .,
• E step. For i = 1, . . . , n and j = 0, . . . ,K − 1, set
γ(t+1)i,j := 1{‖Xi − µj‖22 < ‖Xi − µ`‖22 for every ` 6= j}.
• M step. For j = 0, . . . ,K − 1, set
µ(t+1)j :=
∑ni=1 γi,jXi∑ni=1 γi,j
Repeat until convergence. [We have not yet proved that this converges.]
K-means EM
Model mixture of K isotropic Gaussians mixture of K Gaussianslimiting operation (mysterious)
Initialization randomly initialize µ0, . . . , µK−1 Initialize µ0, . . . , µK−1 using K-means.For the ηj and Σj , assign points to closest µjtake sample proportion and sample covariance
We have just described the model-based derivation of the K-means algorithm. It is not clear from thelimiting formulation that this is guaranteed to converge. We now present the risk-based perspective, whichis equivalent to the model-based perspective, and from which we can prove convergence.
The goal is to choose K cluster centers to minimize
R(µ0, . . . , µK−1) :=1
n
n∑i=1
min0≤j≤K−1
‖Xi − µj‖22
39

This objective function is very natural: given cluster centers, we assign each point to the closest cluster centerand its “badness” is the sum of the squared distances to the corresponding cluster centers. The minimummakes this optimization problem NP-hard.
Note that this corresponds to the population risk
R(µ0, . . . , µK−1) := E[
min0≤j≤K−1
‖Xi − µj‖22]
The following is an equivalent form of the K-means optimization.
minZi∈{0,...,K−1},
i=1,...,nµ0,...,µK
1
n
n∑i=1
‖Xi − µZi‖22.
Introducing the extra parameters Zi allows us to use block coordinate ascent. Let this objective functionbe F (Z, µ) where Z = (Z1, . . . , Zn) and µ = (µ0, . . . , µK−1). We show that the risk-based perspective isequivalent to the model-based perspective.
Initialize µ(0)0 , . . . , µ
(0)K1
. For t = 0, 1, 2, . . .
• E step. If we have µ and want to update Z, then let Zi be such that µZi is the closest cluster centerto Xi. For all i = 1, . . . , n,
Z(t+1)i := argmin
0≤j≤K−1‖Xi − µ(t)
j ‖22
• M step. If we have Z and want to update µ, then just let µj be the center of the points Xi thatbelong to cluster Zj . For j = 0, . . . ,K − 1,
µ(t+1)j :=
∑ni=1 1{Z(t+1)
i = j}Xi∑ni=1 1{Z(t+1)
i = j}.
Theorem 4.16. The K-mean algorithm converges.
Proof. It is easy to show that the objective function 1n
∑ni=1‖Xi − µZi‖22 is nonincreasing with each E step
and M step. Since it is bounded from below by zero, the monotone convergence theorem implies that itconverges.
4.4 Extensions
Example 4.17 (Hidden Markov model).
Zi ∼ Ber(η)
Xi | (Zi = j) ∼ N (µj ,Σj) j ∈ {0, 1}P(Zk = j | Zk−1 = `) = θj,` Markov chain
Can compute MLE using EM.
Example 4.18 (Factor model).
Z ∼ N (0, Ik)
X | Z ∼ N (µ+ ΛZ,ψ) ψ is diagonal
This is an infinite mixture model because Z is continuous. Still can find MLE using EM.
Example 4.19 (Principal Component Analysis (PCA)).
Z ∼ N (0, Ik)
X | Z ∼ N (µ+ ΛZ, σ2Id)
Taking σ2 → 0, the MLE from EM is PCA.
40