Analysis of Benefits of an Expansion to UDOT's Incident ...
171
Brigham Young University Brigham Young University BYU ScholarsArchive BYU ScholarsArchive Theses and Dissertations 2021-08-03 Analysis of Benefits of an Expansion to UDOT's Incident Analysis of Benefits of an Expansion to UDOT's Incident Management Program Management Program Logan Stewart Bennett Brigham Young University Follow this and additional works at: https://scholarsarchive.byu.edu/etd Part of the Engineering Commons BYU ScholarsArchive Citation BYU ScholarsArchive Citation Bennett, Logan Stewart, "Analysis of Benefits of an Expansion to UDOT's Incident Management Program" (2021). Theses and Dissertations. 9250. https://scholarsarchive.byu.edu/etd/9250 This Thesis is brought to you for free and open access by BYU ScholarsArchive. It has been accepted for inclusion in Theses and Dissertations by an authorized administrator of BYU ScholarsArchive. For more information, please contact [email protected].
Transcript of Analysis of Benefits of an Expansion to UDOT's Incident ...

Brigham Young University Brigham Young University
BYU ScholarsArchive BYU ScholarsArchive
Theses and Dissertations
2021-08-03
Analysis of Benefits of an Expansion to UDOT's Incident Analysis of Benefits of an Expansion to UDOT's Incident
Management Program Management Program
Logan Stewart Bennett Brigham Young University
Follow this and additional works at: https://scholarsarchive.byu.edu/etd
Part of the Engineering Commons
BYU ScholarsArchive Citation BYU ScholarsArchive Citation Bennett, Logan Stewart, "Analysis of Benefits of an Expansion to UDOT's Incident Management Program" (2021). Theses and Dissertations. 9250. https://scholarsarchive.byu.edu/etd/9250
This Thesis is brought to you for free and open access by BYU ScholarsArchive. It has been accepted for inclusion in Theses and Dissertations by an authorized administrator of BYU ScholarsArchive. For more information, please contact [email protected].

Analysis of Benefits of an Expansion to UDOT’s
Incident Management Program
Logan Stewart Bennett
A thesis submitted to the faculty of Brigham Young University
in partial fulfillment of the requirements for the degree of
Master of Science
Grant George Schultz, Chair Mitsuru Saito
Dennis Lee Eggett Gregory Macfarlane
Department of Civil and Environmental Engineering
Brigham Young University
Copyright © 2021 Logan Stewart Bennett
All Rights Reserved

ABSTRACT
Analysis of Benefits of an Expansion to UDOT’s Incident Management Program
Logan Stewart Bennett
Department of Civil and Environmental Engineering, BYU Master of Science
In 2018 the Utah Department of Transportation (UDOT) funded a study in which data
were collected to evaluate performance measures for UDOT’s Incident Management Team (IMT) program. After that study was completed, UDOT received funding to expand the size of its IMT program. Additionally, TransSuite, a data source used by the UDOT Traffic Operations Center to log incident-related data, was reconfigured to provide a higher quantity of performance measure data. This study made use of the new data source, in addition to Computer Aided Dispatch logs provided by the Utah Highway Patrol that were used in the first study, to collect performance measure data of the expanded program and measure the impacts of the IMT program expansion. Using these two datasets, a reanalyzed 2018 dataset and a new 2020 dataset, a comparison of performance measures was made. Performance measures studied included those defined as important by the Federal Highway Administration’s Focus States Initiative in 2009, namely Roadway Clearance Time, Incident Clearance Time, and Response Time. These performance measures were calculated for IMT responders at 320 incidents in 2018 and 289 incidents in 2020. In addition, data regarding the affected volume associated with incidents, the excess travel time accumulated due to incidents, and the excess user cost associated with incident congestion were gathered. In 2018, 188 incidents were analyzed for these user impacts, and in 2020 144 incidents were analyzed. Statistical analyses were conducted to compare IMT performance between the two years and to determine relationships between performance measures and user impacts. The effects of the COVID-19 pandemic affected traffic volumes during this study, and statistical analyses were adjusted to account for volume differences between the two years. Results indicated that the expansion of the IMT program has allowed UDOT to respond faster to incidents, and respond to a larger quantity of incidents over a larger coverage area and in extended operating hours. Performance of the expanded IMT program has had significant effects in reducing incident-related congestion and its costs. Keywords: traffic incident management (TIM), incident management team (IMT), performance measures, response time, roadway clearance time, incident clearance time, excess travel time, excess user cost, COVID-19

ACKNOWLEDGEMENTS
I would first like to acknowledge the Utah Department of Transportation (UDOT) for
their support in championing this project, as well as the individual members of the Technical
Advisory Committee for this study from UDOT and its partners for their guidance and support
during the research project, including John Leonard, Jeff Reynolds, Corey Coulam, Kelly Njord,
Travis Jensen, Chris Rueckert, and Jeff Nigbur.
Secondly, I would like to thank the members of my graduate committee, Dr. Grant G.
Schultz, Dr. Mitsuru Saito, Dr. Dennis L. Eggett, and Dr. Gregory Macfarlane, for the many
hours spent meeting with me, instructing me, and guiding me through this research. I am
thankful for their friendship and for their trust in me. I have felt less like a student and more like
a peer throughout graduate school and this project and I acknowledge and thank them for their
role in my professional development.
Thirdly, I would like to thank the other research assistants who have so greatly assisted
me in completing this research, namely Mitchell G. Hadfield and Joel Hyer. I wish to thank
Mitchell for his tireless and selfless work on the Phase I research that led to this project, and for
his continued support after his own project was completed. I would also like to thank Joel for his
help in Phase II of this project including his countless hours of data collection and his willing
and cheerful attitude throughout the project.
Lastly, I would like to thank my family and friends who have supported me throughout
my schooling. Thanks goes to my parents, Scott and Kirsten Bennett, and my siblings, McKay,
Jess, Lauren, and Chris, for their constant encouragement and faith in me. I thank my friends
Sami Lau, Evan Smith, Max Barnes, Christian Lundskog, and Gina Souriac for attending
graduate school with me, for making this stressful time enjoyable, and for keeping me sane.

iv
TABLE OF CONTENTS
ABSTRACT .................................................................................................................................... ii
TABLE OF CONTENTS ............................................................................................................... iv
LIST OF TABLES ....................................................................................................................... viii
LIST OF FIGURES ....................................................................................................................... xi
1 Introduction .............................................................................................................................. 1
Problem Statement ............................................................................................................1
Objectives .........................................................................................................................2
Scope .................................................................................................................................3
Outline of Report ..............................................................................................................5
2 Literature Review .................................................................................................................... 6
Overview ...........................................................................................................................6
Protocols of Record Keeping for Incident Management Performance Measures .............8
2.2.1 Arizona ..................................................................................................................... 11
2.2.2 Minnesota ................................................................................................................. 11
2.2.3 New York ................................................................................................................. 12
2.2.4 Colorado ................................................................................................................... 12
2.2.5 Nevada ..................................................................................................................... 13
2.2.6 Kentucky .................................................................................................................. 13
2.2.7 Iowa.......................................................................................................................... 14
Developing Interagency Data-Sharing ............................................................................15
2.3.1 Common Data-Sharing Challenges and Considerations .......................................... 15
2.3.2 Factors Leading to Successful Data Exchange and Integration ............................... 18
Strategies for Enhancing Existing TIM Programs ..........................................................21
2.4.1 Information Sharing ................................................................................................. 22
2.4.2 Safety Service Patrols .............................................................................................. 23
2.4.3 Guidance Documents ............................................................................................... 23
2.4.4 Laws ......................................................................................................................... 23
2.4.5 Programs .................................................................................................................. 24
2.4.6 Enhanced CAD ........................................................................................................ 25
v
2.4.7 Tow Truck owner Incentives ................................................................................... 25
Current State of the Practice in Utah ..............................................................................27
Performance Measures Analysis Using Simulation Software ........................................29
Chapter Summary ...........................................................................................................31
3 Data Availability and Collection ........................................................................................... 32
Overview .........................................................................................................................32
UDOT IMT Program Expansion ....................................................................................33
The Effects of COVID-19 on Data Collection ...............................................................40
3.3.1 Traffic Volume Reduction ....................................................................................... 40
3.3.2 Time of Day of Crashes ........................................................................................... 46
Data Availability .............................................................................................................48
3.4.1 The UHP CAD System ............................................................................................ 48
3.4.2 The UDOT TransSuite System ................................................................................ 49
3.4.3 The UDOT PeMS Database ..................................................................................... 49
3.4.4 The UDOT iPeMS Database .................................................................................... 50
Integration of UDOT’s TransSuite Database ..................................................................50
3.5.1 Performance Measures Obtained through CAD Data .............................................. 51
3.5.2 Increase in Relevant Data due to Improvements in TransSuite Data ...................... 52
3.5.3 The Statistical Validity of Using TransSuite ........................................................... 55
Data Collection Methodology .........................................................................................58
3.6.1 Combining CAD and TransSuite Data .................................................................... 60
3.6.2 Calculating Performance Measures ......................................................................... 61
3.6.3 Performance Measures Collected ............................................................................ 62
3.6.4 Identifying Incidents Viable for ETT Analysis ....................................................... 62
3.6.5 Preparing Data for ETT Analysis ............................................................................ 62
3.6.6 Calculating ETT ....................................................................................................... 63
3.6.7 ETT Data Collected ................................................................................................. 64
3.6.8 Storing Incident Data for Analysis .......................................................................... 64
Chapter Summary ...........................................................................................................65
4 Data Reduction ...................................................................................................................... 66
Overview .........................................................................................................................66

vi
Incident Data Collected ...................................................................................................66
Performance Measures ....................................................................................................67
User Impacts ...................................................................................................................72
Chapter Summary ...........................................................................................................80
5 Results of Statistical Analyses ............................................................................................... 82
Overview .........................................................................................................................82
Performance Measures ....................................................................................................85
5.2.1 RCT vs. Number of IMTs ........................................................................................ 87
5.2.2 RCT vs. Number of Lanes at Bottleneck ................................................................. 89
5.2.3 RCT vs. Number of Lanes Closed ........................................................................... 92
5.2.4 RCT vs. Number of Available Lanes ....................................................................... 93
5.2.5 RCT vs. Time of Day ............................................................................................... 96
5.2.6 RCT vs. RT .............................................................................................................. 99
User Impacts .................................................................................................................100
5.3.1 ETT and EUC vs. Number of IMTs ....................................................................... 102
5.3.2 ETT and EUC vs. Number of Lanes at Bottleneck ................................................ 106
5.3.3 ETT and EUC vs. Number of Lanes Closed .......................................................... 107
5.3.4 ETT and EUC vs. Number of Available Lanes ..................................................... 111
5.3.5 ETT and EUC vs. Time of Day ............................................................................. 111
5.3.6 ETT and EUC vs. RT ............................................................................................. 115
5.3.7 ETT and EUC vs. RCT .......................................................................................... 119
5.3.8 ETT and EUC vs. ICT ........................................................................................... 120
Chapter Summary .........................................................................................................121
6 Conclusions and Recommendations .................................................................................... 125
Summary .......................................................................................................................125
Findings.........................................................................................................................125
6.2.1 Data Reduction....................................................................................................... 126
6.2.2 Statistical Analyses ................................................................................................ 130
Limitations and Challenges...........................................................................................132
Recommendations .........................................................................................................133
Future Research Recommendations ..............................................................................134
vii
References ................................................................................................................................... 136
List of Acronyms ........................................................................................................................ 139
Appendix A. Expanded IMT Coverage Areas ........................................................................ 142
Appendix B. Statistical Results of ICT ................................................................................... 147
B.1 Performance Measures ..................................................................................................147
B.1.1 ICT vs. Number of IMTs ....................................................................................... 147
B.1.2 ICT vs. Number of Lanes at Bottleneck ................................................................ 149
B.1.3 ICT vs. Number of Lanes Closed .......................................................................... 150
B.1.4 ICT vs. Number of Available Lanes ...................................................................... 152
B.1.5 ICT vs. Time of Day .............................................................................................. 153
B.1.6 ICT vs. RT ............................................................................................................. 155
Appendix C. Statistical Results oF UHP Performance ........................................................... 156
C.1 User Impacts .................................................................................................................156
C.1.1 ETT and EUC vs. UHP RT .................................................................................... 156
C.1.2 ETT and EUC vs. UHP ICT .................................................................................. 157
viii
LIST OF TABLES
Table 2-1: Comparison of Three States that Use Incentive-Based Towing ...................................26
Table 3-1: Time of Day of Incidents..............................................................................................47
Table 3-2: Comparison of UHP, UDOT, and KABCO Crash Severity Classifications ................49
Table 3-3: UHP Timestamps and Corresponding Times of Interest..............................................52
Table 3-4: Data Funnel for 2018 Data Collecting Using CAD Only ............................................53
Table 3-5: Data Funnel for 2018 Data Collected Using CAD+TransSuite Data ...........................53
Table 3-6: Data Funnel for 2020 Data Collected Using CAD+TransSuite Data ...........................54
Table 3-7: Two Tailed Paired t-test of RCT Data ..........................................................................56
Table 4-1: Reductions in User Impacts Between 2018 and 2020 ..................................................78
Table 4-2: 2018 EUC Estimates ....................................................................................................79
Table 4-3: 2020 EUC Estimates ....................................................................................................79
Table 4-4: Differences in EUC Estimates Between 2018 and 2020 ..............................................79
Table 4-5: Percent Difference in EUC Estimates Between 2018 and 2020 ..................................80
Table 5-1: Significance Scale Notation .........................................................................................84
Table 5-2: Significance of RCT vs. Number of IMTs ...................................................................87
Table 5-3: Analysis of RCT on Number of IMTs..........................................................................87
Table 5-4: Significance of RCT vs. Number of Lanes at Bottleneck ............................................90
Table 5-5: Analysis of RCT vs. Number of Lanes at Bottleneck ..................................................90
Table 5-6: Significance of RCT vs. Number of Lanes Closed ......................................................92
Table 5-7: Analysis of RCT vs. Number of Lanes Closed ............................................................92
Table 5-8: Significance of RCT vs. Number of Available Lanes ..................................................94
Table 5-9: Analysis of RCT on Number of Available Lanes ........................................................95
Table 5-10: Time of Day of Incidents ............................................................................................96
Table 5-11: Significance of RCT vs. Time of Day ........................................................................97
Table 5-12: Analysis of RCT vs. Time of Day ..............................................................................97
Table 5-13: Solution of Fixed Effects for Regression of RCT vs. RT and Crash Type ................99
Table 5-14: Analysis of RCT on RT ..............................................................................................99
Table 5-15: Fixed Effects for Regression of ETT vs. Number of IMTs ......................................102
Table 5-16: Fixed Effects for Regression of EUC vs. Number of IMTs .....................................102

ix
Table 5-17: Significance of IMT Program Size vs. ETT for Number of IMTs ...........................103
Table 5-18: Significance of IMT Program Size vs. EUC for Number of IMTs ..........................103
Table 5-19: Analysis of IMT Program Size vs. ETT for Number of IMTs .................................104
Table 5-20: Analysis of IMT Program Size vs. EUC for Number of IMTs ................................104
Table 5-21: Significance of IMT Program Size vs. ETT for Lanes at Bottleneck ......................107
Table 5-22: Significance of IMT Program Size vs. EUC for Lanes at Bottleneck ......................107
Table 5-23: Significance of IMT Program Size vs. ETT for Lanes Closed ................................107
Table 5-24: Significance of IMT Program Size vs. EUC for Lanes Closed ................................108
Table 5-25: Analysis of IMT Program Size vs. ETT for Lanes Closed ......................................108
Table 5-26: Analysis of IMT Program Size on EUC for Lanes Closed ......................................108
Table 5-27: Significance of IMT Program Size vs. ETT for Number of Available Lanes ..........111
Table 5-28: Significance of IMT Program Size vs. EUC for Number of Available Lanes .........111
Table 5-29: Significance of IMT Program Size vs. ETT for Time of Day ..................................112
Table 5-30: Significance of IMT Program Size vs. EUC for Time of Day .................................112
Table 5-31: Analysis of ETT vs. Time of Day ............................................................................112
Table 5-32: Analysis of EUC vs. Time of Day ............................................................................113
Table 5-33: Fixed Effects for Regression of ETT vs. RT ............................................................115
Table 5-34: Fixed Effects for Regression of EUC vs. RT ...........................................................115
Table 5-35: Solution for Fixed Effects for Regression of ETT vs. RT ........................................116
Table 5-36: Solution for Fixed Effects for Regression of EUC vs. RT .......................................117
Table 5-37: Analysis of IMT Program Size vs. ETT for RT .......................................................118
Table 5-38: Analysis of IMT Program Size on EUC vs. RT .......................................................119
Table 5-39: Analysis of IMT Program Size vs. ETT for RCT ....................................................119
Table 5-40: Analysis of IMT Program Size vs. EUC for RCT ....................................................119
Table 5-41: Analysis of IMT Program Size vs. ETT for IMT ICT .............................................120
Table 5-42: Analysis of IMT Program Size vs. EUC for IMT ICT .............................................120
Table 5-43: Summary of Analyses of ETT vs. Performance Measures ......................................123
Table 5-44: Summary of Analyses of EUC vs. Performance Measures ......................................123
Table 6-1: Data Funnel for 2018 Data Collected Using CAD Data Only ...................................126
Table 6-2: Data Funnel for 2018 Data Collected Using CAD+TransSuite Data .........................126
Table 6-3: Reductions in User Impacts Between 2018 and 2020 ................................................129

x
Table 6-4: 2018 EUC Estimates ..................................................................................................130
Table 6-5: 2020 EUC Estimates ..................................................................................................130

xi
LIST OF FIGURES
Figure 2-1: TIM timeline .................................................................................................................7
Figure 2-2: FDOT TIM dashboard ................................................................................................20
Figure 2-3: Coalition of stakeholder agencies with respected roles in ICS ...................................25
Figure 2-4: Histogram of RTs for first responding IMT using all CAD data. ...............................28
Figure 3-1: Centerline miles covered by IMTs before and after expansion. .................................34
Figure 3-2: Centerline interstate miles covered before and after expansion. ................................35
Figure 3-3: Percentage of centerline miles covered by IMTs that are on interstates
before and after expansion. .........................................................................................35
Figure 3-4: Map of IMT coverage area in Region 1 before and after expansion. .........................37
Figure 3-5: Map of IMT coverage area in Region 2 before and after expansion. .........................37
Figure 3-6: Map of IMT coverage area in Region 3 before and after expansion. .........................38
Figure 3-7: Map of IMT coverage area in Region 4 before and after expansion. .........................38
Figure 3-8: Average difference between 2018 and 2020 daily traffic volumes by month
on I-15 southbound. ....................................................................................................41
Figure 3-9: Comparison of March 2018 vs. 2020 CAD incident data. ..........................................42
Figure 3-10: Comparison of September 2018 vs. 2020 CAD incident data. .................................43
Figure 3-11: Comparison of March incidents with IMTs by year. ................................................44
Figure 3-12: Comparison of September incidents with IMTs by year. .........................................44
Figure 3-13: Comparison of IMT response distributions by year. .................................................45
Figure 3-14: Comparison of UHP response distributions by year. ................................................46
Figure 3-15: Comparison of incidents in differing times of day by year. ......................................47
Figure 3-16: Comparison of RCT distributions between CAD and TransSuite. ...........................56
Figure 3-17: Difference between RCTs determined by CAD and CAD+TransSuite. ...................57
Figure 3-18: Data collection methodology flowchart. ...................................................................59
Figure 4-1: Boxplot showing spread of 2018 IMT performance measures by crash type. ............67
Figure 4-2: Boxplot showing spread of 2020 IMT performance measures by crash type. ............68
Figure 4-3: 2018 distribution of RT. ..............................................................................................69
Figure 4-4: 2020 distribution of RT. ..............................................................................................69
Figure 4-5: 2018 distribution of RCT. ...........................................................................................70

xii
Figure 4-6: 2020 distribution of RCT. ...........................................................................................71
Figure 4-7: 2018 distribution of ICT. ............................................................................................71
Figure 4-8: 2020 distribution of ICT. ............................................................................................72
Figure 4-9: 2018 RT vs. EUC. .......................................................................................................73
Figure 4-10: 2020 RT vs. EUC. .....................................................................................................73
Figure 4-11: 2018 RCT vs EUC. ...................................................................................................74
Figure 4-12: 2020 RCT vs. EUC. ..................................................................................................74
Figure 4-13: 2018 ICT vs. EUC. ....................................................................................................75
Figure 4-14: 2020 ICT vs. EUC. ....................................................................................................75
Figure 4-15: Comparison of average EUCs by number of responding IMTs. ...............................77
Figure 5-1: Linear relationship between RCT and ICT in 2018. ...................................................86
Figure 5-2: Linear relationship between RCT and ICT in 2020. ...................................................86
Figure 5-3: RCT vs. number of responding IMTs. ........................................................................89
Figure 5-4: RCT vs. number of lanes at the bottleneck. ................................................................91
Figure 5-5: RCT vs. number of lanes closed. ................................................................................93
Figure 5-6: Incident visualization showing time length of lane closures. .....................................94
Figure 5-7: RCT vs. number of available lanes. ............................................................................95
Figure 5-8: RCT vs. time of day. ...................................................................................................97
Figure 5-9: Estimates of ETT vs. year and number of IMTs. ......................................................105
Figure 5-10: Estimates of EUC vs. year and number of IMTs. ...................................................105
Figure 5-11: Estimates of ETT by program size and number of lanes closed. ............................109
Figure 5-12: Estimates of EUC by program size and number of lanes closed. ...........................110
Figure 5-13: Estimates of ETT vs. time of day. ...........................................................................114
Figure 5-14: Estimates of EUC vs. time of day. ..........................................................................114
Figure 5-15: Summary of analyses on ETT by performance measures. ......................................123
Figure 5-16: Summary of analyses on EUC by performance measures. .....................................124
Figure 6-1: 2018 distribution of RT. ............................................................................................127
Figure 6-2: 2020 distribution of RT. ............................................................................................128

1
1 INTRODUCTION
Problem Statement
The Phase I study of the Incident Management Team (IMT) program of the Utah
Department of Transportation (UDOT) found that UDOT and the Utah Highway Patrol (UHP)
had the data necessary to evaluate incident management performance measures, with the
exception of one data point related to incident management activities. That data point was the
time when all lanes become open again (T5) and capacity is restored (Schultz et al. 2019). The
UHP maintains the Computer Aided Dispatch (CAD) that contains activities of both UHP
officers and UDOT’s IMTs at crash sites. UDOT maintains two traffic-related datasets: the
Performance Measurement System (PeMS), which collects data from sensors, and Iteris
Performance Measurement System (iPeMS, now Iteris ClearGuide), which collects data from
probe vehicles. Both datasets help the analyst to estimate the time of incident occurrence and the
time of complete incident clearance. UDOT’s Traffic Operation Center (TOC) maintains
TransSuite data that can be used for the analysis, but during the Phase I study it was found that
extracting the T5 data from TransSuite was difficult. Instead, to accomplish the objective of the
study, UHP officers were requested to collect T5 data from March to August 2018 manually as
they assisted crash victims and aided IMTs in clearing congestion. This additional time data
made the completion of the study more consistent. Using the data collected in the 6-month
period, incident management performance measures were analyzed and user costs due to crashes

2
were estimated under the current IMT program. It was found that decreasing even a few minutes
of response time (RT) and roadway clearance time (RCT) would result in a substantial decrease
in user costs that would make the IMT program a worthwhile investment.
While the Phase I study was underway, the Utah State Legislature approved funding to
expand the operation of the IMT program. The new funding allowed UDOT to increase the
number of IMTs, both personnel and equipment, by 12 units. The Phase I study showed that
reduction in RT would help UDOT reduce the delay and user costs due to crashes. The expanded
IMT program, which began operation in the spring of 2019, provided an opportunity to validate
the outcome of the Phase I study using field data. This Phase II study involved the collection of a
new set of performance measures data in spring and summer (March to September) 2020 when
the new expanded IMT program had been well established. It also involved collection of
performance measure data from March to September 2018 using the newly available TransSuite
data. This allowed for comparison of IMT performance between the two years to help UDOT
evaluate the effectiveness of the IMT program and the impacts of the program expansion.
Objectives
The following are the objectives selected for the Phase II study of the IMT program. Note
that because of the comparative nature of the study, the scope included only IMT activities on
freeways or access-controlled highways owned by UDOT because most pre-expansion IMT
activities took place on those types of facilities.
3
• Identify any changes in the way UDOT’s IMT program is executed. Any changes that are
taking place needed to be identified so that the effects of such changes could be analyzed.
• Analyze the Phase I data including the lane closure data and evaluate if the analysis
results could be improved.
• Collect performance measures data of the expanded IMT program.
• Identify the reduction in RCT and incident clearance time (ICT).
• Use statistical analysis methods to evaluate how much improvement the expanded IMT
program can achieve over the previous IMT program.
Scope
A kick-off meeting was held with the UDOT Champion and Research Division
representatives to identify members of the Technical Advisory Committee (TAC), the majority
of whom had previously worked with the Brigham Young University (BYU) research team in
Phase I of the project. TAC members contributed their expertise of UDOT’s IMT program and
the several data sources to guide the research team in their efforts. The kick-off meeting involved
discussion of the possibility of using TransSuite data to aid in performance measurement as a
way to collect data for a larger sample of incidents, verify the accuracy of data entries from both
UHP and TOC operators, and to evaluate the need for additional training and personnel at the
TOC.
A comprehensive literature review on Traffic Incident Management (TIM) and its
performance measures was conducted. The research team accessed multiple online sources
through the Harold B. Lee Library of BYU, including issues of the Transportation Research
Record: Journal of the Transportation Research Board, the American Society of Civil Engineers

4
Journal of Transportation Engineering, and other publications. TIM national analysis reports
published by the Federal Highway Administration (FHWA) Office of Operations, such as those
written as part of the Every Day Counts Round 4 (EDC-4) initiative, were also reviewed.
A methodology for data collection was modified using the TransSuite database and
incidents were analyzed for performance measures, particularly relating to the RT, RCT, and
ICT. Performance measure data were collected again for the Phase I time period using this new
methodology and new performance measure data were collected for a corresponding time period
in 2020. Using the PeMS and iPeMS databases, data relating to incident occurrence and the time
when the queue completely dissipated were also collected to evaluate incidents for excess travel
time (ETT), affected volume (AV), and excess user cost (EUC). Performance measure and user
impact data were reduced and prepared for statistical analyses.
After new datasets were compiled for 2018 and 2020, statistical analyses were performed
using Base SAS software (Base SAS 9.4 2013). Significance of relationships between
performance measures and user impacts as well as other incident characteristics were determined
and quantified through regression analysis. Due to the effects of the COVID-19 pandemic, that
affected data collection during the Phase II study, analyses were performed in a way to account
for the impact of COVID-19 on traffic volumes, which differed between the two study periods.
Comparisons of performance measures and user impacts between the two years were then
performed to allow the research team to evaluate the benefits of the expansion to UDOT’s IMT
program.
5
Outline of Report
This report is organized into the following chapters:
1. Introduction
2. Literature Review
3. Data Availability and Collection
4. Data Reduction
5. Results of Statistical Analyses
6. Conclusions and Recommendations
Chapter 2 is a literature review that describes performance measures for IMTs. It also
discusses how other states are collecting and using incident management data to improve
operations as well as the current state of the practice in Utah given the findings from the Phase I
study. Chapter 3 includes details about the expansion to UDOT’s IMT program. It discusses the
effects of COVID-19 on the data collection process and how data collection was adapted to meet
that challenge. Chapter 3 also explains the available data and the process used to collect
performance measures and to estimate the ETT, AV, and EUC of incidents. Chapter 4 presents
the collected data graphically and numerically. Chapter 5 presents results of the statistical
analyses performed. Chapter 6 presents conclusions that were drawn from the results of the
analyses. The chapter also contains recommendations for further research.
Included in the Appendices are the incident data compiled by the research team over the
course of the project and the results of statistical analyses not included in the body of the report.

6
2 LITERATURE REVIEW
Overview
This chapter presents the findings from the literature review conducted to acquire
information on TIM performance measures as well as the changes to the TIM program in the
state of Utah. This literature review adds to findings from the literature review performed by
Schultz et al. (2019) for Phase I of this study to show additional development of TIM
performance analysis. In accordance with the conclusions of the FHWA Focus States Initiative
(FSI), the performance measures under consideration for TIM are (Owens et al. 2009):
• RCT, defined as the time between the first recordable awareness of the incident by a
responsible agency and the first confirmation that all lanes become available for traffic
flow.
• ICT, defined as the time between the first recordable awareness of the incident by a
responsible agency and the time at which the last responder has left the scene.
• Secondary crashes.
Figure 2-1 shows the timeline of incident response and clearance performed by TIM.
These performance measures are used to improve the efficiency and effectiveness of TIM
programs by providing standards for data collection and comparison.

7
Figure 2-1: TIM timeline (adapted from Conklin et al. 2013).
A key part of the Moving Ahead for Progress in the 21st Century Act (MAP-21 2012) was
to invest resources in a TIM performance measurement program. TIM performance has direct
impacts on congestion, travel-time, and safety. Investing time and resources into collecting TIM
performance measure data will help provide state departments of transportation (DOTs), as well
as other state and local response agencies like law enforcement, fire and medical, with objective
means for evaluating their incident management programs to improve the performance of U.S.
roadway systems. As defined by the National Traffic Incident Management Coalition (NTIMC
2007), benefits of measuring TIM performance include:
• Increasing transparency and accountability.
• Justifying program funding.
• Improving driving conditions and safety.
• Improving communication and coordination between TIM partners.
• Making progress toward the achievement of national goals.

8
Data sources that are used to analyze TIM performance measures include TOCs, law
enforcement, fire and emergency medical services, towing companies, and 511 systems. The data
collected by these agencies are used to determine average ICTs and RCTs as well as to track
trends throughout the roadway network.
The information in this review was gathered from literature published by state DOTs,
national analysis reports published by the FHWA Office of Operations, state DOT TIM-related
dashboards, and through FHWA webinars.
The objectives of this literature review are to identify and summarize literature related to
TIM to determine protocols of record keeping for TIM performance measures, determine how to
develop interagency data-sharing and overcome associated challenges, identify strategies for
enhancing current TIM programs, review the current state of the practice in Utah, review the past
use of simulation in TIM performance measures analysis. Findings are presented in the following
sections.
Protocols of Record Keeping for Incident Management Performance Measures
Each DOT collects TIM-related data differently due to the variety of data sources
available. In 2011, the FHWA encouraged states throughout the U.S. to evaluate their TIM
programs and share their analyses and findings. Through this effort, the FHWA was able to
examine performance measures that were being collected and how they were being collected
(Owens et al. 2009).
Many data sources are emerging as useful sources for gathering and evaluating TIM
performance data. According to the National Cooperative Highway Research Program (NCHRP)

9
Report 904, “Leveraging Big Data to Improve Traffic Incident Management” (Pecheux et al.
2019), some current and emerging methods of collecting and compiling incident data include:
• Collection of data from crash reports.
• Integration of Transportation Management Center (TMC) and safety service patrol (SSP)
(i.e., IMT) datasets.
• Integration of TMC and CAD datasets.
• Utilization of crowdsource data and applications that use it, such as Genesis Pulse.
• Utilization of unmanned aerial vehicle technology.
A draft executive summary of the FHWA EDC-4 project reports the national state of the
practice of TIM data reporting, including how various methods are being used to gather TIM
data elements, namely RCT, ICT, and Secondary Crashes (FHWA 2019). The FHWA reports
that using traffic crash reporting:
• Ten states collect ICT.
• Twelve states collect RCT.
• Twenty states collect data that identifies secondary crashes.
• Twenty-four states collect one or more of the three TIM data elements.
• Ten states collect two or more of the three TIM data elements.
The EDC-4 draft executive summary also reports that using data from TMCs:
• Fifteen states collect ICT.
• Seventeen states collect RCT.
• Ten states now count secondary crashes in the TMCs.

10
• Ten states noted improvements in the quality of TIM data collected in the TMCs.
• Eight states improved TMC training to better handle TIM data.
The EDC-4 draft executive summary reports that using SSP data, the following TIM data
accomplishments were noted:
• Two additional states now capture RCT through the SSPs operating in the field.
• One additional new state now captures ICT through SSPs.
• Three additional new states now collect secondary crashes via the SSPs.
• Fourteen states noted improvements in the quality of TIM data obtained by SSPs.
• Eight states improved SSP training to improve TIM data.
Finally, the EDC-4 draft executive summary reports that during the project the following
improvements relating to the use of CAD data were made:
• One state demonstrated the use of California Highway Patrol CAD data as a good
statewide source of data for ICT (as well as response times).
• Sixteen states have plans to improve CAD integration.
An understanding of how other states gather and use TIM data is helpful in identifying
beneficial practices. The NCHRP Report 07-20 by Jodoin et al. (2014) presents the findings from
case studies of 14 states that institutionalized the collection and use of TIM performance measure
data for improving their TIM programs. In these case studies, examples are provided of how data
were collected, analyzed, and reported. In addition to the NCHRP 07-20 report, pertinent TIM-
related studies from individual state DOTs have been reviewed to determine the current state of

11
the practice. A summary of TIM activities in Arizona, Minnesota, New York, Colorado, Nevada,
Kentucky, and Iowa is presented in the following subsections.
2.2.1 Arizona
The Arizona Department of Transportation (ADOT) uses Traffic and Criminal Software
that allows law enforcement and ADOT to share its TIM data electronically (Jodoin et al. 2014).
This allows for efficient and uniform data between both agencies. ADOT also partnered with the
Arizona Department of Public Safety to conduct a study on the impact of secondary crashes
within the state of Arizona (Rensel et al. 2018). The quality of TIM data collected was greatly
improved after data recording was made electronic and the location of each crash was
documented with global positioning system (GPS) coordinates. TIM data were also used to
develop a secondary crash risk model. TIM strategies were evaluated based on effectiveness, the
degree of risk presented to IMTs and State Highway Patrol members, and how it would affect the
rate of secondary crashes. The components of the formula were a quantification of the
effectiveness of the selected TIM strategy used, the percent likelihood of a secondary crash
occurring, and the consequential costs of a crash.
2.2.2 Minnesota
The Minnesota DOT (MnDOT) integrated its advanced traffic management system
(ATMS) with its CAD system to reduce redundancy, errors, and time associated with manual
input of data. MnDOT reports that their ATMS provides more accurate incident start times than
before because of collaboration from Minnesota state troopers, 911 dispatchers, and MnDOT
TMC operators. The Regional TMC can receive incident start times, officer arrival times, and
ICTs directly from state troopers (Jodoin et al. 2014).
12
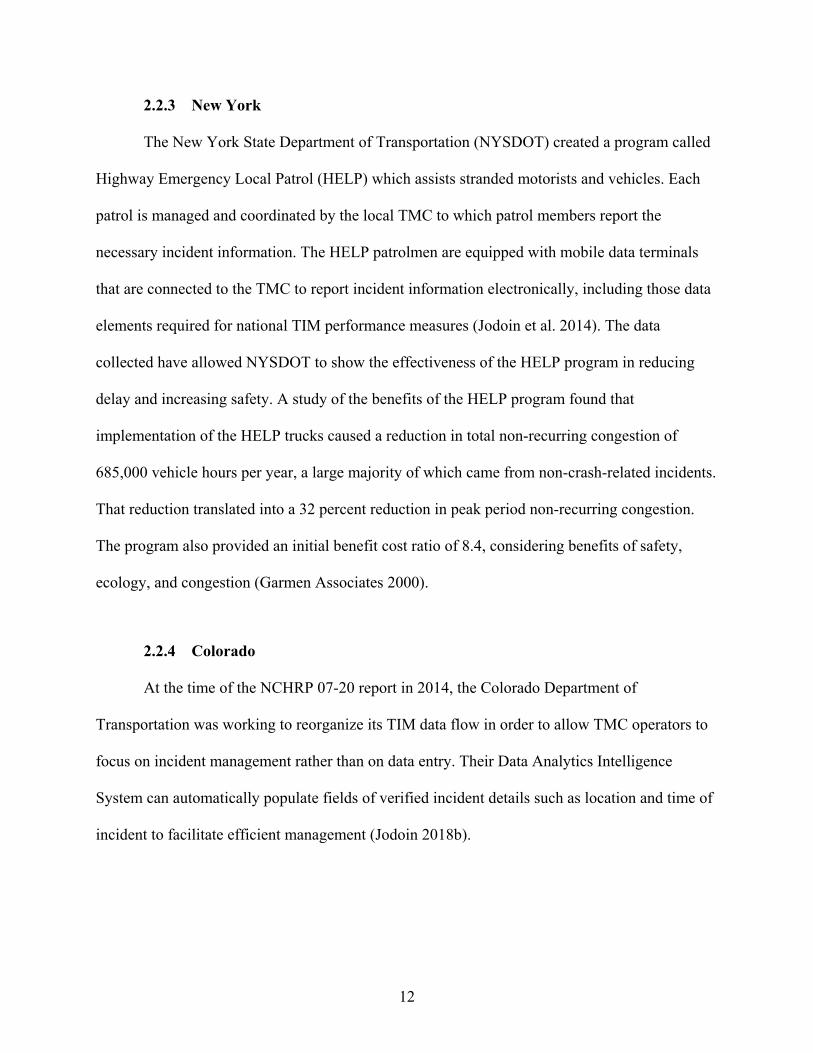
2.2.3 New York
The New York State Department of Transportation (NYSDOT) created a program called
Highway Emergency Local Patrol (HELP) which assists stranded motorists and vehicles. Each
patrol is managed and coordinated by the local TMC to which patrol members report the
necessary incident information. The HELP patrolmen are equipped with mobile data terminals
that are connected to the TMC to report incident information electronically, including those data
elements required for national TIM performance measures (Jodoin et al. 2014). The data
collected have allowed NYSDOT to show the effectiveness of the HELP program in reducing
delay and increasing safety. A study of the benefits of the HELP program found that
implementation of the HELP trucks caused a reduction in total non-recurring congestion of
685,000 vehicle hours per year, a large majority of which came from non-crash-related incidents.
That reduction translated into a 32 percent reduction in peak period non-recurring congestion.
The program also provided an initial benefit cost ratio of 8.4, considering benefits of safety,
ecology, and congestion (Garmen Associates 2000).
2.2.4 Colorado
At the time of the NCHRP 07-20 report in 2014, the Colorado Department of
Transportation was working to reorganize its TIM data flow in order to allow TMC operators to
focus on incident management rather than on data entry. Their Data Analytics Intelligence
System can automatically populate fields of verified incident details such as location and time of
incident to facilitate efficient management (Jodoin 2018b).

13
2.2.5 Nevada
The Nevada Department of Transportation (NDOT) initiated exclusive digital capture of
incident data as of November 1, 2018 using the Waycare mobile app. Waycare uses publicly
available datasets and crowdsourced data to more quickly and accurately identify incidents while
decreasing TIM response times. NDOT reported that using Waycare allows incident information
to reach responders an average of 10-12 minutes before 911 calls. While this does not change the
response time itself, it does reduce the verification time and facilitate preemptive deployment of
troopers to allow responders to report to the scene quicker (Jodoin 2018b).
2.2.6 Kentucky
In 2018 the Kentucky Transportation Center published “Improving the Quality of Traffic
Records for Traffic Incident Management” in which all available data sources were evaluated for
accuracy, accessibility, and extent of coverage. Data sources included Kentucky State Police
(KSP) crash data, TOC incident records, crowdsourced navigation application data, and probe
vehicle data.
The KSP crash database covers incidents across the state and provides the most data for
determining RCT and the number of secondary incidents, but the accuracy of the data and the
amount of detail provided for incidents is limited. There were a number of discrepancies in the
incident data that limited its accuracy and detail such as multiple entries for T1, varied entries for
T5 fluctuating between the time when one or more lanes were opened and when all lanes were
opened, instances where RCTs were negative due to the format in which the times were input by
KSP operators, and secondary crashes consistently reported as false positives due to the
inconsistent definition of a secondary crash. Though there is high level of inaccuracy in the way
14
that secondary crashes are classified, the percentage of correctly classified incidents has
gradually increased over time (Souleyrette et al. 2018).
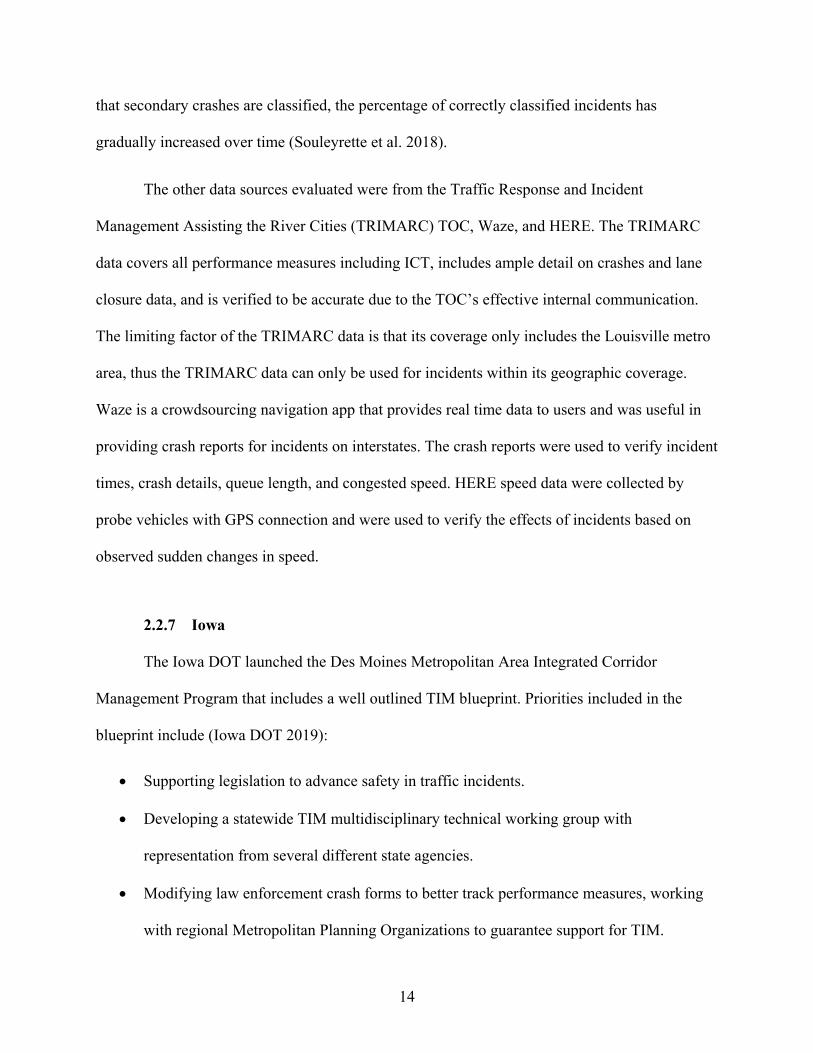
The other data sources evaluated were from the Traffic Response and Incident
Management Assisting the River Cities (TRIMARC) TOC, Waze, and HERE. The TRIMARC
data covers all performance measures including ICT, includes ample detail on crashes and lane
closure data, and is verified to be accurate due to the TOC’s effective internal communication.
The limiting factor of the TRIMARC data is that its coverage only includes the Louisville metro
area, thus the TRIMARC data can only be used for incidents within its geographic coverage.
Waze is a crowdsourcing navigation app that provides real time data to users and was useful in
providing crash reports for incidents on interstates. The crash reports were used to verify incident
times, crash details, queue length, and congested speed. HERE speed data were collected by
probe vehicles with GPS connection and were used to verify the effects of incidents based on
observed sudden changes in speed.
2.2.7 Iowa
The Iowa DOT launched the Des Moines Metropolitan Area Integrated Corridor
Management Program that includes a well outlined TIM blueprint. Priorities included in the
blueprint include (Iowa DOT 2019):
• Supporting legislation to advance safety in traffic incidents.
• Developing a statewide TIM multidisciplinary technical working group with
representation from several different state agencies.
• Modifying law enforcement crash forms to better track performance measures, working
with regional Metropolitan Planning Organizations to guarantee support for TIM.

15
• Committing to ongoing training at a national level and to developing a TIM Incident
Command School.
• Creating a statewide TIM training database.
• Merging incident data with the State Highway Patrol.
Developing Interagency Data-Sharing
One key to the successful integration of TIM performance measures in incident
management is the ability to easily and effectively share data with all responding agencies to
facilitate quick incident response and effective incident management. Collaboration is crucial to
help reduce clearance times on major roadway networks. This section addresses common data-
sharing challenges and considerations as well as factors leading to successful data exchange and
integration by observing examples from various DOTs.
2.3.1 Common Data-Sharing Challenges and Considerations
A general list of data-sharing challenges encountered in computing TIM performance
measure data includes:
• Cost.
• Inconsistent definitions.
• Data availability.
• Data quality.
• Data completeness.
• Data sharing.
• Data exchange.

16
• Data integration.
• Appropriate comparisons.
• Timeliness of data.
With inconsistencies existing among the data collected by agencies involved in TIM,
identifying when the incident was first reported or when all lanes were available for traffic flow
can be difficult.
A typical challenge encountered by DOTs is identifying the times associated with the
ICT. Identifying the time of the first recordable awareness and the time the last responder left the
scene are often difficult. These times can be reported by different agencies, but without a unified
system there can be discrepancies among them, and it can be difficult to determine which
represents the correct ICT. A challenge encountered by the Virginia Department of
Transportation (VDOT) was:
“Smart Traffic Center (STC) operators, safety service patrollers, and
Transportation Emergency Operations Center (TEOC) managers frequently use
variations in nomenclature in describing incident characteristics, and in the
interest of time, operators/patrollers often do not enter complete data...While there
may be two nearly identical managed incidents, in data terms, they may appear
very different and thus will be either analyzed differently or discounted
altogether. They are not relatable in the sense that the STCs, safety service
patrols, and the TEOC use different formats when capturing information on
incidents” (Smith et al. 2005, page 1).

17
To overcome these challenges, the VDOT Statewide Incident Management Committee
came up with three objectives to refine standards for incident performance measures (Smith et al.
2005):
• Establish a common definition of an incident.
• Establish the first of a series of common performance measures for incident management
relative to transportation services in Virginia.
• Identify data and information necessary to provide for the calculation of the measures.
In addition to identifying the times associated with an incident, pinpointing exact
locations of incidents is also a challenge, as was expressed by the Coordinated Highways Action
Response Team (CHART) of the state of Maryland. To better identify incident locations,
CHART recommends using precise geographical coordinates obtained from GPS. Using GPS is
more convenient and accurate than identifying mile markers along the road. Using GPS to report
incident locations would allow CHART and the Maryland Accident Analysis Reporting System
to produce more reliable data (Kim and Chang 2012).
One considerable challenge for managing TIM data involves the large volume of data
produced daily. “Big Data” comes from a variety of sources including national and international
datasets, datasets created by state agencies, crowdsourcing platforms, and social media
platforms. Big Data does not have a restrictive schema. Challenges of using Big Data include
collecting large amounts of data, identifying which data are important, sharing of data, using
common data storage environments, adapting cloud technologies for storage and retrieval, and
structuring data for analysis. The use of Big Data could help improve both TIM practices and the
understanding of their benefits, though the sizeable data requirements for Big Data tools would

18
likely necessitate established national datasets to analyze TIM data since incidents are not
regularly occurring events (Pecheux et al. 2019).
2.3.2 Factors Leading to Successful Data Exchange and Integration
Brooke et al. (2004) reported that interagency exchange of information is the key to
obtaining the most rapid, efficient, and appropriate response to highway incidents from all
agencies. More and more, such information must be shared across system, organizational, and
jurisdictional boundaries.
Similarly, the FHWA FSI on TIM performance measures stated that successful strategies
for developing systems of data exchange focus on developing cooperative relationships with all
agencies involved. Developing a memorandum of understanding that defines roles, developing
outreach materials that document the benefits of TIM performance measures, and establishing
cost-sharing agreements are also ways that lead to successful data exchange and integration
(Owens et al. 2009). A few examples of agencies that have achieved the goal of data exchange
and integration are presented in this subsection.
The city of Austin, Texas built a Combined Transportation, Emergency, and
Communications Center (CTECC) which houses the development and implementation of
integrated data and communication systems. The CTECC houses the Texas Department of
Transportation, the Austin Police Department, the Austin Fire Department, and the Travis
County Emergency Medical Services. With all agencies in one building, the CTECC allows for
easy communication and data sharing among agencies (Carson 2010).

19
The Puerto Rico Highway and Transportation Authority (HTA) developed a mobile app
called Seguro in 2017 for its Highway Service Patrol operators to use. The app allows for
uniform collection of incident details such as operator identification, incident location, incident
type, service type, and RT. The app combines data from all operators to create dashboards
displaying performance measures and other data analyses, which help the HTA in decision-
making, resource allocation, and justification for legislation (Jodoin 2018a).
The Florida Department of Transportation (FDOT) also developed software called
Sunguide for its TMCs. Sunguide has full CAD integration and produces performance measure
reports. The performance measures are calculated from the CAD data and are displayed on a
dashboard to show trends over time, as shown in Figure 2-2 (Jodoin 2018a).
Other solutions to common problems or issues with successful data exchange and
integration include (Owens et al. 2009):
• Establishing agreements between law enforcement and DOTs to preclude compromising
sensitive data.
• Establishing technical committees to develop common data dictionaries.
• Establishing common timestamps and common geography coordinates for data reporting.
• Identifying and agreeing to a defined standard or standards for data exchange.
• Identifying and agreeing upon methods for integrating text, video, and audio formats for
data exchange.
• Identifying and agreeing upon consistent data collection practices within and between
agencies.

20
Figure 2-2: FDOT TIM dashboard (Jodoin 2018a).
Collaboration can take place when decision makers from all organizations are made
aware of the benefits of sharing collected data. Suggested TIM outreach activities recommended
for helping decision makers through this process are conferences and events, structured
workshops, personal contact with target agencies, and contacting the press (Owens et al. 2009).
Information regarding successful data exchange is found in the Highway Capacity
Manual, which states that an interoperable data exchange system is the most efficient way to
perform real-time data exchange. This kind of data exchange can make intelligent transportation
systems more effective in gathering and disseminating information (TRB 2010).

21
Regarding data exchange that utilizes Big Data analytics, Pecheux et al. (2019) clarifies
that data must be “open.” This means that data must be available in its totality for reuse by
anyone for any purpose. Data must be available for redistribution, with permissions for
manipulation, reorganization, or combination of the data with any other dataset.
Pecheux et al. (2019) also outlines additional advances that address challenges of data
exchange. For instance, to address the issues stemming from variable nomenclature and
definitions within TIM, this study developed the Incident Response and Clearance Ontology
(IRCO). The goal of IRCO is to provide a uniform way for incident-related data elements to be
expressed. Creation of the ontology was made possible with the help of incident responders in a
workshop as well as literature describing existing traffic incident-related ontologies. According
to the report, “the IRCO attempts to show how the TIM-relevant datasets are related to each
other” (Pecheux et al. 2019, page 4).
Strategies for Enhancing Existing TIM Programs
The NTIMC created the National Unified Goal for TIM, which includes (NTIMC 2007):
• Responder safety.
• Safe, quick clearance.
• Prompt, reliable, interoperable communications.
To achieve these goals, NTIMC set up 18 strategies including (NTIMC 2007):
• TIM partnerships and programs.
• Multidisciplinary national incident management system and TIM training.
• Goals for performance and progress.

22
• TIM technology.
• Effective TIM policies.
• Awareness and education partnerships.
• Recommended practices for responder safety.
• “Move over” and “slow down” laws.
• Driver training and awareness.
• Multidisciplinary TIM procedures.
• Response and clearance time goals.
• Availability 24/7.
• Multidisciplinary communications practices and procedures.
• Prompt, reliable responder notification.
• Interoperable voice and data networks.
• Broadband emergency communications systems.
• Prompt, reliable traveler information systems.
• Partnerships with news media and information providers.
2.4.1 Information Sharing
In a similar manner, NCHRP Report 520 by Brooke et al. (2004), titled “Sharing
Information between Public Safety and Transportation agencies for Traffic Incident
Management” lists steps that can be taken to improve TIM programs:
• Establish working-level relationships with responders from every agency that works on
incidents in the area of interest.

23
• Ensure that working-level relationships are supported by standardized operational
procedures.
• Create interagency agreements and system interconnections with key agencies involved.
• Institutionalize senior-level relationships among key agencies through a combination of
policy agreements, interagency organizations, coordinated budget planning, and other
processes to ensure that operational partnerships survive changes in political or
managerial leadership.
2.4.2 Safety Service Patrols
SSPs have also been effective in improving TIM. Service patrols can be publicly operated
by transportation or police departments or privately operated. The FHWA promotes full-function
service patrols on all urban freeways 24/7. The FHWA also encourages the sustainability of
service patrols by promoting public agency cost sharing and public/private ownerships (Carson
2010).
2.4.3 Guidance Documents
Shah et al. (2017) reviewed existing methods of evaluating TIM and benefit
quantification, then compared the strategies with input from various TIM stakeholder agencies to
develop a guidance document. This guidance document can be used to help any TIM-related
organization with evaluation and performance measurement.
2.4.4 Laws
Laws can be created to improve TIM. For instance, state Move Over laws require drivers
approaching the scene of an incident, where emergency responders are present, to change lanes if

24
possible or to reduce their speed to prevent potential risks to the responders. At the time of her
study, Carson (2010) noted that all but two states, Hawaii and New York, had enacted Move
Over laws. All 50 states have now enacted these laws (AAA 2021).
Another example is state Driver Removal laws, which are considered as key strategies
that allow for quick clearance of non-injury, property damage only (PDO) crashes. PDO crashes
account for the majority of crashes that occur on U.S. roadways. These laws encourage drivers
involved in incidents to move their vehicle out of the travel lanes. Driver Removal laws help
enhance the overall safety of the vehicles involved as well as those approaching the incident. At
the time of her study, Carson (2010) noted that about half of U.S. states, including Florida,
Georgia, and Texas, for example, had enacted these laws.
2.4.5 Programs
Programs can also be implemented to improve TIM. The NCHRP Report 07-20 by
Jodoin et al. (2014) suggests that to improve TIM functionality and efficiency, coalitions should
be made with nontraditional partners such as towing contractors, coroners, and those in the
trucking industry. These partners, in addition to emergency response and transportation agencies,
can cooperate to efficiently decrease clearance times.
Another example of a program that may help improve TIM functionality is the Incident
Command System (ICS), implemented by the South Carolina Department of Transportation
(SCDOT). ICS is a tactical protocol of unified command and communication for incident
management that was developed by the National Incident Management System in the 1970s. The
primary functions of ICS agencies are shown in Figure 2-3, which displays the structure of ICS

25
with responsibilities and roles for each agency. SCDOT accomplished a 25 percent reduction in
incident duration by implementing these strategies (Ogle et al. 2017).
Figure 2-3: Coalition of stakeholder agencies with respected roles in ICS (Ogle et al. 2017).
2.4.6 Enhanced CAD
Enhanced CAD is a system that is continuously updated with emergency vehicle
locations to allow for quicker dispatch times. This system uses automatic vehicle location
technologies to locate, route, and dispatch the closest emergency vehicles to the scene. This is
often referred to as optimized dispatch (Ogle et al. 2017).
2.4.7 Tow Truck owner Incentives
Table 2-1 provides detail into how the Washington State Department of Transportation
(WSDOT), the Georgia Department of Transportation (GDOT), and FDOT use incentive-based
towing programs.

26
Table 2-1: Comparison of Three States that Use Incentive-Based Towing (Ogle et al. 2017)
WSDOT GDOT FDOT
Specialized wrecker list for quick clearance?
Major Incident Tow
Towing & Recovery Incentive Program
Rapid Incident Scene Clearance
Separate list for each wrecker category? No No No
Additional training or equipment required? Yes Yes Yes
Required wrecker business hours?
24/7 - 7 days a week 24/7 - 7 days a week
None Established (assume standard 8:00 AM - 5:00 P.M. M-F)
Can passing wrecker respond to accident?
Yes. wrecker would be on a route during
peak
No No
Time allocation wrecker has to arrive
on scene?
15 minutes (business hours)
45 minutes (business hours) 60 minutes
Total time allocation for wrecker to clean
area? 90 minutes 90 minutes 90 minutes
Incentive bonus? $2,500 $2,500 standard +
$600/$1,000 equipment bonus = $3,500 total
$2,500 standard + $1,000 equipment
bonus = $3,500 total
Minimum wrecker requirements?
Two Class C wreckers
Two Class C wreckers and a support vehicle Once Class C wrecker
Reimbursement for services not rendered? $600 $600 $600
Penalized for excessive cleanup
time? No $600 flat or $600/hr. $600/hr.

27
FDOT implemented an incentive program for tow-truck owners who work in areas of
focus for TIM. Quick response and short clearance times lead to monetary gains for the drivers.
Similar to FDOT, other states have started incentive-based programs that reward tow-truck
services for their quick response as well as clearance times. Ogle et al. (2017) studied the
integration of ICS protocol for effective coordination of multi-agency responses to traffic
incidents and analyzed the states’ incentive programs. GDOT implemented this incentive-based
program in 2008 after which average RCT dropped from 216 to 49 minutes.
Current State of the Practice in Utah
In 2018, UDOT worked in conjunction with UHP to determine the availability of TIM
performance measure data and discovered that elements of the UHP CAD system provided the
necessary information to determine performance measures, except the time when all the lanes
became open to traffic (T5 shown in Figure 2-1), which UHP volunteered to collect for a period of
6 months. A study of TIM performance measures in Utah was completed in which data were
collected and analyzed to compare performance measures with user costs due to congestion. The
cost of congestion due to incidents occurring on interstates in UDOT Regions 2 and 3 was
estimated at approximately $58 million per year based on a set of sampled incidents that
contained all the necessary data for analysis (1.3 percent of the entire incident data set collected
from March to August 2018). A reduction in performance measures, such as RT and RCT, was
shown to reduce costs due to congestion (Schultz et al. 2019).
Schultz et al. (2019) also performed statistical analyses based on the sample of incidents
collected and determined relationships between TIM performance measures and user costs in
Utah. They found that on average, for each minute delay of RT for IMTs, 0.8 minutes are added
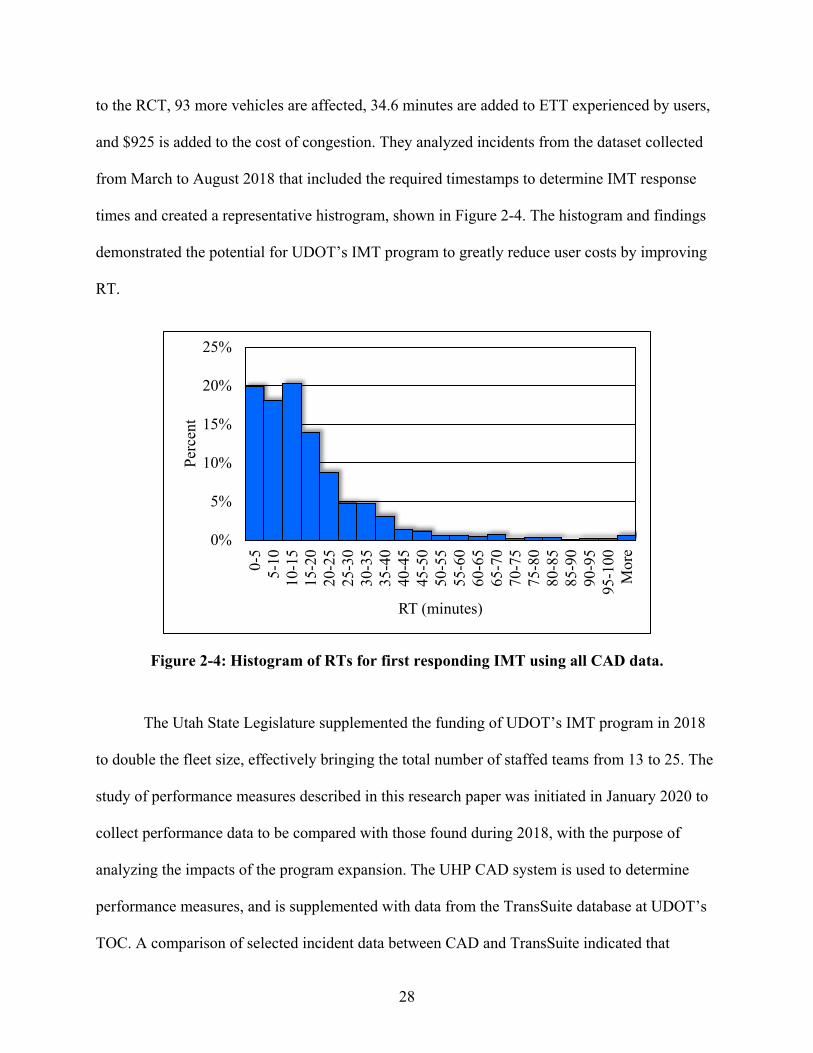
28
to the RCT, 93 more vehicles are affected, 34.6 minutes are added to ETT experienced by users,
and $925 is added to the cost of congestion. They analyzed incidents from the dataset collected
from March to August 2018 that included the required timestamps to determine IMT response
times and created a representative histrogram, shown in Figure 2-4. The histogram and findings
demonstrated the potential for UDOT’s IMT program to greatly reduce user costs by improving
RT.
Figure 2-4: Histogram of RTs for first responding IMT using all CAD data.
The Utah State Legislature supplemented the funding of UDOT’s IMT program in 2018
to double the fleet size, effectively bringing the total number of staffed teams from 13 to 25. The
study of performance measures described in this research paper was initiated in January 2020 to
collect performance data to be compared with those found during 2018, with the purpose of
analyzing the impacts of the program expansion. The UHP CAD system is used to determine
performance measures, and is supplemented with data from the TransSuite database at UDOT’s
TOC. A comparison of selected incident data between CAD and TransSuite indicated that
0%
5%
10%
15%
20%
25%
0-5
5-10
10-1
515
-20
20-2
525
-30
30-3
535
-40
40-4
545
-50
50-5
555
-60
60-6
565
-70
70-7
575
-80
80-8
585
-90
90-9
595
-100
Mor
e
Perc
ent
RT (minutes)

29
TransSuite contained reliable information regarding lane closures that would provide UDOT
with the T5 timestamps necessary to determine when all lanes were available for traffic flow and
calculate RCT. This eliminated the need to request that UHP collect T5, which is not part of
incident data routinely collected by UHP.
Performance Measures Analysis Using Simulation Software
The use of simulation software for incident detection and analysis, advanced
transportation management strategy development, demand-forecast modeling, cost-benefit
analysis, and other applications have become increasingly common as simulation software and
computer technology have advanced to conduct complex, large-scale simulations. Many models
relating to traffic incidents have been created with the purpose of predicting incident impacts
such as incident duration, delay, traffic diversion to adjacent arterials, and emissions. Other
models created, such as those by Pal and Sinha (2002) and Ozbay and Bartin (2003), have
focused on TIM strategies to determine optimal fleet sizes, deployment schedules, beat designs,
and dispatching policies.
The literature review of a project done by the Texas A&M Transportation Institute called
“Planning and Evaluating Active Traffic Management Strategies,” defined the roles of
simulation software tools and other analytical methods in relation to traffic management as:
“Microscopic simulation tools rely on car-following and lane-changing theories and
simulate the movement of individual vehicles. Mesoscopic simulation tools combine
capabilities of both microscopic and macroscopic simulation models considering the
individual vehicle as the traffic flow unit, whose movement is governed by the average
speed on a link. Macroscopic simulation tools are based on deterministic relationships of

30
traffic network parameters (speed, flow, density) and simulate traffic on a section-by-
section basis” (Kuhn 2014, page 46).
The scope of analyzing TIM performance measures in the state of Utah has been focused
on analyzing the real-time performance measures of IMTs on interstates in the most populated
part of the state. Because the analysis is expansive, not limited to a few sections of interstate, and
would require creating numerous simulation models of different physical layouts with different
data needs, simulation tools were considered unsuitable for this study.
The focus of the analysis in this study is not on the direct impact of an incident on traffic
flow, the optimization of UDOT’s IMT fleet, adjustments to TIM strategies, or on predicting the
frequency of future incidents. Rather, the focus has been on the IMT performance measures and
the EUC that can be mitigated by the IMTs. UDOT’s traffic management programs, including
TransSuite, PeMS, and iPeMS, along with the UHP CAD data, were determined to be adequate
for the purpose of this study. Despite the inevitable confounding factors involved due to using
field data, the research team found this approach most suitable to meet the objectives of the
study.
The chosen study approach can include hundreds of field incidents that contain all the
necessary performance measures rather than a finite set of incidents limited to a specific region.
Thus, a deterministic analysis using real incident data is more realistic than simulation for the
purposes of the study. Using IMT performance measures obtained from the field data will allow
UDOT not only to verify the changes that will result in EUC but also to conduct similar studies
in the future.

31
Chapter Summary
This literature review focused on identifying ways states are collecting and using TIM
data to evaluate the effectiveness of their TIM programs. It also addressed the changes to the
state of the practice of TIM in Utah. Information gathered from case studies of the TIM-related
work in other states provides ideas of how to efficiently and effectively gather the data necessary
to determine critical performance measures, specifically RCT and ICT.
The studies reviewed were performed by their respective researchers to accurately
measure performance of TIM teams and to determine what steps should be taken to improve
incident-related communication, responder safety, and traffic clearance tasks. The economic
benefits of a TIM program can be analyzed and used to justify future expansion and financial
backing of the program. However, Kim et al. (2012) found that “even with the widespread
implementation of such programs, effectively minimizing the traffic impact caused by multi-lane
blocked incidents remains a critical and challenging issue for most highway agencies.”
To accelerate the effective implementation of TIM programs, agencies involved in TIM
will need to work together by defining common terms, defining standards of data exchange, and
creating effective programs to promote TIM. Further research and data collection of TIM
performance measures will make UDOT’s TIM program more effective and efficient.

32
3 DATA AVAILABILITY AND COLLECTION
Overview
During the Phase I study, data availability for TIM performance measures was
established in meetings with representatives from UDOT and UHP. To aid UDOT in measuring
performance and evaluating user impacts of its IMT program, one key objective of the Phase I
study was to obtain all pertinent incident-related data necessary to determine the performance
measures of RT, RCT, and ICT, as well as to analyze the data for the following user impacts:
• ETT: the cumulative excess travel time that users experience over the distance of
roadway affected by an incident above the time users would normally spend traveling the
same distance of roadway on a day with no incidents.
• AV: the number of vehicles that experienced some measure of delay due to an incident.
• EUC: the dollar value associated with ETT, including the hourly costs of roadway user
time and truck delay.
In contrast to Phase I, this study did not involve collection of one dataset to analyze for
performance measures and user impacts. Two datasets were collected, for 2018 and 2020, so that
comparison of performance measures and user impacts between the two years could be used to
determine the effects of the expanded size of UDOT’s IMT program. This change in the IMT
program size was the primary focus of the study. However, the advent of the COVID-19

33
pandemic in early 2020 presented additional challenges that the research had to account for in
data collection and analysis.
The data collection process used for this Phase II study is similar to that of Phase I
(Schultz et al. 2019) with the notable distinction of the use of the UDOT TransSuite database to
aid in collecting performance measure data. Because the methodology of data collection has been
previously established, the details of the process are left out of this report, and readers are invited
to supplement their reading of this chapter with Chapter 3 of Schultz et al. (2019) for a more in-
depth understanding of the data collection process and incident analysis. This chapter contains an
overview of the changes to UDOT’s IMT program from the program expansion, a discussion of
data collection considerations caused by the COVID-19 pandemic, a brief discussion of data
availability, a discussion on the integration of UDOT’s TransSuite database for collecting TIM
performance measures, and an overview of the final data collection methodology.
UDOT IMT Program Expansion
The expansion of UDOT’s IMT program was fully effective in spring of 2019 after all
additional units were operational. The funding allocated by the Utah State Legislature allowed
UDOT to increase the operational budget of the IMT program and expand both operational hours
and area of coverage. It also provided for an increase in staffed IMTs from 13 to 25 units. Prior
to the expansion, there were 12 full-time teams in UDOT Regions 1, 2, and 3, and one part-time
team in St. George in Region 4. The hours of operation of IMT services in Region 2 were
increased to 24/7 service, while operations in Regions 1 and 3 are now fully staffed with two
morning and afternoon shifts as well as weekend shifts. While dispatching protocol and

34
operations stayed the same after the expansion, the IMT program was able to increase the
number of motorist assists and better aid other agencies.
One of the most significant changes of the program expansion was the increase in
coverage area for the IMT program. There was a significant increase in the area covered by
IMTs in 2020 compared to 2018, as demonstrated by the number of centerline miles covered
before and after the expansion. UDOT’s IMT program supervisor provided the research team
with data relating to the miles covered by IMTs along UDOT interstates and highways before
and after the expansion, from which the following figures were created. The raw coverage data
provided by UDOT, including the names of roadways, mileposts patrolled, and lengths covered
by direction, are included in Appendix A. Figure 3-1 through Figure 3-3 show the centerline
miles covered by IMTs on interstates and other state highways in the four regions.
Figure 3-1: Centerline miles covered by IMTs before and after expansion.

35
Figure 3-2: Centerline interstate miles covered before and after expansion.
Figure 3-3: Percentage of centerline miles covered by IMTs that are on interstates before and after expansion.

36
Figure 3-1 shows the total centerline miles covered by year and region. Region 4,
covering much of rural southern Utah, was only covered part-time by the IMT fleet in 2018, but
was covered by one full-time IMT in the St. George area in 2020. The centerline miles covered
in Regions 1 and 3 had a greater increase than Region 2 from 2018 to 2020 primarily because
incidents in Region 2 were the primary focus of IMT services prior to the program expansion.
The majority of centerline miles covered by the IMT fleet in 2018 were on interstates.
Interstate coverage increased further in 2020 as the IMT coverage area expanded. As shown in
Figure 3-2, the centerline interstate miles covered in Region 1 increased significantly from 2018
to 2020 (from 47 to 113). There was a moderate increase in the number of interstate centerline
miles covered in Region 2 and there was no increase in Region 3. No miles of interstate were
covered full-time in Region 4 until the program expansion, after which 42 miles were covered in
2020. Where interstate miles were already covered, the expansion allowed IMTs to cover
additional areas such as state highways.
As seen in Figure 3-3, the proportion of centerline miles covered by IMTs in 2018 that
was on interstates was at 81 percent in Region 2 and 100 percent in Region 3. For Region 1, this
was 57 percent in 2018, showing that there were some non-interstate roadways covered by IMTs.
Due to the major expansion of the IMT coverage area, the majority of centerline miles covered
shifted from interstates in 2018 to non-interstate highways in 2020 in all regions except for
Region 2. All centerline miles covered in 2018 were still covered in 2020. So, while the number
of centerline miles covered on interstates increased between 2018 and 2020 for all regions, the
IMT coverage area expanded significantly enough that the majority of centerline miles in 2020
were on state highways instead of interstates.

37
Figure 3-4 through Figure 3-7 are maps of the IMT coverage areas showing the centerline
miles and routes covered in 2018 and 2020.
Figure 3-4: Map of IMT coverage area in Region 1 before and after expansion.
Figure 3-5: Map of IMT coverage area in Region 2 before and after expansion.

38
Figure 3-6: Map of IMT coverage area in Region 3 before and after expansion.
Figure 3-7: Map of IMT coverage area in Region 4 before and after expansion.

39
In 2018, Region 1 IMT coverage only extended as far north as Weber County, the
northern edge of the urbanized part of the Wasatch Front, but had expanded to cover areas in all
counties of northern Utah (except Rich County) by 2020. I-15 was previously covered from the
southern edge of Region 3 up to the northern edge of Weber County in 2018 but by 2020 was
covered all the way up through Box Elder County on Utah’s northern border. Many of the
centerline miles covered in 2020 that were not covered in 2018 were in rural areas, particularly
in canyons. This was true of all regions, but especially for Region 1, which had the largest
geographical area and number of centerline miles covered following IMT program expansion.
The increase in centerline miles covered in Region 2 before and after the expansion was
not as great as that of other regions because Region 2 was the area serviced the most in 2018.
However, there were longer sections of roadway that were covered in 2020 such as I-80 west of
Salt Lake City extending towards Tooele County and US-40 east of Salt Lake City in Summit
County. Because of its high population and high traffic volumes, Region 2 was the geographical
center of IMT coverage area in both 2018 and 2020. IMT coverage area expanded significantly
to both the north and south of Region 2 between 2018 and 2020.
Prior to the expansion of the IMT program, I-15 was the only roadway in Region 3 that
was covered by IMTs, but after the expansion, several major federal and state highways were
added to the original coverage area, many of which were in rural areas, particularly canyons. The
vast majority of the IMT coverage area that falls within Region 4 is located in Washington
County in the St. George area at the southwest corner of the state. In 2018, this area was covered
by one IMT operating part time on the weekends, but in 2020 was covered by a full-time team.

40
The Effects of COVID-19 on Data Collection
While data were collected using the new methodology both for the original data
collection period in 2018 and a second data collection period in 2020, the advent of the COVID-
19 pandemic presented challenges in collecting comparable data. The COVID-19 pandemic
caused significant effects on traffic patterns during the 2020 data collection period, the primary
effect being a significant decrease in traffic volumes. This resulted in an increase in IMT
availability and a change in the typical times of day when incidents occurred. The program
expansion allowed for extended coverage hours and an expanded coverage area, but the
pandemic elicited additional changes in IMT coverage time and area to adapt to the lower
volumes. This section will discuss the reduction in volumes and shifts in traffic patterns and how
these changes affected data collection.
3.3.1 Traffic Volume Reduction
The majority of data collected during the 2020 data collection period came after a
significant decrease in traffic volumes across the state of Utah which began in March 2020. As
seen in Figure 3-8, which shows the difference in average daily traffic volumes by month
between 2018 and 2020, traffic volumes on I-15 were reduced in March 2020 by about 25
percent from what they were in March 2018, with around 25,000 fewer vehicles per day. The
difference in volumes was most notable in April, with 2020 volumes at approximately 44,000
fewer vehicles per day than in 2018. Due to the drastic reduction in traffic volumes during this
period, the data collection periods were adjusted to include more comparable data. The original
data collection period included incidents from March to August in both years. Incident data from
April were not used in either year due to the large volume differences. Additionally, incidents
from the second half of March 2020 were also removed from consideration. Though the months

41
of May and March have similar volume differences between 2018 and 2020, the daily volumes in
March began to decrease about halfway through the month in response to restrictions on social
gatherings, whereas the daily volumes within the month of May were more even throughout.
Therefore, data from the month of May 2020 was included in the analysis. As travel increased
and traffic volumes began to increase in the months of May, June, July, and August, the
difference between 2018 volumes and 2020 volumes began to decrease, as seen in Figure 3-8.
The data collection period was extended to include additional incident data in September, so as
to make up for discarded data in April and provide adequate sample sizes for analysis.
Figure 3-8: Average difference between 2018 and 2020 daily traffic volumes by month on I-15 southbound.
With the reduction in volumes came an associated decrease in the number of incidents
logged in the CAD system across the highway system on the segments where IMTs operate. As
shown in Figure 3-9, the total number of incidents logged in March 2018 decreased from 1,282
to 699 in March 2020, or about a 45 percent reduction. By contrast, a total of 807 crashes were

42
logged in September 2020 as compared to 943 in September 2018, which represented about a 15
percent reduction, as shown in Figure 3-10. Thus, by September 2020, the difference in the total
number of incidents logged between 2018 and 2020 for a given month was significantly lower
than it had been earlier in 2020.
Figure 3-9: Comparison of March 2018 vs. 2020 CAD incident data.
Even though traffic volumes and the number of incidents logged in the CAD system were
lower in 2020 than in 2018, the proportions of incidents of differing crash severity types,
including Fatal and Incapacitating Injury (FII) incidents, Personal Injury (PI) incidents, and PDO
incidents, remained nearly the same between the two years. The percent of FII crashes was 1
percent in both 2018 and 2020. The percentage of PI crashes increased slightly from 27 percent
in 2018 to 29 percent in 2020 and the percentage of PDO crashes decreased from 72 percent in
2018 to 70 percent in 2020.

43
Figure 3-10: Comparison of September 2018 vs. 2020 CAD incident data.
As shown in Figure 3-11, IMTs responded to 38.6 percent of incidents in March 2020,
about twice that of the response rate to incidents in March 2018 at 18.1 percent. In September
2020 IMTs responded to 27.6 percent of incidents, compared to the 18.0 percent response rate in
September 2018, as shown in Figure 3-12. While the lower traffic volumes and lower number of
crashes were a confounding factor in 2020 that increased the normal availability of IMTs, it is
likely that the increase in the size of the IMT fleet allowed the IMTs to respond to more incidents
independently of the lower volumes. Evidence of this likelihood is given by the fact that as the
difference in volumes between 2018 and 2020 decreased month-by-month over the course of
2020, the proportion of incidents with IMTs on scene remained higher in 2020.

44
Figure 3-11: Comparison of March incidents with IMTs by year.
Figure 3-12: Comparison of September incidents with IMTs by year.
Because of the program expansion and reduction in crashes due to the pandemic, more
IMTs were able to respond to larger incidents in 2020 than in 2018. Figure 3-13 shows the
proportions of incidents in each year with differing numbers of responding IMTs. In both years,

45
the proportion of incidents with only one IMT responding was the same at 60 percent. While the
number of incidents with one or two IMTs remained similar in 2018 and 2020, the data show that
the number of incidents where three or four teams responded was greater in 2020. Compared to
2018, where a cumulative 5 percent of incidents had three or four IMTs at the scene, in 2020 a
cumulative 12 percent of incidents had three or four teams at the scene. This finding may
indicate that the greater availability of IMTs in 2020 has allowed the IMT program to send
needed teams to incidents that could not be prioritized in 2018 due to limited resources. While
the effects are somewhat confounded with the impacts of COVID-19, this trend still indicates
that the expanded IMT program has greater flexibility to respond to severe crashes that require a
greater number of IMTs without compromising the ability to respond to less severe crashes.
Figure 3-13: Comparison of IMT response distributions by year.
A similar trend was seen in the percentage of incidents with differing numbers of UHP
responders, though the number of UHP officers did not increase from 2018 to 2020 as was the

46
case with the IMT program. There was consistently a greater proportion of incidents with more
UHP units in 2020 than in 2018, as shown in Figure 3-14. As with the IMTs, the reduction in
daily traffic volumes caused an increase in availability for UHP units. Similar to the distribution
of responses by IMTs, the percentage of incidents where one and two UHP units responded was
not greater in 2020 than in 2018. However, the percentage of incidents with three or more UHP
units was consistently greater in 2020 than in 2018.
Figure 3-14: Comparison of UHP response distributions by year.
3.3.2 Time of Day of Crashes
There was also a change in the distribution of times of day when incidents occurred
during the COVID-19 pandemic. For the purposes of this study, incidents were considered to
have occurred during one of five time ranges, as outlined in Table 3-1. As shown in Figure 3-15,
there was a significant decrease in the percentage of incidents analyzed that occurred in the AM
Peak period, from 27 percent in 2018 to 15 percent in 2020. This decrease was likely due to
workforce adjustments such as more people quarantining and working from home instead of
commuting to work during the AM Peak period. Patterns of crash frequency stayed about the
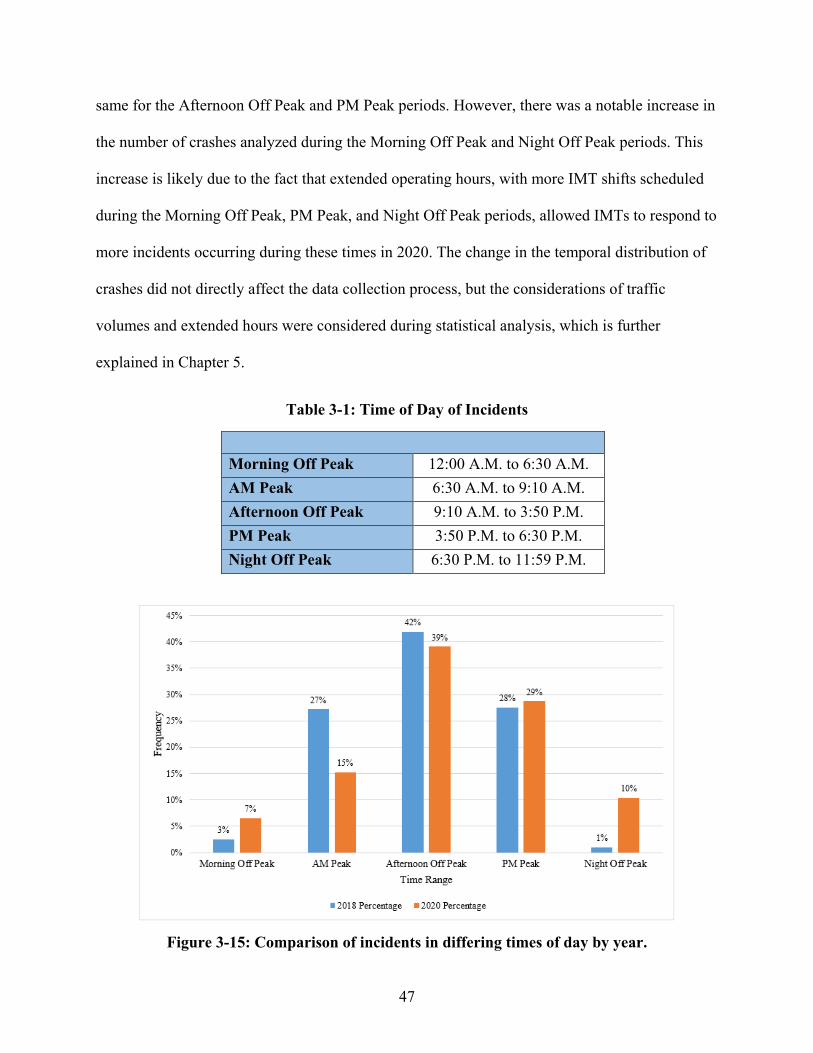
47
same for the Afternoon Off Peak and PM Peak periods. However, there was a notable increase in
the number of crashes analyzed during the Morning Off Peak and Night Off Peak periods. This
increase is likely due to the fact that extended operating hours, with more IMT shifts scheduled
during the Morning Off Peak, PM Peak, and Night Off Peak periods, allowed IMTs to respond to
more incidents occurring during these times in 2020. The change in the temporal distribution of
crashes did not directly affect the data collection process, but the considerations of traffic
volumes and extended hours were considered during statistical analysis, which is further
explained in Chapter 5.
Table 3-1: Time of Day of Incidents
Morning Off Peak 12:00 A.M. to 6:30 A.M. AM Peak 6:30 A.M. to 9:10 A.M. Afternoon Off Peak 9:10 A.M. to 3:50 P.M. PM Peak 3:50 P.M. to 6:30 P.M. Night Off Peak 6:30 P.M. to 11:59 P.M.
Figure 3-15: Comparison of incidents in differing times of day by year.

48
Data Availability
A number of data sources made available by UDOT and UHP provided timepoint data
from which performance measures could be determined. These sources also provided facility
data such as speed, volume, and travel time from which user impacts could be evaluated. Data
collected in this process came from four sources including the UHP CAD System, the UDOT
TransSuite database, the UDOT PeMS database, and the UDOT iPeMS database.
Each of these data sources will be briefly explained in the following subsections. With
the exception of the UDOT TransSuite database, more details about how each database was used
in the data collection process can be found in Chapter 3 of Schultz et al. (2019).
3.4.1 The UHP CAD System
UHP extracted and provided timestamped crash response data for IMT and UHP units
from its CAD database. From these timestamped data, times of interest on the TIM Timeline,
shown previously in Figure 2-1, were obtained and incident performance measures of RT, RCT,
and ICT were determined. CAD files also contain crash severity type broken up into the three
categories shown in Table 3-2. The table also correlates these categories of crash severity with
the UDOT numeric scale and the KABCO Injury Classification Scale.
The data from CAD files were used to determine RT and ICT of both IMT and UHP
units. The limitations of these data come from human error during data entry, whether through
missing timestamps or timestamps entered incorrectly. For instance, at times there were multiple
timestamps at an incident for a single IMT with the same status code. The occurrence of these
types of errors was not frequent and they were addressed on an incident-by-incident basis
according to the judgement of the research team.

49
Table 3-2: Comparison of UHP, UDOT, and KABCO Crash Severity Classifications (Numetric 2018 and NHTSA 2017)
UHP CAD File Crash Severity
Type
UDOT Numeric
Scale
KABCO Scale Severity Description
Fatal and Incapacitating
Injury (FII)
5 K Fatal injury: injury that results in death within 30 days of crash
4 A Suspected Serious Injury: serious injury not
resulting in fatality; incapacitating injury results from the crash
Personal Injury (PI)
3 B Suspected Minor Injury: minor injury evident at the scene of the crash, not serious injury or fatality
2 C Possible Injury: injuries reported but not evident at the scene of the crash
Property Damage Only
(PDO) 1 O No Apparent Injury: the person received no bodily
harm
3.4.2 The UDOT TransSuite System
The UDOT TransSuite System was incorporated into the methodology after Phase I when
data regarding lane closures (T5) was reformatted for extraction from the TransSuite database.
Because the UDOT TransSuite database was not used in the previous research, the description of
this source as well as the justification for its integration into the methodology are given
subsequently in Section 3.5.
3.4.3 The UDOT PeMS Database
The PeMS database (UDOT 2018b) made available by Iteris Inc. provided point speed
and volume data from radar and loop detectors. These data were used to help determine ETT and
AV. Speed data from PeMS were also used to estimate the time an incident took place and the
time that traffic flow returned to normal after an incident. Speed contour plots within PeMS
helped with spatial analysis and visualization of the magnitude of incidents.

50
Limitations of PeMS data primarily come from out-of-service detectors. In some
instances of severe congestion, such as during an FII crash, speeds were reduced to the point that
detectors did not register vehicles passing over them, which made it difficult to get true delay
data. An additional issue with PeMS is that data from detectors are available at a granularity of 5
minutes, so incident start time and the time that traffic flow returned to normal cannot be
determined to greater than 5-minute accuracy.
3.4.4 The UDOT iPeMS Database
The iPeMS database (UDOT 2018a) made available by Iteris Inc. provided speed and
travel time data via real-time and historical traffic data. The database uses probe data collected
from cell phone applications and in-vehicle GPS units. The data collected from iPeMS were used
to help determine ETT. Specific route segments that can be defined within iPeMS for travel time
analysis were created to gather data individual to each incident being analyzed.
One issue with iPeMS probe data used in this study is that the data sampling has variable
penetration levels and is therefore not as accurate as raw data provided by the PeMS database.
One merit of this probe data over PeMS is that they describe what is happening continuously
along the roadway instead of only at detector locations.
Integration of UDOT’s TransSuite Database
During Phase I of the research, UHP collected “C” timestamps that indicated when all
lanes at the location of an incident were cleared, which was used as T5 in the calculation of RCT.
At that time, TransSuite data were in an encrypted format that prevented easy extraction for use,
but by this Phase II study, TransSuite data were reformatted for extraction from the database.
The UDOT TOC provided the research team with TransSuite data, which contained incident lane

51
closure data as a possible alternative to the “C” timestamps collected by UHP to calculate RCT.
TransSuite data were integrated with CAD data provided by UHP. This proved to yield a greater
number of incidents and a higher percentage of total incidents that were relevant for measuring
IMT performance.
The 2018 and 2020 CAD+TransSuite datasets also yielded a greater variety of incidents
than the 2018 dataset collected without TransSuite data. The following subsections describe how
TIM performance measure data were collected using CAD data, how the use of TransSuite data
provided the research team with more performance measure data, and how the validity of using
TransSuite data was determined using statistical tools.
3.5.1 Performance Measures Obtained through CAD Data
One of the primary objectives of the Phase I research was to determine the availability of
data necessary to collect performance measures defined by the FHWA, namely RCT and
ICT. These necessary datapoints are the individual incident timestamps used to calculate
performance measures, shown previously on the FHWA Traffic Incident Management Timeline
in Figure 2-1.
From the Phase I research, it was determined that the necessary timestamps needed to
calculate RCT and ICT were available in UHP’s CAD files (Schultz et al. 2019). In addition, the
iPeMS and PeMS databases provided by UDOT were necessary to determine user impacts such
as ETT, AV, and EUC. Table 3-3 shows the UHP status codes that corresponded to the necessary
timeline elements. UHP did not historically collect the timestamps of status code “C,”
corresponding to T5, but consented to collect them during the 2018 data collection period for the
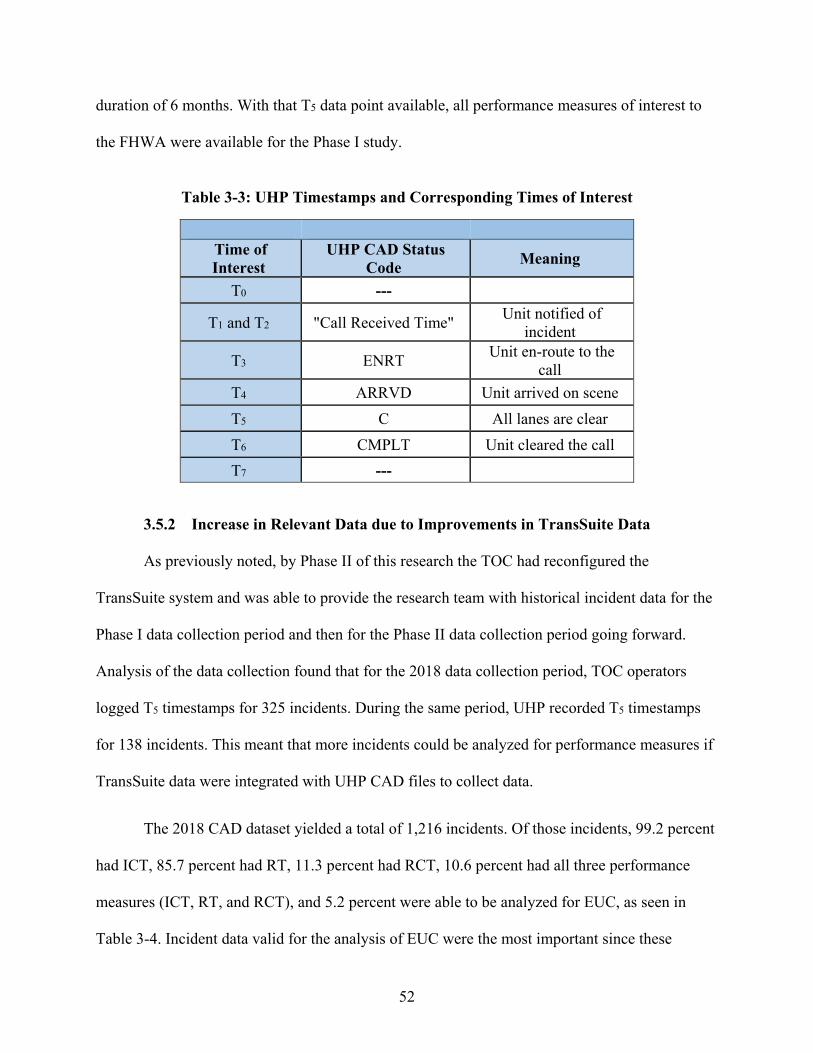
52
duration of 6 months. With that T5 data point available, all performance measures of interest to
the FHWA were available for the Phase I study.
Table 3-3: UHP Timestamps and Corresponding Times of Interest
Time of Interest
UHP CAD Status Code Meaning
T0 ---
T1 and T2 "Call Received Time" Unit notified of incident
T3 ENRT Unit en-route to the call
T4 ARRVD Unit arrived on scene T5 C All lanes are clear T6 CMPLT Unit cleared the call T7 ---
3.5.2 Increase in Relevant Data due to Improvements in TransSuite Data
As previously noted, by Phase II of this research the TOC had reconfigured the
TransSuite system and was able to provide the research team with historical incident data for the
Phase I data collection period and then for the Phase II data collection period going forward.
Analysis of the data collection found that for the 2018 data collection period, TOC operators
logged T5 timestamps for 325 incidents. During the same period, UHP recorded T5 timestamps
for 138 incidents. This meant that more incidents could be analyzed for performance measures if
TransSuite data were integrated with UHP CAD files to collect data.
The 2018 CAD dataset yielded a total of 1,216 incidents. Of those incidents, 99.2 percent
had ICT, 85.7 percent had RT, 11.3 percent had RCT, 10.6 percent had all three performance
measures (ICT, RT, and RCT), and 5.2 percent were able to be analyzed for EUC, as seen in
Table 3-4. Incident data valid for the analysis of EUC were the most important since these
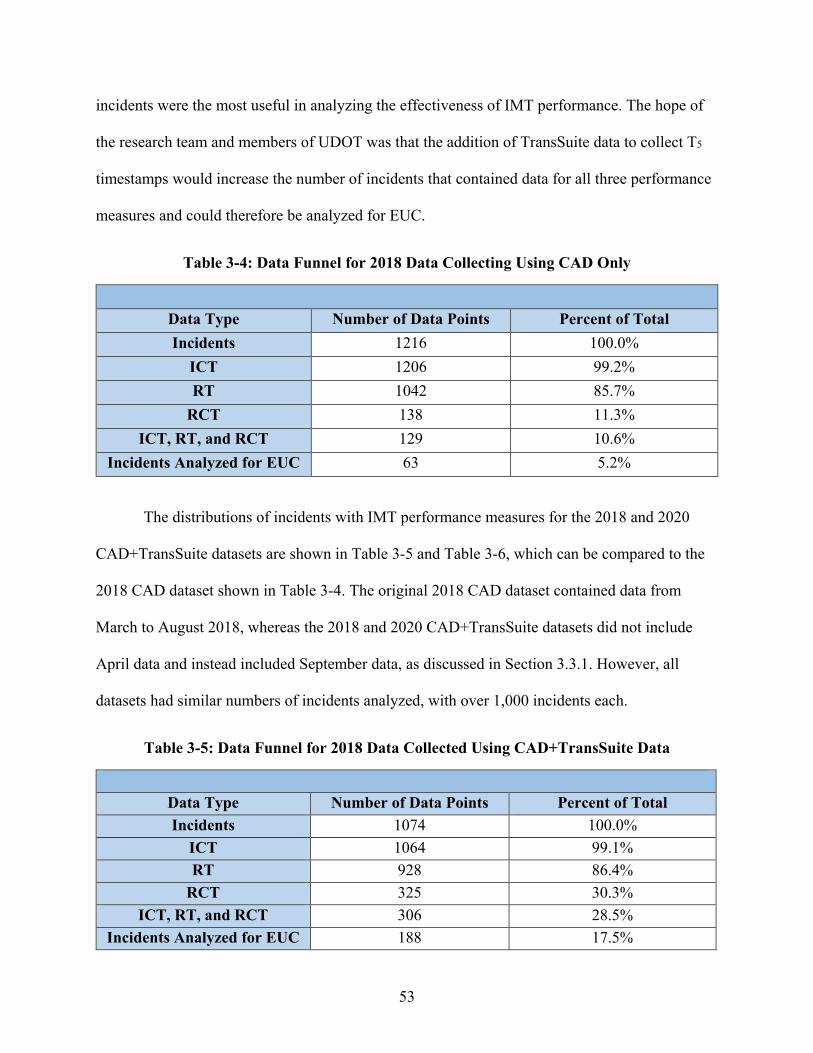
53
incidents were the most useful in analyzing the effectiveness of IMT performance. The hope of
the research team and members of UDOT was that the addition of TransSuite data to collect T5
timestamps would increase the number of incidents that contained data for all three performance
measures and could therefore be analyzed for EUC.
Table 3-4: Data Funnel for 2018 Data Collecting Using CAD Only
Data Type Number of Data Points Percent of Total Incidents 1216
100.0% ICT 1206 99.2% RT 1042 85.7%
RCT 138 11.3% ICT, RT, and RCT 129 10.6%
Incidents Analyzed for EUC 63 5.2%
The distributions of incidents with IMT performance measures for the 2018 and 2020
CAD+TransSuite datasets are shown in Table 3-5 and Table 3-6, which can be compared to the
2018 CAD dataset shown in Table 3-4. The original 2018 CAD dataset contained data from
March to August 2018, whereas the 2018 and 2020 CAD+TransSuite datasets did not include
April data and instead included September data, as discussed in Section 3.3.1. However, all
datasets had similar numbers of incidents analyzed, with over 1,000 incidents each.
Table 3-5: Data Funnel for 2018 Data Collected Using CAD+TransSuite Data
Data Type Number of Data Points Percent of Total Incidents 1074 100.0%
ICT 1064 99.1% RT 928 86.4%
RCT 325 30.3% ICT, RT, and RCT 306 28.5%
Incidents Analyzed for EUC 188 17.5%

54
Table 3-6: Data Funnel for 2020 Data Collected Using CAD+TransSuite Data
Data Type Number of Data Points Percent of Total Incidents 1190 100.0%
ICT 1186 99.7% RT 1007 84.6%
RCT 295 24.8% ICT, RT, and RCT 280 23.5%
Incidents Analyzed for EUC 144 12.1%
While the 2018 CAD-only and CAD+TransSuite datasets yielded comparable numbers of
incidents and similar percentages of the total number of incidents with ICT and RT data, the
proportion of incidents with RCT data and those analyzed for EUC were much higher after
TransSuite data were introduced. In 2018, the data reanalyzed using TransSuite provided for the
analysis of EUC for 188 incidents, or 17.5 percent of the total. This is a 12.3 percent increase in
the number of incidents analyzable for EUC from when 2018 CAD data was used alone. The
2020 data obtained from CAD+TransSuite also surpassed data collected in 2018 using only
CAD, despite a lower number of crashes recorded in the CAD system, as previously discussed in
Section 3.3.1. During the 2020 data collection period, 144 of the 1,190 incidents analyzed for
performance measures were able to be analyzed for EUC, or 12.1 percent of the total.
The integration of CAD and TransSuite proved to yield a much more relevant dataset for
the analysis of IMT performance. Additionally, the majority of incidents analyzed for EUC in the
original CAD-only dataset were also found to be analyzable using the CAD+TransSuite dataset,
indicating that analyzable data would not be lost by integrating TransSuite into the methodology.
With the increase in the number of analyzable incidents with TransSuite, greater sample sizes of
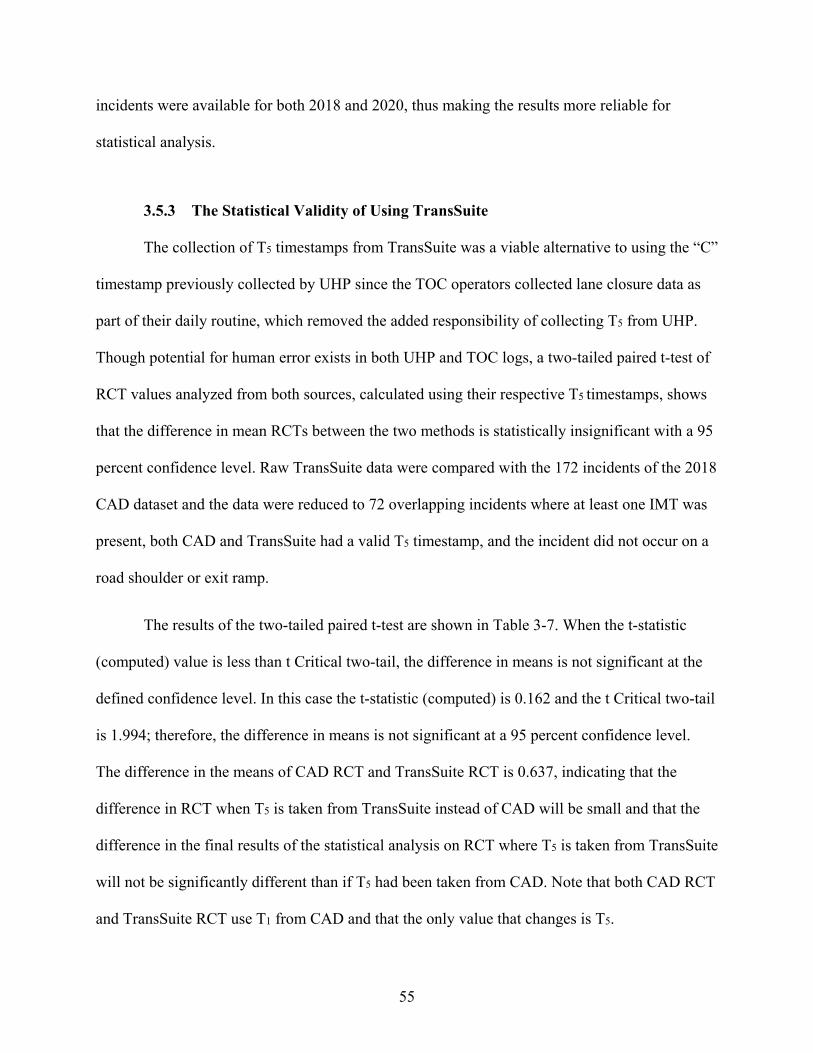
55
incidents were available for both 2018 and 2020, thus making the results more reliable for
statistical analysis.
3.5.3 The Statistical Validity of Using TransSuite
The collection of T5 timestamps from TransSuite was a viable alternative to using the “C”
timestamp previously collected by UHP since the TOC operators collected lane closure data as
part of their daily routine, which removed the added responsibility of collecting T5 from UHP.
Though potential for human error exists in both UHP and TOC logs, a two-tailed paired t-test of
RCT values analyzed from both sources, calculated using their respective T5 timestamps, shows
that the difference in mean RCTs between the two methods is statistically insignificant with a 95
percent confidence level. Raw TransSuite data were compared with the 172 incidents of the 2018
CAD dataset and the data were reduced to 72 overlapping incidents where at least one IMT was
present, both CAD and TransSuite had a valid T5 timestamp, and the incident did not occur on a
road shoulder or exit ramp.
The results of the two-tailed paired t-test are shown in Table 3-7. When the t-statistic
(computed) value is less than t Critical two-tail, the difference in means is not significant at the
defined confidence level. In this case the t-statistic (computed) is 0.162 and the t Critical two-tail
is 1.994; therefore, the difference in means is not significant at a 95 percent confidence level.
The difference in the means of CAD RCT and TransSuite RCT is 0.637, indicating that the
difference in RCT when T5 is taken from TransSuite instead of CAD will be small and that the
difference in the final results of the statistical analysis on RCT where T5 is taken from TransSuite
will not be significantly different than if T5 had been taken from CAD. Note that both CAD RCT
and TransSuite RCT use T1 from CAD and that the only value that changes is T5.

56
Table 3-7: Two Tailed Paired t-test of RCT Data
Statistic CAD RCT
TransSuite RCT (TransSuite T5 – CAD T1)
Mean 54.749 54.112 Variance 1883.734 1625.309
Observations 72 72 Pearson Correlation 0.683 Hypothesized Mean
Difference 0
df 71 t Stat 0.162
P(T<=t) one-tail 0.436 t Critical one-tail 1.667 P(T<=t) two-tail 0.872 0.128 t Critical two-tail 1.994 for α = 0.05 given df = 71
Figure 3-16 is a histogram showing a comparison of usable RCT values for the 2018
dataset using both CAD and TransSuite T5 values. Figure 3-17 is a histogram that shows the
difference between the respective RCT values.
Figure 3-16: Comparison of RCT distributions between CAD and TransSuite.

57
Figure 3-17: Difference between RCTs determined by CAD and CAD+TransSuite.
Figure 3-16 shows frequencies of RCT values both calculated using CAD T5 and
TransSuite T5 timestamps. The number of incidents with RCTs falling into 10-minute bins is
similar between the two data sources. Figure 3-17 shows the frequencies of differences between
RCT values for each individual incident analyzed from the 2018 dataset, calculated as the RCT
value determined using TransSuite data subtracted from the RCT value determined using CAD
data. The majority of RCTs calculated using TransSuite data fall within 5 minutes of those
calculated originally from the CAD data. The difference is slightly skewed to the positive side,
which indicates that T5 values as recorded in TransSuite were recorded slightly before those
corresponding to the same incident in the CAD file, resulting in slightly shorter RCTs.
As a result of this analysis, TransSuite was considered a viable option for collecting T5
data for Phase II data collection. Therefore, it was not necessary to request UHP officers to
record the “C” timestamps that were provided during Phase I. Nevertheless, the other timestamps

58
that UHP collects in the CAD system were still necessary for determining performance measures
and the assistance of UHP officers was essential.
Data Collection Methodology
As previously mentioned, the data collection methodology used in this study is nearly the
same as the methodology described in Schultz et al. (2019), and details about this methodology
can be found in that report. The primary difference between the data collection and reduction
procedure in this Phase II study and the previous one is that for this phase of research lane
closure data from the UDOT TransSuite database was used to determine RCT. In contrast to the
Phase I study, performance measure and user impact data were analyzed for two periods. Using
an updated methodology, data were collected for comparable data collection periods in both
2018 and 2020, so as to facilitate analysis of differences in performance and impacts of the
expansion to UDOT’s IMT program.
The data collection and reduction were performed using Microsoft Visual Basic for
Applications (VBA) 2019 templates developed by the research team, and a description of each
template is presented in this section. The templates were automated to:
• Combine data sources.
• Identify incidents viable for analysis.
• Facilitate data collection.
• Organize collected data for analysis.
The updated methodology used to collect and analyze incident data for the both data
collection periods is shown in Figure 3-18.

59
In this figure, “PMs” refers to “performance measures.”
Figure 3-18: Data collection methodology flowchart.

60
Incidents that had all timestamps necessary to collect all pertinent performance measures
(RT, RCT, and ICT) were first identified. Then, from that pool of identified incidents, further
investigation was done to determine which incidents were viable for performing user impact
analysis. To be used for user impact analysis, incidents must have met the following criteria:
• The incident occurred on an interstate in Utah.
• The incident did not occur on a ramp.
• The incident contained available loop detectors without substantial amounts of missing
data on the road segments where the incident occurred.
• The incident had a distinct and decipherable queue, as seen in speed contours provided in
the PeMS database.
• The incident did not have secondary incidents.
For each month during the data collection period, from mid-March to the end of
September 2020, not including April, the process described by the schematic diagram in Figure
3-18 was followed to collect incident data, which was then stored in an incident database for
later analysis. The diagram is numbered by the respective steps that the research team took to
collect raw incident data, reduce it to meaningful incidents, then extract and store important
information regarding performance measures, user impacts, and other incident characteristics of
interest. A brief overview of the process shown in Figure 3-18 will be provided in this section,
with subsections corresponding to the numbers in the figure.
3.6.1 Combining CAD and TransSuite Data
At the end of each month the research team received monthly CAD logs from UHP as
well as monthly logs of incident data from UDOT’s TransSuite database, both as Excel

61
worksheets. Because T5 timestamps necessary for determining RCT were found in TransSuite
while all other timestamps were found in the CAD data, a method was needed to identify
matching incidents in the respective logs and combine them. A “Combiner Template” was
created in VBA to allow the research team to systematically compare incidents from each
respective source. This template allowed the research team to compare incidents based on
thresholds in date, time, and location, then identify matches and finally initiate an automated
process that would combine timestamps into a single log sheet.
During this step incidents were also vetted by the first two criteria for ETT analysis, and
those incidents that did not occur on interstates were discarded. Those that occurred on ramps
were marked as viable for performance measures analysis only. After that process was
undertaken each month, T5 timestamps obtained from TransSuite were integrated into the rest of
the timestamps found within the CAD data, and performance measures were calculated, as
described in Step 2 of the process.
3.6.2 Calculating Performance Measures
The combined incident data gathered in Step 1 were then processed using a separate
“CAD Template” created in VBA, which was automated to calculate the performance measures
for IMTs and UHP units for each incident using the timestamp data. The VBA script looped
through the combined data and created a performance measures template that was populated
each time an incident that had the necessary data to calculate RCT, ICT, and RT was identified.
This CAD Template also created a file structure for the incidents in each month that could be
organized further depending on additional analysis, whether they would be analyzed solely for
performance measures, or whether they met criteria to be analyzed for user impacts.

62
3.6.3 Performance Measures Collected
At this point, all incidents from the raw data that were viable for performance measure
analysis had been identified, and performance measures for these incidents had been calculated.
Additional steps in the process serve the purpose of identifying which incidents can be further
analyzed for user impacts such as ETT, AV, and EUC.
3.6.4 Identifying Incidents Viable for ETT Analysis
The incidents for which performance measures were calculated were individually vetted
to determine whether the remaining three criteria for ETT analysis were met. To determine the
presence of secondary incidents, sufficient detector data, and a decipherable queue, speed
contour plots of each incident were located in the Spatial Analysis reports found in the PeMS
database and compared to the combined CAD and TransSuite logs. Detector data were
determined to be sufficient by the research team if 85 percent of them were available during the
temporal and physical extents of the incident queue, as shown in the speed contour plot.
Examples of how contour plots were used to visualize queues and identify secondary
incidents is found in Section 3.5 of Schultz et al. (2019). Incidents that did not meet the criteria
mentioned above were entered into an incident database with their respective performance
measures.
3.6.5 Preparing Data for ETT Analysis
For each incident that met all five criteria, an “ETT Template” was created in VBA to
produce a file structure that would compile all pertinent incident data specific to the incident
including travel times, speeds, and volumes for the duration and geographic extent of the

63
incident. To use the ETT template, each incident was compartmentalized into “sub-routes”
between facility access points. Detectors in each sub-route were identified in the PeMS database
to provide volume data. Each sub-route detector was then paired with a route created in the
iPeMS database to provide travel time data.
The timestamps for T0 and T7 were also determined by comparing speed contour plots of
each incident to speed contour plots of the same location for comparable “normal” days in which
incidents did not occur. Once T0 and T7 of an incident were determined, along with respective
normal days and the subroutes that covered the extent of the queue, the ETT template created a
file structure of sub-route templates for data collection of volume and travel time data from
PeMS and iPeMS. Examples identifying sub-routes, “normal” days, and T0 and T7 can be found
in Section 3.6 of Schultz et al. (2019).
3.6.6 Calculating ETT
For each incident, a number of sub-route templates were created by the ETT template.
These were populated with travel time data from iPeMS and volume data for each sub-route’s
respective PeMS loop detector (verifying an acceptable rate of observed data for each detector
and alternating detectors as necessary). The AV of each sub-route was calculated as the
cumulative volume that passed through the sub-route during the duration of the incident, from T0
to T7. ETT of the subroute was determined as the difference in total travel time experienced by
the sub-route’s AV on the day of the incident and the total travel time that same AV would have
experienced on normal days. The ETT Template was automated to update with the population of
each sub-route template, and total ETT and AV for the incident were then tabulated as the sum of
all sub-routes’ ETTs and the largest AV experienced by any one sub-route.
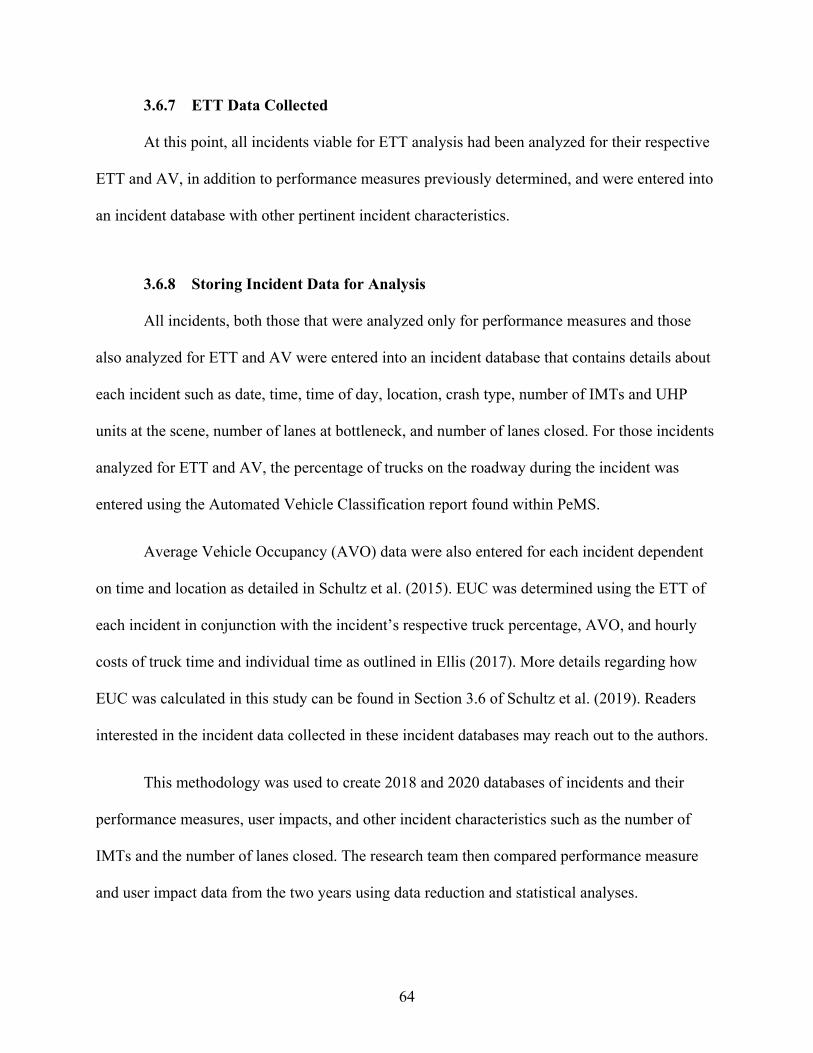
64
3.6.7 ETT Data Collected
At this point, all incidents viable for ETT analysis had been analyzed for their respective
ETT and AV, in addition to performance measures previously determined, and were entered into
an incident database with other pertinent incident characteristics.
3.6.8 Storing Incident Data for Analysis
All incidents, both those that were analyzed only for performance measures and those
also analyzed for ETT and AV were entered into an incident database that contains details about
each incident such as date, time, time of day, location, crash type, number of IMTs and UHP
units at the scene, number of lanes at bottleneck, and number of lanes closed. For those incidents
analyzed for ETT and AV, the percentage of trucks on the roadway during the incident was
entered using the Automated Vehicle Classification report found within PeMS.
Average Vehicle Occupancy (AVO) data were also entered for each incident dependent
on time and location as detailed in Schultz et al. (2015). EUC was determined using the ETT of
each incident in conjunction with the incident’s respective truck percentage, AVO, and hourly
costs of truck time and individual time as outlined in Ellis (2017). More details regarding how
EUC was calculated in this study can be found in Section 3.6 of Schultz et al. (2019). Readers
interested in the incident data collected in these incident databases may reach out to the authors.
This methodology was used to create 2018 and 2020 databases of incidents and their
performance measures, user impacts, and other incident characteristics such as the number of
IMTs and the number of lanes closed. The research team then compared performance measure
and user impact data from the two years using data reduction and statistical analyses.
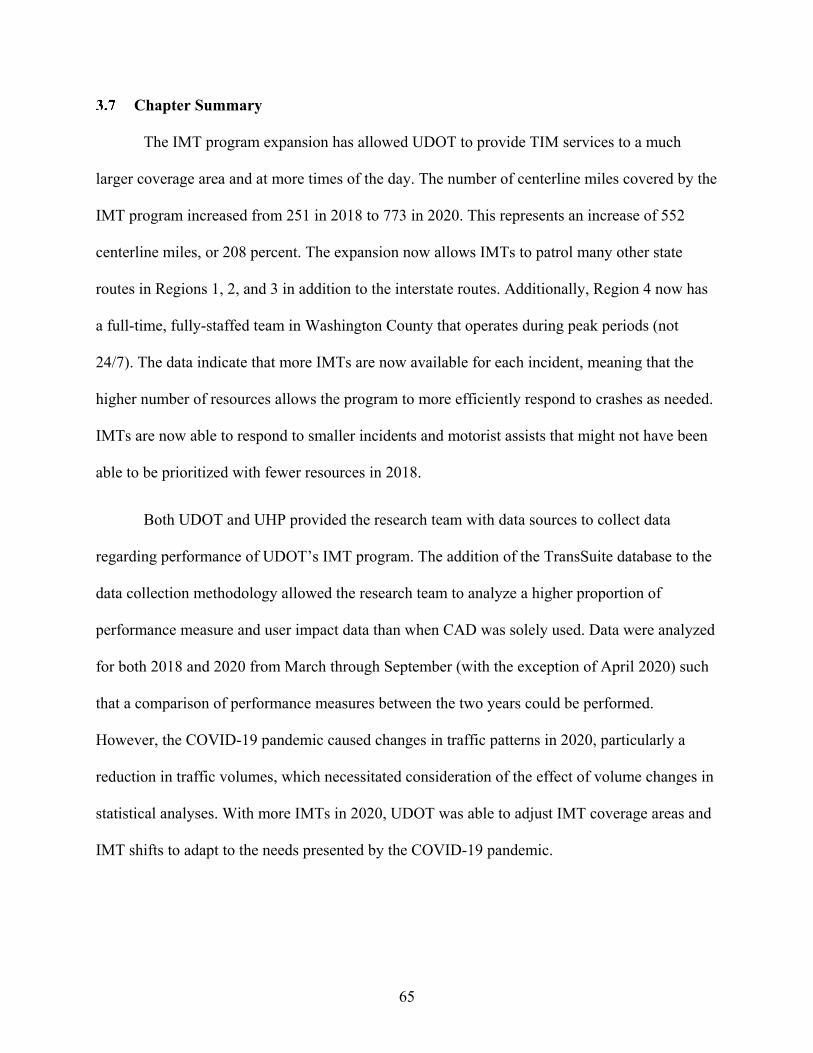
65
Chapter Summary
The IMT program expansion has allowed UDOT to provide TIM services to a much
larger coverage area and at more times of the day. The number of centerline miles covered by the
IMT program increased from 251 in 2018 to 773 in 2020. This represents an increase of 552
centerline miles, or 208 percent. The expansion now allows IMTs to patrol many other state
routes in Regions 1, 2, and 3 in addition to the interstate routes. Additionally, Region 4 now has
a full-time, fully-staffed team in Washington County that operates during peak periods (not
24/7). The data indicate that more IMTs are now available for each incident, meaning that the
higher number of resources allows the program to more efficiently respond to crashes as needed.
IMTs are now able to respond to smaller incidents and motorist assists that might not have been
able to be prioritized with fewer resources in 2018.
Both UDOT and UHP provided the research team with data sources to collect data
regarding performance of UDOT’s IMT program. The addition of the TransSuite database to the
data collection methodology allowed the research team to analyze a higher proportion of
performance measure and user impact data than when CAD was solely used. Data were analyzed
for both 2018 and 2020 from March through September (with the exception of April 2020) such
that a comparison of performance measures between the two years could be performed.
However, the COVID-19 pandemic caused changes in traffic patterns in 2020, particularly a
reduction in traffic volumes, which necessitated consideration of the effect of volume changes in
statistical analyses. With more IMTs in 2020, UDOT was able to adjust IMT coverage areas and
IMT shifts to adapt to the needs presented by the COVID-19 pandemic.

66
4 DATA REDUCTION
Overview
With the methods described in Chapter 3, CAD and TransSuite data were integrated to
obtain performance measures and user impact data. This chapter presents the raw data that were
reduced for the analysis of the UDOT IMT program. It contains a comparison between the
incident data collected in 2018 and 2020, reduced performance measures, and user impacts of the
2018 and 2020 data collection periods. The performance measures for which data were collected
are RT, RCT, and ICT and the user impacts for which data were collected are AV, ETT, and
EUC. It should be noted that this study focused on performance of UDOT’s IMTs, although
UHP-related data were also collected and analyzed. For the purposes of this report, all references
to ICT and RT denote IMT ICT and IMT RT, respectively, whereas RCT values are the same for
both IMTs and UHP units.
Incident Data Collected
The integration of TransSuite data with CAD data provided much more relevant data for
the analysis of IMT performance measures than with CAD data only. The distribution of
incidents that contained relevant performance measures from the 2018 and 2020
CAD+TransSuite integrated datasets were shown previously in Table 3-5 and Table 3-6,
respectively. The impacts of COVID-19 included slight reductions in the number of incidents
observed within the UHP CAD logs. However, with the addition of TransSuite data, adequate

67
samples of performance measure data were still able to be collected. In 2018, 28.5 percent of the
incidents collected contained all three performance measures of interest, and this number was
only slightly smaller in 2020 at 23.5 percent. In 2018, 17.5 percent of the incidents were able to
be analyzed for EUC, and in 2020 12.1 percent of incidents were analyzed for EUC.
Performance Measures
IMT performance measure data including RT, RCT, and ICT were collected for the 2020
data collection period and compared with 2018 IMT performance measure data. The box plots
shown in Figure 4-1 and Figure 4-2 were prepared based on incident data where at least one IMT
responded to an incident and show the ranges of RT, RCT, and ICT based on crash type.
Figure 4-1: Boxplot showing spread of 2018 IMT performance measures by crash type.

68
Figure 4-2: Boxplot showing spread of 2020 IMT performance measures by crash type.
In general, RT values got shorter from 2018 to 2020. As shown in Figure 4-3 and Figure
4-4, the percentage of incidents that IMTs responded to within 15 minutes of a crash occurring
increased from 58.8 percent in 2018 to 65.9 percent in 2020, for a difference of 7.1 percent, or a
12.1 percent improvement from 2018 to 2020. As previously discussed in Section 3.2, the IMT
program expanded to cover a much larger area in 2020. The improvement to response times in
2020 shows that IMTs are able to respond faster to incidents with an expanded fleet, even over a
larger area. This is one clear indication of how the program expansion has helped to improve
IMT performance in 2020.

69
Figure 4-3: 2018 distribution of RT.
Figure 4-4: 2020 distribution of RT.
0%
5%
10%
15%
20%
25%
30%
0-5
5-10
10-1
5
15-2
0
20-2
5
25-3
0
30-3
5
35-4
0
40-4
5
45-5
0
50-5
5
55-6
0
60-6
5
65-7
0
70-7
5
75+
RT
Freq
uenc
y
Minutes
PDO PI FII
0%
5%
10%
15%
20%
25%
30%
0-5
5-10
10-1
5
15-2
0
20-2
5
25-3
0
30-3
5
35-4
0
40-4
5
45-5
0
50-5
5
55-6
0
60-6
5
65-7
0
70-7
5
75+
RT
Freq
uenc
y
Minutes
PDO PI FII

70
There was an increase in IMT RCT values from 2018 to 2020. As shown in Figure 4-5
and Figure 4-6, the percentage of incidents for which IMTs were able to clear the roadway
within 45 minutes of a crash occurring decreased from 55.7 percent in 2018 to 46.4 percent in
2020, for a difference of 9.3 percent, or a 16.7 percent decrease from 2018 to 2020. One potential
cause for longer IMT RCT expressed by IMT leadership was the additional focus that IMTs put
on personal safety due to COVID-19 as they responded to incidents.
ICT remained about the same between 2018 and 2020. As shown in Figure 4-7 and
Figure 4-8, there was a minor increase in the percentage of incidents from which IMTs were able
to clear the scene in less than 45 minutes, from 52.0 percent in 2018 to 53.5 percent in 2020, for
a difference of 1.5 percent, or a 2.9 percent improvement from 2018 to 2020.
Figure 4-5: 2018 distribution of RCT.
0%
5%
10%
15%
20%
25%
30%
0-15
15-3
0
30-4
5
45-6
0
60-7
5
75-9
0
90-1
05
105-
120
120-
135
135-
150
150-
165
165-
180
180-
195
195-
210
210-
225
225+
RC
T Fr
eque
ncy
Minutes
PDO PI FII

71
Figure 4-6: 2020 distribution of RCT.
Figure 4-7: 2018 distribution of ICT.
0%
5%
10%
15%
20%
25%
30%
0-15
15-3
0
30-4
5
45-6
0
60-7
5
75-9
0
90-1
05
105-
120
120-
135
135-
150
150-
165
165-
180
180-
195
195-
210
210-
225
225+
RC
T Fr
eque
ncy
Minutes
PDO PI FII
0%
5%
10%
15%
20%
25%
0-15
15-3
0
30-4
5
45-6
0
60-7
5
75-9
0
90-1
05
105-
120
120-
135
135-
150
150-
165
165-
180
180-
195
195-
210
210-
225
225+
ICT
Freq
uenc
y
Minutes
PDO PI FII

72
Figure 4-8: 2020 distribution of ICT.
Overall, IMT performance was well maintained between 2018 and 2020. IMTs were able
to respond to incidents faster in 2020 in spite of an expanded coverage area. RCT values were
slightly longer in 2020 than in 2018, and this is likely due to precautions taken by IMT personnel
with regards to the COVID-19 pandemic. ICT values were almost identical between both years.
These results indicate that with the expanded program, UDOT is able to provide IMT services of
similar quality at a much larger scale, over a larger coverage area and at more times of the day,
as well as to more incidents.
User Impacts
The user impacts measured in this study were AV, ETT, and EUC, all of which were
significantly lower in 2020 than in 2018 due to the effects of COVID-19. Consequently, the
trends of each measure of user impact between 2018 and 2020 were essentially the same. The
0%
5%
10%
15%
20%
25%
0-15
15-3
0
30-4
5
45-6
0
60-7
5
75-9
0
90-1
05
105-
120
120-
135
135-
150
150-
165
165-
180
180-
195
195-
210
210-
225
225+
ICT
Freq
uenc
y
Minutes
PDO PI FII
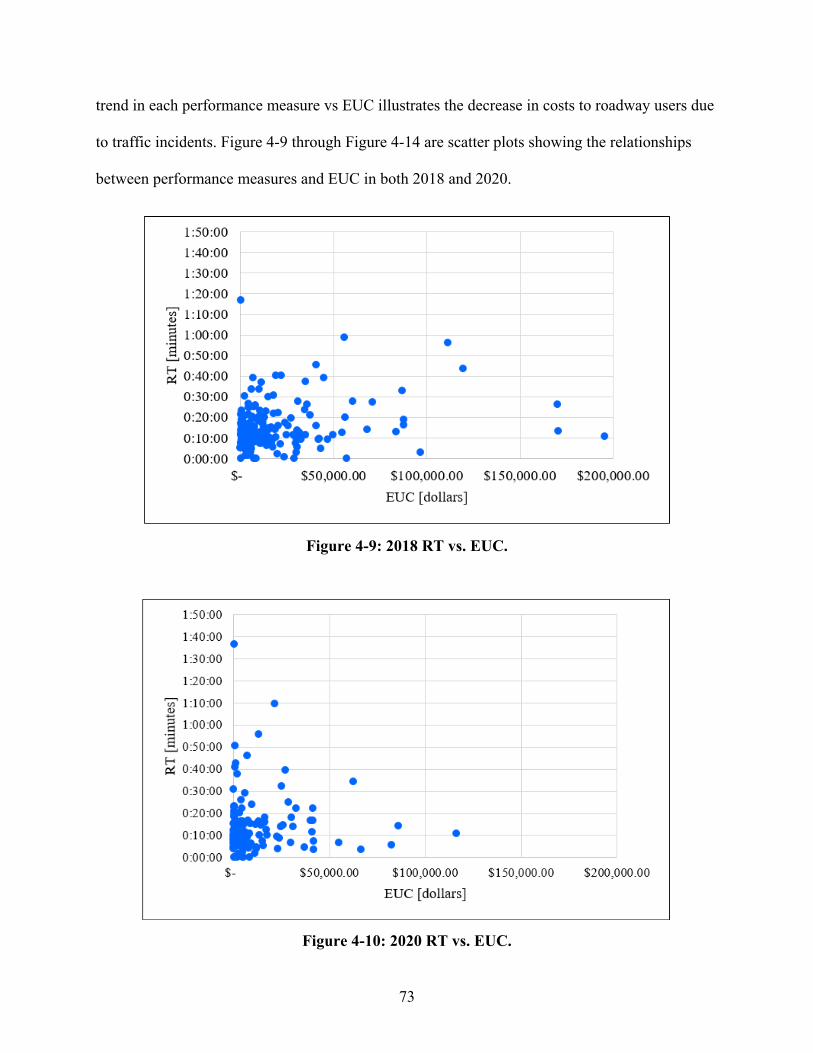
73
trend in each performance measure vs EUC illustrates the decrease in costs to roadway users due
to traffic incidents. Figure 4-9 through Figure 4-14 are scatter plots showing the relationships
between performance measures and EUC in both 2018 and 2020.
Figure 4-9: 2018 RT vs. EUC.
Figure 4-10: 2020 RT vs. EUC.

74
Figure 4-11: 2018 RCT vs EUC.
Figure 4-12: 2020 RCT vs. EUC.
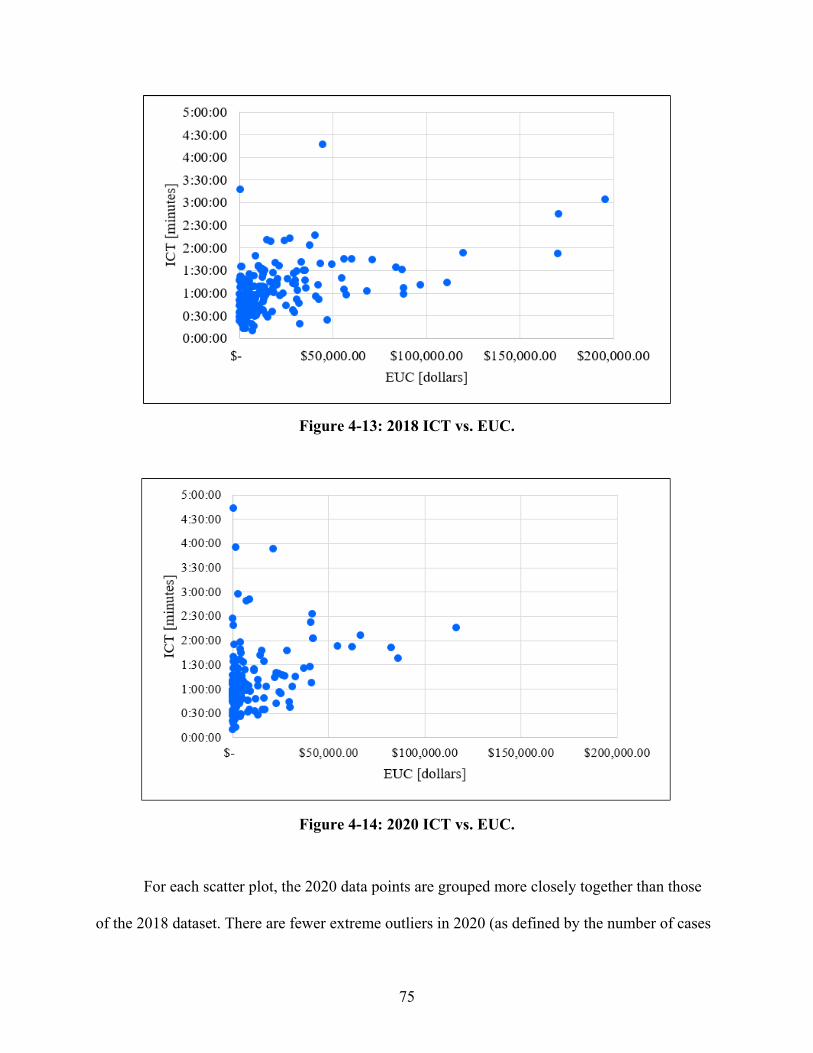
75
Figure 4-13: 2018 ICT vs. EUC.
Figure 4-14: 2020 ICT vs. EUC.
For each scatter plot, the 2020 data points are grouped more closely together than those
of the 2018 dataset. There are fewer extreme outliers in 2020 (as defined by the number of cases

76
approaching $200,000.00) when compared to the 2018 data. Less scattering of data points in the
2020 plots suggests greater consistency in IMT performance in 2020 than in 2018. In the 2020
scatterplots, particularly RCT and ICT, there appears to be a trend of fewer large EUC outliers
paired with more large performance measure outliers than in their respective 2018 scatterplots.
This suggests that incidents required a longer time for the queue to grow in 2020 to incur the
same EUC as in 2018. The inverse of this relationship is the cost per minute of RT, RCT, or ICT,
resulting in a lower cost in 2020 than in 2018 per added minute of each respective performance
measure that roadway users were stuck in traffic.
A lower cost per added minute of RT, RCT, or ICT in 2020 than in 2018 suggests that
IMTs were more efficient in 2020 after the fleet was expanded, but these results cannot be
interpreted outside of the context of low traffic volumes in 2020 caused by COVID-19. Because
EUC is proportional to AV and ETT, the same relationships and trends for each performance
measure vs EUC and cost per added minute of each performance measure exist for AV and ETT
as EUC. A statistical analysis that accounts for the reduction in EUC due to the change in traffic
volumes in 2020 is presented in Chapter 5.
The average EUC compared to the number of IMTs that responded to an incident appears
to be a dependent relationship in 2018, and somewhat independent in 2020, as shown in Figure
4-15. While EUC generally increased with the number of IMTs that responded in 2018, this
trend is only somewhat applicable in 2020 and for incidents with one, two, and three teams.
For incidents in 2020 with four teams present, EUC was lower than for those where one,
two, or three teams were present. This trend is different from that of 2018, where the EUC for
incidents with four teams was exponentially higher than the EUC of those incidents with one,
two, or three teams. The EUC for incidents where four teams responded in 2018 was likely high
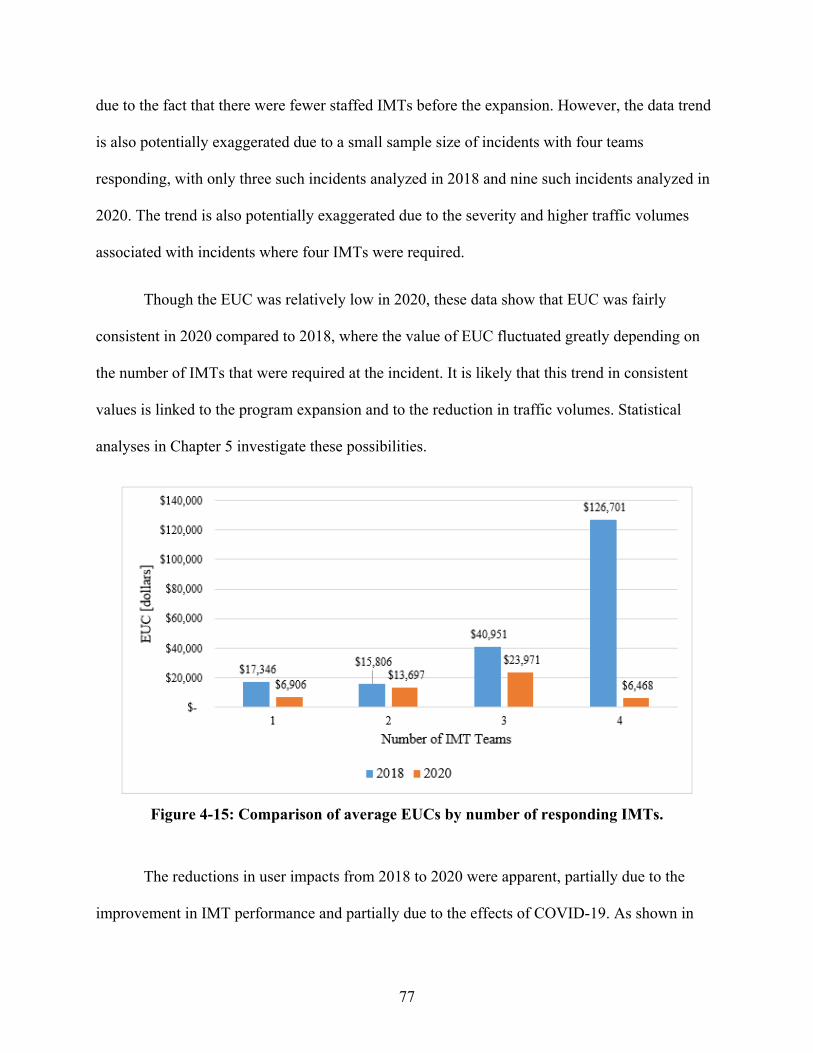
77
due to the fact that there were fewer staffed IMTs before the expansion. However, the data trend
is also potentially exaggerated due to a small sample size of incidents with four teams
responding, with only three such incidents analyzed in 2018 and nine such incidents analyzed in
2020. The trend is also potentially exaggerated due to the severity and higher traffic volumes
associated with incidents where four IMTs were required.
Though the EUC was relatively low in 2020, these data show that EUC was fairly
consistent in 2020 compared to 2018, where the value of EUC fluctuated greatly depending on
the number of IMTs that were required at the incident. It is likely that this trend in consistent
values is linked to the program expansion and to the reduction in traffic volumes. Statistical
analyses in Chapter 5 investigate these possibilities.
Figure 4-15: Comparison of average EUCs by number of responding IMTs.
The reductions in user impacts from 2018 to 2020 were apparent, partially due to the
improvement in IMT performance and partially due to the effects of COVID-19. As shown in

78
Table 4-1, the averages of AV, ETT, and EUC were reduced by 28 percent, 43 percent, and 44
percent respectively between 2018 and 2020.
Table 4-1: Reductions in User Impacts Between 2018 and 2020
Performance
Measure 2018 Average 2020 Average % Reduction
AV [vehicles] 7,642 5,467 28% ETT [minutes] 759.50 429.65 43%
EUC [$] $19,532.78 $10,906.69 44%
The difference in EUC estimates between 2018 and 2020 was also stark for each
individual crash type as shown in Table 4-2 and Table 4-3, respectively. It should be noted that
these estimates of EUC can be considered conservative since they do not account for the cost of
lost time for diverted traffic, rather just those vehicles that join the incident queue. The
difference in EUC estimates and percent difference in EUC estimates between 2018 and 2020 are
shown in Table 4-4 and Table 4-5.
The sample size of incidents able to be measured for EUC for PI and PDO incidents was
greater in 2020 by 22 percent and 7 percent, respectively, but the sample size of incidents able to
be measured for EUC for FII crashes was greater in 2018 by 40 percent, high due to a small
sample size for both 2018 and 2020. Estimates for FII crashes were not included because only
three were analyzed for EUC in 2018 and two in 2020, and these EUC values varied greatly.
Estimates for PI and PDO costs are more reliable and provide a more consistent baseline
estimate of EUC accrued during each data collection period because these crash types occur
much more frequently. Despite the higher number of incidents for which data were collected in
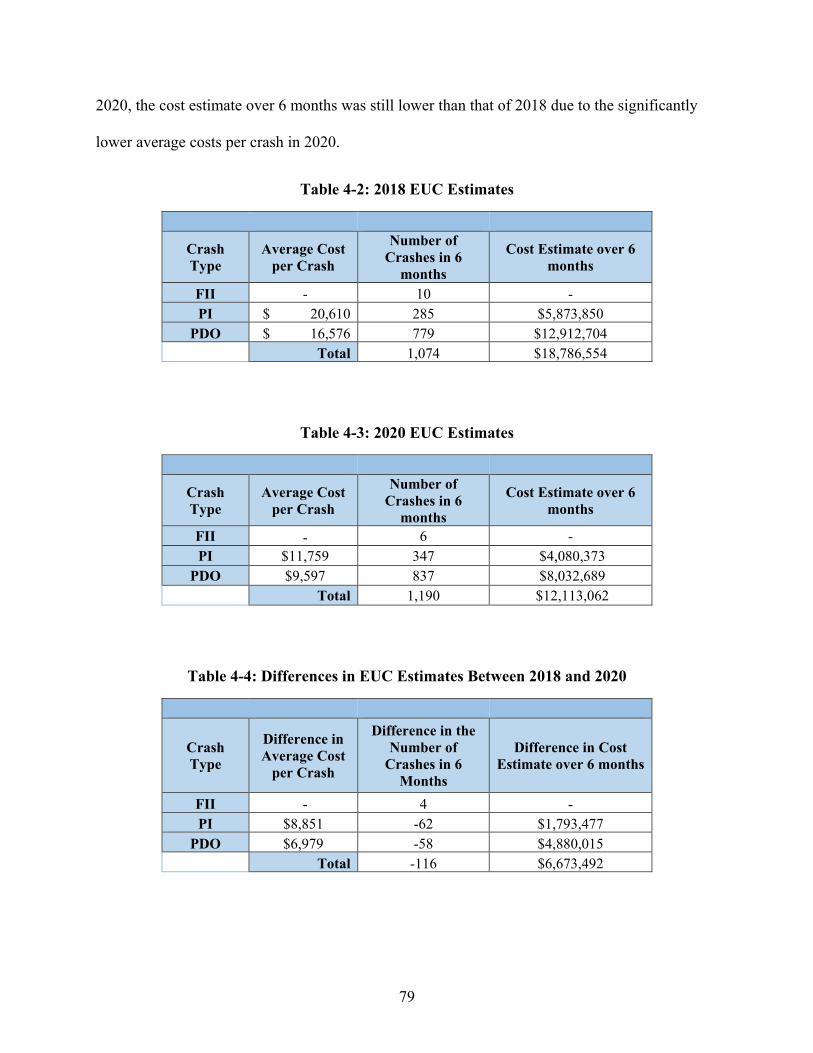
79
2020, the cost estimate over 6 months was still lower than that of 2018 due to the significantly
lower average costs per crash in 2020.
Table 4-2: 2018 EUC Estimates
Crash Type
Average Cost per Crash
Number of Crashes in 6
months
Cost Estimate over 6 months
FII - 10 - PI $ 20,610 285 $5,873,850
PDO $ 16,576 779 $12,912,704 Total 1,074 $18,786,554
Table 4-3: 2020 EUC Estimates
Crash Type
Average Cost per Crash
Number of Crashes in 6
months
Cost Estimate over 6 months
FII - 6 - PI $11,759 347 $4,080,373
PDO $9,597 837 $8,032,689 Total 1,190 $12,113,062
Table 4-4: Differences in EUC Estimates Between 2018 and 2020
Crash Type
Difference in Average Cost
per Crash
Difference in the Number of
Crashes in 6 Months
Difference in Cost Estimate over 6 months
FII - 4 - PI $8,851 -62 $1,793,477
PDO $6,979 -58 $4,880,015 Total -116 $6,673,492

80
Table 4-5: Percent Difference in EUC Estimates Between 2018 and 2020
Crash Type
Percent Difference in Average Cost
per Crash
Percent Difference in the Number of
Crashes in 6 Months
Percent Difference in Cost Estimate over 6
Months
FII - 40% - PI 43% -22% 31%
PDO 42% -7% 38% Total - 36%
The difference in average cost per crash between 2018 and 2020 for PI and PDO crashes
was $8,852 and $6,979, respectively, which equates to 43 percent and 42 percent, respectively.
The difference in cost estimates over 6 months for PI and PDO crashes was $1,793,696 and
$4,879,770, respectively. This equates to 31 percent and 38 percent respectively. Without
accounting for the lower traffic volumes in 2020, EUC was significantly lower by crash type in
2020 than in 2018. When excluding FII crashes, PDO crashes accounted for the majority of the
total costs due to the number of PDO crashes. The difference in total costs between 2018 and
2020 was $6,673,465, which equates to a 36 percent reduction.
Chapter Summary
With the methodology using CAD+TransSuite data, adequate incident data was able to be
collected. In 2018, 1,074 incidents were analyzed for performance measures, with 28.5 percent
of the incidents containing all three performance measures and 17.5 percent of the incidents
meeting criteria to be analyzed for EUC. Of 1,190 incidents analyzed for performance measures
in 2020, 23.5 percent contained all three performance measures and 12.1 percent met criteria to
be analyzed for EUC.

81
For IMT performance measures, RT was lower in 2020 than in 2018, indicating that
IMTs could consistently respond more quickly to incidents over a larger coverage area in 2020.
IMT RCT slightly increased in 2020 compared to 2018, potentially due to the IMTs’ increased
focus on safety and increased coordination with UHP units at incidents. The difference in ICT
between 2018 and 2020 was negligible.
User impacts were significantly lower in 2020 than in 2018. The cost per crash for PI and
PDO crashes was lower by 43 percent and 42 percent, respectively, in 2020 than in 2018. The
cost estimate over 6 months was $6,673,465 lower in 2020 than in 2018, equivalent to a decrease
of 36 percent. The decrease in user impacts is likely influenced by improvements in IMT
performance as a result of the program expansion. However, the results may still be biased due to
the low traffic volumes in 2020 caused by the COVID-19 pandemic. These differences will be
accounted for in the statistical analyses in Chapter 5.

82
5 RESULTS OF STATISTICAL ANALYSES
Overview
Statistical regression analyses were performed on the 2018 and 2020 datasets described in
the previous chapter with the primary purpose of comparing the results of the two years.
Analyses of the performance measures RCT and ICT, as well as the user impacts ETT and EUC,
were run against a number of incident characteristics to determine any meaningful relationships
between them. The incident characteristics used in the analyses include:
• The number of IMTs responding to the scene.
• The number of lanes in the roadway at the location of the bottleneck
• The number of lanes closed by IMT responders at the location of the incident
• The available lanes at the bottleneck (defined as the number of lanes closed at the
incident location subtracted from the lanes in the roadway at the location of the
bottleneck).
• The time of day when the incident occurred.
RCT and ICT were also analyzed against RT. User impacts were analyzed against RT,
UHP RT, RCT, ICT, and UHP ICT performance measures. This study focused on performance
of UDOT’s IMTs, although UHP-related data were also analyzed. As mentioned previously, all
references to ICT and RT in this report denote IMT ICT and RT, respectively. Analyses of UHP
related data are included in Appendix C.

83
Since analyses of performance measures were run against incident characteristics for
RCT and ICT but not for RT, the numbers of incidents analyzed for performance measures differ
slightly from what appear in Table 3-5 and Table 3-6. Those tables show that in 2018 and 2020
there were respectively 306 and 280 incidents collected from CAD+TransSuite data that
contained values of all three performance measures. However, the numbers of incidents analyzed
for ICT and RCT are higher since it was not necessary to contain RT data for most of these
analyses. Incidents were preferably collected that had all three performance measures available,
but since there were fewer incidents with T5 timepoints, some incidents that contained RCT
values were still added to the incident database but not RT values, for instance, to ensure
adequate sample sizes of RCT data. It should be noted that in most analyses of performance
measures in this section, the standard error is greater in 2020 than in 2018, due to the fact that
320 incidents were analyzed for performance measures in 2018 and 289 incidents were analyzed
for performance measures in 2020.
Statistical analyses of the RCT and ICT performance measures were performed for 320
incidents in 2018 and 289 incidents in 2020. The statistical analyses on performance measures
made use of all incidents that had the required ICT or RCT values available, which is why the
numbers of incidents analyzed for performance measures are greater than the number of
incidents collected with all three performance measures. The
The analyses assumed a significance level, α, of 0.05. However, significance for the
respective tests is shown by means of an asterisk scale denoted in Table 5-1 (Ramsey and
Schafer 2013). Significance will be denoted in all analyses found in this chapter by means of
these asterisks. In general, p-values ≤ 0.05 denote that a relationship may be considered

84
significant, whereas p-values > 0.10 denote that a relationship may be considered not significant.
However, p-values may suggest a significant relationship if they lie between 0.05 and 0.10.
Table 5-1: Significance Scale Notation
P-value Significance Evidence p ≤ 0.0001 **** Conclusive
0.0001 < p ≤ 0.01 *** Convincing 0.01 < p ≤ 0.05 ** Moderate 0.05 < p ≤ 0.10 * Suggestive
p > 0.10 ns No evidence In this table and all subsequent tables, “ns” means “not significant”.
It should be noted that statistical significance does not always coincide with practical
importance. There may be relationships that are shown to be significant that do not have much
practical meaning to UDOT. There also may be relationships that are shown to be not significant
statistically but still hold practical importance. For instance, an analyzed value of ETT of 300
minutes could potentially be reported as not significant due to the wide range of ETT values in
the dataset. However, in reality 300 minutes of ETT is a substantial amount of time cost to the
user. For that reason, practical importance should always be considered in conjunction with the
significance reported here. Relationships included in this section are those that the research team
deemed being practically important or of use in understanding the effects of the program
expansion on performance measures and user impacts.
Due to the structure of the data collected and the added factor of the volume difference
between 2018 and 2020 triggered by the COVID-19 pandemic, the statistical analyses for
performance measures and user impacts were performed differently. As described previously in
Section 3.3, the effect of COVID-19 on vehicular volumes had a greater impact on ETT and
EUC than was initially expected. It was important to account for the volume difference when

85
analyzing the user impacts so the results could uniquely reflect the change in the size of the IMT
program between the two years. To accomplish this, a regression comparison of user impacts
between 2018 and 2020 was performed to account for the volume difference. More details about
this direct analysis will be provided in Section 5.3.
For the performance measure data, regression analyses were performed separately for the
2018 and 2020 data and then results were compared side-by-side. The research team assumed
that the work performed by IMTs would not be directly affected by the queue size, or would
more likely be affected by the nature and magnitude of crashes. This assumption allowed all
incidents for which performance measures were collected to be included in the analysis even if
they were not analyzed for user impacts, since volumes were only collected for those incidents
that met certain criteria, as described in Chapter 3. The results of analyses on performance
measures and user impacts will be described in the following sections.
Performance Measures
Analyses were run for both RCT and ICT. However, in most instances the RCT and ICT
were highly correlated. This was the case both for 2018 and 2020, as shown in Figure 5-1 and
Figure 5-2, which depict both the RCT and ICT for the incidents collected in each year. It can be
seen from the figures that both performance measures tend to fall in the same range of minutes
for the majority of incidents. For that reason, only the results of analyses for RCT are included in
this section. Results for ICT are included in Appendix B.

86
Figure 5-1: Linear relationship between RCT and ICT in 2018.
Figure 5-2: Linear relationship between RCT and ICT in 2020.
This section includes results of statistical analyses performed on RCT against a number
of incident characteristics, including the number of IMTs responding to the scene, the number of

87
lanes at the location of the bottleneck, the number of lanes closed by IMT responders, and the
time of day when the incident occurred. An analysis was also performed on RCT against RT.
The performance measures were analyzed to test for the fixed effects of each incident
characteristic and for crash type, since severity is directly related to the on-scene requirements of
the IMTs.
5.2.1 RCT vs. Number of IMTs
Table 5-2 and Table 5-3 show results for the analysis of RCT versus the number of IMTs
responding to the scene.
Table 5-2: Significance of RCT vs. Number of IMTs
Are RCT values dependent on the number of IMTs?
Year p > |t| Significance 2018 0.0195 ** 2020 <0.0001 ****
Table 5-3: Analysis of RCT on Number of IMTs
Number of
IMTs Year Mean RCT
[minutes] Lower Upper SE Sample
Size DF p > |t| Significance
1 2018 104.21 93.90 114.53 5.24 191 314 <0.0001 **** 2020 121.05 109.43 132.68 5.90 172 280 <0.0001 ****
2 2018 114.50 104.28 124.71 5.19 113 314 <0.0001 **** 2020 122.17 108.95 135.39 6.72 78 280 <0.0001 ****
3 2018 131.18 108.82 153.54 11.37 13 314 <0.0001 **** 2020 148.36 131.47 165.26 8.58 27 280 <0.0001 ****
4 2018 110.69 68.49 152.89 21.45 3 314 <0.0001 **** 2020 121.84 95.38 148.30 13.44 9 280 <0.0001 ****
5 2020 177.00 104.26 249.74 36.95 1 280 <0.0001 **** 6 2020 126.63 53.86 199.40 36.97 1 280 0.0007 *** 8 2020 390.07 317.33 462.81 36.95 1 280 <0.0001 ****
Note that in this table and in all that follow, SE refers to the standard error and DF refers to the degrees of freedom.

88
Table 5-2 describes the effect that the number of IMTs has on the RCT. The p-values in
this table indicate the significance of the regression model. In this case low p-values indicate a
good fit of the model, meaning that there is a significant difference in RCTs between incidents
with differing numbers of IMT responders, both for 2018 and 2020. Table 5-3 shows estimates
for the mean RCT by number of IMTs for both 2018 and 2020. The p-values in this table are not
indications of model significance, but rather of the significance of individual estimates within the
model. In this case, the low p-values associated with the estimated means, or model coefficients,
all indicate that the estimates are significantly different from zero. The distinction between p-
values of the regression models and of the model estimates is carried throughout the chapter.
Tables following the general format of Table 5-2 provide p-values that indicate the significance
of the regression models themselves, and tables fallowing the general format of Table 5-3
provide p-values that indicate the significance of model coefficients.
Table 5-3 also shows adequate sample sizes of incidents with one, two, and three IMTs in
both 2018 and 2020. For incidents with four, five, six, and eight IMTs at an incident, the sample
sizes are smaller and therefore the estimates are less reliable since smaller sample sizes tend to
have a larger distribution than larger samples and are also typically more affected by outliers.
There was only one case each of incident scenarios where five, six, or eight IMTs
responded to the scene in 2020, and none in 2018. Even though the estimates may be less
reliable, the fact that UDOT’s IMT program was capable of sending larger numbers of IMTs to
incidents when needed is a good indication of the added flexibility and capability of the program
after the expansion. It is likely that incidents occurred in 2018 for which five or more IMTs
would have been beneficial, but the resources were either not available or spread too thinly to be
of use when the need arose.

89
For both 2018 and 2020, there is a generally positive trend between the number of IMTs
responding to the scene and the RCT for the incident. This can be seen clearly in Figure 5-3. The
positive trend is a somewhat expected result, as the number of IMTs is likely related to severity
of the incident. Values of RCT may be somewhat higher due to extraneous circumstances related
to the COVID-19 pandemic, as discussed in Section 4.3. This consideration is at play in all the
analyses of RCT in this section.
Figure 5-3: RCT vs. number of responding IMTs.
5.2.2 RCT vs. Number of Lanes at Bottleneck
Table 5-4 and Table 5-5 show results for the analysis of RCT versus the number of lanes
in the direction corresponding to the crash at the location of the bottleneck. For example, if an
incident occurred on an eight-lane freeway in the northbound direction, then there would be four
lanes at the bottleneck.

90
Table 5-4: Significance of RCT vs. Number of Lanes at Bottleneck
Are RCT values dependent on the number of lanes at the bottleneck?
Year p > |t| Significance 2018 0.411 ns 2020 0.0765 *
Table 5-5: Analysis of RCT vs. Number of Lanes at Bottleneck
Lanes at
Bottleneck Year Mean RCT
[minutes] Lower Upper SE Sample
Size DF p > |t| Significance
1 2018 --- --- --- --- --- --- --- --- 2020 98.80 74.66 122.93 12.23 20 181 <0.0001 ****
2 2018 124.33 69.25 179.40 27.91 1 182 <0.0001 **** 2020 130.57 101.46 159.68 14.75 4 181 <0.0001 ****
3 2018 101.69 86.20 117.17 7.85 18 182 <0.0001 **** 2020 130.82 110.27 151.38 10.42 19 181 <0.0001 ****
4 2018 92.74 79.08 106.41 6.93 39 182 <0.0001 **** 2020 137.57 117.76 157.37 10.04 31 181 <0.0001 ****
5 2018 89.36 77.53 101.19 5.99 59 182 <0.0001 **** 2020 126.33 107.50 145.15 9.54 39 181 <0.0001 ****
6 2018 93.19 80.64 105.75 6.36 64 182 <0.0001 **** 2020 127.64 111.13 144.15 8.37 73 181 <0.0001 ****
7 2018 83.70 62.80 104.60 10.59 9 182 <0.0001 **** 2020 137.42 97.71 177.13 20.12 4 181 <0.0001 ****
Table 5-4 indicates that in 2018 there was not any significant relationship between the
number of lanes at the bottleneck and the RCT. In 2020 there is a suggestive but inconclusive
relationship, indicating that the mean RCT from at least one lane configuration is different from
the others. This result is likely due to the fact that for 2020 there is a low mean RCT for incidents
with one lane at the bottleneck whereas the mean RCTs in 2020 for all other lane configurations
are somewhat consistent.
There were no analyzed instances of crashes occurring at locations with only one lane at
the bottleneck in 2018, which in this case would comprise single-lane freeway connector ramps.

91
Adequate samples are present for situations where three, four, five, and six lanes are present at
the incident bottleneck, while less reliable results may be drawn from one, two, and seven-lane
bottleneck situations. Table 5-5 indicates that the estimated means are significantly different
from zero. Figure 5-4 provides a visual comparison of trends in mean RCTs by lane
configuration for 2018 and 2020.
Figure 5-4: RCT vs. number of lanes at the bottleneck.
In Figure 5-4 there is a somewhat downward trend for 2018 RCT as the number of the
lanes at the bottleneck increases. This could be due to a number of reasons. Higher speeds in less
congested areas away from the urban centers, such as where two or three lanes exist at the
bottleneck, could lead to more severe incidents that require more clearance work. This trend
could also emphasize the fact that the urban areas of Regions 2 and 3 were the focus of IMT
work prior to the expansion, whereas the larger program in 2020 may be more capable of
reaching and clearing incidents more on the periphery of these urban areas. The RCTs are higher

92
overall in 2020, likely because of COVID-19, but RCT values are also more stable across the
range of bottleneck lane numbers in 2020 than in 2018, indicating that the expanded program is
more flexible in responding to incidents as needed.
5.2.3 RCT vs. Number of Lanes Closed
Table 5-6 and Table 5-7 show results for the analysis of RCT versus the number of lanes
closed by IMTs. The number of lanes closed is an indication of the magnitude of an incident.
Table 5-6: Significance of RCT vs. Number of Lanes Closed
Are RCT values dependent on the number of lanes closed?
Year p > |t| Significance 2018 0.0159 **
2020 0.0001 ****
Table 5-7: Analysis of RCT vs. Number of Lanes Closed
Lanes Closed
Year Mean RCT [minutes]
Lower Upper SE Sample Size
DF p > |t| Significance
1 2018 103.42 91.89 114.96 5.86 170 312 <0.0001 **** 2020 111.66 97.90 125.42 6.99 127 255 <0.0001 ****
2 2018 106.33 93.99 118.66 6.27 82 312 <0.0001 **** 2020 128.26 114.10 142.42 7.19 75 255 <0.0001 ****
3 2018 119.87 106.26 133.48 6.92 50 312 <0.0001 **** 2020 132.13 115.27 148.99 8.56 37 255 <0.0001 ****
4 2018 116.32 94.66 137.97 11.01 13 312 <0.0001 **** 2020 137.89 118.75 157.03 9.72 21 255 <0.0001 ****
5 2018 147.24 110.47 184.01 18.69 4 312 <0.0001 **** 2020 214.16 157.96 270.36 28.54 2 255 <0.0001 ****
6 2018 61.53 -14.07 137.12 38.42 1 312 0.1103 ns 2020 112.52 33.74 191.30 40.00 1 255 0.0053 ***
Table 5-6 indicates that there is a significant relationship between RCT and the number
of lanes closed for both 2018 and 2020. Table 5-7 indicates that there were adequate sample

93
sizes of incidents for which one, two, three, or four lanes were closed, with much smaller
samples of incidents with five or six lanes closed. Trends in the data can be seen in Figure 5-5.
Figure 5-5: RCT vs. number of lanes closed.
There is a slight upward trend in RCT as the number of lanes closed increases, which is
an expected result given that lane closures require more work from the IMTs.
5.2.4 RCT vs. Number of Available Lanes
An analysis of RCT was also performed in relation to the number of available lanes.
However, this parameter ignores the temporal aspect of IMT work. For instance, an incident may
have different lanes closed at different times, such as is the case of the incident shown in Figure
5-6. The analysis performed on available lanes considers the number of lanes closed for at least
some period of time at some point during the incident. For instance, in Figure 5-6, the available
lanes for this incident would be three, though for a large part of the incident duration there were

94
four lanes available. For that reason, the number of available lanes may not be a helpful factor to
consider in all scenarios.
Figure 5-6: Incident visualization showing time length of lane closures.
Table 5-8 and Table 5-9 show results for the analysis of RCT versus the number of lanes
available at the location of the incident. Figure 5-7 shows a visual representation of the results.
Table 5-8: Significance of RCT vs. Number of Available Lanes
Are RCT values dependent on the number of available lanes?
Year p > |t| Significance 2018 0.0118 **
2020 0.0321 **
10.7
66.165.6
0
10
20
30
40
50
60
70
80
Lane 1 Lane 2 Lane 3 Lane 4 Lane 5
Min
utes
Lane
Open Closed RTRCT ICT

95
Table 5-9: Analysis of RCT on Number of Available Lanes
Available
Lanes Year Mean RCT
[minutes] Lower Upper SE Sample
Size DF p > |t| Significance
0 2018 108.08 90.93 125.23 8.69 8 181 <0.0001 **** 2020 112.89 92.22 133.57 10.48 30 180 <0.0001 ****
1 2018 90.94 75.34 106.54 7.91 17 181 <0.0001 **** 2020 133.23 109.66 156.79 11.94 22 180 <0.0001 ****
2 2018 95.39 80.46 110.31 7.57 27 181 <0.0001 **** 2020 137.08 115.68 158.47 10.84 25 180 <0.0001 ****
3 2018 92.45 79.46 105.44 6.58 57 181 <0.0001 **** 2020 129.10 108.46 149.75 10.46 45 180 <0.0001 ****
4 2018 80.93 67.47 94.38 6.82 45 181 <0.0001 **** 2020 115.89 94.96 136.82 10.61 41 180 <0.0001 ****
5 2018 77.76 62.86 92.66 7.55 27 181 <0.0001 **** 2020 107.01 83.93 130.09 11.70 24 180 <0.0001 ****
6 2018 77.92 55.20 100.64 11.52 7 181 <0.0001 **** 2020 103.60 49.05 158.14 27.64 2 180 0.0002 ***
Figure 5-7: RCT vs. number of available lanes.

96
Table 5-8 indicates that there is a significant relationship between RCT and the number
of available lanes both in 2018 and in 2020. There is a somewhat even spread of samples with
the respective number of lane closures.
Those incidents with zero available lanes are those in which all lanes of the roadway
must be blocked off. For these incidents it is expected that there will be significant delay, though
lower delay may actually be shown for the duration of the incident due to the fact that volumes
passing the bottleneck are zero during the time when all lanes are closed. Drivers may also be
warned in advance of the shutdown and take detours. The trend of lower RCTs as the number of
available lanes increases is an expected result, since a lower number of lane closures generally
means less work for the IMTs to perform.
5.2.5 RCT vs. Time of Day
Incidents were organized into bins depending on the time that the incident occurred since
different times of day experience different travel patterns. IMT members’ work shifts also
fluctuate over the course of the day. The bins for the respective times of day considered were
previously shown in Table 3-1 and are shown again in Table 5-10 for convenience. Table 5-11
and Table 5-12 show results for the analysis done of RCT versus the time of day of the incident.
Figure 5-8 shows a visual representation of the results.
Table 5-10: Time of Day of Incidents
Morning Off Peak 12:00 A.M. to 6:30 A.M. AM Peak 6:30 A.M. to 9:10 A.M. Afternoon Off Peak 9:10 A.M. to 3:50 P.M. PM Peak 3:50 P.M. to 6:30 P.M. Night Off Peak 6:30 P.M. to 11:59 P.M.

97
Table 5-11: Significance of RCT vs. Time of Day
Are RCT values dependent on the time of day? Year p > |t| Significance 2018 <0.0001
****
2020 0.002 ***
Table 5-12: Analysis of RCT vs. Time of Day
Time of
Day Year Mean RCT
[minutes] Lower Upper SE Sample
Size DF p > |t| Significance
Morning Off Peak
2018 155.61 130.05 181.18 12.99 8 313 <0.0001 **** 2020 150.65 130.17 171.13 10.41 19 282 <0.0001 ****
AM Peak 2018 85.64 72.35 98.93 6.76 87 313 <0.0001 **** 2020 118.60 101.85 135.35 8.51 44 282 <0.0001 ****
Afternoon Off Peak
2018 95.80 83.71 107.88 6.14 134 313 <0.0001 **** 2020 128.99 114.91 143.06 7.15 113 282 <0.0001 ****
PM Peak 2018 84.44 71.17 97.70 6.74 88 313 <0.0001 **** 2020 113.43 99.08 127.79 7.29 83 282 <0.0001 ****
Night Off Peak
2018 188.53 146.33 230.73 21.45 3 313 <0.0001 **** 2020 126.16 109.71 142.60 8.36 30 282 <0.0001 ****
Figure 5-8: RCT vs. time of day.

98
The statistics in Table 5-11 indicate that in both 2018 and 2020 there is a significant
relationship between RCT and time of day when the incident occurs. Table 5-12 shows adequate
samples in 2018 and 2020 for AM Peak, Afternoon Off Peak, and PM Peak periods. Much lower
samples were found in the Morning Off Peak and Night Off Peak. However, it should be noted
that the sample size of incidents serviced by IMTs during these periods was much greater in
2020 than in 2018. In 2018, eight analyzable incidents occurred during the Morning Off Peak
period and three occurred during the Night Off Peak. The 2020 Morning Off Peak sample more
than doubled to 19, while the Night Off Peak increased tenfold to 30. This is a clear indication
that there is a need for IMT services outside of previously established operating hours, and that
the program expansion has allowed UDOT to meet those needs.
Figure 5-8 clearly shows larger RCTs for incidents that occur in the off-peak periods,
particularly the Morning and Night Off Peaks. This result could be explained in a number of
ways. Off peak periods are likely less congested, which may lead to higher speeds and more
serious crashes, requiring more extensive clean-up efforts. However, this analysis accounted for
crash type, so this should not be the primary explanation. It is more likely that a lower number of
units on patrol outside of the peak periods results in longer RT before beginning to clear the
roadway. As previously stated, AV may not have a sizeable impact on the performance of IMTs,
since the queue length does not directly affect the work that IMTs perform.
Given this context, the difference between 2018 and 2020 is likely representative of the
ability of the IMT program to reach more incidents in a timely manner after the program
expansion. RCTs are much more consistent in 2020 regardless of the time of day when the
incidents occur when compared with 2018.

99
5.2.6 RCT vs. RT
An analysis was also run comparing the RCTs in 2018 and 2020 to the distribution of
RTs for each year. Table 5-13 is a statistical output that shows the solution for fixed effects of
the regression analysis run on RT and crash type for the 2020 dataset. Table 5-14 shows a
summary of the results of the analysis of RCT versus RT.
Table 5-13: Solution of Fixed Effects for Regression of RCT vs. RT and Crash Type
Effect Crash Type Estimate Lower Upper SE DF t Value p > |t| Significance Intercept 52.87 44.23 61.53 4.39 271 12.04 <0.0001 **** Crash Type FII Crash 189.61 150.82 228.41 19.71 271 9.62 <0.0001 **** Crash Type PDO Crash -8.45 -18.28 1.36 4.99 271 -1.7 0.0912 * Crash Type PI Crash 0 . . . . . . . RT 0.50 0.09 0.91 0.21 271 2.43 0.0159 **
Table 5-14: Analysis of RCT on RT
Year Mean RCT per minute RT Lower Upper SE Sample Size p > |t| Significance 2018 0.82 0.56 1.07 0.13 303 <0.0001 **** 2020 0.50 0.09 0.91 0.21 275 0.0159 **
Table 5-13 gives an example of the full regression, in this case on the 2020 dataset. The
significance shown in the table indicates whether or not each variable has a significant effect on
the RCT estimate after all other variables are held constant, or fixed. An equation for this
regression can be drawn from the fixed effects as shown in Equation 5-1:
𝑅𝑅𝑅𝑅𝑅𝑅 (𝑚𝑚𝑚𝑚𝑚𝑚𝑚𝑚𝑚𝑚𝑚𝑚𝑚𝑚) = 52.87 + 189.61 ∗ 𝐹𝐹𝐹𝐹𝐹𝐹 𝑅𝑅𝐶𝐶𝐶𝐶𝑚𝑚ℎ − 8.45 ∗
𝑃𝑃𝑃𝑃𝑃𝑃 𝑅𝑅𝐶𝐶𝐶𝐶𝑚𝑚ℎ + 0.50 ∗ 𝑅𝑅𝑅𝑅(𝑚𝑚𝑚𝑚𝑚𝑚𝑚𝑚𝑚𝑚𝑚𝑚𝑚𝑚), (5-1)
where PI Crash is a reference level and where both FII Crash (yes = 1, no = 0) and PDO Crash
(yes = 1, no = 0) are indicator variables.

100
Table 5-14 indicates that after accounting for crash type, there is still a significant effect
of RT on RCT for both 2018 and 2020. For 2018, each added minute of RT translates to about
0.8 minutes of added RCT. For 2020, this value is about 0.5 minutes of RCT per minute of RT.
This analysis is statistically significant but the results are expected since both RT and RCT begin
at T1, so the analysis may not be of great practical importance on its own.
However, fewer minutes of RCT per minute of RT in 2020 could be due to a couple of
reasons. This result would occur if there were equal RCTs in 2018 and 2020 with longer RTs in
2020, or if there were equal RTs in 2018 and 2020 with shorter RCTs in 2020. It has been
shown, however, that both of these scenarios are not the case. The program expansion has shifted
the distribution of RT towards quicker responses, and other analyses have shown that RCT is
slightly larger on average in 2020 than in 2018. A likely explanation is that the expanded
program is now able to service a number of smaller incidents that may not have been prioritized
in 2018 with fewer resources available compared to 2020. This regression shows that RCT
cannot be described solely by crash type, but that RT also has an effect on the time it takes to
clear the lanes at the scene of the incident.
User Impacts
The results of the statistical analyses performed on the user impacts gathered in 2018 and
2020 are shown in this section. Analyses were run for both ETT and EUC. Because the EUC is
calculated as a function of ETT, these two values are very well correlated. However, results are
shown separately since it is beneficial to see impacts of incidents in terms of both time and cost.
This section includes results of statistical analyses of ETT and EUC versus a number of
incident characteristics, including the number of IMTs responding, the number of lanes at the

101
location of the bottleneck, the number of lanes closed by IMT responders, and the time of day
when the incident occurred. These characteristics were all included as indicator variables.
Analyses of ETT and EUC were also performed against the performance measures RT, RCT, and
ICT, which are continuous variables.
All analyses of user impacts were adjusted for crash type, as was the case with the
performance measures analysis. However, it was also necessary to adjust the analyses of user
impacts for volumes, given the volume difference between 2018 and 2020 caused by COVID-19.
While the regression analysis of performance measures was done separately for the 2018 and
2020 datasets and the results compared side by side, a direct regression of the two years was
necessary to account for the volume difference in the user impacts analysis.
These analyses of user impacts were run to test for the fixed effects of each incident
characteristic like the performance measures analyses, but accounted for more than simply crash
type. Whereas t-tests were run on the performance measure data to compare the means of
performance measures for 2018 and 2020, F-tests are used on the user impact data to compare
the variances of each user impact for 2018 and 2020. These F-tests are appropriate for the
regression analyses being performed on the user impact data.
Regression of each incident characteristic was adjusted for the fixed effects of crash type
as well as AV, year, and the interaction between year and the incident characteristic. Inclusion of
the interaction term between the year and each incident characteristic allowed the research team
to obtain an estimate of the unique effect of the program size on the user impacts and evaluate
the benefits of the program expansion.

102
5.3.1 ETT and EUC vs. Number of IMTs
Table 5-15 and Table 5-16 are statistical outputs that show the fixed effects of the
regression analyses of ETT and EUC versus the number of IMTs responding to the scene,
respectively, for both 2018 and 2020 combined.
Table 5-15: Fixed Effects for Regression of ETT vs. Number of IMTs
Effect Num. DF Den. DF F Value p > F Significance AV 1 323 187.68 <0.0001 **** Crash Type 2 323 3.16 0.0436 ** Year 1 323 46.18 <0.0001 **** Number of IMTs 3 323 19.76 <0.0001 **** Year * Number of IMTs 3 323 18.92 <0.0001 **** In this table and all that follow, Num. DF and Den. DF refer to numerator and denominator degrees of freedom,
respectively.
Table 5-16: Fixed Effects for Regression of EUC vs. Number of IMTs
Effect Num. DF Den. DF F Value p > F Significance AV 1 323 178.22 <0.0001 **** Crash Type 2 323 3.15 0.0442 ** Year 1 323 48.33 <0.0001 **** Number of IMTs 3 323 20.60 <0.0001 **** Year * Number of IMTs 3 323 19.90 <0.0001 ****
The tables show results of F-tests performed to show whether each effect had an impact
on ETT and EUC after accounting for the effect of all other variables. For instance, with p-values
< 0.0001, it is shown that the AVs associated with incidents have a significant effect on the ETT
and EUC, all other variables held constant. This result demonstrates the expected relationship
between the size of the queue and the travel time added due to the incident. Both ETT and EUC

103
for the crash type effect also have a significant impact after adjusting for all other variables. All
other fixed effects can be interpreted in a similar manner.
The focus of these analyses, however, is the interaction term between the incident
characteristic and year, which by holding all other effects constant describes the difference in
ETT and EUC between 2018 and 2020 due to the program size. Table 5-15 and Table 5-16 show
with conclusive evidence (p-value < 0.0001) that there is a difference in ETT and EUC between
2018 and 2020 depending on the number of IMTs after accounting for the volume difference
caused by COVID-19. The expansion of the IMT program does have an effect on ETT and EUC,
even after removing the effect of the difference in traffic volumes in 2018 and 2020.
Therefore, to focus on the effects of the program expansion on IMT operations, the
additional analyses in this section will focus solely on the effect of the interact term on user
impacts, following the format of Table 5-17 and Table 5-18, which show the significance of
program size on the incident characteristic. Estimates that follow are the least squares averages
of ETT and EUC for each incident characteristic and are the estimates solely attributed to the
interaction term, which indicates the effects of program size.
Table 5-17: Significance of IMT Program Size vs. ETT for Number of IMTs
Does the difference in ETT between 2018 and 2020 depend on the number of IMTs, after accounting for volume differences?
p > F Significance <0.0001 ****
Table 5-18: Significance of IMT Program Size vs. EUC for Number of IMTs
Does the difference in EUC between 2018 and 2020 depend on the number of IMTs, after accounting for volume differences?
p > F Significance <0.0001 ****
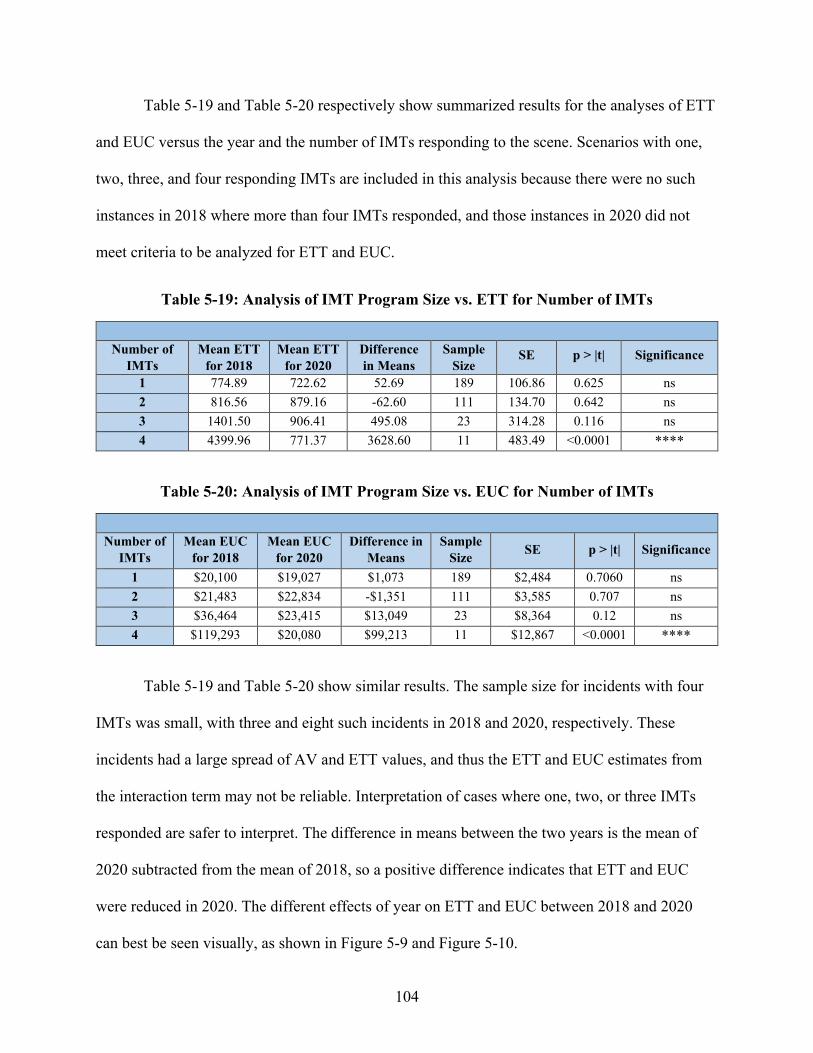
104
Table 5-19 and Table 5-20 respectively show summarized results for the analyses of ETT
and EUC versus the year and the number of IMTs responding to the scene. Scenarios with one,
two, three, and four responding IMTs are included in this analysis because there were no such
instances in 2018 where more than four IMTs responded, and those instances in 2020 did not
meet criteria to be analyzed for ETT and EUC.
Table 5-19: Analysis of IMT Program Size vs. ETT for Number of IMTs
Number of
IMTs Mean ETT
for 2018 Mean ETT
for 2020 Difference in Means
Sample Size
SE p > |t| Significance
1 774.89 722.62 52.69 189 106.86 0.625 ns 2 816.56 879.16 -62.60 111 134.70 0.642 ns 3 1401.50 906.41 495.08 23 314.28 0.116 ns 4 4399.96 771.37 3628.60 11 483.49 <0.0001 ****
Table 5-20: Analysis of IMT Program Size vs. EUC for Number of IMTs
Number of
IMTs Mean EUC
for 2018 Mean EUC
for 2020 Difference in
Means Sample
Size SE p > |t| Significance
1 $20,100 $19,027 $1,073 189 $2,484 0.7060 ns 2 $21,483 $22,834 -$1,351 111 $3,585 0.707 ns 3 $36,464 $23,415 $13,049 23 $8,364 0.12 ns 4 $119,293 $20,080 $99,213 11 $12,867 <0.0001 ****
Table 5-19 and Table 5-20 show similar results. The sample size for incidents with four
IMTs was small, with three and eight such incidents in 2018 and 2020, respectively. These
incidents had a large spread of AV and ETT values, and thus the ETT and EUC estimates from
the interaction term may not be reliable. Interpretation of cases where one, two, or three IMTs
responded are safer to interpret. The difference in means between the two years is the mean of
2020 subtracted from the mean of 2018, so a positive difference indicates that ETT and EUC
were reduced in 2020. The different effects of year on ETT and EUC between 2018 and 2020
can best be seen visually, as shown in Figure 5-9 and Figure 5-10.

105
Figure 5-9: Estimates of ETT vs. year and number of IMTs.
Figure 5-10: Estimates of EUC vs. year and number of IMTs.
106
The figures indicate that regardless of the number of IMTs in the program, IMTs are able
to similarly respond to incidents where one or two teams are required. Where three or four IMTs
are required at the scene, the program is shown to be capable of responding to incidents in such a
way that results in lower ETT and EUC. This could be due to a number of components, including
the sample size of these types of crashes. For instance, in the 2018 sample there were 10
incidents with three or four IMTs present, whereas in 2020 there were 24 such incidents.
However, it should be reiterated that the difference in volumes between 2018 and 2020 has
already been accounted for in the fixed effects.
The estimates of EUC shown in Table 5-20 and Figure 5-10 represent the impact of
program size after accounting for all other fixed effects. Having a greater number of IMTs
available does have direct benefits in reducing ETT and EUC. Additionally, ETT and EUC are
much more consistent in 2020 than in 2018, indicated by the fact that their respective values stay
largely the same regardless of the number of teams responding. Having more IMTs does not
mean that the program can necessarily clear all incidents faster, but it does provide the capability
of clearing all incidents more consistently. This pattern of consistent ETT and EUC is
corroborated in the analysis of ETT and EUC versus the number of lanes closed.
5.3.2 ETT and EUC vs. Number of Lanes at Bottleneck
Statistical analysis proved that there was no relationship between ETT or EUC and the
number of lanes at the bottleneck, as indicated in Table 5-21 and Table 5-22.

107
Table 5-21: Significance of IMT Program Size vs. ETT for Lanes at Bottleneck
Does ETT between 2018 and 2020 depend on the number of lanes at the bottleneck, after accounting for volume differences?
p > F Significance 0.8237 ns
Table 5-22: Significance of IMT Program Size vs. EUC for Lanes at Bottleneck
Does EUC between 2018 and 2020 depend on the number of lanes at the bottleneck, after accounting for volume differences?
p > F Significance 0.8779 ns
The fact that the number of lanes at the bottleneck has no significant effect on ETT or
EUC indicates that incidents are not served better by the expanded program than the program in
2018 based on roadway geometry alone. It is more likely that crash severity has a greater impact
on accrual of ETT and EUC at an incident.
5.3.3 ETT and EUC vs. Number of Lanes Closed
Table 5-23 through Table 5-26 show results for the analysis of ETT and EUC versus the
number of lanes closed by IMTs at the location of the incident. The effect of program size on
ETT and EUC with respect to the number of lanes closed is shown in Table 5-23 and Table 5-24.
Estimates of the differences in ETT and EUC between the two years for each respective number
of lanes closed are shown in Table 5-25 and Table 5-26.
Table 5-23: Significance of IMT Program Size vs. ETT for Lanes Closed
Does ETT between 2018 and 2020 depend on the number of lanes closed, after accounting for volume differences?
p > F Significance <0.0001 ****
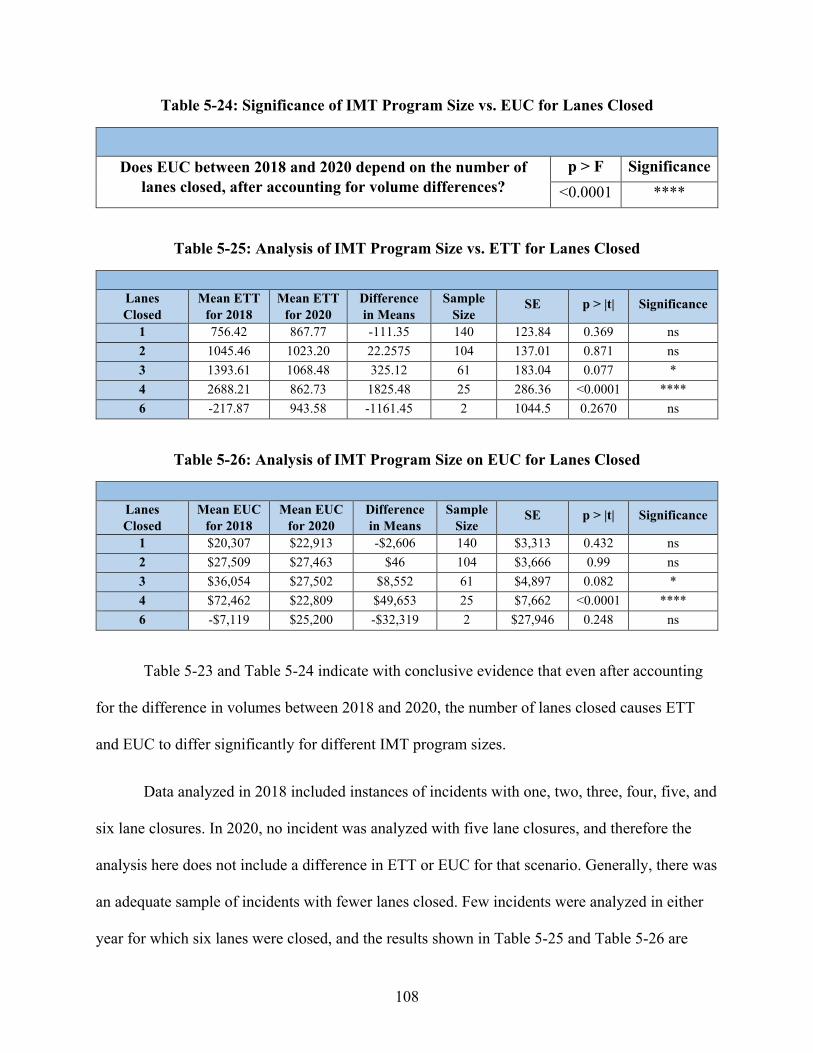
108
Table 5-24: Significance of IMT Program Size vs. EUC for Lanes Closed
Does EUC between 2018 and 2020 depend on the number of lanes closed, after accounting for volume differences?
p > F Significance <0.0001 ****
Table 5-25: Analysis of IMT Program Size vs. ETT for Lanes Closed
Lanes Closed
Mean ETT for 2018
Mean ETT for 2020
Difference in Means
Sample Size
SE p > |t| Significance
1 756.42 867.77 -111.35 140 123.84 0.369 ns 2 1045.46 1023.20 22.2575 104 137.01 0.871 ns 3 1393.61 1068.48 325.12 61 183.04 0.077 * 4 2688.21 862.73 1825.48 25 286.36 <0.0001 **** 6 -217.87 943.58 -1161.45 2 1044.5 0.2670 ns
Table 5-26: Analysis of IMT Program Size on EUC for Lanes Closed
Lanes Closed
Mean EUC for 2018
Mean EUC for 2020
Difference in Means
Sample Size
SE p > |t| Significance
1 $20,307 $22,913 -$2,606 140 $3,313 0.432 ns 2 $27,509 $27,463 $46 104 $3,666 0.99 ns 3 $36,054 $27,502 $8,552 61 $4,897 0.082 * 4 $72,462 $22,809 $49,653 25 $7,662 <0.0001 **** 6 -$7,119 $25,200 -$32,319 2 $27,946 0.248 ns
Table 5-23 and Table 5-24 indicate with conclusive evidence that even after accounting
for the difference in volumes between 2018 and 2020, the number of lanes closed causes ETT
and EUC to differ significantly for different IMT program sizes.
Data analyzed in 2018 included instances of incidents with one, two, three, four, five, and
six lane closures. In 2020, no incident was analyzed with five lane closures, and therefore the
analysis here does not include a difference in ETT or EUC for that scenario. Generally, there was
an adequate sample of incidents with fewer lanes closed. Few incidents were analyzed in either
year for which six lanes were closed, and the results shown in Table 5-25 and Table 5-26 are

109
therefore not representative of the reality of those scenarios. The p-values from these tables also
indicate that estimates of ETT and EUC for incidents where one, two, and six lanes are closed
are not very significant in their magnitude, especially when compared with the very low p-values
associated with ETT and EUC for incidents where four lanes were closed.
The negative ETT and EUC in 2018 for incidents with six-lane closures indicates that
drivers gained time due to the incident. This is likely related to the fact that a complete closure of
the roadway removes congestion beyond the bottleneck, and travel times after closure may
actually improve for the vehicles trapped in the queue, especially where recurring congestion
would exist otherwise. This was the case in some instances, but is not the norm. Relationships
given in the tables are represented visually in Figure 5-11 and Figure 5-12.
Figure 5-11: Estimates of ETT by program size and number of lanes closed.

110
Figure 5-12: Estimates of EUC by program size and number of lanes closed.
It is important to evaluate the differences in ETT and EUC from both years. It appears
that where one lane was closed, ETT values were slightly larger in 2020 than in 2018 after
accounting for AV. The values of RCT were shown to be slightly higher in 2020 than in 2018.
However, in spite of this there is a generally positive trend in the difference in ETT and EUC
between 2018 and 2020 as the number of lanes closed increases. This can be seen clearly in
Figure 5-11 and Figure 5-12.
A similar trend to what was seen in the analysis of the number of IMTs at the scene of an
incident is seen in this analysis. Where one or two lanes are closed, the values of ETT and EUC
are similar before and after the program expansion. However, where three or four lanes are
closed, the ETT and EUC values are much lower in 2020 than in 2018. Again, the consistency of
ETT and EUC is much greater in 2020 than in 2018. Regardless of the number of lanes closed,

111
the values of ETT in 2020 were all within roughly 200 minutes of each other and the values of
EUC in 2020 were all within roughly $4,700 of each other, whereas in 2018 ETT and EUC
increased with the number of lanes closed. The difference indicates again that the expanded
program is capable of providing a much more consistent service.
5.3.4 ETT and EUC vs. Number of Available Lanes
Statistical analysis proved that program size caused no difference in ETT or EUC based
on the number of available lanes at the bottleneck, as indicated in Table 5-27 and Table 5-28.
Table 5-27: Significance of IMT Program Size vs. ETT for Number of Available Lanes
Does ETT between 2018 and 2020 depend on the number of available lanes, after accounting for volume differences?
p > F Significance 0.2624 ns
Table 5-28: Significance of IMT Program Size vs. EUC for Number of Available Lanes
Does EUC between 2018 and 2020 depend on the number of available lanes, after accounting for volume differences?
p > F Significance 0.2669 ns
Similar to the analysis of the number of lanes at the bottleneck, the number of available
lanes does not necessarily indicate the severity of an incident. This could explain the fact that the
number of available lanes does not significantly affect ETT or EUC for different program sizes,
especially when these analyses are adjusted for crash type.
5.3.5 ETT and EUC vs. Time of Day
Table 5-29 through Table 5-32 show results for the analysis of the effect of program size
on ETT and EUC for incidents occurring at different times of day.

112
Table 5-29: Significance of IMT Program Size vs. ETT for Time of Day
Does ETT between 2018 and 2020 depend on the time of day, after accounting for volume differences?
p > F Significance
0.4174 ns
Table 5-30: Significance of IMT Program Size vs. EUC for Time of Day
Does EUC between 2018 and 2020 depend on the time of day, after accounting for volume differences?
p > F Significance 0.3698 ns
Table 5-29 and Table 5-30 show that the statistical analyses did not indicate any
significant effect of program size on the difference between 2018 and 2020 values of ETT or
EUC for different times of day. Where differences between the two years are small, it still may
be beneficial to include estimates of ETT and EUC for each respective time of day to aid in
understanding the need for IMT services throughout the day.
Table 5-31 and Table 5-32 show the results of total ETT and EUC analyzed from the
entire dataset of 2018 and 2020 incidents together, meaning that these are not simply estimates
from the interaction term. This analysis does not distinguish differences in ETT between 2018
and 2020, but analyzes patterns of ETT across the time of day for both years. Figure 5-13 and
Figure 5-14 show visual representations of those results.
Table 5-31: Analysis of ETT vs. Time of Day
Time of Day Mean ETT Lower Upper Sample Size SE p > |t| Significance
Morning Off Peak 463.16 -244.25 1170.58 5 359.57 0.199 ns AM Peak 1214.95 867.89 1562.01 76 176.41 <0.0001 ****
Afternoon Off Peak 1356.27 1037.45 1675.08 135 162.05 <0.0001 **** PM Peak 1295.44 972.6 1618.28 100 164.09 <0.0001 ****
Night Off Peak 920.17 99.4179 1740.92 18 417.18 0.028 **

113
Table 5-32: Analysis of EUC vs. Time of Day
Time of Day Mean EUC
Lower Upper Sample Size
SE p > |t| Significance
Morning Off Peak $11,634 -$7,199 $30,466 5 $9,572 0.225 ns AM Peak $31,124 $21,885 $40,363 76 $4,696 <0.0001 ****
Afternoon Off Peak
$36,941 $28,454 $45,428 135 $4,314 <0.0001 ****
PM Peak $34,058 $25,463 $42,652 100 $4,368 <0.0001 **** Night Off Peak $24,776 $2,926 $46,625 18 $11,106 0.026 **
Morning Off Peak and Night Off Peak periods have lower sample sizes and higher
standard errors. As a result, the estimates for these periods may be less reliable. It was previously
established that the sample size of incidents serviced by IMTs during these periods was greater
in 2020 than in 2018. This provided more data from which user impacts could be analyzed. Of
the eight and 19 respective incidents analyzed for performance measures during the Morning Off
Peak period in 2018 and 2020, two incidents from 2018 and three incidents from 2020 met the
criteria for subsequent analysis. Of the three and 30 respective incidents analyzed for
performance measures in 2018 and 2020, one incident from 2018 and 17 incidents from 2020
met the criteria for subsequent analysis.
While the occurrence of incidents at these time periods can also be influenced by other
factors such as differing traffic volumes, construction conditions, etc., the data indicate that the
expanded IMT program is more capable of reaching incidents at these times of day. The
extended operating hours and coverage area of the IMT program have direct benefits to roadway
safety and operations.
Lower values of ETT and EUC during the Morning and Night Off Peaks are expected,
since these times have lower traffic volumes. The results indicate that the greatest average values
of ETT and EUC do not occur during a peak period at all, but rather in the middle of the day
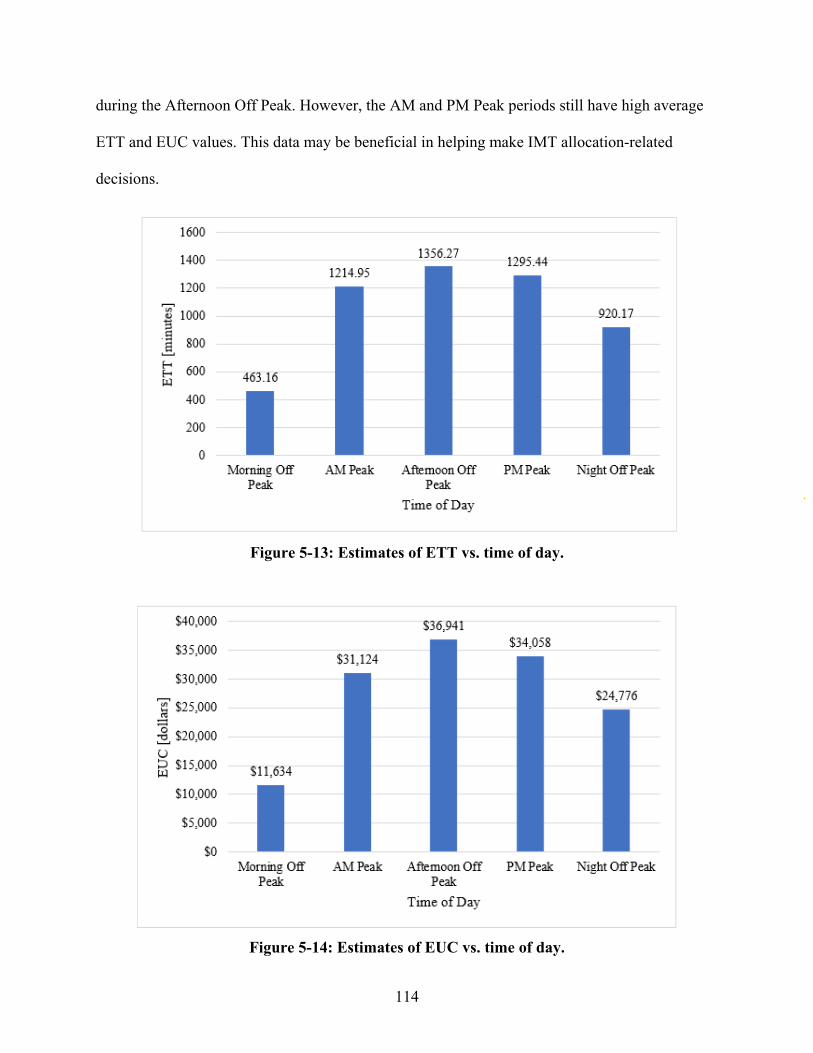
114
during the Afternoon Off Peak. However, the AM and PM Peak periods still have high average
ETT and EUC values. This data may be beneficial in helping make IMT allocation-related
decisions.
Figure 5-13: Estimates of ETT vs. time of day.
Figure 5-14: Estimates of EUC vs. time of day.

115
5.3.6 ETT and EUC vs. RT
Table 5-33 and Table 5-34 are statistical outputs that show the fixed effects of the
regression analyses of ETT and EUC versus RT, as well as the solutions to the fixed effects. As
previously established, these analyses were performed on the entire dataset of 2018 and 2020
incidents combined so that differences in volume between the two years could be accounted for
in the regression.
Table 5-33: Fixed Effects for Regression of ETT vs. RT
Effect Num. DF Den. DF F Value p > F Significance AV 1 321 163.82 <0.0001 **** Crash Type 2 321 8.94 0.0002 *** Year 1 321 1.10 0.295 ns RT 1 321 0.05 0.83 ns RT * Year 1 321 4.07 0.0446 **
Table 5-34: Fixed Effects for Regression of EUC vs. RT
Effect Num. DF Den. DF F Value p > F Significance AV 1 321 153.44 <0.0001 **** Crash Type 2 321 8.80 0.0002 *** Year 1 321 1.14 0.2873 ns RT 1 321 0.00 0.9593 ns RT * Year 1 321 4.13 0.043 **
The p-values in Table 5-33 and Table 5-34 indicate the significance of the effect of each
respective variable in explaining the ETT and EUC, respectively. Both AV and crash type have
significant effects on ETT and EUC when all other variables are held constant. This result is
expected since ETT is directly related to AV, and severity of an incident may determine
throughput at the bottleneck and growth of the queue.
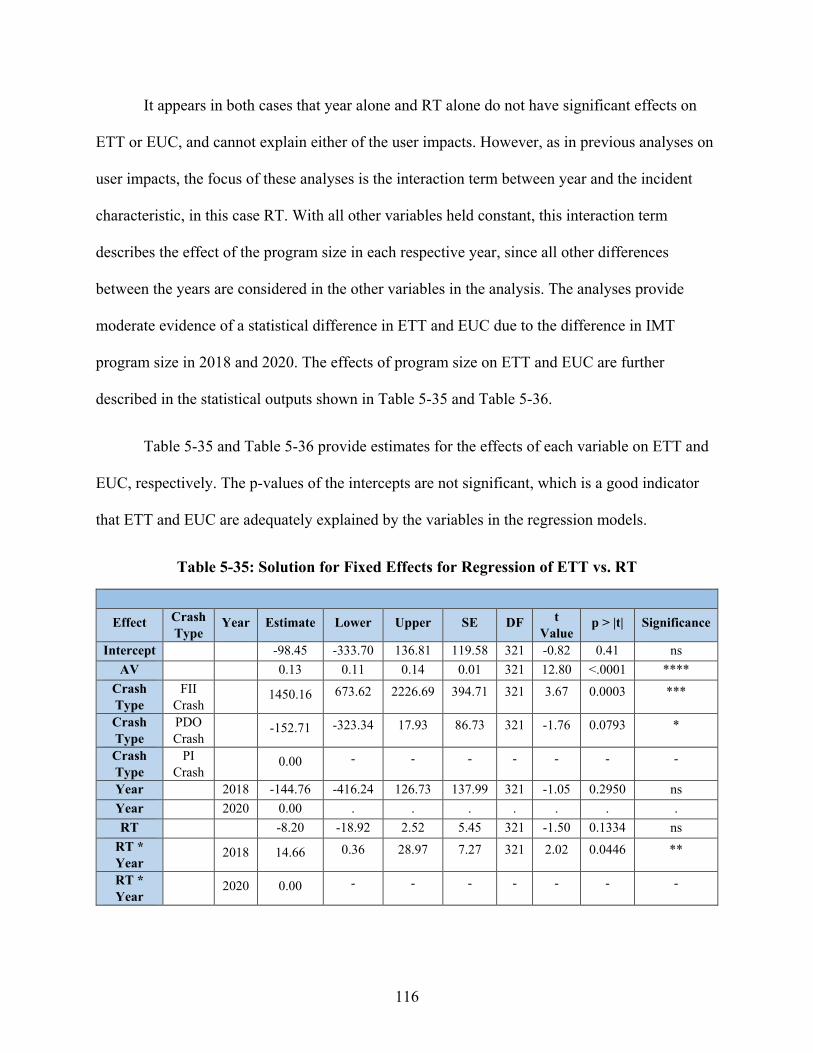
116
It appears in both cases that year alone and RT alone do not have significant effects on
ETT or EUC, and cannot explain either of the user impacts. However, as in previous analyses on
user impacts, the focus of these analyses is the interaction term between year and the incident
characteristic, in this case RT. With all other variables held constant, this interaction term
describes the effect of the program size in each respective year, since all other differences
between the years are considered in the other variables in the analysis. The analyses provide
moderate evidence of a statistical difference in ETT and EUC due to the difference in IMT
program size in 2018 and 2020. The effects of program size on ETT and EUC are further
described in the statistical outputs shown in Table 5-35 and Table 5-36.
Table 5-35 and Table 5-36 provide estimates for the effects of each variable on ETT and
EUC, respectively. The p-values of the intercepts are not significant, which is a good indicator
that ETT and EUC are adequately explained by the variables in the regression models.
Table 5-35: Solution for Fixed Effects for Regression of ETT vs. RT
Effect Crash Type
Year Estimate Lower Upper SE DF t Value
p > |t| Significance
Intercept -98.45 -333.70 136.81 119.58 321 -0.82 0.41 ns AV 0.13 0.11 0.14 0.01 321 12.80 <.0001 ****
Crash Type
FII Crash
1450.16 673.62 2226.69 394.71 321 3.67 0.0003 ***
Crash Type
PDO Crash
-152.71 -323.34 17.93 86.73 321 -1.76 0.0793 *
Crash Type
PI Crash
0.00 - - - - - - -
Year 2018 -144.76 -416.24 126.73 137.99 321 -1.05 0.2950 ns Year 2020 0.00 . . . . . . . RT -8.20 -18.92 2.52 5.45 321 -1.50 0.1334 ns
RT * Year
2018 14.66 0.36 28.97 7.27 321 2.02 0.0446 **
RT * Year
2020 0.00 - - - - - - -

117
Table 5-36: Solution for Fixed Effects for Regression of EUC vs. RT
Effect Crash Type
Year Estimate Lower Upper SE DF t Value
p > |t| Significance
Intercept -3010.56 -
3279.6
3197.22 321 -0.94 0.3471 ns AV 3.25 2.73 3.77 0.26 321 12.39 <.0001 ****
Crash Type
FII Crash
39262 18499 60025 10553 321 3.72 0.0002 ***
Crash Type
PDO Crash
-3724.33 -8286.8 838.14 2319.06 321 -1.61 0.1093 ns
Crash Type
PI Crash
0.00 - - - - - - -
Year 2018 -3932.23 -
3326.6
3689.62 321 -1.07 0.2873 ns Year 2020 0.00 - - - - - - - RT -202.98 -489.65 83.68 145.71 321 -1.39 0.1646 ns
RT * Year
2018 394.93 12.44 777.42 194.42 321 2.03 0.0430 **
RT * Year
2020 0.00 - - - - - - -
Equations for the regressions on ETT and EUC can be drawn from the fixed effects as
shown in Equation 5-2 and Equation 5-3:
𝐸𝐸𝑅𝑅𝑅𝑅 (𝑚𝑚𝑚𝑚𝑚𝑚𝑚𝑚𝑚𝑚𝑚𝑚𝑚𝑚) = −98.45 + 0.13 ∗ 𝐴𝐴𝐴𝐴 + 1450.16 ∗ 𝐹𝐹𝐹𝐹𝐹𝐹 𝑅𝑅𝐶𝐶𝐶𝐶𝑚𝑚ℎ − 152.71
∗ 𝑃𝑃𝑃𝑃𝑃𝑃 𝑅𝑅𝐶𝐶𝐶𝐶𝑚𝑚ℎ − 144.76 ∗ 𝑦𝑦𝑚𝑚𝐶𝐶𝐶𝐶 − 8.20 ∗ 𝑅𝑅𝑅𝑅(𝑚𝑚𝑚𝑚𝑚𝑚𝑚𝑚𝑚𝑚𝑚𝑚𝑚𝑚) + 𝟏𝟏𝟏𝟏.𝟔𝟔𝟔𝟔 ∗ (𝒚𝒚𝒚𝒚𝒚𝒚𝒚𝒚 ∗ 𝑹𝑹𝑹𝑹) (5-2)
𝐸𝐸𝐸𝐸𝑅𝑅 ($) = −3010.56 + 3.25 ∗ 𝐴𝐴𝐴𝐴 + 39262 ∗ 𝐹𝐹𝐹𝐹𝐹𝐹 𝑅𝑅𝐶𝐶𝐶𝐶𝑚𝑚ℎ − 3724.33 ∗
𝑃𝑃𝑃𝑃𝑃𝑃 𝑅𝑅𝐶𝐶𝐶𝐶𝑚𝑚ℎ − 3932.23 ∗ 𝑦𝑦𝑚𝑚𝐶𝐶𝐶𝐶 − 202.98 ∗ 𝑅𝑅𝑅𝑅(𝑚𝑚𝑚𝑚𝑚𝑚𝑚𝑚𝑚𝑚𝑚𝑚𝑚𝑚) + 𝟑𝟑𝟑𝟑𝟏𝟏.𝟑𝟑𝟑𝟑 ∗ (𝒚𝒚𝒚𝒚𝒚𝒚𝒚𝒚 ∗ 𝑹𝑹𝑹𝑹), (5-3)
where PI Crash is a reference level and where FII Crash (yes = 1, no = 0), PDO Crash (yes = 1,
no = 0), and year (2018 = 1, 2020 = 0) are indicator variables.
The interaction terms in each equation have been bolded as they describe the quantifiable
benefits of the larger program size. These results indicate that after accounting for the respective
effects of AV, crash type, and year, each extra minute of RT that occurred due to the smaller
fleet size in 2018 equated to an increase in ETT of 14.66 minutes. To phrase this result

118
differently, it could be said that for every minute of RT saved by program expansion in 2020,
14.66 minutes of ETT were saved. Similarly, for each minute of RT reduced by program
expansion in 2020, $394.93 were saved.
Yearly time savings and costs savings can be determined using the data collected paired
with the estimates from the interaction term. Median RT values for 2020 were previously shown
in Figure 4-4 to be between 10-15 minutes. UDOT’s Traffic Management Division Operations
Engineer reported to the research team that the IMT program was able to respond to roughly
9,000 incidents in the year after the expansion. Given this information, time savings and cost
savings can be estimated. For instance, if IMTs can respond to the majority of incidents within
15 minutes, with savings of 14.66 minutes of ETT per minute of RT and over 9,000 incidents
responded to, this amounts to roughly 1,979,100 minutes, or 32,985 hours, of ETT saved in 2020
due to the program expansion, with a 95 percent confidence interval from 810 to 65,183 hours.
The same assumptions of 15-minute RT and 9,000 incidents, coupled with savings of $394.93 of
EUC per minute of RT, amounts to roughly $53,315,550 of EUC saved in 2020 due to the
program expansion, with a 95 percent confidence interval from $1,679,400 to $104,951,700.
Since the interaction terms in these regression models describe the benefits specific to the
program expansion, summarized results for all following analyses will be presented as shown in
Table 5-37 and Table 5-38. Positive differences in means indicate savings in 2020.
Table 5-37: Analysis of IMT Program Size vs. ETT for RT
Difference in Means [minutes] Lower Upper Sample Size
SE p > F Significance
14.66 0.36 28.97 328 7.27 0.0446 **

119
Table 5-38: Analysis of IMT Program Size on EUC vs. RT
Difference in Means Lower Upper Sample Size
SE p > F Significance
$394.93 $12.44 $777.42 328 $194.42 0.0430 **
5.3.7 ETT and EUC vs. RCT
Table 5-39 and Table 5-40 show results of the interaction terms for the analyses of ETT
and EUC versus the RCT.
Table 5-39: Analysis of IMT Program Size vs. ETT for RCT
Difference in Means [minutes]
Lower Upper Sample Size
SE p > F Significance
10.45 6.37 14.52 334 2.07 <0.0001 ****
Table 5-40: Analysis of IMT Program Size vs. EUC for RCT
Difference in Means Lower Upper Sample Size
SE p > F Significance
$277.13 $167.86 $386.39 334 $55.54 <0.0001 ****
The interaction terms for these analyses also provide conclusive evidence of benefits to
ETT and EUC from the program expansion. For each minute of RCT in 2020, about 10.45
minutes of ETT were saved when compared with 2018, as well as $277.13 of EUC. It has been
shown in the previous analysis of performance measures that values of RCT were somewhat
consistent between 2018 and 2020. This analysis on user impacts indicates that while the time to
clear the roadway of incidents may be similar after the expansion, having more IMTs performing

120
that work does have direct benefits in reducing the time and costs associated with incident
congestion.
5.3.8 ETT and EUC vs. ICT
Table 5-41 and Table 5-42 show results of the interaction terms for the analyses of ETT
and EUC versus ICT.
Table 5-41: Analysis of IMT Program Size vs. ETT for IMT ICT
Difference in Means [minutes]
Lower Upper Sample Size
SE p > F Significance
9.85 5.59 14.11 334 2.17 <0.0001 ****
Table 5-42: Analysis of IMT Program Size vs. EUC for IMT ICT
Difference in Means Lower Upper Sample Size
SE p > F Significance
$265.36 $151.37 $379.36 334 $57.95 <0.0001 ****
Figure 5-1 and Figure 5-2 previously showed the strong correlation in both 2018 and
2020 between RCT and IMT ICT. This correlation is evidence that IMTs are able to leave the
scene of an incident soon after finishing their responsibilities to clear the roadway. The results of
the analyses introduced in this section are therefore quite similar to the previous analyses of
RCT. For each minute of IMT ICT in 2020, about 9.85 minutes of ETT as well as $265.36 of
EUC were saved when compared with 2018.

121
Chapter Summary
The side-by-side comparison of the 2018 and 2020 performance measure analyses reveal
a number of things about the expansion of UDOT’s IMT program. First, there were slightly
wider confidence intervals in 2020 than in 2018 across most analyses. While there were 320
incidents analyzed for performance measures in 2018 and 289 in 2020, the larger confidence
intervals in 2020 would indicate that there is a greater spread of RCTs in 2020 than in 2018. This
does not mean that the work of the IMTs has become less efficient. Rather, it reflects the fact that
the expanded program has been able to service a wider range of incidents, both on geographic
and temporal scales.
The effects of COVID-19 must be jointly considered with the effects of the program size
for these analyses. It is possible that slightly higher RCTs in 2020 than in 2018 are due to
precautions taken by IMT personnel at the scene of incidents to prevent potential exposure to the
virus. This possibility was corroborated by discussions with the IMT program manager. Traffic
volumes have been proven to be lower in 2020 than in 2018, as was discussed in Chapter 3, and
this may have implications on the compounding effects of congestion experienced by roadway
users, particularly ETT and EUC. However, it was assumed that queue size does not directly
affect the work performed by IMTs although it directly affects ETT and EUC calculations, so
analyses on performance measures were not adjusted directly for AV.
Similar levels of RCT and ICT performance were seen for 2018 and 2020. One important
distinction is that the RCTs in 2020 were more consistent. The time required by IMTs to clear
incidents fluctuated less in 2020 than in 2018 regardless of the characteristics of the incidents
such as location, time, or severity. This consistency is a mark of the flexibility that the expanded
program has to respond to incidents as needed. Overall, similar levels of performance on a wider

122
geographic and temporal scale are a promising result for the increased capabilities of the IMT
program after the expansion.
The statistical regression analyses on both ETT and EUC demonstrate the impacts that
the expansion to UDOT’s IMT program has had on its ability to prevent incident-related
congestion. Analyses indicated in some cases that an interaction term between the year and an
incident characteristic, which described the effect of the program size, had a significant effect on
ETT and EUC. This was true when analyzing incidents by the number of IMTs that responded
and when analyzing incidents by the number of lanes that were closed. Notable is the fact that
values of ETT and EUC were found to be much more consistent in 2020 than in 2018, which
indicates added flexibility in the larger program. Having more IMTs does not mean that the
program can necessarily clear all incidents faster, but it does provide the capability of clearing all
incidents more consistently.
Regression analyses were also performed on ETT and EUC against a number of
performance measures. Because AV is directly related to ETT and EUC, an interaction term was
used to describe the effects of the program size before and after the expansion, after accounting
for volumes in 2018 and 2020. In all cases where performance measures reflected IMT activity,
the size of the program was shown to be significant in reducing congestion-related travel time
and costs. Table 5-43 and Table 5-44 summarize the differences in ETT and EUC due solely to
the program expansion. Positive differences indicate time and costs savings in 2020. Visual
representations of the data are shown in Figure 5-15 and Figure 5-16. The bars shown represent
the 95 percent confidence interval of the means and the whiskers represent the standard errors.
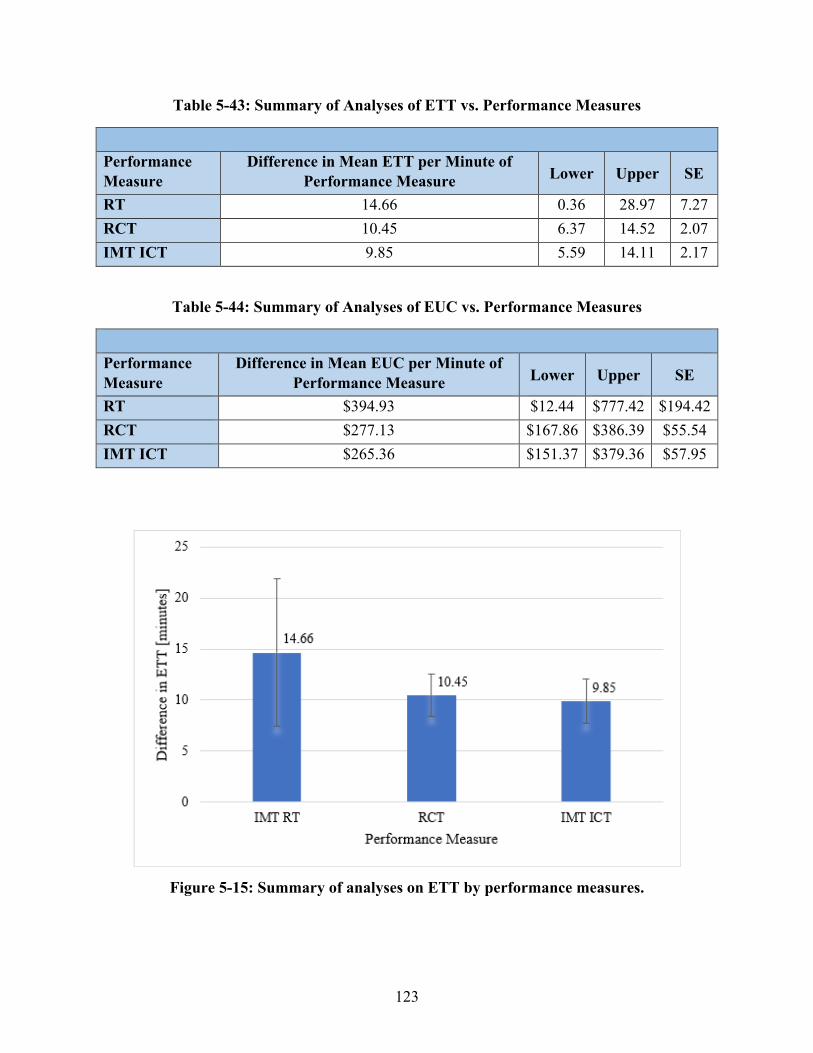
123
Table 5-43: Summary of Analyses of ETT vs. Performance Measures
Performance Measure
Difference in Mean ETT per Minute of Performance Measure
Lower Upper SE
RT 14.66 0.36 28.97 7.27 RCT 10.45 6.37 14.52 2.07 IMT ICT 9.85 5.59 14.11 2.17
Table 5-44: Summary of Analyses of EUC vs. Performance Measures
Performance Measure
Difference in Mean EUC per Minute of Performance Measure
Lower Upper SE
RT $394.93 $12.44 $777.42 $194.42 RCT $277.13 $167.86 $386.39 $55.54 IMT ICT $265.36 $151.37 $379.36 $57.95
Figure 5-15: Summary of analyses on ETT by performance measures.

124
Figure 5-16: Summary of analyses on EUC by performance measures.
The results indicate that the reduction in RT due to the program expansion has had the
greatest benefit to reductions in ETT and EUC. For each minute of RT in 2020, 14.66 minutes
and $394.93 less are accrued than in 2018. While these amounts may seem trivial, the savings
per minute of RT aggregated over the course of a year do add up quickly to represent a huge
monetary benefit of the expanded program. Considering the distribution of RTs in 2020 and the
number of incidents that the expanded program is capable of responding to in a year, the IMT
program expansion has saved roughly 32,985 hours (95 percent confidence interval from 810 to
65,183 hours) of ETT and $53,315,550 (95 percent confidence interval from $1,679,400 to
$104,951,700) of EUC.
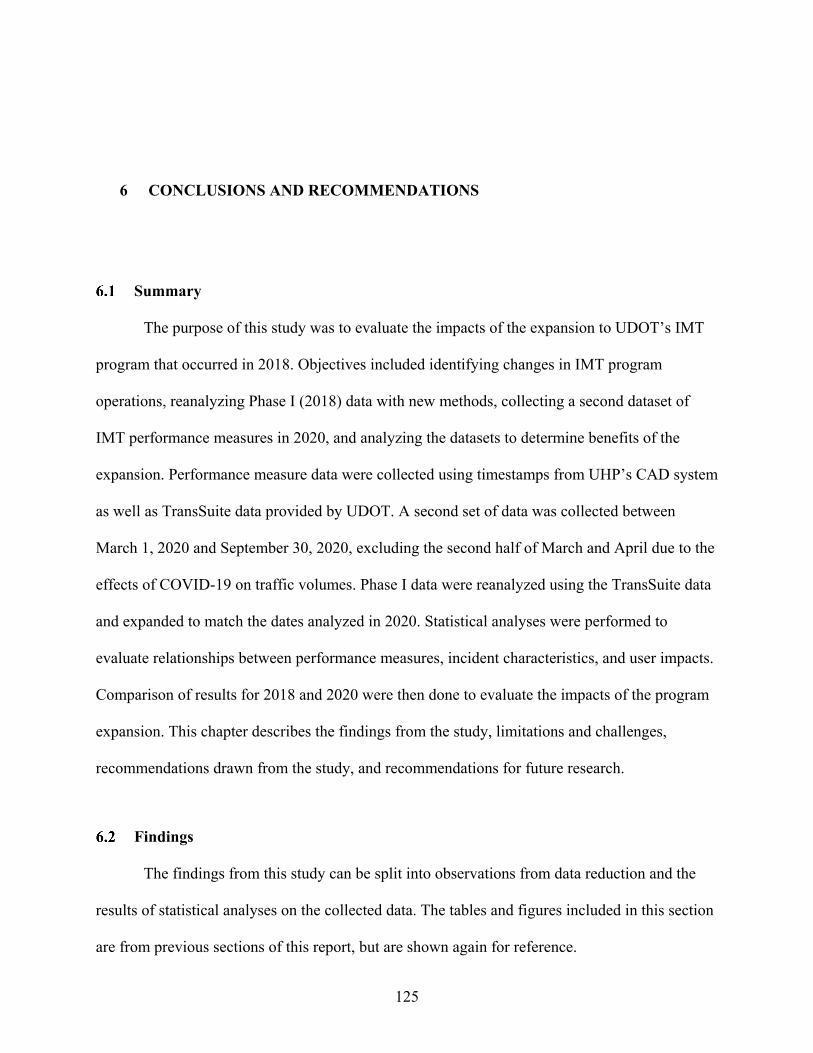
125
6 CONCLUSIONS AND RECOMMENDATIONS
Summary
The purpose of this study was to evaluate the impacts of the expansion to UDOT’s IMT
program that occurred in 2018. Objectives included identifying changes in IMT program
operations, reanalyzing Phase I (2018) data with new methods, collecting a second dataset of
IMT performance measures in 2020, and analyzing the datasets to determine benefits of the
expansion. Performance measure data were collected using timestamps from UHP’s CAD system
as well as TransSuite data provided by UDOT. A second set of data was collected between
March 1, 2020 and September 30, 2020, excluding the second half of March and April due to the
effects of COVID-19 on traffic volumes. Phase I data were reanalyzed using the TransSuite data
and expanded to match the dates analyzed in 2020. Statistical analyses were performed to
evaluate relationships between performance measures, incident characteristics, and user impacts.
Comparison of results for 2018 and 2020 were then done to evaluate the impacts of the program
expansion. This chapter describes the findings from the study, limitations and challenges,
recommendations drawn from the study, and recommendations for future research.
Findings
The findings from this study can be split into observations from data reduction and the
results of statistical analyses on the collected data. The tables and figures included in this section
are from previous sections of this report, but are shown again for reference.

126
6.2.1 Data Reduction
The raw data collected over the course of the two years revealed a number of helpful
observations regarding the performance of the program after the 2018 expansion. First, the use of
TransSuite data provided a much higher number of incidents with timestamps logged for all
performance measures. Table 6-1 and Table 6-2, respectively, show the data funnels of
performance measure data collected in 2018 using only CAD data and of the reanalyzed 2018
data using CAD and TransSuite data together.
Table 6-1: Data Funnel for 2018 Data Collected Using CAD Data Only
Data Type Number of Data Points Percent of Total Incidents 1216 100.0%
ICT 1206 99.2% RT 1042 85.7%
RCT 138 11.3% ICT, RT, and RCT 129 10.6%
Incidents Analyzed for EUC 63 5.2%
Table 6-2: Data Funnel for 2018 Data Collected Using CAD+TransSuite Data
Data Type Number of Data Points Percent of Total Incidents 1074 100.0%
ICT 1064 99.1% RT 928 86.4%
RCT 325 30.3% ICT, RT, and RCT 306 28.5%
Incidents Analyzed for EUC 188 17.5%
The number of incidents analyzed overall using CAD and TransSuite data was slightly
less than when only CAD data were used, but both the number and percentage of incidents with
all three performance measures calculated were much higher, with a jump from 129 to 306

127
incidents once TransSuite was incorporated into the methodology, or an increase from 10.6
percent to 28.5 percent of all incidents. This higher number of incidents with data for all
performance measures meant a higher sample of incidents from which user impacts could be
analyzed, with a jump from 63 to 188 incidents.
The addition of TransSuite data provided for a much more comprehensive analysis of the
incidents for which data were collected. The ability to analyze more incidents was also likely a
product of the fact that there was a greater percentage of incidents in 2020 that had IMT
responders. Even with slightly lower numbers of incidents in the CAD data in 2020 than in 2018,
there were consistently higher numbers of incidents with IMTs responding.
Observation of the distributions of RT values for each year showed a shift towards lower
RTs in 2020. While values of RCT and IMT ICT were similar in 2018 and 2020, the shift in RT
is beneficial, as shown by the distributions in Figure 6-1 and Figure 6-2.
Figure 6-1: 2018 distribution of RT.
0%
5%
10%
15%
20%
25%
30%
0-5
5-10
10-1
5
15-2
0
20-2
5
25-3
0
30-3
5
35-4
0
40-4
5
45-5
0
50-5
5
55-6
0
60-6
5
65-7
0
70-7
5
75+
RT F
requ
ency
Minutes
PDO PI FII
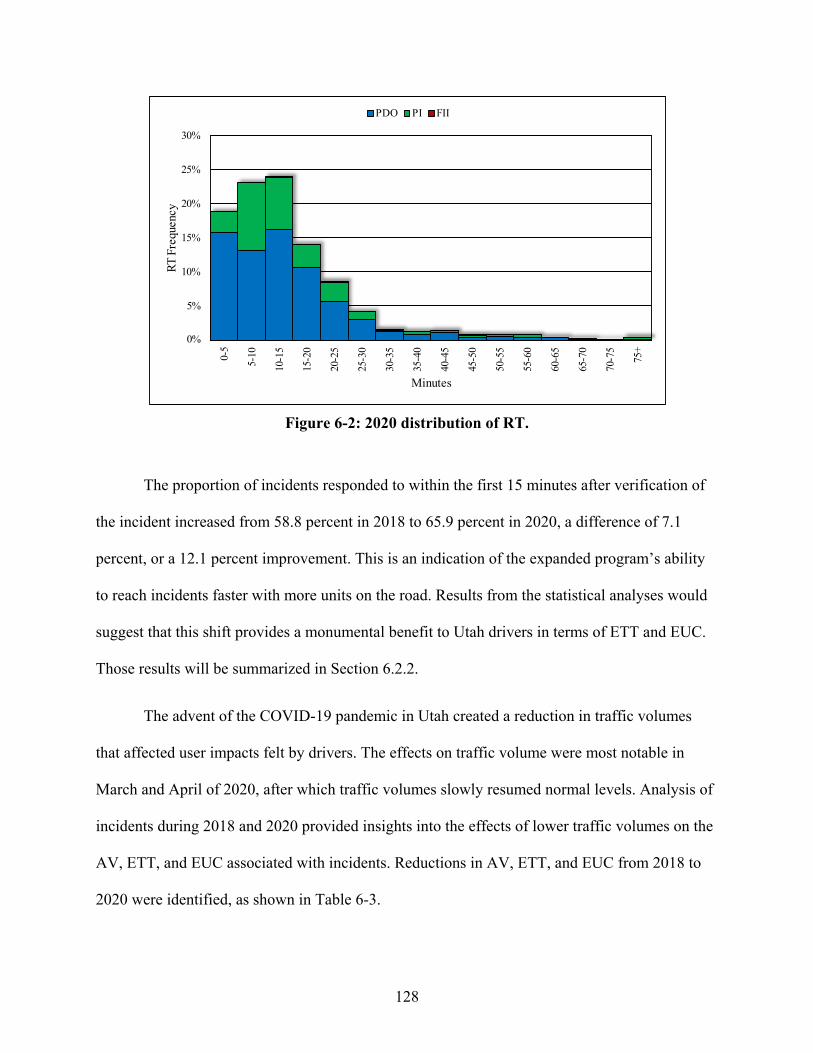
128
Figure 6-2: 2020 distribution of RT.
The proportion of incidents responded to within the first 15 minutes after verification of
the incident increased from 58.8 percent in 2018 to 65.9 percent in 2020, a difference of 7.1
percent, or a 12.1 percent improvement. This is an indication of the expanded program’s ability
to reach incidents faster with more units on the road. Results from the statistical analyses would
suggest that this shift provides a monumental benefit to Utah drivers in terms of ETT and EUC.
Those results will be summarized in Section 6.2.2.
The advent of the COVID-19 pandemic in Utah created a reduction in traffic volumes
that affected user impacts felt by drivers. The effects on traffic volume were most notable in
March and April of 2020, after which traffic volumes slowly resumed normal levels. Analysis of
incidents during 2018 and 2020 provided insights into the effects of lower traffic volumes on the
AV, ETT, and EUC associated with incidents. Reductions in AV, ETT, and EUC from 2018 to
2020 were identified, as shown in Table 6-3.
0%
5%
10%
15%
20%
25%
30%
0-5
5-10
10-1
5
15-2
0
20-2
5
25-3
0
30-3
5
35-4
0
40-4
5
45-5
0
50-5
5
55-6
0
60-6
5
65-7
0
70-7
5
75+
RT F
requ
ency
Minutes
PDO PI FII

129
Table 6-3: Reductions in User Impacts Between 2018 and 2020
User Impacts 2018 Average 2020 Average % Reduction
AV [vehicles] 7642 5467 28% ETT [minutes] 759.50 429.65 43%
EUC [$] $ 19,532.78 $ 10,906.69 44%
On average, the AV of incidents was reduced 28 percent from 2018 to 2020. This
reduction in AV may have had a larger effect on queue growth and dissipation than originally
expected. This possibility is corroborated by the associated reductions of ETT and EUC from
2018 to 2020 of 43 percent and 44 percent, respectively. It is also possible that the larger IMT
program in 2020 was able to provide service to smaller incidents that would not have been
prioritized before the expansion. However, the reduction in volumes caused by COVID-19 is
significant enough that this is the likely explanation for the reductions shown. This trend in the
raw data was considered by the research team and statistical analyses were run in a way to
address this volume reduction, as described in Chapter 5.
Estimates of EUC accrued due to incidents over the course of the data collection periods
for 2018 and 2020 must be considered in the context of the volume reduction discussed.
However, it should be noted that these estimates of EUC do not include the congestion
associated with diverted traffic nor do they account for the portion of incidents analyzed outside
of the CAD+TransSuite dataset used in this study.
Though 1,074 and 1,190 incidents were respectively analyzed in 2018 and 2020 by this
method, the UDOT Traffic Management Division Operations Engineer indicated that in 2018 the
IMT program was able to respond to around 4,500 incidents, and the program expansion allowed
this amount to go up to around 9,000 incidents in 2020. For these reasons it is reasonable to

130
assume that the estimates shown are conservative. Table 6-4 and Table 6-5 show the estimated
costs associated with congestion from incidents analyzed over the 6-month study period for each
year.
Table 6-4: 2018 EUC Estimates
Crash Type
Average Cost per Crash
Number of Crashes in 6
Months
User Cost Estimate over 6 Months
FII - 10 $ - PI $ 20,610 285 $ 5,873,850
PDO $ 16,576 779 $ 12,912,704 Total 1074 $ 18,786,554
Table 6-5: 2020 EUC Estimates
Crash Type
Average Cost per Crash
Number of Crashes in 6
Months
User Cost Estimate over 6 Months
FII - 6 $ - PI $ 11,759 347 $ 4,080,373
PDO $ 9,597 837 $ 8,032,689 Total 1190 $ 12,113,062
6.2.2 Statistical Analyses
The results of statistical analyses of the performance measures collected in 2018 and
2020 indicated that performance between the two years is roughly the same for RCT and ICT.
Given a larger coverage area and extended operating hours, the IMT program is more capable of
providing quality service at a larger geographic and temporal scale. Performance measures were
also more consistent after the program expansion, which could be a sign of greater flexibility of
the IMT program to prioritize incidents as needed with more units.

131
Statistical analyses of the user impacts of ETT and EUC also indicated that the effects of
congestion are much more consistent after the program expansion than before. A combined look
at the results of performance measure and user impact analyses indicates that while the IMT
program cannot necessarily clear all incidents faster, it can clear them consistently with similar
clearance times.
It was also proven that the expansion had direct benefits in reducing ETT and EUC for
specific IMT performance measures. Regression analyses accounted for differences in traffic
volumes between the years and crash type to evaluate the effects attributed solely to the greater
size of the IMT program in 2020.
When compared to 2018, each minute of RT reduced in 2020 translated on average to:
• ETT savings of 14.66 minutes.
• EUC savings of $394.93.
When compared to 2018, each minute of RCT reduced in 2020 translated on average to:
• ETT savings of 10.45 minutes.
• EUC savings of $277.13.
When compared to 2018, each minute of ICT reduced in 2020 translated on average to:
• ETT savings of 9.85 minutes.
• EUC savings of $265.36.
These savings only refer to the portion of congestion costs related directly to program
size. These reductions in ETT and EUC accumulate into sizeable savings of roughly 32,985

132
hours (95 percent confidence interval from 810 to 65,183 hours) and $53,315,550 (95 percent
confidence interval from $1,679,400 to $104,951,700), respectively.
Limitations and Challenges
Over the course of the study a number of confounding variables and discrepancies in the
data had to be addressed. One discrepancy came from the fact that PeMS provides separate
volume data for mainline stations and HOV lanes. The research team decided not to use the
volumes from the HOV lanes since these lanes act as a separate facility. However, TransSuite
included a number of incidents that occurred in the HOV lane, which were not analyzed in Phase
I. Because the 2018 data were reanalyzed using TransSuite, these incidents were still analyzed
during both data collection periods, but the volumes in the HOV lanes were still not used. This
decision was justified based on the fact that estimates of ETT and EUC are conservative and only
include traffic in the queue that does not divert to other routes.
Additionally, TransSuite also indicates that shoulders must sometimes be blocked and
then cleared. The research team chose to ignore the timestamps pertaining to shoulders to
simplify the data collection process, though this could potentially have affected the relationship
of RCT with ETT given that the shoulder still affects roadway performance.
There were some instances of incidents for which values of RCT were greater than ICT,
indicating that the lanes were completely cleared after the last IMT had already left the scene of
the incident. In other cases, the RT value was greater than the RCT value, indicating that the
roadway was cleared before IMTs even arrived. Discussion with the TOC manager pointed out
that there is potential for slight errors in the data reporting process. Sometimes IMTs may
preemptively indicate that they are clearing the scene. At other times, UHP responders may

133
assess the scene before IMTs arrive, and if vehicles involved in the incident are able to evacuate
the lanes, UHP officers may mark the lanes as open before an IMT begins other clean-up duties.
These cases are not frequent, and the research team chose not to eliminate incidents with these
seeming inconsistencies.
The greatest challenge faced during the course of the study was the global COVID-19
pandemic. In particular, the shifting patterns of quarantine and telecommuting created large
reductions in traffic volumes in 2020. This volume reduction was very apparent in the data
collected, particularly the spread of the ETT and EUC values for each respective year. In some
instances, statistical analyses were performed in such a way that the effects of the traffic volume
were fixed, so that other variables could be evaluated independently. However, this was not
possible for all analyses and causality was confounded by the existence of both program size
differences and volume differences between the two years.
Additionally, raw values of EUC were calculated directly from the AV for each incident,
meaning that a direct comparison of the raw values of EUC accrued over each data collection
period was confounded by the volumes. The research team investigated whether normalizing
values of EUC by AV was possible, but found that the effect of the volume reduction could not
be removed due to the process used to determine EUC. Ultimately, analyses were able to be
performed to account for this issue.
Recommendations
The data collection process for IMT performance measures is simpler and more
comprehensive with the addition of TransSuite data used to collect T5 timestamps for the UHP
CAD system. The methodology used in this study could be used as a basis for an eventual

134
integration of these two data sources, so that UDOT can develop an automated dashboard of TIM
performance. Institutionalization of this data collection could also be a tool used to gauge current
performance against program goals and objectives.
It is recommended that UDOT develop a schedule of yearly performance evaluation so
that goals for RT, RCT, and ICT can be met and adjusted. Over time this will increase the
accountability of the program and improve its performance. Additionally, a dashboard relating
performance of the IMT program could be a beneficial tool in communicating the benefits of the
program to legislators.
It is also recommended that training for TIM activities and protocol be developed so that
all parties involved in incident management can improve their understanding and ability to
perform TIM activities. The research team is aware of the formation of the Utah Traffic Incident
Management Coalition and suggests that, in the case of the institutionalization of performance
measure data collection, best practices of data collection be developed as part of the training
regimen.
Future Research Recommendations
A third phase of this research is recommended so that the performance of the expanded
program can be analyzed without the effects of COVID-19. As previously explained, the
difference in volumes between 2018 and 2020 precluded some types of analysis. Additionally,
the estimates of benefits to ETT and EUC presented in this paper are specifically related to the
program expansion, and it is likely that improvements to performance measures going forward
would be quantitatively different given the establishment of a larger program. Ideally,
performance measures can continue to be collected to allow UDOT to continually monitor

135
performance and adjust IMT procedures. Where the collection of user impacts such as ETT and
EUC requires a more manual approach, it is suggested that the third phase of this study be
pursued to collect a new dataset without the confounding factor of abnormal traffic volumes.
Further investigation into the use of results from these studies to create a business case is
recommended. An in-depth analysis of user impacts, program costs, IMT activity, and IMT
coverage could be investigated to determine what other quantifiable benefits IMT program
improvements may have.

136
REFERENCES
American Automobile Association (AAA). (2021). “Digest of Motor Laws.” < https://drivinglaws.aaa.com/tag/move-over-law/> (May 24, 2021).
Base SAS 9.4. (2013). 100 SAS Campus Drive Cary, NC 27513-2414, USA: SAS Institute. Brooke, K., Dopart, K., Smith, T., and Flannery, A. (2004). NCHRP Report 520: “Sharing
Information between Public Safety and Transportation Agencies for Traffic Incident Management.,” Transportation Research Board. Washington DC. pg.1-19.
Carson, J. (2010). “Best Practices in Traffic Incident Management.” <https://ops.fhwa.dot.gov/
publications/fhwahop10050/fhwahop10050.pdf> (Apr. 11, 2019). Conklin, C., Bahler, S., Belmore, K., Hallenbeck, M., Ishimura, J., Schnell, G., Clark, J., Curley,
C., Kandarpa, R., Hill, D., and But, A. (2013). “Transportation Management Center: Data Capture for Performance and Mobility Measures Guidebook.” <https://www.its.dot.gov /research_archives/data_capture/pdf/data_capture_reference_manual.pdf> (Apr. 11, 2019).
Ellis, D.R. (2017). “Value of Delay Time for Use in Mobility Monitoring Efforts.” Texas
Transportation Institute (TTI). College Station. Federal Highway Administration (FHWA). (2019). “Every Day Counts Round 4 (EDC-4)
Innovation: Using Data to Improve Traffic Incident Management.” [Unpublished draft Executive Summary]. Provided by Paul Jodoin, May 1, 2020.
Garmen Associates. (2000). “H.E.L.P. Benefit Assessment Final Report.” Prepared for the New
York State Department of Transportation. Iowa Department of Transportation (Iowa DOT). (2019). “Des Moines Metropolitan Area
Integrated Corridor Management (ICM): Program-Level Concept of Operations.” Jodoin, P., King, J., and Pecheux, K. (2014). NCHRP Report 07-20: “Guidance for
Implementation of Traffic Incident Management Performance Measures.,” Transportation Research Board. Washington DC. <http://nchrptimpm.timnetwork.org/> (Apr. 11, 2019).

137
Jodoin, P. (2018a). “Collection, Analysis, and Use of Data to Improve Traffic Incident Management (TIM): Innovative Examples from Successful States.” A webinar presented by the FHWA.
Jodoin, P. (2018b). EDC-4 TIM Data Western Regional Workshop. Salt Lake City, UT. October
31, 2018. Kim, W., Franz, M., and Chang, G. (2012). “Enhancement of Freeway Incident Traffic
Management and Resulting Benefits.” Maryland State Highway Administration Report SP009B4Q.
Kim, W. and Chang, G. (2012). “Review and Enhancement of CHART Operations to Maximize
the Benefit of Incident Response and Management.” Maryland State Highway Administration Report SB009B4U. pp.8-10, 20, 46-50, 55.
Kuhn, B. (2014). “Planning and Evaluating Active Traffic Management Strategies.” NCHRP
Project 03-114. Literature review presented by Texas A&M Transportation Institute, Battelle, Kimley-Horn and Associates, Inc., and Constance Sorrell. < http://onlinepubs.trb.org/onlinepubs/nchrp/docs/NCHRP03-114_LiteratureReview-Revised.pdf> (April 11, 2019).
Moving Ahead for Progress in the 21st Century Act (MAP-21), (2012). Pub. L. No. 112-141
USC. National Highway Traffic Safety Association (NHTSA). (2017). “MMUCC Guideline: Model
Minimum Uniform Crash Criteria, 5th Edition.” <https://crashstats.nhtsa.dot.gov/Api /Public/Publication/812433> (Apr. 11, 2019).
National Traffic Incident Management Coalition (NTIMC). (2007). “National Unified Goal for
Traffic Incident Management.” <http://timnetwork.org/wp-content/uploads/NUG-Unified-Goal-Nov07.pdf> (Apr. 11, 2019).
Numetric. (2018). “UDOT SafeMap.” <https://udot.numetric.com> (Apr. 11, 2019). Ogle, J., Chowdhury, M., Huynh, N., Davis, J, and Xie, Y. (2017). “Integration of the Incident
Command System (ICS) Protocol for Effective coordination of Multi-Agency Response to Traffic Incidents.” <http://www.scdot.scltap.org/wp-content/uploads/2017/06/SPR-699-FHWA-SC-17-07.pdf> (Apr. 11, 2019).
Owens, N.D., Armstrong, A.H., Mitchell, C., and Brewster, R. (2009). “Federal Highway
Administration Focus States Initiative: Traffic Incident Management Performance Measures Final Report.” <https://ops.fhwa.dot.gov/publications/fhwahop10010/ fhwahop10010.pdf> (Apr. 11, 2019).
Ozbay, K. and Bartin, B. (2003). “Incident Management Simulation.” Simulation, 79(2), 69-
82.

138
Pal, R. and Sinha, K.C. (2002). “Simulation Model for Evaluating and Improving
Effectiveness of Freeway Service Patrol Programs.” Journal of Transportation Engineering, 128(4).
Pecheux, K.K., Pecheux, B.B., Carrick, G. (2019). “Leveraging Big Data to Improve Traffic
Incident Management.” NCHRP Research Report 904. <https://doi.org/10.17226/25604> (Jul. 28, 2021).
Ramsey, F., and Schafer, D. (2013). The Statistical Sleuth: A Course in Methods of Data
Analysis. CENGAGE, Boston, MA. Rensel, E., Rafferty, P., Yorks, C. (2018). “Traffic Incident Management and Reducing
Secondary Crashes in Arizona.” Report No. FHWA-AZ-18-740, Arizona Department of Transportation, Phoenix.
Schultz, G.G., Mineer, S.T., Hamblin, C.A., Halliday, D.B., Groberg, C.C., and Burris, M.W. (2015). “I-15 Express Lanes Study Phase II: Recommendations.” Report No. UT-15.03, Utah Department of Transportation, Salt Lake City.
Schultz, G.G., Saito, M., Hadfield, M.G., Bennett, L.S., and Eggett, D.L. (2019). “Analysis of
Performance Measures of Traffic Incident Management in Utah.” Report No. UT-19.01, Utah Department of Transportation, Salt Lake City.
Shah, V., Hatcher, G., Greer, E., and Fraser, J. (2017). NCHRP Report 03-108: “Guidance on
Quantifying Benefits of TIM Strategies.,” Transportation Research Board. Washington DC.
Smith, B., Evans, M., and Babiceanu, S. (2005). “Development of Incident Data Collection
Standards for Virginia Department of Transportation Freeway Operations.” <http://www.virginiadot.org/vtrc/main/online_reports/pdf/05-cr19.pdf> (Apr. 11, 2019).
Souleyrette, R., Chen, M., Zang, Xu., Green, E.R., Sagar, S. (2018). “Improving the Quality of
Traffic Records for Traffic Incident Management.” Report No. KTC-18-22/SPR18-567-1F, Kentucky Transportation Center, Lexington.
Transportation Research Board (TRB). (2010). “Highway Capacity Manual, 2010 Ed.” Washington, DC.
Utah Department of Transportation (UDOT). (2018a). “Iteris Performance Measurement
System” (iPeMS). <https://udotdemo.iteris-pems.com/> (Apr. 11, 2019). Utah Department of Transportation (UDOT). (2018b). “Iteris Performance Measurement
System” (PeMS). <https://udot.iteris-pems.com/> (Apr. 11, 2019).

139
LIST OF ACRONYMS
ADOT Arizona Department of Transportation
ATMS Advanced Traffic Management System
AV Affected Volume
AVO Average Vehicle Occupancy
BYU Brigham Young University
CAD Computer-aided Dispatch
CHART Coordinated Highways Action Response Team
CTECC Combined Transportation, Emergency, and Communications Center
DOT Department of Transportation
EDC-4 Every Day Counts Round 4
ETT Excess Travel Time
EUC Excess User Cost
FDOT Florida Department of Transportation
FHWA Federal Highway Administration
FII Fatal and Incapacitating Injury
FSI Focus States Initiative
GDOT Georgia Department of Transportation
GPS Global Positioning System

140
HELP Highway Emergency Local Patrol
HTA Highway and Transportation Authority
ICS Incident Command System
ICT Incident Clearance Time
IMT Incident Management Team
iPeMS Iteris Performance Measurement System
IRCO Incident Response and Clearance Ontology
KSP Kentucky State Police
MnDOT Minnesota Department of Transportation
NCHRP National Cooperative Highway Research Program
NTIMC National Traffic Incident Management Coalition
NDOT Nevada Department of Transportation
NYSDOT New York State Department of Transportation
PDO Property Damage Only
PeMS Performance Measurement System
PI Personal Injury
RCT Roadway Clearance Time
RT Response Time
SCDOT South Carolina Department of Transportation
SSP Safety Service Patrol
STC Smart Traffic Center
TAC Technical Advisory Committee
TEOC Transportation Emergency Operations Center

141
TIM Traffic Incident Management
TMC Transportation Management Center
TOC Traffic Operations Center
TRIMARC Traffic Response and Incident Management Assisting the River Cities
UDOT Utah Department of Transportation
UHP Utah Highway Patrol
VBA Visual Basic for Applications
VDOT Virginia Department of Transportation
WSDOT Washington State Department of Transportation

142
APPENDIX A. EXPANDED IMT COVERAGE AREAS
The figures and maps shown in Section 3.2 show the centerline miles covered by IMTs in
both 2018 and 2020 in the four UDOT regions. Data about IMT coverage areas before and after
the program expansion were provided to the research team by UDOT’s IMT program supervisor
and included the names of roadways, mileposts patrolled, and lengths covered by direction.
Those data are provided here, in Table A-1 through Table A-7. It should be noted that the
centerline miles provided in the body of the report do not consider the directionality of the
lengths covered, and the totals are therefore half of what appear in the tables here. This was done
to avoid confusion between the miles covered by IMTs and the total number of roadway miles in
the respective regions, which are not reported by direction. As was discussed in the body of the
report, Region 4 did not have any full-time IMTs stationed there until after the program
expansion, which is why center miles for Region 4 are only given for the post-expansion
program.

143
Table A-1: Region 1 Centerline Miles Covered Prior to Program Expansion
Section Description Beginning Milepost
Ending Milepost Length [miles]
I-15 Davis County (Northbound) 312.0 349.0 37 I-15 Davis County (Southbound) 349.0 312.0 37 US-89 (Northbound) 383.0 406.0 23 US-89 (Southbound) 406.0 383.0 23 SR-87/Legacy Pkwy (Northbound) 0.0 12.0 12 SR-87/Legacy Pkwy (Southbound) 12.0 0.0 12 I-215 (Northbound) 26.0 30.0 4 I-215 (Southbound) 30.0 26.0 4 I-84 (Eastbound) 81.0 87.0 6 I-84 (Westbound) 87.0 81.0 6
Total 164
Table A-2: Region 2 Centerline Miles Covered Prior to Program Expansion
Section Description Beginning Milepost
Ending Milepost Length [miles]
I-15 (Northbound) Main Flow 286.0 313.0 27 I-15 (Southbound) Main Flow 313.0 286.0 27 I-80 (Eastbound) 99.0 140.0 41 I-80 (Westbound) 140.0 99.0 41 I-215 (Northbound) 0.0 29.0 29 I-215 (Southbound) 29.0 0.0 29 SR-201 (Eastbound) 0.0 17.0 17 SR-201 (Westbound) 17.0 0.0 17 SR-202 (Northbound) 0.0 3.0 3 SR-202 (Southbound) 3.0 0.0 3 SR-154/Bangerter Hwy (Northbound) 21.0 24.0 3 SR-154/Bangerter Hwy (Southbound) 24.0 21.0 3
Total 240

144
Table A-3: Region 3 Centerline Miles Covered Prior to Program Expansion
Section Description Beginning Milepost
Ending Milepost Length [miles]
I-15 (Northbound) Main Flow 239.0 288.0 49 I-15 (Southbound) Main Flow 288.0 239.0 49
Total 98
Table A-4: Region 1 Centerline Miles Covered After Program Expansion
Section Description Beginning Milepost
Ending Milepost Length [miles]
I-15 Davis County (Northbound) 312.0 400.0 88 I-15 Davis County (Southbound) 400.0 312.0 88 US-89 (Northbound) 383.0 406.0 23 US-89 (Southbound) 406.0 383.0 23 SR-87/Legacy Pkwy (Northbound) 0.0 12.0 12 SR-87/Legacy Pkwy (Southbound) 12.0 0.0 12 I-215 (Northbound) 26.0 30.0 4 I-215 (Southbound) 30.0 26.0 4 I-84 (Eastbound) 81.0 102.0 21 I-84 (Westbound) 102.0 81.0 21 SR-105 (Northbound) 0.0 2.0 2 SR-105 (Southbound) 2.0 0.0 2 SR-106 (Northbound) 0.0 10.0 10 SR-106 (Southbound) 10.0 0.0 10 SR-193 (Northbound) 0.0 17.0 17 SR-193 (Southbound) 17.0 0.0 17 SR-91 (Northbound) 10.0 28.0 18 SR-91 (Southbound) 28.0 10.0 18 SR-39 (Northbound) 7.0 43.0 36 SR-39 (Southbound) 43.0 7.0 36 SR-83 (Northbound) 0.0 31.0 31 SR-83 (Southbound) 31.0 0.0 31
Total 524
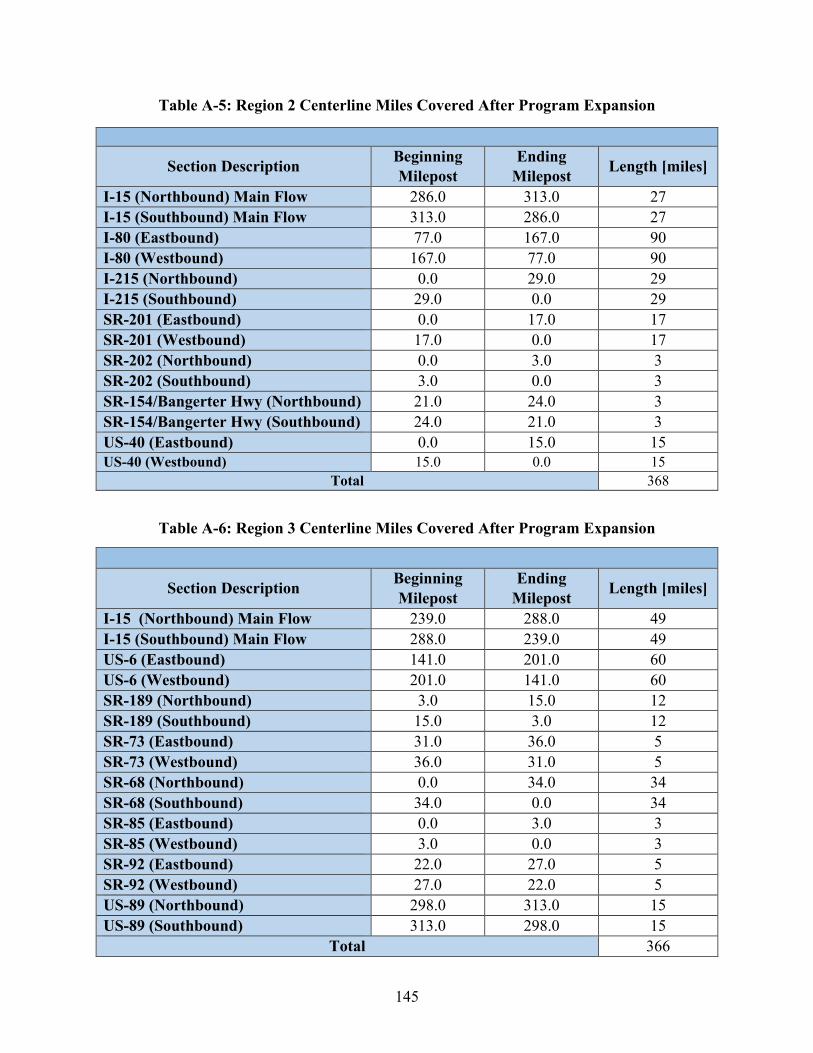
145
Table A-5: Region 2 Centerline Miles Covered After Program Expansion
Section Description Beginning Milepost
Ending Milepost Length [miles]
I-15 (Northbound) Main Flow 286.0 313.0 27 I-15 (Southbound) Main Flow 313.0 286.0 27 I-80 (Eastbound) 77.0 167.0 90 I-80 (Westbound) 167.0 77.0 90 I-215 (Northbound) 0.0 29.0 29 I-215 (Southbound) 29.0 0.0 29 SR-201 (Eastbound) 0.0 17.0 17 SR-201 (Westbound) 17.0 0.0 17 SR-202 (Northbound) 0.0 3.0 3 SR-202 (Southbound) 3.0 0.0 3 SR-154/Bangerter Hwy (Northbound) 21.0 24.0 3 SR-154/Bangerter Hwy (Southbound) 24.0 21.0 3 US-40 (Eastbound) 0.0 15.0 15 US-40 (Westbound) 15.0 0.0 15
Total 368
Table A-6: Region 3 Centerline Miles Covered After Program Expansion
Section Description Beginning Milepost
Ending Milepost Length [miles]
I-15 (Northbound) Main Flow 239.0 288.0 49 I-15 (Southbound) Main Flow 288.0 239.0 49 US-6 (Eastbound) 141.0 201.0 60 US-6 (Westbound) 201.0 141.0 60 SR-189 (Northbound) 3.0 15.0 12 SR-189 (Southbound) 15.0 3.0 12 SR-73 (Eastbound) 31.0 36.0 5 SR-73 (Westbound) 36.0 31.0 5 SR-68 (Northbound) 0.0 34.0 34 SR-68 (Southbound) 34.0 0.0 34 SR-85 (Eastbound) 0.0 3.0 3 SR-85 (Westbound) 3.0 0.0 3 SR-92 (Eastbound) 22.0 27.0 5 SR-92 (Westbound) 27.0 22.0 5 US-89 (Northbound) 298.0 313.0 15 US-89 (Southbound) 313.0 298.0 15
Total 366

146
Table A-7: Region 4 Centerline Miles Covered After Program Expansion
Section Description Beginning Milepost
Ending Milepost Length [miles]
I-15 (Northbound) Main Flow 0.0 42.0 42 I-15 (Southbound) Main Flow 42.0 0.0 42 SR-17 (Northbound) 0.0 6.0 6 SR-17 (Southbound) 6.0 0.0 6 SR-9 (Northbound 0.0 27.0 27 SR-9 (Southbound) 27.0 0.0 27 SR-59 (Northbound) 0.0 23.0 23 SR-59 (Southbound) 23.0 0.0 23 SR-7 (Northbound) 0.0 11.0 11 SR-7 (Southbound) 11.0 0.0 11 SR-18 (Northbound 0.0 24.0 24 SR-18 (Southbound) 24.0 0.0 24 SR-228 (Northbound) 0.0 2.0 2 SR-228 (Southbound) 2.0 0.0 2 SR-318 (Northbound) 0.0 2.0 2 SR-318 (Southbound) 2.0 0.0 2 SR-34 (Eastbound) 0.0 4.0 4 SR-34 (Westbound) 4.0 0.0 4 SR-8 (Eastbound) 0.0 3.0 3 SR-8 (Westbound) 3.0 0.0 3
Total 288

147
APPENDIX B. STATISTICAL RESULTS OF ICT
This appendix includes results of statistical analyses of ICT versus a number of incident
characteristics, including the number of IMTs responding, the number of lanes in the roadway at
the location of the bottleneck, the number of lanes closed by IMT responders, and the time of
day when the incident occurred. An analysis was also performed of ICT versus RT. The analyses
tested for the fixed effects of each incident characteristic and for crash type, since severity is
directly related to the on-scene requirements of the IMTs. The results are similar to those found
in Section 5.2, as values of RCT and ICT were very well correlated. Numeric results are shown
here, and explanation of results is limited to those analyses where the results differed from those
in Section 5.2.
B.1 Performance Measures
B.1.1 ICT vs. Number of IMTs
Table B-1 and Table B-2 show results for the analysis of ICT versus the number of IMTs
responding to the scene. The results are shown visually in Figure B-1.
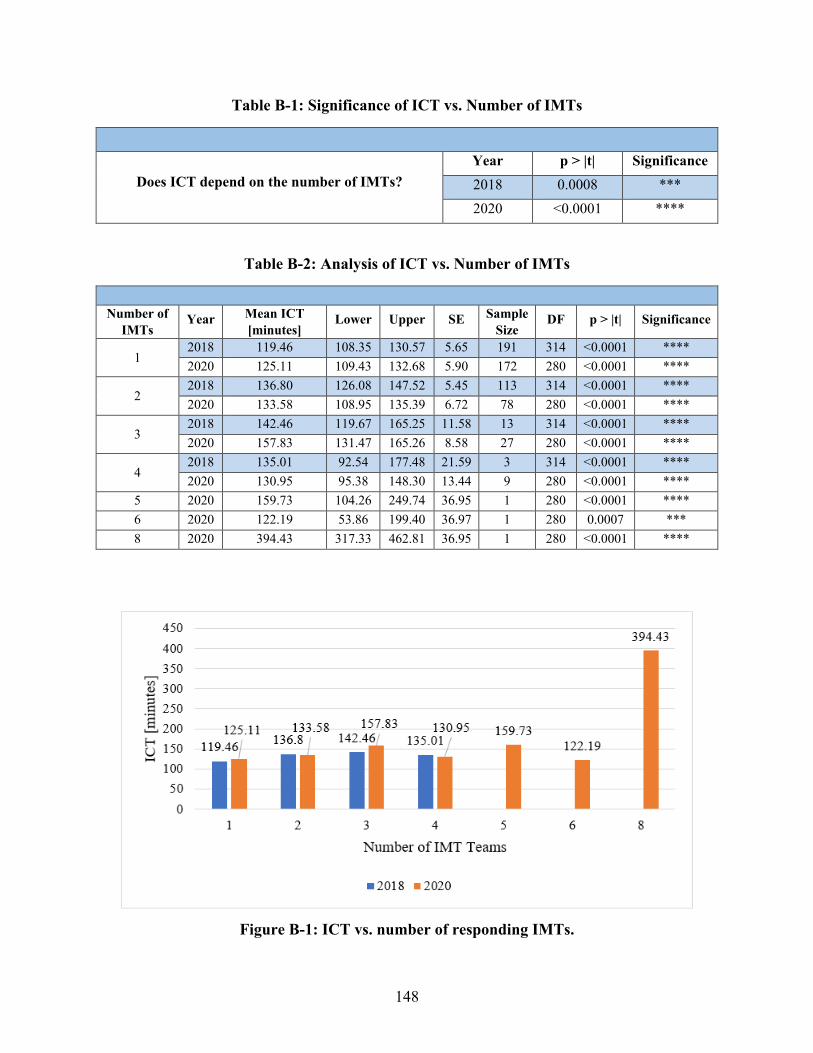
148
Table B-1: Significance of ICT vs. Number of IMTs
Does ICT depend on the number of IMTs? Year p > |t| Significance 2018 0.0008 *** 2020 <0.0001 ****
Table B-2: Analysis of ICT vs. Number of IMTs
Number of
IMTs Year Mean ICT
[minutes] Lower Upper SE Sample
Size DF p > |t| Significance
1 2018 119.46 108.35 130.57 5.65 191 314 <0.0001 **** 2020 125.11 109.43 132.68 5.90 172 280 <0.0001 ****
2 2018 136.80 126.08 147.52 5.45 113 314 <0.0001 **** 2020 133.58 108.95 135.39 6.72 78 280 <0.0001 ****
3 2018 142.46 119.67 165.25 11.58 13 314 <0.0001 **** 2020 157.83 131.47 165.26 8.58 27 280 <0.0001 ****
4 2018 135.01 92.54 177.48 21.59 3 314 <0.0001 **** 2020 130.95 95.38 148.30 13.44 9 280 <0.0001 ****
5 2020 159.73 104.26 249.74 36.95 1 280 <0.0001 **** 6 2020 122.19 53.86 199.40 36.97 1 280 0.0007 *** 8 2020 394.43 317.33 462.81 36.95 1 280 <0.0001 ****
Figure B-1: ICT vs. number of responding IMTs.

149
B.1.2 ICT vs. Number of Lanes at Bottleneck
Table B-3 and Table B-4 show results for the analysis of ICT versus the number of lanes
in the direction corresponding to the crash at the location of the bottleneck. The results of the
analysis are shown visually in Figure B-2.
Table B-3: Significance of ICT vs. Number of Lanes at Bottleneck
Does ICT depend on the number of lanes at the bottleneck? Year p > |t| Significance 2018 0.318 ns 2020 0.0605 *
Table B-4: Analysis of ICT vs. Number of Lanes at Bottleneck
Lanes at
Bottleneck Year Mean ICT
[minutes] Lower Upper SE Sample
Size DF p > |t| Significance
1 2018 --- --- --- --- --- --- --- --- 2020 105.84 82.16 129.51 12.00 20 181 <0.0001 ****
2 2018 129.27 74.17 184.37 27.93 1 182 <0.0001 **** 2020 122.87 94.31 151.43 14.48 4 181 <0.0001 ****
3 2018 120.26 104.77 135.76 7.85 18 182 <0.0001 **** 2020 142.05 121.88 162.21 10.22 19 181 <0.0001 ****
4 2018 110.33 96.66 124.01 6.93 39 182 <0.0001 **** 2020 140.89 121.46 160.32 9.85 31 181 <0.0001 ****
5 2018 106.10 94.26 117.93 6.00 59 182 <0.0001 **** 2020 136.03 117.56 154.50 9.36 39 181 <0.0001 ****
6 2018 115.39 102.83 127.96 6.37 64 182 <0.0001 **** 2020 137.51 121.31 153.71 8.21 73 181 <0.0001 ****
7 2018 114.16 93.25 135.07 10.60 9 182 <0.0001 **** 2020 129.14 90.18 168.10 19.74 4 181 <0.0001 ****

150
Figure B-2: ICT vs. number of lanes at the bottleneck.
B.1.3 ICT vs. Number of Lanes Closed
Table B-5 and Table B-6 show results for the analysis of ICT versus the number of lanes
closed by IMTs at the location of the incident. The number of lanes closed is an indication of the
magnitude of an incident. The results of the analysis are shown visually in Figure B-3.
Table B-5: Significance of ICT vs. Number of Lanes Closed
Does ICT depend on the number of lanes closed? Year p > |t| Significance 2018 0.0429 ** 2020 <0.0001 ****

151
Table B-6: Analysis of ICT vs. Number of Lanes Closed
Lanes Closed
Year Mean ICT [minutes]
Lower Upper SE Sample Size
DF p > |t| Significance
1 2018 124.98 112.32 137.64 6.43 170 312 <0.0001 **** 2020 116.32 103.00 129.64 6.76 127 255 <0.0001 ****
2 2018 125.64 111.98 139.30 6.94 82 312 <0.0001 **** 2020 136.72 123.01 150.42 6.96 75 255 <0.0001 ****
3 2018 137.84 123.35 152.33 7.36 50 312 <0.0001 **** 2020 134.79 118.47 151.11 8.28 37 255 <0.0001 ****
4 2018 136.18 113.78 158.59 11.39 13 312 <0.0001 **** 2020 146.86 128.33 165.38 9.40 21 255 <0.0001 ****
5 2018 165.54 127.90 203.18 19.13 4 312 <0.0001 **** 2020 219.89 165.50 274.27 27.62 2 255 <0.0001 ****
6 2018 68.37 -9.41 146.14 39.53 1 312 0.0847 * 2020 99.68 23.44 175.92 38.71 1 255 0.0106 **
Figure B-3: ICT vs. number of lanes closed.

152
B.1.4 ICT vs. Number of Available Lanes
An analysis of ICT was also performed on the number of available lanes. Table B-7 and
Table B-8 show results for the analysis of IMT CT versus the number of lanes available at the
location of the incident. Figure B-4 shows a visual representation of the results.
Table B-7: Significance of ICT vs. Number of Available Lanes
Does ICT depend on the number of available lanes? Year p > |t| Significance 2018 0.0373 ** 2020 0.0086 ***
Table B-8: Analysis of ICT vs. Number of Available Lanes
Available
Lanes Year Mean ICT
[minutes] Lower Upper SE Sample
Size DF p > |t| Significance
0 2018 126.51 109.17 143.85 8.79 8 181 <0.0001 **** 2020 115.77 95.65 135.89 10.20 30 180 <0.0001 ****
1 2018 104.90 89.13 120.67 7.99 17 181 <0.0001 **** 2020 136.37 113.43 159.30 11.62 22 180 <0.0001 ****
2 2018 116.13 101.04 131.22 7.65 27 181 <0.0001 **** 2020 147.23 126.41 168.06 10.55 25 180 <0.0001 ****
3 2018 110.33 97.20 123.46 6.65 57 181 <0.0001 **** 2020 133.78 113.68 153.87 10.18 45 180 <0.0001 ****
4 2018 98.80 85.19 112.40 6.89 45 181 <0.0001 **** 2020 122.36 101.99 142.73 10.32 41 180 <0.0001 ****
5 2018 103.27 88.21 118.34 7.63 27 181 <0.0001 **** 2020 120.39 97.93 142.86 11.38 24 180 <0.0001 ****
6 2018 113.88 90.91 136.85 11.64 7 181 <0.0001 **** 2020 78.65 25.56 131.74 26.90 2 180 0.0039 ***

153
Figure B-4: ICT vs. number of available lanes.
B.1.5 ICT vs. Time of Day
Table B-9 and Table B-10 show results for the analysis of ICT versus the time of day of
the incident. Figure B-5 shows a visual representation of the results.
Table B-9: Significance of ICT vs. Time of Day
Does ICT depend on the time of day? Year p > |t| Significance 2018 <0.0001 **** 2020 0.1028 ns

154
Table B-10: Analysis of ICT vs. Time of Day
Time of
Day Year Mean ICT
[minutes] Lower Upper SE Sample
Size DF p > |t| Significance
Morning Off Peak
2018 168.38 140.79 195.96 14.02 8 313 <0.0001 **** 2020 139.60 119.02 160.18 10.46 19 282 <0.0001 ****
AM Peak 2018 105.21 91.28 119.14 7.08 87 313 <0.0001 **** 2020 140.70 123.87 157.53 8.55 44 282 <0.0001 ****
Afternoon Off Peak
2018 117.74 105.05 130.44 6.45 134 313 <0.0001 **** 2020 138.18 124.04 152.32 7.18 113 282 <0.0001 ****
PM Peak 2018 107.83 93.90 121.76 7.08 88 313 <0.0001 **** 2020 125.62 111.19 140.04 7.33 83 282 <0.0001 ****
Night Off Peak
2018 206.15 162.77 249.53 22.05 3 313 <0.0001 **** 2020 125.77 109.24 142.29 8.40 30 282 <0.0001 ****
Figure B-5: ICT vs. time of day.
The statistics in Table B-9 indicate that time of day did not have a significant effect on
ICT in 2020. This is different from the results of the analysis of RCT versus time of day in
Section 5.2.5 of the report. In 2020 RCT values varied at different times of day, which could be
indicative of fluctuations in congestion patterns at peak and off-peak periods that would affect
incident queueing patterns. However, as Table B-9 indicates, the time it took for IMTs to leave

155
the scene was fairly consistent across all times of day in 2020. While incidents at times of day
were consistently cleared more quickly, IMTs tended to stay at the scene for similar amounts of
time, which could be due to additional responsibilities and clean-up required after lane clearance.
One observation from the results shown in Table B-10 and Figure B-5 is that in 2020
IMTs were able to leave the scene of the incident much more consistently than in 2018. Before
the program expansion, IMTs tended to stay at the scene of crashes in the off-peak periods for
longer amounts of time. However, with addition of more IMTs, they have been able to fulfill
their duties, leave the scene, and get to safety faster during those times. The consistency of
performance is one of the greatest advantages that the statistical results in this report have shown,
and that result of consistency is substantiated in this analysis as well.
B.1.6 ICT vs. RT
An analysis of ICT against the distribution of RT for each given year in 2018 and 2020
was also performed. Table B-11 shows a summary of the results of this analysis.
Table B-11: Analysis of ICT vs. RT
Year Mean ICT per minute RT Lower Upper SE Sample Size p > |t| Significance 2018 0.84 0.56 1.11 0.14 302 <0.0001 **** 2020 0.56 0.16 0.96 0.20 275 0.0058 ***
Table B-11 indicates that after accounting for crash type, there is still a significant effect
of RT on ICT for both 2018 and 2020. For 2018, each added minute of RT translates to about
0.84 minutes of added ICT. For 2020, this value is about 0.56 minutes of ICT per minute of RT.
This result shows that ICT cannot be described solely by crash type, but that RT also has an
effect on the time it takes IMTs to leave the scene of the incident.

156
APPENDIX C. STATISTICAL RESULTS OF UHP PERFORMANCE
The purpose of this study was to evaluate the effects of UDOT’s IMT program after the
2018 expansion. For that reason, the data reduction and analysis in the report focus on
performance measures of IMTs and the user impacts associated with IMT performance.
However, performance measure data were collected for UHP teams and analyses were also
conducted on UHP performance. A brief overview of practical findings is shown here.
C.1 User Impacts
Analyses of the effects of UHP performance on user impacts were conducted, with the
following results.
C.1.1 ETT and EUC vs. UHP RT
Table C-1 and Table C-2 show results of an analysis of ETT and EUC versus UHP RT.
Table C-1: Significance of IMT Program Size vs. ETT for UHP RT
Does ETT between 2018 and 2020 depend on UHP RT, after accounting for volume differences?
p > F Significance 0.4199 ns
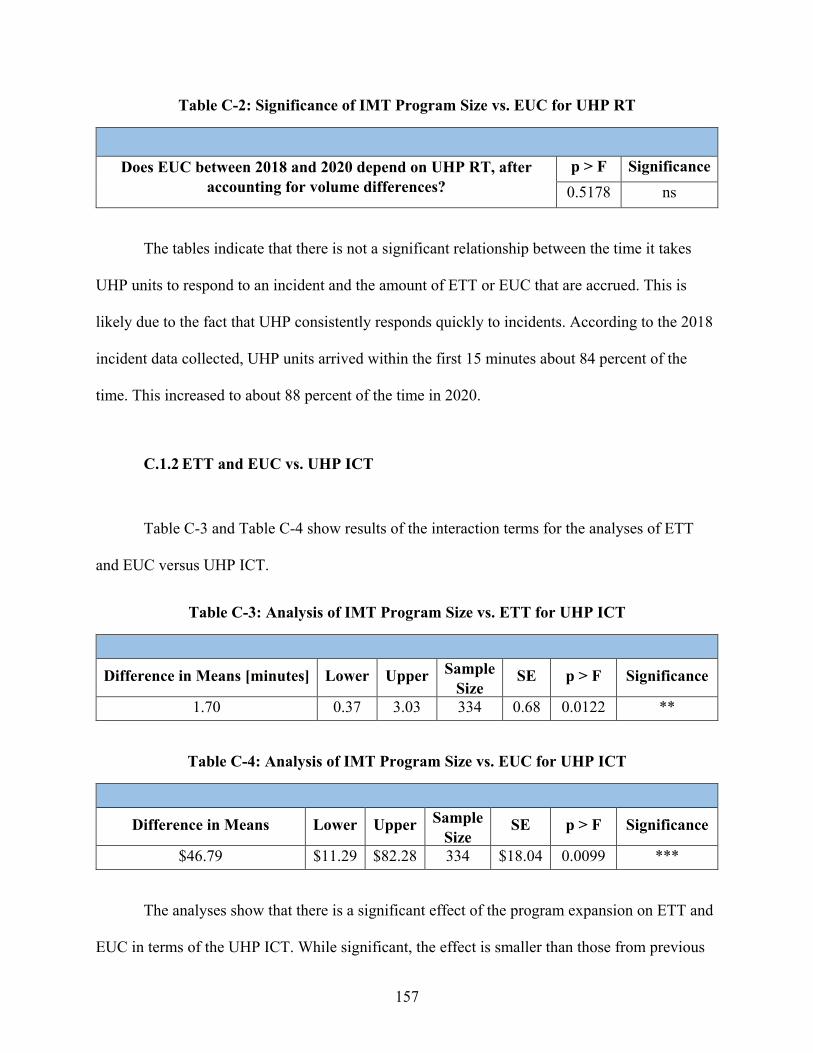
157
Table C-2: Significance of IMT Program Size vs. EUC for UHP RT
Does EUC between 2018 and 2020 depend on UHP RT, after accounting for volume differences?
p > F Significance 0.5178 ns
The tables indicate that there is not a significant relationship between the time it takes
UHP units to respond to an incident and the amount of ETT or EUC that are accrued. This is
likely due to the fact that UHP consistently responds quickly to incidents. According to the 2018
incident data collected, UHP units arrived within the first 15 minutes about 84 percent of the
time. This increased to about 88 percent of the time in 2020.
C.1.2 ETT and EUC vs. UHP ICT
Table C-3 and Table C-4 show results of the interaction terms for the analyses of ETT
and EUC versus UHP ICT.
Table C-3: Analysis of IMT Program Size vs. ETT for UHP ICT
Difference in Means [minutes] Lower Upper Sample Size
SE p > F Significance
1.70 0.37 3.03 334 0.68 0.0122 **
Table C-4: Analysis of IMT Program Size vs. EUC for UHP ICT
Difference in Means Lower Upper Sample Size
SE p > F Significance
$46.79 $11.29 $82.28 334 $18.04 0.0099 ***
The analyses show that there is a significant effect of the program expansion on ETT and
EUC in terms of the UHP ICT. While significant, the effect is smaller than those from previous

158
analyses of ICT. This is likely due to the fact that UHP responders have additional duties that
they must complete before officially clearing the incident, such as additional paperwork and the
occasional responsibility to escort crash victims to the hospital. For each minute of UHP ICT
saved in 2020, about 1.70 minutes of ETT and $46.79 of EUC were saved when compared with
2018.