
Analysis of avian eggshell microstructure using X-ray …grupo179/pdf/Alejandro 07c.pdf · Analysis...
8
Eur. J. Mineral. 2007,19,391-398 Analysis of avian eggshell microstructure using X-ray area detectors ' Depto. Mineralogia y Petrologia, Universidad de Granada, 18002 Granada, Spain "Corresponding author, e-mail: [email protected] Dpto. Geologia, Universidad de Jaen, Granada, Spain Institut National de la Recherche Agronomique, Centre de Tours, Station de Recherches Avicoles, 37380 Nouziily, France Dpto. Microbiologia, Universidad de Granada, 18002 Granada, Spain Laboratorio de Estudios Cristalograficos. Instituto Andaluz de Ciencias de la Tierra, CSIC-Universidad de Granada, 18002 Granada, Spain Abstrack Avian eggshell is a relatively simple model of biomineralization processes. This biomaterial consists mainly of a min- eral part made of columnar caicite crystals and a pervading organic matrix. The organization of eggshell microstructure is de- termined by genetic, physiological and externa1 factors. Eggshell microstructural characteristics can inform us about biological and physicochemicalprocesses affecting its forrnation. Quantitative microstructure information can be efficieníiy determined from two-dimensional diffraction pattems of polycrystalline samples. The present paper analyses the potential of this methodology as applied to microstructure characterization of fully dense polycrystailine matenals such as avian eggshell. High correlation was found between parameters determined by X-ray difiaction, such as the number, size and intensity of reflection spots in Debye rings, and crystal size dimensions determined by means of optical microscopy. Crystal sizes can be calculated from these pa- rameters following calibration using samples of the s m e material whose sizes are already known. Estimated error in crystal size measurements was within 5 %. In comparison with traditional methodologies (e.g., optical microscopy), this technique enabled much faster and more precise determination of microstructural information. Key-words: biomineralization, calcite, eggshell, microtexture, CCD detector, Debye-Scherrer ring. Introduction Avian eggshell formation is an interesting and relatively simple model of biomineralization processes. Eggshell de- position is very fast being completed in less than 20 h while the egg is residing in the hen's uterus. The result- ing biomaterial consists mainly of a mineral part (> 95 %) made of columnar calcite crystals and a pervading or- ganic matrix (1-3.5 %), resulting in a composite struc- ture which has excellent mechanical properties (Sirnkiss & Wilbur 1989; Arias et al. 1993; Nys 1999). The orga- nization of eggshell is determined by genetic factors as different avian species develops eggshells with specific mi- crostnicture characteristics. Eggshell microstructural char- acteristics are also modified by different physiological con- ditions (i.e., age, diet, disease). For instance, as hens age there are notable changes in eggshell microstructure as well as a marked decrease of its mechanical properties (Rodriguez-Navarro et al., 2002; Ahmed et al., 2005). Old hens laid eggs with shells constituted of larger crystals than those laid by young hens. Also, shells of the older DOI: 10.1 12710935-1221/2007/0019-1724 hens contain abnormally large and highly oriented crys- tals with an unusual fan-like shape. These changes are as- sociated with modifications of the quantity and composi- tion of organic matrix which in turn controls crystal growth (Nys et al., 1999; Ahrned et al., 2005). Thus, rnicrostruc- tural characteristics can inform us about biological and physicochemical processes afFecting biominerals forma- tion and properties (Silyn-Robert & Sharp, 1986; Berman et al., 1994; Rodriguez-Navarro et al., 2002; Ahmed et al., 2005). Understanding these processes is of great inter- est to mineralogists and materials scientists. However, mi- crostructureanalysis of polycrystalline materials is a highly tedious process when using traditional techniques (i.e., op- tical or scanning electron rnicroscopy and irnage analyses; Kurzydlowski & Ralph, 1995). It is especially impracti- cal in the study of a large number of samples necessary for statistical analyses. This paper describes an altema- tive methodology which based on two-dimensional (2D) X-ray diffraction allows microstructure quantification of polycrystalline materials (e.g., crystal size and orientation) much more efficiently than using traditional techniques. 2D -, ... 0935-l.221/07/0019-1724 $3.60 ' i @ 2007 E. Schweizerbart'sche Verlagsbuchhandlung, D-70176 Stungart
Transcript of Analysis of avian eggshell microstructure using X-ray …grupo179/pdf/Alejandro 07c.pdf · Analysis...

Eur. J. Mineral. 2007,19,391-398
Analysis of avian eggshell microstructure using X-ray area detectors
' Depto. Mineralogia y Petrologia, Universidad de Granada, 18002 Granada, Spain "Corresponding author, e-mail: [email protected]
Dpto. Geologia, Universidad de Jaen, Granada, Spain Institut National de la Recherche Agronomique, Centre de Tours, Station de Recherches Avicoles,
37380 Nouziily, France Dpto. Microbiologia, Universidad de Granada, 18002 Granada, Spain
Laboratorio de Estudios Cristalograficos. Instituto Andaluz de Ciencias de la Tierra, CSIC-Universidad de Granada, 18002 Granada, Spain
Abstrack Avian eggshell is a relatively simple model of biomineralization processes. This biomaterial consists mainly of a min- eral part made of columnar caicite crystals and a pervading organic matrix. The organization of eggshell microstructure is de- termined by genetic, physiological and externa1 factors. Eggshell microstructural characteristics can inform us about biological and physicochemical processes affecting its forrnation. Quantitative microstructure information can be efficieníiy determined from two-dimensional diffraction pattems of polycrystalline samples. The present paper analyses the potential of this methodology as applied to microstructure characterization of fully dense polycrystailine matenals such as avian eggshell. High correlation was found between parameters determined by X-ray difiaction, such as the number, size and intensity of reflection spots in Debye rings, and crystal size dimensions determined by means of optical microscopy. Crystal sizes can be calculated from these pa- rameters following calibration using samples of the s m e material whose sizes are already known. Estimated error in crystal size measurements was within 5 %. In comparison with traditional methodologies (e.g., optical microscopy), this technique enabled much faster and more precise determination of microstructural information.
Key-words: biomineralization, calcite, eggshell, microtexture, CCD detector, Debye-Scherrer ring.
Introduction
Avian eggshell formation is an interesting and relatively simple model of biomineralization processes. Eggshell de- position is very fast being completed in less than 20 h while the egg is residing in the hen's uterus. The result- ing biomaterial consists mainly of a mineral part (> 95 %) made of columnar calcite crystals and a pervading or- ganic matrix (1-3.5 %), resulting in a composite struc- ture which has excellent mechanical properties (Sirnkiss & Wilbur 1989; Arias et al. 1993; Nys 1999). The orga- nization of eggshell is determined by genetic factors as different avian species develops eggshells with specific mi- crostnicture characteristics. Eggshell microstructural char- acteristics are also modified by different physiological con- ditions (i.e., age, diet, disease). For instance, as hens age there are notable changes in eggshell microstructure as well as a marked decrease of its mechanical properties (Rodriguez-Navarro et al., 2002; Ahmed et al., 2005). Old hens laid eggs with shells constituted of larger crystals than those laid by young hens. Also, shells of the older
DOI: 10.1 12710935-1221/2007/0019-1724
hens contain abnormally large and highly oriented crys- tals with an unusual fan-like shape. These changes are as- sociated with modifications of the quantity and composi- tion of organic matrix which in turn controls crystal growth (Nys et al., 1999; Ahrned et al., 2005). Thus, rnicrostruc- tural characteristics can inform us about biological and physicochemical processes afFecting biominerals forma- tion and properties (Silyn-Robert & Sharp, 1986; Berman et al., 1994; Rodriguez-Navarro et al., 2002; Ahmed et al., 2005). Understanding these processes is of great inter- est to mineralogists and materials scientists. However, mi- crostructure analysis of polycrystalline materials is a highly tedious process when using traditional techniques (i.e., op- tical or scanning electron rnicroscopy and irnage analyses; Kurzydlowski & Ralph, 1995). It is especially impracti- cal in the study of a large number of samples necessary for statistical analyses. This paper describes an altema- tive methodology which based on two-dimensional (2D) X-ray diffraction allows microstructure quantification of polycrystalline materials (e.g., crystal size and orientation) much more efficiently than using traditional techniques. 2D
-, . . . 0935-l.221/07/0019-1724 $3.60 ' i @ 2007 E. Schweizerbart'sche Verlagsbuchhandlung, D-70176 Stungart

A.B. Rodriguez-Navarro, A. Yebra, Y. Nys, C. Jimenez-Lopez, J.M. Garcia-Ruiz
Fig. 1. (A) Experimental set-up for d i b t i o n analysis of an eggshdl satnple. (B) S c h d c drawing of the eggsheíí crystals conbibuting to the difbction paaem. Only those crystals whose (ihkl) planes are oriented in Bragg condition diffract. Only crystals 1 and 2 comply with these conditions in this figure. The inteneíty of the hkl dect ion or spots is proportional to the size of the diffracting crystal. CrystaI2 would for this mson display a more intense reflection than crystal 1.
difiaction patterns can be collecteú with any diffractometer equipped with a 2D or area detector (i.e., CCD, Image Plate or a photographic film) and contain much more information than conventional linear scans (Le., 8-28 scans) collected using standard powder diffractometers (Sulyanov et al., 1994; Bunge et al., 2002; He, 2003; Rodriguez-Navarro et al., 2006). These pattems typically consist of concen- tric [Debye-Scherrer] nngs produced by the superposition of reflections from crystals illuminated by the X-ray beam and that are oriented with a set of (hkl} crystallographic planes oriented fulfilling Bragg condition (Cullity, 1977). Depending on sample characteristics, these rings might be continuous or spotty and display specific variation in the intensities along them. These features proportionate impor- tant information about the microstructure of the sample: grain size, preferential orientation, mosaicity, stress, etc. (Bunge et al., 2002; He, 2003; Rodriguez-Navarro et al., 2006; Rodriguez-Navarro, 2006). This paper shows how quantitative rnicrostructure information (e.& crystal size and shape) can be automatically extracted from these pat- terns using specialized software. Previously, this method- ology was applied to quantifying crystal sizes of abra- sive powders in a sister paper (Rodnguez-Navarro et al., 2006). The abrasives come in graded sizes and were espe- cially useful to validate the methodology in particular its use to determine crystal sizes. In this previous study, the use and range of applicability of the methodology is de- scribed in detail. The main objective of the present study was to extend this charactenzation methodology to natural samples in which crystals are aggregated and display vary- ing sizes, shapes and degrees of preferential orientation. A set of eggshells of different avian species with varying mi- crostructure characteristics was chosen in order to compare microstructure information obtained by optical microscopy (mainly size and shape of crystals) with parameters deter- mined by X-ray diffraction and to determine calibration curves relating both sets of parameters. As stated before, eggshells are very interesting materials and are also par-
ticularly suitable for XRD analyses because of their small thicknesses allows them to be analysed by transmission without a significant loss in X-ray intensity due to absorp- tion.
Materials and methods
Samples: Fourteen eggshell samples were selected from different bird species displaying various microstnicture characteristics: laying hen (8), pheasant (2), guinea fowl (1), pekins falcon (l), ostrich (1), muscovy duck (l), partndge (1).
Optical microscopy: Thin-sections (< 30 pm) of ra- dial cut eggshells were prepared for microstructure anal- ysis by optical microscopy (OM). Crystal size distribu- tions were determined from microphotographs taken with cross-polarized light (x10; Olympus SZ, Japan). Crystal size measurements were done using IrnageJ, an image anal- ysis program (National Institute of Health, USA). Maxi- mum width and length were determined for each crystal in pictures taken at three dserent locations within each eggshell. Eggshell thickness was considered as that of the mineral part of the eggshells and measured from the above- mentioned microphotographs.
X-ray diffraction: X-ray diffraction analyses were done at the Centro de Instrumentación Científica (U. Granada) using a single-crystal diffractometer equipped with a CCD area detector @8 Smart APEX, Bruker, Germany). Pieces (about 1 x 1 cm) were cut from each eggshell sample, mounted using clay-dough and set on a sample holder of the diífractometer. Samples were mounted so that their outer shell surface faced the area detector and the inner surface faced to the incident X-ray beam (Fig. 1). The X-ray beam goes through the sample and a transmission diífraction pattem is morded on the area detector. Table 1 summarizes experimental conditions used for diffraction analyses. Figure 2 shows typical difiaction pattems from
Eggshell rnicrostructure anaiyses by 2D X-ray diffraction
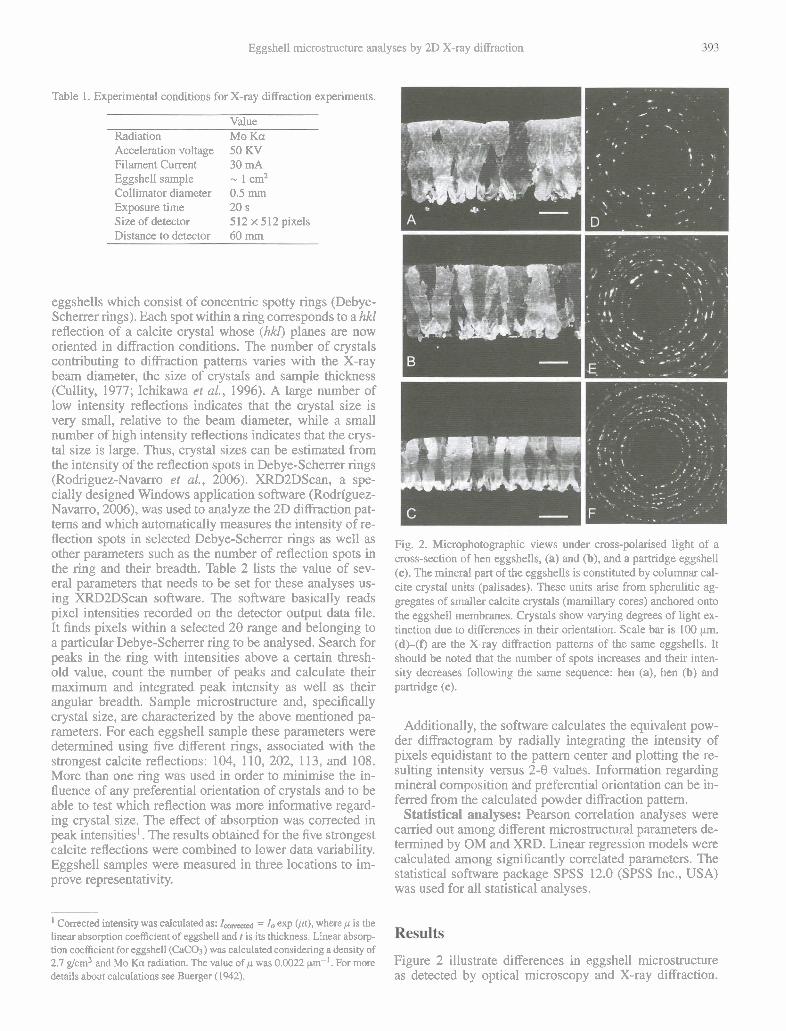
Table l. Experimental wnditions for X-ray diffraction experiments.
Vaiue Radiation Mo K a Acceleration voltage 50 KV Filament Current 30 mA Eggshell sample - 1 cm2 Collimator diameter 0.5 mrn Exposure time 20 S
Size of detector 512 x 512 pixels Distance to detector 60 mm
eggsheils which consist of concentric spotty rings (Debye- Scherrer rings). Each spot within a nng corresponds to a hkl reflection of a calcite crystal whose (hkl) planes are now oriented in diffraction conditions. The number of crystals contributing to diffraction patterns varies with the X-ray beam diameter, the size of crystals and sample thickness (Cullity, 1977; Ichikawa et al., 1996). A large nurnber of low intensity reflections indicates that the crystal size is very small, relative to the beam diameter, while a small number of high intensity reflections indicates that the crys- tal size is large. Thus, crystal sizes can be estimated from the intensity of the reflection spots in Debye-Scherrer rings (Rodriguez-Navarro et al., 2006). XRDLDScan, a spe- cially designed Windows application software (Rodríguez- Navarro, 2006), was used to analyze the 2D diffraction pat- terns and which automatically measures the intensity of re- flection spots in selected Debye-Scherrer rings as well as other parameters such as the number of reflection spots in the ring and their breadth. Table 2 lists the value of sev- eral pararneters that needs to be set for these analyses us- ing XRD2DScan software. The software basically reads pixel intensities recorded on the detector output data file. It finds pixels within a selected 28 range and belonging to a particular Debye-Scherrer ring to be analysed. Search for peaks in the ring with intensities above a certain thresh- old value, count the number of peaks and calculate their maximurn and integrated peak intensity as well as their angular breadth. Sample microstructure and, specifically crystal size, are characterized by the above mentioned pa- rarneters. For each eggshell sample these parameters were determined using five different rings, associated with the strongest calcite reflections: 104, 1 10, 202, 113, and 108. More than one ring was used in order to minimise the in- fluence of any preferential orientation of crystals and to be able to test which reflection was more informative regard- ing crystal size. The effect of absorption was corrected in peak intensities'. The results obtained for the five strongest calcite reflections were cornbined to lower data variability. Eggshell samples were rneasured in three locations to im- prove representativity.
' Corrected intensity was calculatedas: = I, exp Ut). wherep is the linear absorption coefficient of eggshell and t is iis thickness. Linear absorp- tion coefficient for eggshell (Caco3) was calculated considenng a density of 2.7 g/cm3 and Mo K a radiation. The value of p was 0.0022 p-'. For more details about calculations see Buerger (1942).
Fig. 2. Microphotographic views under cross-polarised light of a cross-section of hen eggshelis, (a) and (b), and a partridge eggshell (c). The mineral part of the eggsheus is constituted by columnar cal- cite crystal units (paiisades). These units arise from spherulitic ag- gregates of smailer caicite crystals (mamíllary cores) anchored onto the eggshell membranes. Crystals show varying degrees of light ex- tinction due to differences in their orientation. Scale bar is 100 pm. (d)-(f) are the X-ray diffraction pattems of the same eggshells. It should be noted that the number of spots increases and their inten- sity decreases following the same sequence: hen (a), hen (b) and partridge (e).
Additionally, the software calculates the equivalent pow- der diffractogram by radially integrating the intensity of pixels equidistant to the pattem center and plotting the re- sulting intensity versus 2-8 values. Information regarding mineral composition and preferential orientation can be in- ferred frorn the calculated powder diffraction pattern.
Statisticai anaiyses: Pearson correlation analyses were canied out among different rnicrostructurai parameters de- termined by OM and XRD. Linear regression models were calculated among significantly correlated pararneters. The statistical software package SPSS 12.0 (SPSS Inc., USA) was used for al1 statistical anaiyses.
Figure 2 illustrate differences in eggshell microstructure as detected by optical rnicroscopy and X-ray diffraction.

A.B. Rodriguez-Navarro, A. Yebra, Y. Nys, C. Jimenez-Lopez, J.M. Garcia-Ruiz
Table 2. Values of parameters set to calculate peak intensities in the Debye-Scherrer rings using XRD2DScan software.
Parameters Vaiue 2 Theta integration mnge (deg) 1.2 , Background substraction True 2 Theta step (deg) 0.1 Psi step (deg) 0.5 Rol1 width (deg) 2.0 Peak width (deg) 2.0 Minimum peak intensity (counts) 2000
Figures 2a and b are microphotographic views of two lay- ing hen eggshells under cross-polarised iight, while Fig. 2c shows the microstructure of a partridge eggshell. Eggshells are composed of columnar calcite crystal units (palisades). These units arise from spherulitic aggregates of smaller cal- cite crystals (mamillary cores) anchored onto the eggshell membranes. Average crystal unit sizes in eggshelis vary from one avian species to another, as well as among sam- ples of the same species (Fig. 2a and b). Colurnnar unit sizes in these samples decrease in the following order: hen (a), hen (b) and partridge (c). The 2D X-ray d i h t i o n pat- tems produced by these eggshelis can be seen in Figs. 2d, e, and f. It should be noted that both the number of spots in- creases and spot intensity decreases in the same order as crystal sizes decreases.
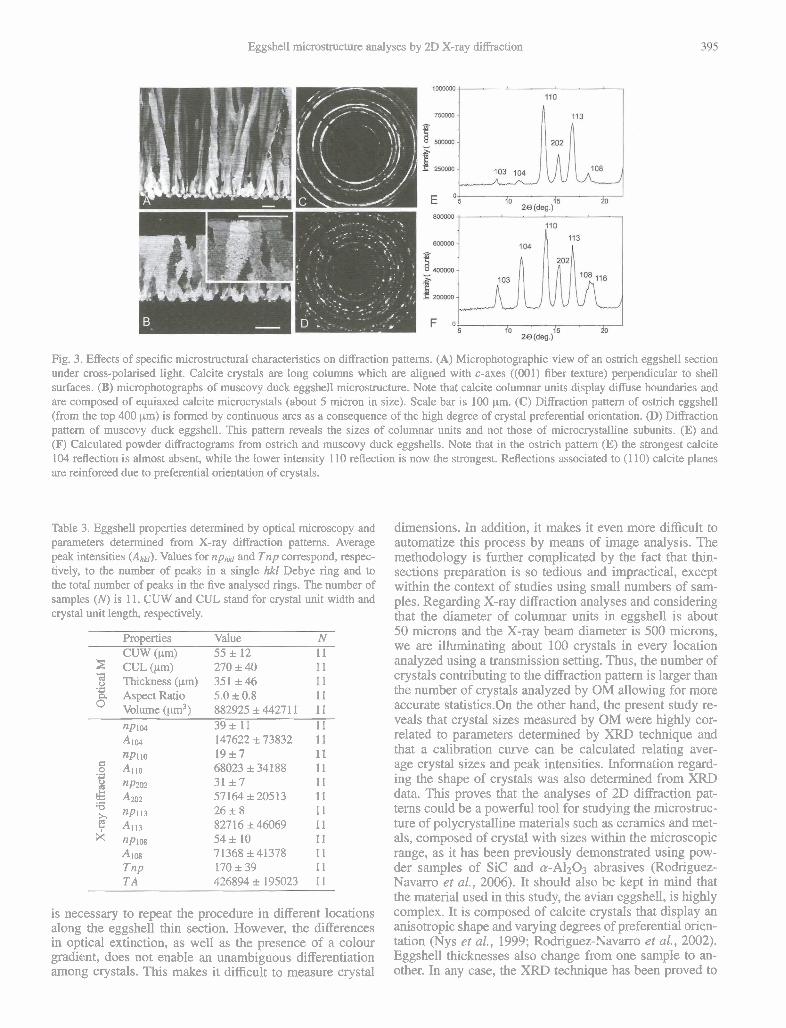
Figure 3 describes two cases of eggshells showing pecu- liar microstructure characteristics and illustrates how these characteristics are manifested in the diffraction pattem. Figure 3a shows the microstucture of an ostrich eggshell as seen under cross-polarized light. It is constituted by slender columnar calcite crystals oriented with their c-axes aligned ((001) fiber texture) and perpendicular to the eggshell outer surface. Crystals reflect in the same section of the Debye ring because they share almost the same crystallographic orientation (Fig. 3c). Continuous arcs are produced rather than separated reflection spots. The effect of the strong tex- ture can also be observed in the calculated powder diffrac- togram for ostrich eggshell (Fig. 3e). In the transmission experiments, crystals are preferentially oriented with their c-axes aligned nearly parallel to the X-ray beam so that re- flection from crystallographic planes belonging to the [001] zone are reinforced. The intensity of the 110 reflection is therefore reinforced and is now the strongest one instead of the 104 which is alrnost absent. The second case is that of samples in which subrnicrostructure is similar to that of muscovy duck eggshells constituted by microcrystals ar- ranged in greater columnar units. One would expect that such a microcrystaliine material would yield a diffraction pattem constituted by constinuous rings like that produced by a fine powder sample. Instead a spotty pattem, typical of a coarsely grained sample, is formed. This is due to that crystals within each columnar unit share an almost iden- tical crystailographic orientation and al1 contribute to the same reflection spots acting like a single or mosaic crystal.
It has been shown in the above mentioned 2D pattems, though just qualitatively, that as crystal size increases the number of reflection spots in the pamm decreases and their
intensity increases. Following, it will be described how mi- crostrutural parameters and XRD parameters are related. In particular, correlations among parameters determined by OM (length and width of crystal units) and different param- eters determined by XRD (nphkr, Ahkl) have been studied in order to compare the microstructure information obtained by both techniques. Results are surnmarized in Tables 3 and 4. It is important to say that eggshells from ostrich, muscovy duck and pekins falcon because of their peculiar microstructural characteristics were excluded from these analyses. Highly significant co-variation can be seen be- tween XRD-determined parameters and OM-determined average crystal dimensions. The number of peaks (nphkr) in the Debye-Scherrer rings associated to Bragg reflec- tions 104, 1 10,202, 1 13 and 108 are negatively correlated to average crystal dimensions. On the contrary, peak inten- sity (Ahkl) in Debye-Scherrer rings are positively, and more significantly, correlated with crystal dimensions. The sum of average peak intensity (TA) for this group of reflections is even more highly correlated to crystal dimensions. In- terestingly, peak intensity (Alo4) in the 104 ring is highly correlated to the length of columnar units (CUL). On the other hand, Tnp is positively correlated to the aspect ra- tio of crystal units (defined as the length to width ratio of colurnnar crystals).
These results make it possible to calculate a calibration curve for the crystal sizes from parameters determined by XRD. Figure 4 shows a set of cross-plots showing the re- lationship among crystal dimensions and parameters de- termined by XRD. Figure 4a shows that, as the width of crystal units (CUW) increases, total peak intensities (TA) increases linearly in accordance with the regression line model (TA = b* CUW + m; b = 15037 and m = 401350; N = 11; R~ = 0.913; p < 0.0001). Interestingly, peak in- tensities in 104 Debye ring, ALo4, strongly correlate with crystal unit lengths (CUL; Fig. 4b). The volume of crystals is also positively correlated to the sum of peak intensities in al1 five rings (TA). Figure 4d illustrates the positive cor- relation between crystal aspect ratio (defined as the length to width ratio of columnar crystals) and the total number of peaks (Tnp) in the five rings. Any of these curves can be used to determine crystal sizes in unknown samples with a high degree of confidence, and also to obtain informa- tion regarding the shape of crystals. This is especially valid when using intregrated peak intensities and, in particular, the sum of averaged peak intensities for several rings (i.e., TA). For instance, if we back-calculate the width of colum- nar units making the eggshell using the caiibration curve of Fig. 4a, there is an average error of 2.9 pm corresponding to an error of 5 % in the estimation.
Discussion
Microstructural information of eggshell obtained by OM is highly detailed regarding size, shape and orientation of crystals. However, this data is limited to a 2-D radial sec- tion of a very small area (at x10, field of view is approxi- mately 400 x400 pm). Crystal size measurements are taken from a small number of crystals (typically 20-30), Thus, it
Eggsheii microstnicture analyses by 2D X-ray diffraction
Fig. 3. Effects of specific microstructural characteristics on diffraction pattems. (A) Microphotographic view of an ostrich eggshell section under cross-polarised light. Calcite crystals are long columns which are aligned with c-axes ((001) fiber texture) perpendicular to shell surfaces. (B) microphotographs of muscovy duck eggsheli microstructure. Note that calcite columnar units display difise boundaries and are composed of equiaxed calcite microcrystals (about 5 micron in size). Scale bar is 100 pm. (C) Diffraction pattem of ostrich eggshell (from the top 400 pm) is forrned by continuous arcs as a consequence of the high degree of crystal preferential orientation. (D) DifTraction pattem of muscovy duck eggshell. This pattern reveals the sizes of columnar units and not those of microcrystailine subunits. (E) and (F) Calculated powder diffractograrns from ostrich and muscovy duck eggshells. Note that in the ostrich pattern (E) the strongest caicite 104 reflection is almost absent, while the lower intensity 110 reflection is now the strongest. Reflections associated to (1 10) calcite planes are reinforced due to preferential orientation of crystals.
Table 3. Eggsheii properties determined by optical microscopy and pararneters determined from X-ray dihction pattems. Average peak intensities (AhW). Values for n p h ~ and Tnp correspond, respec- tively, to the number of peaks in a single hkl Debye nng and to the total number of peaks in the five analysed rings. The number of samples (N) is 11. CUW and CUL stand for crystai unit width and crystal unit length, respectively.
Properties Value N C m (pm) 55 I 12 11
5: CUJ- (pm) 270 I 40 Thickness (pm) 351 I 46
.E 8 Aspect Ratio 5.0 I 0.8 11 Volume (ym3) 882925 I 44271 1 11 ~ P I M 391 11 11 A104 147622 I 73832 11 ~ P I I O 1917
0 11
.o AI lo 68023 I 34188 1 1 npzoz 31 17 11 4 . 0 2 57164 I 20513 11
'O np113 26 I 8 11 m L; Al13 82716146069 11 X ripios 54 I 10 11
Alos 71368141378 11 T ~ P 170 I 39 11 TA 426894 I 195023 1 1
is necessary to repeat the procedure in different locations along the eggshell thin section. However, the differences in optical extinction, as well as the presence of a colour gradient, does not enable an unambiguous differentiation among crystals. This makes it difficult to measure crystal
dimensions. In addition, it makes it even more difficult to automatize this process by means of image analysis. The methodology is further complicated by the fact that thin- sections preparation is so tedious and impractical, except within the context of studies using small numbers of sam- ples. Regarding X-ray diffraction analyses and considering that the diameter of columnar units in eggshell is about 50 microns and the X-ray beam diameter is 500 microns, we are illurninating about 100 crystals in every location analyzed using a transmission setting. Thus, the number of crystals contributing to the diffraction pattem is larger than the number of crystals analyzed by OM allowing for more accurate statistics.On the other hand, the present study re- veals that crystal sizes measured by OM were highly cor- related to pararneters determined by XRD technique and that a calibration curve can be calculated relating aver- age crystal sizes and peak intensities. Information regard- ing the shape of crystals was also detennined from XRD data. This proves that the analyses of 2D diffraction pat- terns could be a powerful tool for studying the microstmc- ture of polycrystalline materials such as ceramics and met- a l ~ , composed of crystal with sizes within the microscopic range, as it has been previously demonstrated using pow- der samples of Sic and a-A1203 abrasives (Rodriguez- Navarro et al., 2006). It should also be kept in mind that the material used in this study, the avian eggshell, is highly complex. It is composed of calcite crystals that display an anisotropic shape and varying degrees of preferential orien- tation (Nys et al., 1999; Rodriguez-Navarro et al., 2002). Eggshell thicknesses also change from one sample to an- other. In any case, the XRD technique has been proved to

A.B. Rodriguez-Navarro, A. Yebra, Y. Nys, C. Jimenez-Lopez, J.M. Garcia-Ruiz
be very sensitive allowing the detection of small changes in eggshell microstructure even between samples belong- ing to the same avian species. For instance, in a previous study this technique allowed the detection of subtle but still significant differences in hen eggshell microstructure associated to moulting. XRD data indicated that the size of eggshell constituting crystals decreased after birds were forced to moult their feathers (Ahmed et al., 2005). How- ever, in that previous study, no calibration curve was es- tablished so that only qualitative information could be in- ferred.
From the calibration curves determined here, calcite crys- tal sizes can be calculated at an estimated error of within 5%, similar to that obtained with abrasive powder of graded sizes (Rodriguez-Navarro et al., 2006). This error may be smaller for other materials which are not as heterogeneous and complex as avian eggshells. Furthermore, since data collection is fast, it is possible to analyze a large number of samples for studies requiring statistical analyses. For instance, to correlate material properties (i.e., mechanical, electrical) to their microstructure characteristics.
The following subsections discuss in detail the influence of various factors which need to be considered for the cor- rect application of the methodology:
a) Crystal size and sample thickness
The intensity of an hkl reflection depend on several fac- tors including crystal structure, crystallinity of the material, absorption, temperature, geometry of the diffractometer (Azaroff, 1969; Cullity, 1977; Rodriguez Gallego, 1982). Nevertheless, other factors being equal, the intensity of re- flections increases and is proportional to the volume of the crystal, provided that the (hkl) planes satisfy the Bragg con- dition. As crystal sizes increase, so also does the intensity of the reflected X-ray though intrinsic properties of crys- tals (crystallinity, mosaicity, and other imperfections) could modify this relationship. Also, a slight deviation in crystal orientation from Bragg condition would decrease the in- tensity reflected by the crystal, since a tail of the reflec- tion peak will be measured. Therefore, it is not possible, in principle, using this technique to determine a size distribu- tion but an average size (Rodriguez-Navarro et al., 2006). In any case, for the different materials studied, we found a very good linear relationship between average crystal size and integrated peak intensities. Also keep in mind that this technique requires samples of known sizes for calibration. In case these samples are not readily available, still we can get valuable qualitative data.
On the other hand, as the X-ray beam passes through the sample thickness, its intensity is attenuated by absorption. In the case of eggshell, the dependence of reflection inten- sity on crystal size and sample thickness is as follows:
where a is the crystal units length, b is the crystal units width, t is shell thickness and ,u, the linear absorption coefficient. There is, thus, an optimum sample thickness (l/,u) which produces the maximum intensity of diffraction
(Buerger, 1942; Cullity, 1977; Rodriguez Gallego, 1982). For our measurements, it is about 450 pm (similar to the thickness of the eggshell samples studied here). Above this thickness value, the absorption effect will be dominant and the diffracting beam intensity will decrease. Thus, the opti- mum thickness value is an upper limit for the crystal sizes that can be determined using this technique. This is so be- cake absorption effect became too strong and intensity de- creases with crystal size. Another difficulty regarding the measurement of such coarse crystal sizes is that only a few crystals are illuminated by the beam (0.5 rnm in diame- ter in this case) and, thus, the resulting data are not suf- ficiently reliable. This upper limit can be extended using larger beam diameters. Minimum crystal size limit is at- tained when crystal reflections begin to overlap so that in- dividual peak intensities can no longer be measured. This lower limit is also determined by area detector size and by the number of pixels of the area detector circumscribing a Debye ring. Ln order to be resolved, peak width must be at least 3 pixels. In our study, for instance, a 104 De- bye nng is composed of approximately 750 pixels. There- fore, a maximum of around 250 peaks can be measured without overlapping. Thirty peaks appear using a coliima- tor of 0.5 mm in diameter for a sample whose crystal is 50 microns. A minimum crystal size of about 5 pm can be estirnated which is similar to that determined experi- mentally for abrasive powders (Rodriguez-Navarro et al., 2006). However, the limit can be lowered by decreasing the size of the beam using a smaller collimator. This makes it possible to illuminate a smaller number of crystals so that their reflections can be measured (Hirsch & Kellar, 1952). Commercially available collimators of 0.05 rnm are able to generate spotty rings even with samples whose crystal sizes are 1 pm or below. Thus, by selecting an adequate X-ray beam size, different crystal sizes ranges can be analyzed.
b) Sample aggregution state
One of the main advantages of the technique based on X- ray diffraction is that it does not depend on the aggregation state of the material. The reflection intensity of an indi- vidual crystal is always proportional to its volume (size), regardless of whether crystals are part of a fully dense ce- rarnic as in this case study or in powder form. However, the number of spots is proportional to the number of crys- tals illuminated by the beam and, thus, depends on the de- gree of crystal dispersion in a matrix (Rodriguez-Navarro et al., 2006). That is why the Iatter parameter (used in ear- lier studies; Hirsch and Kellar, 1952; Andrews & Johnson, 1959; Cain & Heyn, 1964; Ichikawa et al., 1996) is a poorer estimate of crystal sizes.
c ) The injuence of the preferential orientation and submicrostructure
Figure 3 illustrates two cases in which this technique is not applicable. The first is that of strongly textured sam- ples formed by highly oriented crystals. Figure 3a shows the rnicrostucture of an ostrich eggshell. Columnar cal- cite crystals display aligned c-axes ((001) fiber texture)

Eggsheii microstnicture analyses by 2D X-ray diffraction
Table 4. Correlation among eggsheii properties determined by optical microscopy and parameters determined from X-ray diffraction pattems. R is the Pearson correlation coefficient and p is the significance (for p < 0.05 correlation are significative). The number of samples (N) is 11.
CUW CUL Aspect Ratio Volume R P ' R P R P R P
CUW 1 .O00 0.587 0.058 -0.806 0.003 0.967 < 0.001 CUL 0.587 0.058 1.000 -0.005 0.989 0.719 0.013 Aspect Ratio -0.806 0.003 -0.005 0.989 1.000 -0.666 0.025 Volume 0.967 < 0.001 0.719 0.013 -0.666 0.025 1.000 ~ P I W -0.680 0.021 -0.064 0.852 0.789 0.004 -0.643 0.033 A104 0.764 0.006 0.762 0.006 -0.426 0.192 0.813 0.002 npi 10 -0.909 < 0.001 -0.471 0.144 0.748 0.008 -0.887 < 0.001 Allo 0.909 < 0.001 0.345 0.299 -0.844 0.001 0.836 0.001 nP2m -0.899 < 0.001 -0.403 0.218 0.770 0.006 -0.862 0.001 Amz 0.951 < 0.001 0.557 0.075 -0.765 0.006 0.914 < 0.001 npi 13 -0.859 0.001 -0.397 0.227 0.783 0.001 -0.850 0.001 A113 0.887 < 0.001 0.330 0.321 -0.843 0.001 0.862 0.001 ripios -0.719 0.013 -0.018 0.957 0.868 0.001 -0.640 0.034 A108 0.931 <0.001 0.408 0.212 -0.821 0.002 0.883 < 0.001 T ~ P -0.872 <0.001 -0.256 0.447 0.876 <0.001 -0.828 0.002 TA 0.956 < 0.001 0.572 0.066 -0.763 0.006 0.942 < 0.001
Fig. 4. Calibration curves relating calcite crystal dimensions to XRD-parameters. (a) Relationship between total peak intensity (TA) and columnar unit width (CUW). (b) Relationship between peak intensity in 104 ring (Alo4) and columnar unit length (CUL). (e) Relationship between total peak intensity (TA) and crystal volume. (d) Relaiionship between total number of peaks (Tnp) and crystal aspect ratio (defined as the length to width ratio).
which are oriented perpendicular to the eggshell outer surface. Crystals reflect in the same section of the De- bye ring because they share almost the same crystallo- graphic orientation (Fig. 3c). Continuous arcs are produced rather than separated reflection spots. Therefore, the above- mentioned technique can not be successfully used with strongly textured materials, since dihct ion spots from in- dividual crystals are not resolvable Ochikawa et al., 1996). The effect clf the strong texture can also be observed in the calculated powder difiactograrn for ostrich eggshell
(Fig. 3e). Crystals are preferentiaily oriented with their c-mes aligned nearly parallel to the X-ray beam so that reflection from crystallographic planes belonging to the [O011 zone are reinforced. The intensity of the 1 10 reflec- tion is therefore reinforced and is now the strongest one. The second case is that of samples in which submicrostruc- ture is similar to that of muscovy duck eggshells and the colurnnar crystals units are formed by microcrystals that share an almost identical crystallographic orientation. Here, whereas the technique measures the size of larger

A.B. Rodriguez-Navarro, A. Yebra, Y. Nys, C. Jimenez-Lopez, J.M. Garcia-Ruiz
columnar units, it can not determine their subunit size. Thus, a certain amount of information regarding the type of sample microstnicture must be known if crystal sizes are to be correctly deterrnined by X-ray diffraction. For instance, it is necessary to know to some degree the size range of crystal units making the samples and their shape as weil as their organization and degree of orientation. Note also that, each crystal, according to their orientation relative to the X-ray beam, will have difFerent sets of {hkl) planes reflect- ing, on an associated Debye-Scherrer ring. Thus, measur- ing peak reflections from several rings will improve sample statistics and minimise the effects of preferential orienta- tion of crystals.
07375 (Spanish Government) and the Programa Ramon y Cajal (Spanish Govemment). The authors are grateful to Agustin Rueda Montes (U. Granada) for the preparation of petrographic thin-sections of eggshell samples and to Joel Gautron (INRA, France) for eggshell samples. Thanks to Dr. Jose Romero Garzon (CIC-U. Granada) and Prof. En- rique Gutierrez Puebla (Instituto de Materiales de Madrid) for their technical assistance. The authors also benefited from the valuable comments of Prof. Manuel Rodriguez- Gallego (U. Granada), Prof. Hock (U. Erlangen) and an anonymous referee. Thorough editing of the original En- glish manuscript was done by Marco Bettini.
d) Cornparison with Scherrer methodology References It is highly important that the technique described in this paper not be confounded with the widely used Scherrer method. The latter is based on the fact that when crystal sizes are smaller than about 0.1 pm, there is an important broadening of diffraction peaks in powder diffiactograms (within the 2-0 angle) (Azaroff, 1968; Cullity, 1977; Ro- driguez Gallego, 1982). The Scherrer methodology pro- vides information regarding sample crystallinity and par- ticle size (or more exactly the size of domains of coherent diffraction) when this is in the submicrometer range. How- ever, our technique is much more quantitative and is able to determine the physical size of crystals. It can be used for a larger size range. In any case, both techniques are comple- mentary within the size range to which each is applicable and with regard to the type of information they provide.
Conclusions
Andrews, K.W., Johnson, W. (1959): New method for the determi- nation of grain or crystallite size from spotty difkaction rings. British J. Appl. Phys., 10, 321-325.
Azaroff, L.V. (1968): Elements of X-ray crystallography. McGraw- Hill, New York. pp. 549-550.
Buergex, J.M. (1942): X-ray crystallography. John Wiley & Sons, New York. pp. 179-182.
Cain, C.J., Heyn, A.N.J. (1964): X-ray diffraction studies of the crystalline structure of the avian eggsheíi. Biophysical Journal, 4, 23-39.
Cullity, B.D. (1977): Elements of X-ray DiffI-action, New York, Addison-Wesley. pp. 28 1-307.
He, B.B.P. (2003): Introduction to two-dimensional X-ray difiac- tion. Powder diffraction, 18,7 1-85.
Hirsch, P.B., Kellar, J.N. (1952): A study of cold-worked aluminium by X-ray micro-beam technique. 1 Measurement of particle vol- ume and misorientations. Acta Crystallographica, 5, 162-167.
Ichikawa, F., Okuno, M., Okamoto, M., Tanaka, F. (1996): Nondestructive measurement of grain size in steel plate by
The X - r a ~ diffractiOn methOdO1ogh based On the detailed X-ray diffraction. Materials Science Forwn, 210-213, 195-202. andyses of 2~ diffraction pattems, displays several advan- Kurzydlowski, K.J. & ~ a l p h , B. (1995): n e quantitative description tages in the quantification of polycrystalline sample mi- of the microstmcture of materials. CRC Press, Boca Raton. crostmcture in cOm~ansOn to O~tical microsco~~- Nys, Y., Hincke, M.T., Arias, J.L., Garcia-Ruiz, J.M., Solomon, pie preparation is and the data al1 0f the S.E. (1999): Avian eggshell mineralization. Poultry and Avian crystals illuminated by the beam in a volume of the sample ~~~l~~~ R ~ ~ ~ ~ ~ ~ , 10, 143-166. is integrated into one single pattem. Measurements are in- ~ ~ d ~ . ~ ~ ~ ~ ~ a l l ~ ~ ~ , M. (1982): L~ difracción de los rayos X. dependent of the aggregation state and this technique can Granada, Alhambra. be a ~ ~ l i e d to any ~ ~ ~ ~ ~ r y ~ ~ ~ ~ ~ material whOse crystal Rodriguez-Navarro, A.B. (2006): XRD2DScan: new software size is within the micrometer range. Results obtained using for polycrystailine materials characterization using two- X-ray diffraction are in good agreement with those gen- dimensional X-ray difiaction. J. Appl.Cryst., 39, 905-909. erated by optical microsco~~. However, the X - r a ~ based Rodriguez-Navarro, A., Kalin, O., Nys, Y., Garcia-Ruiz, J.M. technique is much faster and convenient for studying a (2002): Infiuence of microstructure on the shell strength of large number of samples. Also, the number of crystals con- eggs laid by hens of different ages. British Poultry Science, 43, tributing to the diffraction pattern is greater and ailows for 395-403. more aCCUrate StatisticS than techniques based On OM. Ad- Ro&-iguez-Navmo, A.B., Alvarez-Lloret, P., Ortega-Huertas, M., ditionally, data analyses are fully automatiseú by apply- Rodriguez-Gallego, M. (2006): Automatic crystal size detenni- ing XRD2DScan software. Although this kind of analyses nation in the micrometer range from spotty X-ray difiaction must be done using an X-ray diffractometer equipped with rings of powder samples. J. Am. Ceram. Soc. 89,2232-2238. an area detector, such equipment is now available in many Sulyanov, S.N., Popov, A.N., Kheiker, D.M. (1994): Using a two- laboratones and does not therefore represent a significant dimensional detector for powder diffractomehy, J. Appl. Cryst., lirnitation. 27,934-947.
Received 22 Septernber 2006 Acknowledgements: This study was funded by grants Modlfied version received 9 January 2007 QLRT-2001-01606 (European Commission), REN2003- Accepted 12 ~ a r c h 2007