Analysis of ATC Communication messages Relevant to Altitude Change Requests Electronic Navigation...
17
Analysis of ATC Communication messages Relevant to Altitude Change Requests Electronic Navigation Research Institute IPACG/39, 5-6 February 2014, Fukuoka, Japan
-
Upload
rhoda-horton -
Category
Documents
-
view
224 -
download
0
Transcript of Analysis of ATC Communication messages Relevant to Altitude Change Requests Electronic Navigation...

Analysis of ATC Communication messages Relevant to Altitude Change Requests
Electronic Navigation Research Institute
IPACG/39, 5-6 February 2014, Fukuoka, Japan

• The most of flights over the Pacific Ocean are long range flight, so pilots request a change to economic altitude with light weight due to fuel consumption other than caused by weather conditions.
• For the purpose of measure how much operators’ demand flight being approved, we analyzed ATC communication messages relevant to altitude change requests in oceanic control airspace within Fukuoka FIR.
Introduction

ATC: CLIMB TO AND MAINTAIN FL350
PILOT: REQUEST CLIMB TO FL350
Pilot Request Altitude Change
We analyzed “Unable” reply ratio; the ratio of number that the first reply is “Unable” to number of pilot’s request of altitude change, as an indicator of how operators’ demand flight being approved.
PILOT “Request [change altitude].”ATC “Unable due to [reason].”
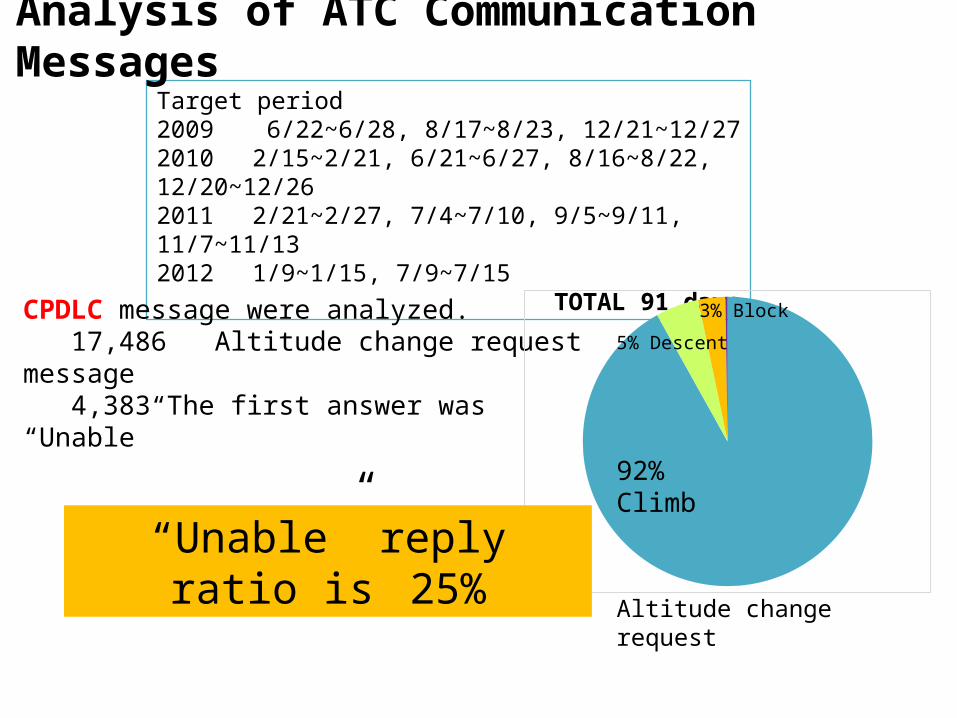
Target period2009 6/22~6/28, 8/17~8/23, 12/21~12/272010 2/15~2/21, 6/21~6/27, 8/16~8/22, 12/20~12/262011 2/21~2/27, 7/4~7/10, 9/5~9/11, 11/7~11/132012 1/9~1/15, 7/9~7/15
TOTAL 91 days
Analysis of ATC Communication Messages
CPDLC message were analyzed.17,486 Altitude change request message4,383 The first answer was “Unable”
92% Climb
5% Descent
3% Block
Altitude change request
“Unable” reply ratio is25%

“Unable” reply ratio of each city-pairNo. Altitude Change Request
No. “unable” reply
“unable” reply ratio
From JapanJapan → North America 2248 514 23%Japan → Alaska 152 28 18%Japan → Hawaii 857 321 37%Japan → South Pacific 546 135 25%Japan → South-east Asia 780 318 41%
For JapanNorth America → Japan 2158 437 20%
Alaska → Japan 281 43 15%Hawaii → Japan 955 176 18%
South Pacific → Japan 346 67 19%South-east Asia → Japan 188 64 34%
Over FlightSouth-east Asia → North America, Alaska,
Hawaii 3044 689 23%East Asia → North America, Alaska, Hawaii,
South Pacific 2065 557 27%North America, Alaska, Hawaii → South-
east Asia 2799 749 27%North America, Alaska, Hawaii, South
Pacific → East Asia 941 255 27%

Manila
A590
-----Radar coverage
ATS Data link airspace
High “unable” reply ratio
Reference: AIP Japan
• “Unable” reply ratio Japan to South-east Asia 41% South-east Asia to Japan 34%
• Airway A590 ( extending to the southwest of Japan)
Available Both direction flight

High “unable” reply ratio Japan > HawaiiSE Asia – N AmericaOther
Around 17Z a day of July 2012
TOKYO
27N165E
Around 15Z a day of May 2012
TOKYO
27N165E
• “Unable” reply ratio Japan to Hawaii 37%
• Route configuration Cross the route of South east Asia – North America flight route, especially in summer
Around 15Z a day of Jul 2013
165E
Analysis of ATC Communication Messages
Jun-09
Sep-09
Dec-09
Mar-
10
Jun-10
Sep-10
Dec-10
Mar-
11
Jun-11
Sep-11
Dec-11
Mar-
12
Jun-12
0%
5%
10%
15%
20%
25%
30%
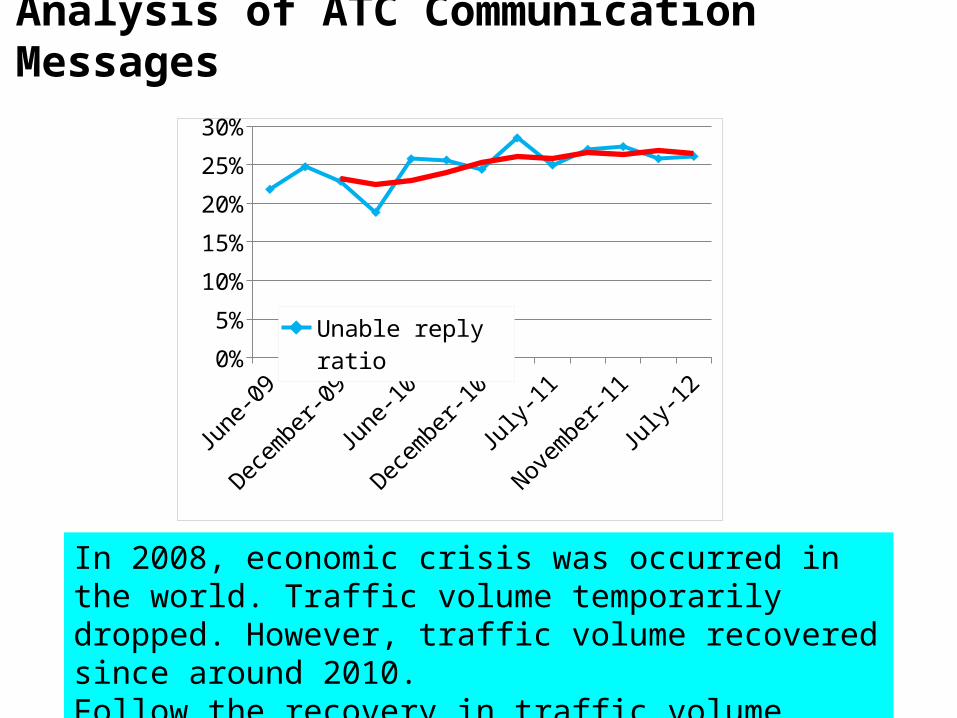
Unable reply ratioMoving Average
In 2008, economic crisis was occurred in the world. Traffic volume temporarily dropped. However, traffic volume recovered since around 2010.Follow the recovery in traffic volume, rate is higher gradually.
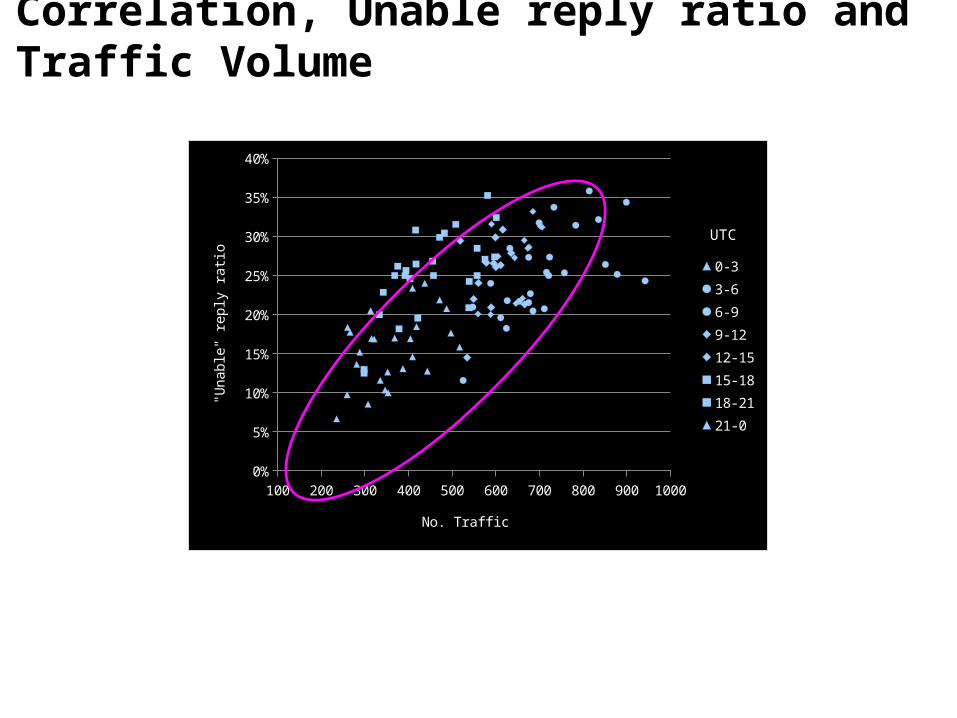
Correlation, Unable reply ratio and Traffic Volume
Traffic No.
100 200 300 400 500 600 700 800 900 10000%
5%
10%
15%
20%
25%
30%
35%
40%
0-33-66-99-1212-1515-1818-2121-0
No. Traffic
"Una
ble"
repl
y ra
tioUTC

Position DAY1 DAY2
Same direction/same track 27 37
Same direction/cross track 5 5
Same direction /converging track 3 4
Opposite direction/same track 0 3
Opposite direction /cross track 3 7
Opposite direction /converging track 0 2
Unidentified* 22 2
TOTAL 60 59
Positions with Related Aircraft
Same track
Cross track
Converging track
*UnidentifiedUnfound the related aircraft cause for “unable”. It is thought that securing altitude for the strategic reason or results from a coordination with neighboring ANSPs.
The related aircraft fly the same track in the same direction in most of case.
Flights on the same track with same altitude are affected longitudinal ATC separation.
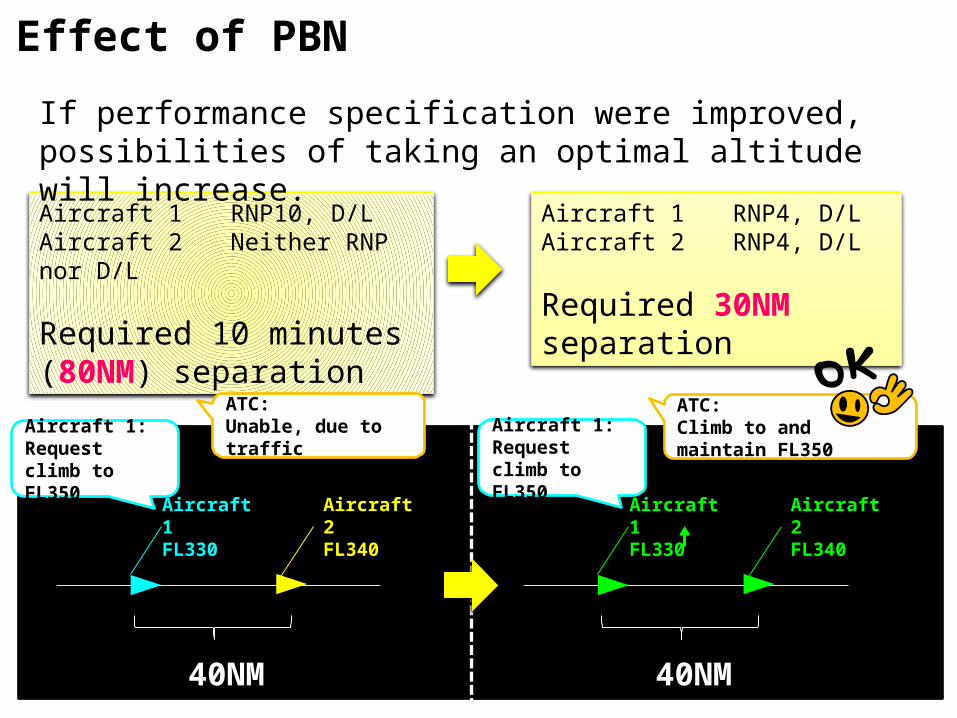
Aircraft 1 RNP10, D/LAircraft 2 Neither RNP nor D/L
Required 10 minutes (80NM) separation
Aircraft 1 RNP4, D/LAircraft 2 RNP4, D/L
Required 30NM separation
40NM
Aircraft 1FL330
Aircraft 2FL340
40NM
Aircraft 1FL330
Aircraft 2FL340
Aircraft 1:Request climb to FL350
ATC:Unable, due to traffic
ATC:Climb to and maintain FL350Aircraft 1:
Request climb to FL350
Effect of PBN
If performance specification were improved, possibilities of taking an optimal altitude will increase.
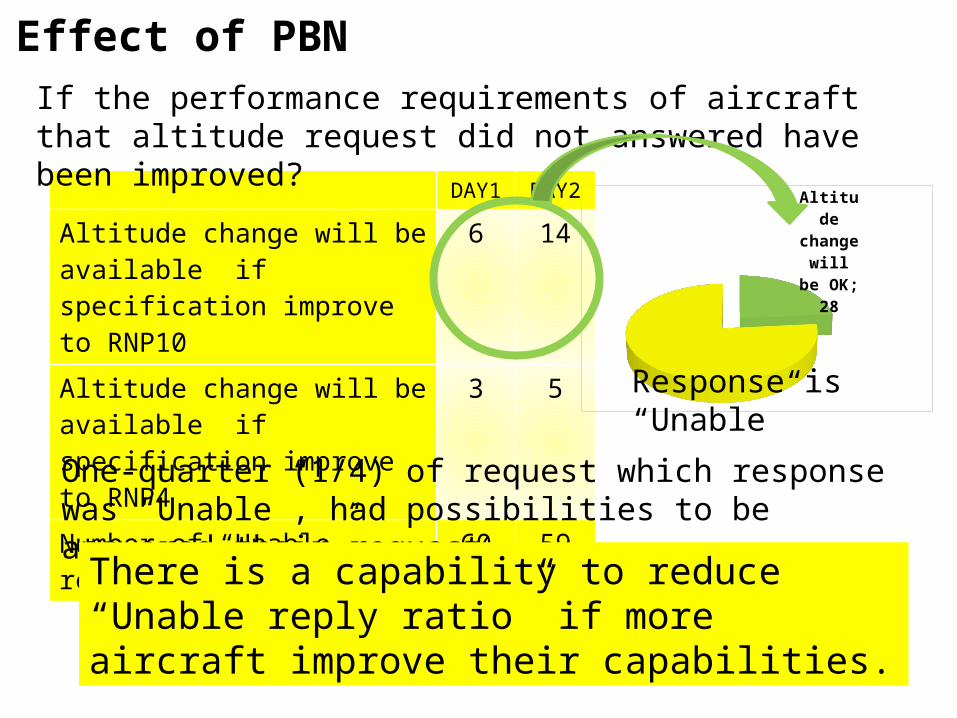
DAY1 DAY2
Altitude change will be available if specification improve to RNP10
6 14
Altitude change will be available if specification improve to RNP4
3 5
Number of “Unable” reply 60 59
Effect of PBNIf the performance requirements of aircraft that altitude request did not answered have been improved?
One-quarter (1/4) of request which response was “Unable”, had possibilities to be answered their request.
There is a capability to reduce “Unable reply ratio” if more aircraft improve their capabilities.
Alti-tude
change will be OK; 28
Response is “Unable”

Up to this point, the result came from CPDLC message.So, How is “unable reply rate” about all message including HF message?
CPDLC72%
HF28%
*Count from Flight Plans2013/Feb, Mar, Apr

“Unable” reply ratio CPDLC and HF
Analyzed day2013 2/4~2/10, 3/4~3/10 , 4/1~4/7
TOTAL 21 days
Altitude change request message
“Unable” reply “Unable” reply ratio
CPDLC 4,070 1,041 26%
HF 1,225 401 33%
TOTAL 5,295 1,442 27%
CPDLC is required to apply reduce separation minima.
This result showed the effectiveness of the reduced separation minima for altitude change requests.

“Unable” reply ratio CPDLC and HF
0 1 2 3 4 5 6 7 8 9 10 11 12 13 14 15 16 17 18 19 20 21 22 230%
5%
10%
15%
20%
25%
30%
35%
40%
45%
50%
0
200
400
600
800
1000
1200
1400
1600
1800
2000Traffic No. CPDLC HF TOTAL
(UTC)
Cumulative number of traffic during target day
With the increase in traffic volume, “unable” reply ratio is high. In most of the time, HF indicating a high “unable” reply ratio than
CPDLC.

Conclusion
The “unable” reply ratio in the Ocean airspace within the Fukuoka FIR was analyzed.
The ratio was related to the route configuration and traffic volume.
Most of the related aircraft fly the same track in the same direction.
About a quarter of the cases in which replies to altitude change requests were “unable”, their requests were approved when their capabilities improved.
There is possibility to reduce the “unable” reply ratio if more aircraft had the data link and improved navigation performance such as RNP4.
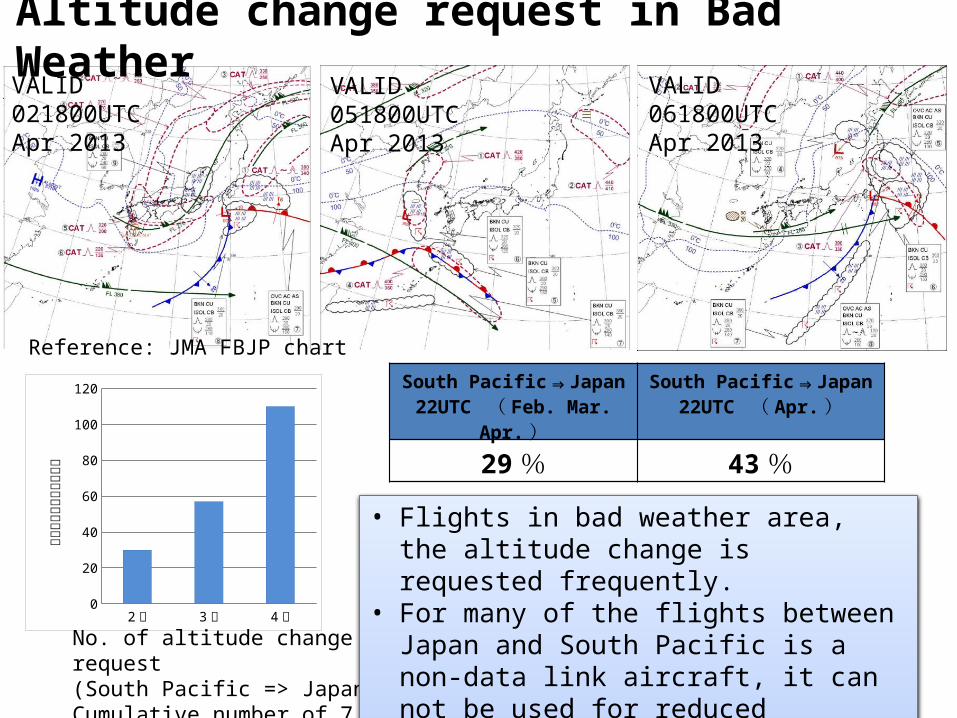
VALID 021800UTC Apr 2013
VALID 051800UTC Apr 2013
VALID 061800UTC Apr 2013
2月 3月 4月0
20
40
60
80
100
120
高度変更リクエスト件数
Reference: JMA FBJP chart
No. of altitude change request (South Pacific => Japan)Cumulative number of 7 days
• Flights in bad weather area, the altitude change is requested frequently.
• For many of the flights between Japan and South Pacific is a non-data link aircraft, it can not be used for reduced separations.
South Pacific Japan⇒22UTC ( Feb. Mar. Apr.)
South Pacific Japan⇒22UTC ( Apr.)
29% 43%
Altitude change request in Bad Weather