ANALYSIS OF ALTERNATIVES - iceaaonline.com · communication pathway. Based on earth coverage of...
17
COST RISK ANALYSIS OF SATELLITE BANDWIDTH SERVICES Sam Bresnahan Tecolote Research Inc., Arlington, VA 22202 Maj Ronald Woodaman Marine Corps Systems Command, Quantico, VA 22134 ABSTRACT The purpose of this paper is to demonstrate application of basic risk- analysis techniques to a real-world cost estimating problem. Each year the U.S. Marine Corps must budget millions of dollars for satellite bandwidth services. Communication via satellite is frequently required during operations in theater, disaster relief, and any situation in which a secure communication infrastructure is not already present. The USMC is developing an Expeditionary Command and Control Suite (ECCS) that allows small teams of soldiers to establish secure satellite voice and data links with headquarters. This study allows decision makers to compare bandwidth costs for three different ECCS alternatives. We surveyed airtime rates for INMARSAT M4, BGAN, and Ku-band services. We also developed four representative operational scenarios that describe how the system will be employed operationally. Finally, we interviewed USMC communication experts to determine the frequency and duration of each scenario, as well as the portion of time spent on each type of satellite band. We used ACE 7.0 to develop a flexible framework for modeling bandwidth costs and their associated cost risk. The results show that one of the ECCS alternatives is likely to require significantly more O&M funding because it relies on older satellite technology. In addition, the analysis provides a defendable estimate of annual bandwidth costs. I. INTRODUCTION Satellite bandwidth takes the lion’s share of O&MMC cost, and in fact accounts for the majority of ECCS life cycle cost. We therefore spent much of the effort researching bandwidth price structures, developing operational scenarios, allocating bandwidth usage, and determining fleet-level optempos through interviews with SATCOM experts within the USMC community. Page 1 Presented at the 2007 ISPA/SCEA Joint Annual International Conference and Workshop - www.iceaaonline.com
Transcript of ANALYSIS OF ALTERNATIVES - iceaaonline.com · communication pathway. Based on earth coverage of...

COST RISK ANALYSIS OF SATELLITE BANDWIDTH SERVICES
Sam Bresnahan Tecolote Research Inc., Arlington, VA 22202
Maj Ronald Woodaman
Marine Corps Systems Command, Quantico, VA 22134
ABSTRACT
The purpose of this paper is to demonstrate application of basic risk-
analysis techniques to a real-world cost estimating problem. Each year the U.S.
Marine Corps must budget millions of dollars for satellite bandwidth services.
Communication via satellite is frequently required during operations in theater,
disaster relief, and any situation in which a secure communication infrastructure is
not already present. The USMC is developing an Expeditionary Command and
Control Suite (ECCS) that allows small teams of soldiers to establish secure
satellite voice and data links with headquarters. This study allows decision makers
to compare bandwidth costs for three different ECCS alternatives. We surveyed
airtime rates for INMARSAT M4, BGAN, and Ku-band services. We also
developed four representative operational scenarios that describe how the system
will be employed operationally. Finally, we interviewed USMC communication
experts to determine the frequency and duration of each scenario, as well as the
portion of time spent on each type of satellite band. We used ACE 7.0 to develop a
flexible framework for modeling bandwidth costs and their associated cost risk. The
results show that one of the ECCS alternatives is likely to require significantly more
O&M funding because it relies on older satellite technology. In addition, the
analysis provides a defendable estimate of annual bandwidth costs.
I. INTRODUCTION
Satellite bandwidth takes the lion’s share of O&MMC cost, and in fact accounts for the
majority of ECCS life cycle cost. We therefore spent much of the effort researching bandwidth
price structures, developing operational scenarios, allocating bandwidth usage, and determining
fleet-level optempos through interviews with SATCOM experts within the USMC community.
Page 1
Presented at the 2007 ISPA/SCEA Joint Annual International Conference and Workshop - www.iceaaonline.com

The ECCS Project Office will fund the first year of O&MMC costs for each MEF.
After the first year, each MEF will submit a POM for its own O&M dollars. This analysis
provides a defendable estimate of annual satellite bandwidth costs. The ECCS Project Office
and the USMC operating forces can use the resulting risk-adjusted estimate for budget
development and POM submissions.
II. BACKGROUND
ECCS enables Marine commanders to establish data and voice communications with
headquarters via satellite from remote and austere locations. The small footprint, high bandwidth
system will be deployed to small Marine units across a range of scenarios such as disaster relief
and advance party operations. ECCS supports connectivity to Secret Internet Protocol Router
Network (SIPRNet), Unclassified but Sensitive Internet Protocol Router Network (NIPRNet),
Defense Switched Network (DSN), Defense Red Switched Network (DRSN), and video
teleconferencing (VTC).
In the spring of 2006, Marine Corps Systems Command (MCSC) in Quantico, Va.
commissioned an Analysis of Alternatives (AoA) to evaluate material solutions for ECCS for
cost and military effectiveness. The AoA study team, with representatives from Tecolote and
MCSC, narrowed the field to three alternatives:
1. Integrate a Commercial-Off-The-Shelf (COTS) solution proposed by Dataline,
Inc. called Data Communications Device Multi-Network (DCD-MN).
2. Procure a COTS solution called SwiftLink manufactured by TeleCommunication
Systems for the U.S. Coast Guard.
3. Adopt the Army’s Secure Enroute Communications Package – Improved
(SECOMP-I), managed by PM WIN-T at Ft. Monmouth, NJ.
Each of the alternatives uses different satellite communication pathways, such as
INMARSAT, BGAN, and Ku Band. Each pathway has a different price structure for air
time, which can cause O&M costs to vary widely among the alternatives.
Page 2
Presented at the 2007 ISPA/SCEA Joint Annual International Conference and Workshop - www.iceaaonline.com

III. MARKET RESEARCH
We conducted extensive market research on bandwidth costs for multiple communication
pathways. We used rates from published GSA schedules to estimate airtime costs for
INMARSAT M4 (GAN) (Table 1) and BGAN (Tables 2 and 3). GAN is available at 64 kbps,
while BGAN can reach speeds up to 492 kbps for the background IP service. In this study we
assumed commands will use streaming BGAN at 256 kbps1 to accommodate Video
Teleconferencing (VTC).
Table 1: INMARSAT M4 Airtime Rates M4 (GAN) - 64 kbps $/Min
Intelsat 6.34SATCOM 5.75MJ Sales, Inc. 6.96Mean 6.35
Table 2: BGAN Background IP Airtime Rates BGAN / Background IP $/MinTelenor 6.89SATWEST 5.93Outfitter Satellite, Inc. 6.95GMPCS 6.50Mean 6.57
Table 3: BGAN Streaming Airtime Rates
BGAN / 256 kbps streaming $/Min
Telenor 18.39SATWEST 18.05Outfitter Satellite, Inc. 19.90GMPCS 18.07Mean 18.60
To estimate Ku-band rates we obtained a commercial price list from Arrowhead Global
Solutions, Inc., which provides SATCOM services through a DISA contract vehicle known as
Defense Information System Network (DISN) Satellite Transmission Service, Global (DSTS-
G). We chose the 9-MHz transponder lease based on the ECCS requirement for a minimum
1 Streaming BGAN is also available at 32, 64, and 128 kbps. The minimum bit rate required to support VTC is 128 kbps.
Page 3
Presented at the 2007 ISPA/SCEA Joint Annual International Conference and Workshop - www.iceaaonline.com

bandwidth of 512 kbps.2 We also researched costs for “on demand” Ku-band service through
Segovia and TeleCommunication Systems, Inc. DISA and on-demand Ku-band rates appear in
Tables 4 and 5, respectively. DISA Ku-band rates differ according to geolocation; therefore,
we calculated median values across all global locations for Table 4. The data in Table 5 were
obtained through vendor quotes.
Table 4: DISA Ku-band rates 9 MHz Ku-band Median $Yearly 543,426Monthly 56,088Weekly 18,424Daily 3,256Hourly 1,085
Table 5: Sampling of On-Demand Ku-band rates3
Cost for 24/7 service 512 kbps/512kbps Cost (FY06 $)
1 day $460.07 / day
2 weeks $5,367.50
1-3 months $5,367.50 / month
IV. OPERATIONAL SCENARIOS
Tecolote and Dataline, Inc. developed four standard operational scenarios to describe how
ECCS deployable stations will be used in the field. The scenarios are described in Table 6. The
next step in our analysis was to determine the annual frequency of each scenario type. We
interviewed a Marine Corps communications expert4 in III MEF to obtain estimates of annual
frequency. Assuming I MEF and II MEF will operate approximately the same type and number of
missions as III MEF, we multiplied the III MEF frequencies by a factor of three to obtain annual
mission frequencies for the entire Marine Corps. The results for III MEF are shown in Table 7. 2 Transponder bandwidth is available through Arrowhead at 1, 9, 18, and 36 MHz. At minimum, a 512 kbps connection would require approximately 5 MHz of bandwidth to achieve an acceptable bit error rate. 3 Rates in Table 5 were obtained through SegoviaIP Global IP Services. Rates obtained through TeleCommunication Systems, Inc. were comparable. 4 III Marine Expeditionary Force, G-6 Division, System Planning & Engineering (SPE).
Page 4
Presented at the 2007 ISPA/SCEA Joint Annual International Conference and Workshop - www.iceaaonline.com

Table 6: Operational Scenarios MISSION TYPE DURATION DESCRIPTION
Advance Party Operations
(APO)
Low: 1 day Med: 3 days High: 4 days
This support could be anything from a site survey for an exercise in a remote area to the initial survey and assessment of operational/logistics requirements for a much larger scale operation. The survey or advance party team could be 2-20 personnel providing operational, intelligence, logistics, and communications assessments. The team could operate independent of any existing infrastructure (buildings, power, etc.), or operate out of a hotel.
Support for Forward Deployed
Operations (FDO)
Low: 3 day Med: 7 days
High: 14 days
This communications requirement would support an assessment team or operations detached from a deployed command. Examples might include a humanitarian relief assessment, Non-combatant Evacuation Operations (NEO), or detachment of personnel to support an on-going operation. Requirements for split operations from deployed Component Command, Marine Expeditionary Unit (MEU), Marine Expeditionary Brigade (MEB) and/or Marine Expeditionary Force (MEF) operations could use the ECCS capabilities to provide operations support to remote areas for early entry or limited duration operations. The ECCS capability is ideally suited for planning support of Marine Operators for deployed exercises and/or advance force operations.
Emergency Relief / Aid Missions
(ERM)
Low: 14 days Med: 21 days High: 30 days
This communications requirement would support an assessment team with operations detached from a parent command (MEF) for up to 30 days. Examples would include humanitarian relief operations such as Hurricane Katrina/Rita or Tsunami relief efforts.
First Force Communications
(FFC)
Low: 3 day Med: 7 days
High: 14 days
This communications requirement would support an early assessment team with follow on operations for a JTF/Component operation of longer standing duration. Any one of a number of scenarios might dictate this support which would be characterized by perhaps ISP, INMARSAT and/or BGAN support initially and followed by Ku-Band support, if/as required, for longer duration. This scenario would build from the preceding scenarios wherein ECCS provides both early entry (until other communications capabilities are provided) and possibly support to operations within the theater. Component, MEU, MEB and/or MEF commands could use the ECCS capabilities to provide operations support to remote areas for early entry as well as detached operations.
Table 7: Annual Frequency of Operational Scenarios, III MEF
low mid high
advance party ops 10 12 15
supt for fwd deployed ops 18 20 23
emergency relief / aid missions 5 7 10
first force communications 15 17 20
point estimates
scen
ario
s
Page 5
Presented at the 2007 ISPA/SCEA Joint Annual International Conference and Workshop - www.iceaaonline.com

V. BANDWIDTH ALLOCATION
ECCS supports data communications via multiple pathways, i.e., Ku-band, M4, BGAN,
public Internet, etc. To complete the analysis it was necessary to estimate usage of each
communication pathway. Based on earth coverage of satellite systems and operational order of
preference, Tecolote and MARCORSYSCOM developed a notional scheme for bandwidth
allocation, as shown in Table 8.
The SECOMP-I system largely relies on INMARSAT M4. We assumed that in most
SECOMP-I operations, two M4 channels would be bonded together to achieve 128 kbps, the
minimum bandwidth required to support video teleconferencing. DCD-MN prototypes currently
are using M4 terminals in testing. When production systems are fielded beginning in FY09,
however, they are likely to be fielded with BGAN terminals instead of M4 terminals. We
therefore assigned no time to M4 for DCD-MN and the SwiftLink solution, which is currently
fielded to the U.S. Coast Guard with BGAN terminals. Ku-band is considered the primary
satellite pathway for DCD-MN and SwiftLink, with BGAN representing the backup or
secondary connection.
Table 8: Bandwidth Allocation
DC
D-M
N
Swift
Link
SEC
OM
P-I
M4 (2 x 64kbps) – – 90
BGAN Streaming (256 kbps) 20% 20% –
BGAN IP (up to 492 kbps) 20% 20% –
DSTS-G (9MHz) 10% 10% –
On-Demand Ku (512 kbps) 40% 40% –
Local ISP (T1) 10% 10% 10%
Total 100% 100% 100%
ECCS Alternative
Com
mun
icat
ion
Path
%
Page 6
Presented at the 2007 ISPA/SCEA Joint Annual International Conference and Workshop - www.iceaaonline.com

VI. RISK DISTRIBUTIONS
Table 9 shows the triangular and normal probability distributions that were specified in
our cost-risk analysis. The Low and High bounds for INMARSAT M4, BGAN, and Ku-band
airtime service came out of the market research we conducted for this study (refer to Section III).
In most cases we surveyed three or four SATCOM service providers and obtained prices from
their GSA schedules. The mean was calculated and entered into the Equation / Throughput
column in Table 9. ACE automatically interprets numbers in this column as the modes (most
likely values) of their respective triangular distributions. This immediately presents mathematical
challenges; however, for simplicity we have assumed the most likely value approximates the
expected value, i.e., the mean.5 The columns labeled “Low %” and “High%” represent the lowest
and highest vendor quotes obtained during our market research. We have interpreted the values
in these columns as lying at the 15% and 85% confidence levels, respectively, which are the
default settings in ACE 7.0.
The values for DISA Ku-band in the Equation / Throughput column are mean costs. Low
and High values (at 15% and 85% confidence levels, respectively) were calculated from raw data
using statistical functions in Excel. For on-demand Ku-band service there was only one vendor6
whose price list was available for analysis. Prices were quoted by geographic area (CONUS,
Atlantic Ocean Region, Pacific Ocean Region, Indian Ocean Region, Africa, Asia, and South
America). Risk distributions for on-demand Ku-band were determined using a default measure of
low dispersion, i.e., a coefficient of variation (CV) of 0.15.7
5 In most cases, the mean and mode are not equal unless the distribution is normal. We could have calculated a
coefficient of variation (standard deviation divided by the mean) for each data set and assumed a normal
distribution. In fact, we carried out this calculation and found that the two methods produce results at the mean that
differ between 0.36% and 2.44% at the aggregate level. Similar results were obtained at the distribution tails (i.e.,
the 10% and 90% confidence levels). Therefore, our approximation appears reasonable for this particular study. 6 Arrowhead Global Solutions, Inc. Commercial price list. http://www.arrowhead.com/pricing. 7 The Air Force Cost Analysis Agency Cost Risk Handbook (expected publish date summer 2007) suggests default
subjective distribution bounds based on the observation that CVs of regressed CERs tend to fall in the 0.15 to 0.35 range.
Page 7
Presented at the 2007 ISPA/SCEA Joint Annual International Conference and Workshop - www.iceaaonline.com

For scenario duration and frequency we simply specified triangular distributions using
the high, medium and low values in Tables 6 and 7. Once again, ACE interprets the “medium”
values in these tables as the modes of their respective distributions. Note that probability
distributions were not assigned to the inputs for bandwidth allocation (see Table 8). Doing so
would generate random-draw scenarios in which total communication path usage would not
equal 1. Varying bandwidth allocation lends itself more easily to a what-if analysis in which
discrete cases rather than a distribution of random draws are analyzed.
Table 9: Probability Distributions
WBS/CES Description Equation /
Throughput (Mode)
Distribution Form Low % High %
**Cost Per Unit Time INMARSAT (M4) - 64kbps (Cost Per Min) 6.53 Triangular 88.1% 106.6% BGAN - 32 kbps Streaming (Cost Per Min) 2.54 Triangular 88.5% 122% BGAN - 64 kbps Streaming (Cost Per Min) 6.16 Triangular 95.8% 104% BGAN - 128kbps Streaming (Cost Per Min) 10.71 Triangular 97.99% 104.6% BGAN - 256 kbps Streaming (Cost Per Min) 18.60 Triangular 97.04% 107.00% BGAN - Background IP (Cost Per Min) 6.57 Triangular 90.3% 106% Local ISP (Cost Per Day) 20.00 DISA Ku Band - (Cost Per Year) 543426.00 Triangular 49.9165% 166.524% DISA Ku Band - (Cost Per Month) 56088.00 Triangular 47.868% 166.61% DISA Ku Band - (Cost Per Week) 18424.00 Triangular 55.148% 120.48% DISA Ku Band - (Cost Per Day) 3256.00 Triangular 60.73% 129.9% DISA Ku Band - (Cost Per Hour) 1085.00 Triangular 85.65% 114.3% On-Demand Ku (Cost Per Month) 5367.50 Normal 75% 125% On-Demand Ku (Cost Per Week - 8 hr. Day) 1852.80 Normal 75% 125% On-Demand Ku (Cost Per Week - 4 hr. Day) 926.40 Normal 75% 125% **Mission Duration (Days) Advance Party Operations (APO) 3 Triangular 1 4 Support for Forward Deployed Operations (FDO) 7 Triangular 3 14 Emergency Relief/Aid Missions (ER) 21 Triangular 14 30 First Force Communications (FFC) 7 Triangular 3 14 **Mission Frequency (Annual) Annual Frequency of Bandwidth Scenarios - per MEF Advance Party Operations (APO) 12 Triangular 10 15 Support for Forward Deployed Operations (FDO) 20 Triangular 18 23 Emergency Relief Missions (ERM) 7 Triangular 5 10 First Force Communications (FFC) 17 Triangular 15 20
Page 8
Presented at the 2007 ISPA/SCEA Joint Annual International Conference and Workshop - www.iceaaonline.com

VII. CALCULATION
Cost per mission type can be described by the equation
(Eq. 1), ijj
j tcp ××∑=
6
1
where pj is percent time spent on a particular communication pathway j such that ; cj is
cost per unit time for each j; ti is mission duration for the given mission type i, and j is one of six
communications pathways: M4 (GAN), BGAN IP, BGAN Streaming, ISP, DISA Ku-band, or
on-Demand Ku-band. To calculate mean cost per mission type, Eq. 1 was evaluated 10,000 times
by running a Latin Hypercube simulation with the inputs described in Tables 6-9. The results are
shown in Table 10. Note the results for SwiftLink and DCD-MN are equivalent because both use
the same bandwidth-allocation scheme (see Table 8).
∑ =1jp
Table 10: Mean Cost per Mission 2006 $K Mean Duration SwiftLink SECOMP-I DCD-MN
Advance Party Operation 2.6 days $20.96 $43.77 $20.96 Forward Deployed Operation 8.7 days $68.21 $144.50 $68.21 Emergency Relief Mission 21.9 days $169.04 $362.00 $169.04 First Force Communications 8.7 days $68.21 $144.51 $68.21
Annual bandwidth cost for the entire USMC is simply the sum of cost × quantity for each
mission type:
ii j
ijj ftcp ×⎟⎟⎠
⎞⎜⎜⎝
⎛∑ ∑= =
4
1
6
1 (Eq. 2),
where i is one of four mission types (see Table 7) and fi is the annual frequency for each mission
type. Table 11 shows the mean cost per year for the total Marine Corps obtained by evaluating
Eq. 2 10,000 times with the Latin Hypercube sampling method. Figure 1 breaks down total
annual mission hours for the Marine Corps, which is equal to . ∑=
4
1iii tf
Table 11: Mean Cost per Year (Total USMC) 2006 $K SwiftLink SECOMP-I DCD-MN Mean Cost (One Year) $12,348 $26,219 $12,348
Page 9
Presented at the 2007 ISPA/SCEA Joint Annual International Conference and Workshop - www.iceaaonline.com

Figure 1: Annual Marine Corps mission hours for ECCS
Support for Forward Deployed
Operations (FDO), 10,080,
32%
Emergency Relief Missions (ERM), 10,584,
33%
First Force Communications
(FFC), 8,568, 27%
Advance Party Operations
(APO), 2,592, 8%
Annual operating hours per deployable system are equal to ∑=
4
1
1
iiiq tf , where q is the quantity of
deployable stations. This expression evaluates to 31,824 / 20 = 1,591 hours, or about 18.2% of
the time in a given year. This quantity is used in the calculation of Energy Consumption in the
O&S phase of the estimate for each alternative. Furthermore, this calculation serves as a check
on our optempo calculations, i.e., each deployable station is predicted to operate 1,591 hours per
year, which is reasonable.
VIII. CORRELATION
The final step before running the risk simulation was to specify correlation. Before
specifying correlation, existing correlation was measured across all of the inputs in Table 12
using the RI$K correlation report in ACE 7.0. The measured correlation was less than 0.025
across all inputs at 10,000 iterations, demonstrating there is little functional or unintended
correlation inherent in the risk model. This step ensures we are not over-specifying correlation,
thereby overestimating cost risk.
Table 12 shows how correlation was specified on the inputs. Note that correlation is not
required at the WBS elements because there is no estimating risk, i.e., the inputs are simply
multiplication factors and are not used in CERs. We separated the inputs into logical groups
Page 10
Presented at the 2007 ISPA/SCEA Joint Annual International Conference and Workshop - www.iceaaonline.com
before applying correlation, reasoning that bandwidth costs would be highly correlated within
bandwidth types. For example, if we observe an increase in the daily cost of Ku bandwidth, we
should observe a concomitant increase in the monthly cost of Ku bandwidth. Similarly, if the
Marine Corps experiences an increase in the number of advance party operations in a given year,
they should observe a simultaneous increase in the frequency of other mission types. The same
logic can be applied to mission duration.
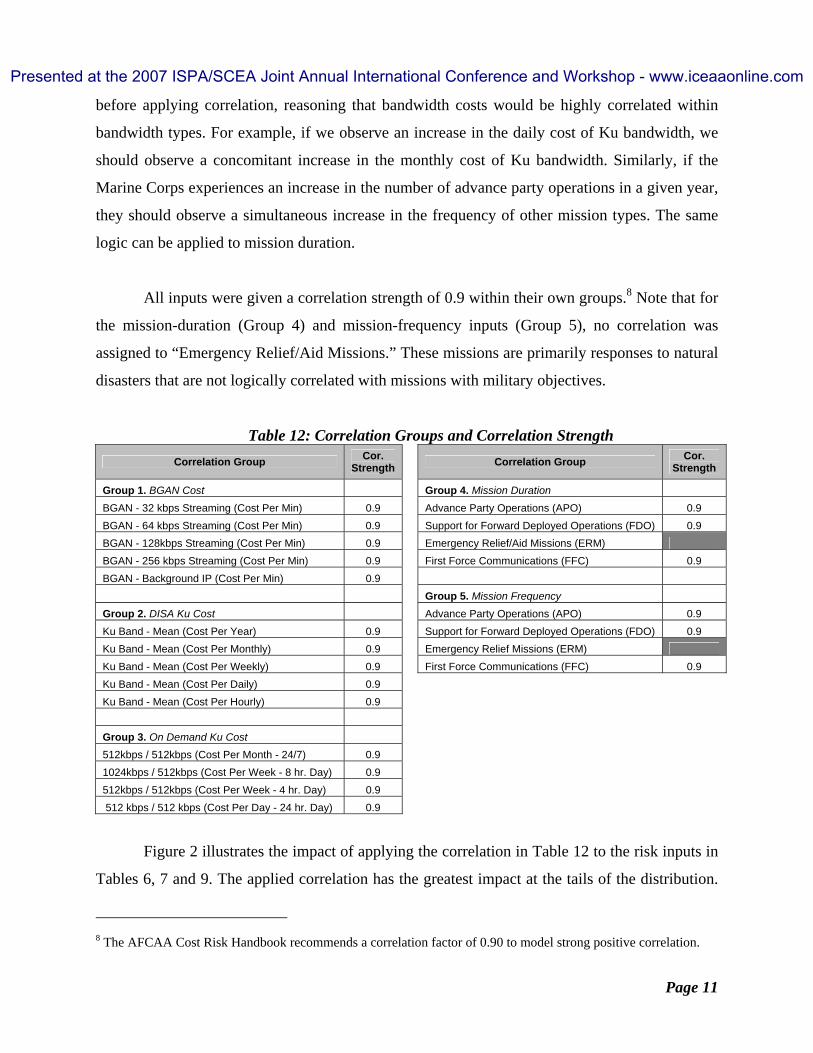
All inputs were given a correlation strength of 0.9 within their own groups.8 Note that for
the mission-duration (Group 4) and mission-frequency inputs (Group 5), no correlation was
assigned to “Emergency Relief/Aid Missions.” These missions are primarily responses to natural
disasters that are not logically correlated with missions with military objectives.
Table 12: Correlation Groups and Correlation Strength Correlation Group Cor.
Strength Correlation Group Cor. Strength
Group 1. BGAN Cost Group 4. Mission Duration BGAN - 32 kbps Streaming (Cost Per Min) 0.9 Advance Party Operations (APO) 0.9 BGAN - 64 kbps Streaming (Cost Per Min) 0.9 Support for Forward Deployed Operations (FDO) 0.9 BGAN - 128kbps Streaming (Cost Per Min) 0.9 Emergency Relief/Aid Missions (ERM) BGAN - 256 kbps Streaming (Cost Per Min) 0.9 First Force Communications (FFC) 0.9 BGAN - Background IP (Cost Per Min) 0.9 Group 5. Mission Frequency Group 2. DISA Ku Cost Advance Party Operations (APO) 0.9 Ku Band - Mean (Cost Per Year) 0.9 Support for Forward Deployed Operations (FDO) 0.9 Ku Band - Mean (Cost Per Monthly) 0.9 Emergency Relief Missions (ERM) Ku Band - Mean (Cost Per Weekly) 0.9 First Force Communications (FFC) 0.9 Ku Band - Mean (Cost Per Daily) 0.9 Ku Band - Mean (Cost Per Hourly) 0.9 Group 3. On Demand Ku Cost 512kbps / 512kbps (Cost Per Month - 24/7) 0.9 1024kbps / 512kbps (Cost Per Week - 8 hr. Day) 0.9 512kbps / 512kbps (Cost Per Week - 4 hr. Day) 0.9 512 kbps / 512 kbps (Cost Per Day - 24 hr. Day) 0.9
Figure 2 illustrates the impact of applying the correlation in Table 12 to the risk inputs in
Tables 6, 7 and 9. The applied correlation has the greatest impact at the tails of the distribution.
8 The AFCAA Cost Risk Handbook recommends a correlation factor of 0.90 to model strong positive correlation.
Page 11
Presented at the 2007 ISPA/SCEA Joint Annual International Conference and Workshop - www.iceaaonline.com

Figure 3 shows the percent delta of the correlated risk S-curve relative to the uncorrelated risk S-
curve. The x-axis represents the risk S-curve without correlation. The signed delta of the
correlated S-curve is plotted in 5% increments. At the 80% confidence level, the level at which
the Marine Corps funds its programs, correlation adds 7.5% to the uncorrelated total. Although
the figures only show the DCD-MN alternative, very similar results were obtained for SwiftLink
and SECOMP-I. Therefore, specifying correlation added a moderate amount of cost risk to the
estimate that otherwise would have remained unaccounted for.
Figure 2: Impact of Correlation on Risk-Adjusted Estimate
Annual Cost - Total USMCDCD-MN
Calculated with 5000 iterationsUsing Latin HyperCube
0%
10%
20%
30%
40%
50%
60%
70%
80%
90%
100%
$4,000 $6,000 $8,000 $10,000 $12,000 $14,000 $16,000 $18,000 $20,000 $22,000
BY2006 $K
Con
fiden
ce L
evel
(CDF
)
DCD-MN no correl Mean DCD-MN with correl
Page 12
Presented at the 2007 ISPA/SCEA Joint Annual International Conference and Workshop - www.iceaaonline.com

Figure 3: Correlated Risk, Percent Delta Relative to Non-Correlated Risk
-0.300
-0.250
-0.200
-0.150
-0.100
-0.050
0.000
0.050
0.100
0.150
0.200
0.250
0.300
0% 10% 20% 30% 40% 50% 60% 70% 80% 90% 100%
Correlation adds 7.5% additional risk at 80% confidence level.
VII. RESULTS AND DISCUSSION
From the probability distributions specified in Tables 6, 7 and 9 and the correlation
shown in Table 12, three cumulative density functions (CDFs) for annual bandwidth cost, one for
each alternative, were generated using a Latin hypercube simulation with 10,000 iterations. We
choose to show annual rather than total life cycle cost because total cost is dependent on the
operational life of ECCS.9 Furthermore, individual Marine Expeditionary Forces (MEFs) request
O&M dollars for their operations on an annual basis. Annual costs are more relevant than life
cycle costs with respect to O&M budget considerations.
The results appear in Figure 4. Note the CDFs for the SwiftLink and DCD-MN cases are
coincident because both use the same bandwidth-allocation scheme (see Table 8). Figure 5
presents the results at specified confidence intervals: 10%, 50% (median), and 90%. Each cluster
of bars in the figure represents an 80% prediction interval, i.e., we expect 80% of future
observations to be greater than or equal to the lowest value and less than or equal to the greatest
value. Individual MEFs should use Figures 4 and 5 to estimate annual bandwidth costs.
9 O&S calculations in the ECCS cost model currently are based on an operational life of 10 years.
Page 13
Presented at the 2007 ISPA/SCEA Joint Annual International Conference and Workshop - www.iceaaonline.com

As expected, the CDF for SECOMP-I bandwidth cost exhibits a much larger mean than
the CDFs for the other two alternatives. SECOMP-I hardware is limited to communication over
INMARSAT M4 or public Internet, and is unable to access lower-cost on-demand Ku band,
which makes up 40% of the air time for DCD-MN and SwiftLink (see Table 8). Despite access
to lower-cost communication pathways, however, predicted annual O&M costs for DCD-MN
and SwiftLink range from roughly $5 M to $20 M per year, producing a coefficient of variation
(CV) of 39.3%.10 This reflects our attempt to accurately model reasonable ranges of values for
mission frequency, mission duration, and rates for each bandwidth service.
Figure 4: CDFs for Bandwidth Cost, Total USMC (One Year)
Mean Cost (one year) - Total USMCCalculated with 10000 iterations
Using LatinHypercube
0%
10%
20%
30%
40%
50%
60%
70%
80%
90%
100%
$5,000 $10,000 $15,000 $20,000 $25,000 $30,000 $35,000 $40,000 $45,000
BY2006 $K
Conf
iden
ce L
evel
(CDF
)
DCD-MN / SwiftLink Correl Mean SECOMP-I Correl Mean (SECOMP-I Correl)
DCD-MN and SwiftLink S-curves are coincident.
10 The CV for the SECOMP-I CDF was very similar at 40.6%.
Page 14
Presented at the 2007 ISPA/SCEA Joint Annual International Conference and Workshop - www.iceaaonline.com

Figure 5: Bandwidth Cost, Total USMC (One Year)
$0
$5,000
$10,000
$15,000
$20,000
$25,000
$30,000
$35,000
$40,000
$45,000BY
200
6 $K
10th %ile $6,234 $6,234 $12,876
50th %ile $12,021 $12,021 $25,397
90th %ile $18,879 $18,879 $40,643
DCD-MN SwiftLink SECOMP-I
VIII. SUMMARY AND CONCLUSIONS
Annual bandwidth costs for the SECOMP-I alternative will approximately double that of
the SwiftLink and DCD-MN alternatives, given identical durations and frequencies for each
mission type. SECOMP-I relies on older satellite technology (i.e., INMARSAT M4) that is
limited to download speeds of 64 kbps per terminal. Achieving greater bandwidth with M4
requires bonding multiple terminals together. With M4 bandwidth costing more than $6.00 per
minute on GSA schedules (see Table 1), this option becomes prohibitively expensive. Although
the remaining alternatives are less costly, the SwiftLink and DCD-MN CDFs for annual
bandwidth cost still encompass a wide range of values. Decision makers should closely examine
the assumptions in this study, i.e., mission duration (Table 7), mission frequency (Table 6), and
bandwidth allocation (Table 8), before choosing an O&M funding level.
Page 15
Presented at the 2007 ISPA/SCEA Joint Annual International Conference and Workshop - www.iceaaonline.com

XI. BIOGRAPHIES
Sam Bresnahan: Cost analyst at Tecolote Research, Inc. Four years of experience developing
life cycle cost estimates for vehicles, communications electronics, information systems, and
sensor systems. SCEA Certified Cost Estimator/Analyst (CCE/A) and Certified Basic ACEIT 7.0
Instructor. Education: 2003 University of Virginia, B.S. – Biochemistry.
Address: Sam Bresnahan Tecolote Research, Inc. 2231 Crystal Drive, Suite 702 Arlington, VA 22202 Tel: (703) 414-3290 Fax: (703) 414-0924 E-mail: [email protected] Ronald Woodaman: Major, USMC, serving as Operations Research Analyst with Marine
Corps Systems Command. Six years experience conducting Marine Corps studies in areas such
as education, ground combat, logistics, IT, and business process reengineering. Education: 2000
Naval Postgraduate School, M.S. with Distinction – Operations Research; 1987 U.S. Naval
Academy, B.S. – Systems Engineering.
Address: Maj Ronald Woodaman Marine Corps Systems Command 2200 Lester St Quantico, VA 22134 Tel: (703) 432-3452 Fax: (703) 414-3538 E-mail: [email protected]
Page 16
Presented at the 2007 ISPA/SCEA Joint Annual International Conference and Workshop - www.iceaaonline.com

XII. REFERENCES
1. Larson, Wiley J. and James R. Wertz, eds. 1992. Space Mission Analysis and Design.
Torrance, Calif.: Microcosm, Inc.
2. Smith, Alfred, Jeff McDowell, Shu-Ping Hu, Lew Fichter, Tecolote Research. “Air Force
Cost Analysis Agency Cost Risk Handbook.” Summer 2007 (expected).
Page 17
Presented at the 2007 ISPA/SCEA Joint Annual International Conference and Workshop - www.iceaaonline.com