Analysis of Airport Data using Hadoop-Hive: A Case...
6
International Journal of Computer Applications (0975 – 8887) National Conference on “Recent Trends in Information Technology” (NCRTIT-2016) 23 Analysis of Airport Data using Hadoop-Hive: A Case Study S. K. Pushpa VTU, Bengaluru Dept. of ISE, BMSIT &M Manjunath T. N. VTU, Bengaluru Dept. of ISE, BMSIT &M Srividhya VTU, Bengaluru Dept. of ISE, BMSIT &M ABSTRACT In the contemporary world, Data analysis is a challenge in the era of varied inters- disciplines though there is a specialization in the respective disciplines. In other words, effective data analytics helps in analyzing the data of any business system. But it is the big data which helps and axialrates the process of analysis of data paving way for a success of any business intelligence system. With the expansion of the industry, the data of the industry also expands. Then, it is increasingly difficult to handle huge amount of data that gets generated no matter what’s the business is like, range of fields from social media to finance, flight data, environment and health. Big Data can be used to assess risk in the insurance industry and to track reactions to products in real time. Big Data is also used to monitor things as diverse as wave movements, flight data, traffic data, financial transactions, health and crime. The challenge of Big Data is how to use it to create something that is value to the user. How can it be gathered, stored, processed and analyzed it to turn the raw data information to support decision making. In this paper Big Data is depicted in a form of case study for Airline data based on hive tools. General Terms Big data, Hive Tools, Data Analytics, Hadoop, Distributed File System Keywords Airline data set, Hive Tools. 1. INTRODUCTION Big Data is not only a Broad term but also a latest approach to analyze a complex and huge amount of data; there is no single accepted definition for Big Data. But many researchers working on Big Data have defined Big Data in different ways. One such approach is that it is characterized by the widely used 4 V’s approach [1]. The first “V” is Volume, from which the Big Data comes from. This is the data which is difficult to handle in conventional data analytics. For example, Volume of data created by the BESCOM (Bengaluru Electricity Supply Company) in the process of the power supply and its consumption for Bangalore city or for the entire Karnataka State generates a huge volume of data. To analyze such data, it is the Big data that comes to aid of data analytics; the second “V” is velocity, the high speed at which the data is created, processed and analyzed; the third “V” is variety which helps to analyze the data like face book data which contains all types of variety, like text messages, attachments, images, photos and so on; the forth “V” is Veracity, that is cleanliness and accuracy of the data with the available huge amount of data which is being used for processing. Researchers working in the structured data face many challenges [1] in analyzing the data. For instance the data created through social media, in blogs, in Facebook posts or Snap chat. These types of data have different structures and formats and are more difficult to store in a traditional business data base. The data in big data comes in all shapes and formats including structured. Working with big data means handling a variety of data formats and structures. Big data can be a data created from sensors which track the movement of objects or changes in the environment such as temperature fluctuations or astronomy data. In the world of the internet of things, where devices are connected and these wearable create huge volume of data. Thus big data approaches are used to manage and analyze this kind of data. Big Data include data from a whole range of fields such as flight data, population data, financial and health data such data brings as to another V, value which has been proposed by a number of researcher [3, 4 and 5] i.e, Veracity. Most of the time social media is analyzed by advertisers and used to promote produces and events but big data has many other uses. It can also been used to assess risk in the insurance industry and to track reaction to products in real time. Big Data is also used to monitor things as diverse as wave movements, flight data, traffic data, financial transactions, health and crime. The challenge of Big Data is how to use it to create something that is value to the user. How to gather it, store it, process it and analyze it to turn the raw data information to support decision making. Hadoop allows to store and process Big Data in a distributed environment across group of computers using simple programming models. It is intended to scale up starting with solitary machines and will be scaled to many machines. In this paper Hive tool is used. The primary goal of Hive [8] is to provide answers about business functions, system performance, and user activity. To meet these needs strongly dumping the data into MYSQL data set, but now since huge amount of data in Terabytes which is injected into Hadoop Distributed File System files and processed by Hive Tool. 2. RELATED WORK As far as data storage model considered by B-trees or distributed hash tables using key-value pair is too limited to handle large data sets. Many projects have attempted to provide solutions for distributed storage at higher-level services over wide area networks, often at Internet scale. This incorporates take a shot at disseminated hash tables that started with ventures, for example, CAN [14], Chord [16], Tapestry [18], and Pastry [15]. These frameworks address worries that don't emerge for Bigtable, for example, profoundly variable data transfer capacity, untrusted members, decentralized control and Byzantine adaptation to internal failure are not Bigtable objectives. Several database developers have created parallel databases that can store huge volumes of information. Oracle’s Real Application Cluster database [13] utilizes shared disks to store information (Bigtable uses GFS) and an appropriated lock director (Bigtable uses Chubby). IBM's DB2 Parallel Edition
Transcript of Analysis of Airport Data using Hadoop-Hive: A Case...

International Journal of Computer Applications (0975 – 8887)
National Conference on “Recent Trends in Information Technology” (NCRTIT-2016)
23
Analysis of Airport Data using Hadoop-Hive: A Case
Study
S. K. Pushpa VTU, Bengaluru
Dept. of ISE, BMSIT &M
Manjunath T. N. VTU, Bengaluru
Dept. of ISE, BMSIT &M
Srividhya VTU, Bengaluru
Dept. of ISE, BMSIT &M
ABSTRACT In the contemporary world, Data analysis is a challenge in the
era of varied inters- disciplines though there is a specialization
in the respective disciplines. In other words, effective data
analytics helps in analyzing the data of any business system.
But it is the big data which helps and axialrates the process of
analysis of data paving way for a success of any business
intelligence system. With the expansion of the industry, the
data of the industry also expands. Then, it is increasingly
difficult to handle huge amount of data that gets generated no
matter what’s the business is like, range of fields from social
media to finance, flight data, environment and health. Big
Data can be used to assess risk in the insurance industry and
to track reactions to products in real time. Big Data is also
used to monitor things as diverse as wave movements, flight
data, traffic data, financial transactions, health and crime. The
challenge of Big Data is how to use it to create something that
is value to the user. How can it be gathered, stored, processed
and analyzed it to turn the raw data information to support
decision making. In this paper Big Data is depicted in a form
of case study for Airline data based on hive tools.
General Terms
Big data, Hive Tools, Data Analytics, Hadoop, Distributed
File System
Keywords
Airline data set, Hive Tools.
1. INTRODUCTION Big Data is not only a Broad term but also a latest approach to
analyze a complex and huge amount of data; there is no single
accepted definition for Big Data. But many researchers
working on Big Data have defined Big Data in different ways.
One such approach is that it is characterized by the widely
used 4 V’s approach [1]. The first “V” is Volume, from which
the Big Data comes from. This is the data which is difficult to
handle in conventional data analytics. For example, Volume
of data created by the BESCOM (Bengaluru Electricity
Supply Company) in the process of the power supply and its
consumption for Bangalore city or for the entire Karnataka
State generates a huge volume of data. To analyze such data,
it is the Big data that comes to aid of data analytics; the
second “V” is velocity, the high speed at which the data is
created, processed and analyzed; the third “V” is variety
which helps to analyze the data like face book data which
contains all types of variety, like text messages, attachments,
images, photos and so on; the forth “V” is Veracity, that is
cleanliness and accuracy of the data with the available huge
amount of data which is being used for processing.
Researchers working in the structured data face many
challenges [1] in analyzing the data. For instance the data
created through social media, in blogs, in Facebook posts or
Snap chat. These types of data have different structures and
formats and are more difficult to store in a traditional business
data base. The data in big data comes in all shapes and
formats including structured. Working with big data means
handling a variety of data formats and structures. Big data can
be a data created from sensors which track the movement of
objects or changes in the environment such as temperature
fluctuations or astronomy data. In the world of the internet of
things, where devices are connected and these wearable create
huge volume of data. Thus big data approaches are used to
manage and analyze this kind of data. Big Data include data
from a whole range of fields such as flight data, population
data, financial and health data such data brings as to another
V, value which has been proposed by a number of researcher
[3, 4 and 5] i.e, Veracity.
Most of the time social media is analyzed by advertisers and
used to promote produces and events but big data has many
other uses. It can also been used to assess risk in the insurance
industry and to track reaction to products in real time. Big
Data is also used to monitor things as diverse as wave
movements, flight data, traffic data, financial transactions,
health and crime. The challenge of Big Data is how to use it to
create something that is value to the user. How to gather it,
store it, process it and analyze it to turn the raw data
information to support decision making.
Hadoop allows to store and process Big Data in a distributed
environment across group of computers using simple
programming models. It is intended to scale up starting with
solitary machines and will be scaled to many machines. In this
paper Hive tool is used. The primary goal of Hive [8] is to
provide answers about business functions, system
performance, and user activity. To meet these needs strongly
dumping the data into MYSQL data set, but now since huge
amount of data in Terabytes which is injected into Hadoop
Distributed File System files and processed by Hive Tool.
2. RELATED WORK As far as data storage model considered by B-trees or
distributed hash tables using key-value pair is too limited to
handle large data sets. Many projects have attempted to
provide solutions for distributed storage at higher-level
services over wide area networks, often at Internet scale. This
incorporates take a shot at disseminated hash tables that
started with ventures, for example, CAN [14], Chord [16],
Tapestry [18], and Pastry [15]. These frameworks address
worries that don't emerge for Bigtable, for example,
profoundly variable data transfer capacity, untrusted
members, decentralized control and Byzantine adaptation to
internal failure are not Bigtable objectives.
Several database developers have created parallel databases
that can store huge volumes of information. Oracle’s Real
Application Cluster database [13] utilizes shared disks to store
information (Bigtable uses GFS) and an appropriated lock
director (Bigtable uses Chubby). IBM's DB2 Parallel Edition

International Journal of Computer Applications (0975 – 8887)
National Conference on “Recent Trends in Information Technology” (NCRTIT-2016)
24
[12] depends on a shared-nothing [17] design like Bigtable.
Each DB2 server is accountable for a subset of the columns in
a table which it stores in a relational database. Both databases
afford a complete relational model with transactions. The
limitation is that it is not scalable for huge amount of data as
data increases to a very larger extent. Hence apache hive
supports for huge amount of data
In this paper Apache Hive is considered for analysing large
datasets stored in Hadoop's HDFS and compatible file systems
such as Amazon S3 filesystem. It provides an SQL-like
language called HiveQL[9] with schema on read and
transparently converts queries to MapReduce, Apache
Tez[10] and Spark jobs. All three execution engines can run
in Hadoop YARN. To accelerate queries, it provides indexes,
including bitmap indexes [11].
3. CHALLENGES IN BIG DATA The uses of Big Data in various fields of knowledge are
immense in the sense its potentiality of micro and macro
levels of analysis of the data. For instance, the tools in Big
Data help the Institutions to study the quantitative and
qualitative learning abilities of students from different strata
of the society. Even the behavioral learning and the
psychological attitudes of the student may also be estimated
through the tools of Big Data. Big Data can also be used in
analyzing the cognitive abilities and the impact of health in
acquiring the knowledge since health condition of the students
usually affects on learning process.
Further, the scope of big data is so vast that it has been used in
globalized urban societies in planning the locality, intelligence
transportation, air ambulance monitoring system, road
mapping, environment and natural disaster prediction.
Big Data is supported by range of technologies such as
Hadoop [4]. Traditional relational data base skill are still in
high demand but increasingly, so are the skills needed to work
with the generation of non-relational data bases known as
NoSQL. These NoSQL data bases which are often open
source are built to handle the processing of large volumes of
data and use different design strategies, architectures and
query languages. One of the biggest challenges in Big Data is
Big Data analytics, where analyze examining and interpret
Big Data.
In this paper first tables were created for the below mentioned
Data Set [6]. The Data set was loaded into the created tables
on an HDFS system. The Hive queries were applied and the
results were analyzed.
4. ANALYSIS OF AIRPORT DATA The proposed method is made by considering following
scenario under consideration
An Airport has huge amount of data related to number of
flights, data and time of arrival and dispatch, flight routes, No.
of airports operating in each country, list of active airlines in
each country. The problem they faced till now it’s, they have
ability to analyze limited data from databases. The Proposed
model intension is to develop a model for the airline data to
provide platform for new analytics based on the following
queries.
The data description is as shown in Table 1 to Table 3
Table 1: Airport Data Set [6]
Attribute Description
Airport ID Unique OpenFlights identifier for this
airport
Name Name of airport. May or may not
contain the City name.
City Main city served by airport. May be
spelled differently from Name.
Country Country or territory where airport is
located.
IATA/FAA 3-letter FAA code, for airports
located in Country "United States of
America"
ICAO 4-letter ICAO code.
Latitude Decimal degrees, usually to six
significant digits. Negative is South,
positive is North.
Longitude Decimal degrees, usually to six
significant digits. Negative is West,
positive is East.
Altitude In feet.
Timezone Hours offset from UTC. Fractional
hours are expressed as decimals, eg.
India is 5.5.
DST Daylight savings time. One of E
(Europe), A (US/Canada), S (South
America), O (Australia), Z (New
Zealand), N (None) or U (Unknown).
See also: Help: Time
Tz database time Timezone in "tz" (Olson) format, eg.
"America/Los_Angeles". zone
Table 2: Airline Data Set [6]
Attribute Description
Airline Unique OpenFlights identifier for this
airline. ID
Name Name of the airline
Alias Alias of the airline. For example, All
Nippon Airways is commonly known
as "ANA".
IATA 2-letter IATA code, if available.
ICAO 3-letter ICAO code, if available
Callsign Airline callsign.
Country Country or territory where airline is
incorporated
Active "Y" if the airline is or has until
recently been operational, "N" if it is
defunct. This field is not reliable: in
particular, major airlines that stopped
flying long ago, but have not had their
IATA code reassigned (eg.
Ansett/AN), will incorrectly show as
"Y".

International Journal of Computer Applications (0975 – 8887)
National Conference on “Recent Trends in Information Technology” (NCRTIT-2016)
25
Table 3: Route Data Set [6]
Attribute Description
Airline 2-letter (IATA) or 3-letter(ICAO)
code of the airline.
Airline ID Unique OpenFlights identifier for
airline
Source airport 3-letter (IATA) or 4-letter (ICAO)
code of the source airport
Source airport ID Unique OpenFlights identifier for
source airport
Destination airport 3-letter (IATA) or 4-letter (ICAO)
code of the destination airport.
Destination airport
ID
Unique OpenFlights identifier for
destination airport.
Codeshare "Y" if this flight is a codeshare (that
is, not operated by Airline, but
another carrier), empty otherwise.
Stops Number of stops on this flight ("0" for
direct)
Equipment 3-letter codes for plane type(s)
generally used on this flight, separated
by spaces
This paper proposes a method to analyze few aspects which
are related to airline data such as
a) list of airports operating in the country India,
b) list of airlines having zero stops
c) list of airlines operating with code share
d) list highest airports in each country
e) list of active airlines in United State
5. METHODOLOGY In this paper the tools used for the proposed method is
Hadoop , Hive and Sqoop which is mainly used for structured
data. Assuming all the Hadoop tools have been installed and
having semi structured information on airport data [7, 8]. The
above mentioned queries have to be addressed
Methodology used is as follows:
1. Create tables with required attributes
2. Extract semi structured data into table using the load
a command
3. Analyze data for the following queries
a) list of airports operating in the country India
b) list of airlines having zero stops
c) list of airlines operating with code share
d) which country has highest airports
e) list of active airlines in United State
Fig 1 Create and Load data set into HDFS

International Journal of Computer Applications (0975 – 8887)
National Conference on “Recent Trends in Information Technology” (NCRTIT-2016)
26
Fig 2 List of airlines operating with code share
Fig 3: List of airlines having zero stops
International Journal of Computer Applications (0975 – 8887)
National Conference on “Recent Trends in Information Technology” (NCRTIT-2016)
27
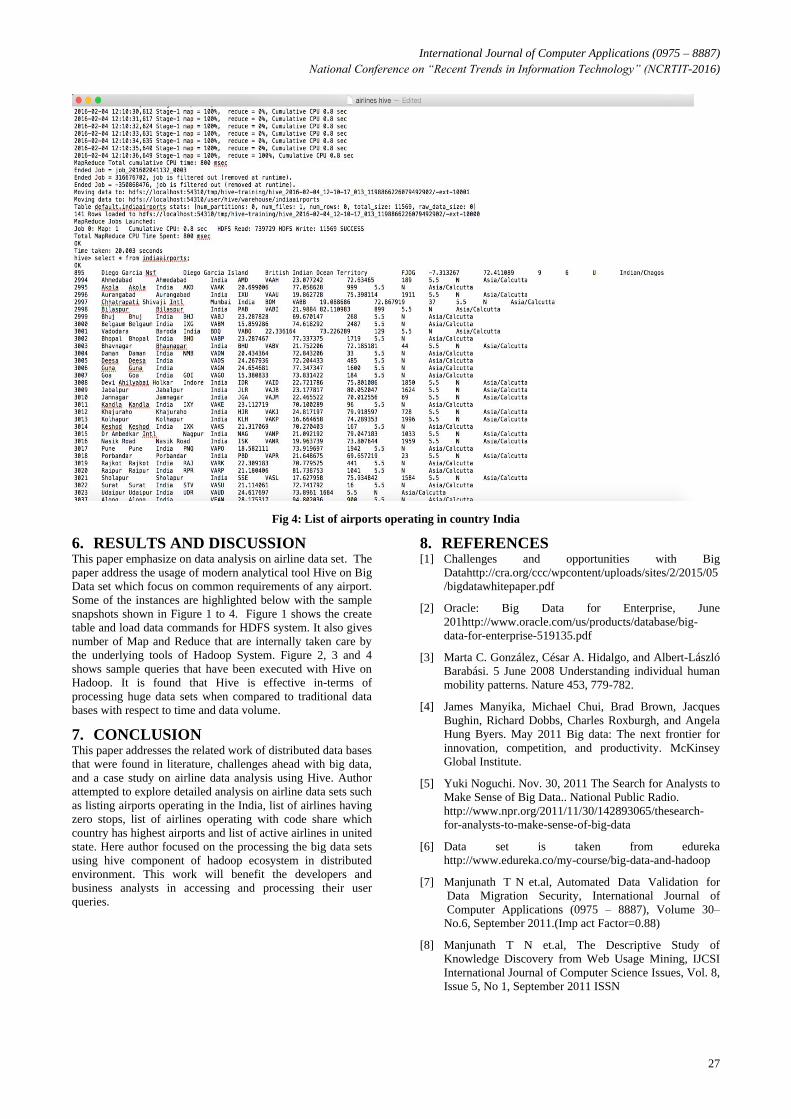
Fig 4: List of airports operating in country India
6. RESULTS AND DISCUSSION This paper emphasize on data analysis on airline data set. The
paper address the usage of modern analytical tool Hive on Big
Data set which focus on common requirements of any airport.
Some of the instances are highlighted below with the sample
snapshots shown in Figure 1 to 4. Figure 1 shows the create
table and load data commands for HDFS system. It also gives
number of Map and Reduce that are internally taken care by
the underlying tools of Hadoop System. Figure 2, 3 and 4
shows sample queries that have been executed with Hive on
Hadoop. It is found that Hive is effective in-terms of
processing huge data sets when compared to traditional data
bases with respect to time and data volume.
7. CONCLUSION This paper addresses the related work of distributed data bases
that were found in literature, challenges ahead with big data,
and a case study on airline data analysis using Hive. Author
attempted to explore detailed analysis on airline data sets such
as listing airports operating in the India, list of airlines having
zero stops, list of airlines operating with code share which
country has highest airports and list of active airlines in united
state. Here author focused on the processing the big data sets
using hive component of hadoop ecosystem in distributed
environment. This work will benefit the developers and
business analysts in accessing and processing their user
queries.
8. REFERENCES [1] Challenges and opportunities with Big
Datahttp://cra.org/ccc/wpcontent/uploads/sites/2/2015/05
/bigdatawhitepaper.pdf
[2] Oracle: Big Data for Enterprise, June
201http://www.oracle.com/us/products/database/big-
data-for-enterprise-519135.pdf
[3] Marta C. González, César A. Hidalgo, and Albert-László
Barabási. 5 June 2008 Understanding individual human
mobility patterns. Nature 453, 779-782.
[4] James Manyika, Michael Chui, Brad Brown, Jacques
Bughin, Richard Dobbs, Charles Roxburgh, and Angela
Hung Byers. May 2011 Big data: The next frontier for
innovation, competition, and productivity. McKinsey
Global Institute.
[5] Yuki Noguchi. Nov. 30, 2011 The Search for Analysts to
Make Sense of Big Data.. National Public Radio.
http://www.npr.org/2011/11/30/142893065/thesearch-
for-analysts-to-make-sense-of-big-data
[6] Data set is taken from edureka
http://www.edureka.co/my-course/big-data-and-hadoop
[7] Manjunath T N et.al, Automated Data Validation for
Data Migration Security, International Journal of
Computer Applications (0975 – 8887), Volume 30–
No.6, September 2011.(Imp act Factor=0.88)
[8] Manjunath T N et.al, The Descriptive Study of
Knowledge Discovery from Web Usage Mining, IJCSI
International Journal of Computer Science Issues, Vol. 8,
Issue 5, No 1, September 2011 ISSN

International Journal of Computer Applications (0975 – 8887)
National Conference on “Recent Trends in Information Technology” (NCRTIT-2016)
28
[9] HiveQL Language Manual
[10] Apache Tez
[11] Working with Students to Improve Indexing in Apache
Hive
[12] Baru C. K., Fecteau G., Goyal A., Hsiao H., Jhingran A.,
Padmanabhan S., Copeland, To appear in OSDI 2006 13
G. P., and Wilson W. G. DB2 parallel edition. IBM
Systems Journal 34, 2 (1995), 292.322.
[13] ORACLE.COM. www.oracle.com/technology/products/-
database/clustering/index.html.
[14] Ratnasamy S., Francis P., Handley M., Karp R., and
Shenker S. A scalable content-addressable network. In
Proc. of SIGCOMM (Aug. 2001), pp. 161. 172.
[15] Rowstron A., and Druschel P. Pastry: Scalable,
distributed object location and routing for largescale
peer-to-peer systems. In Proc. of Middleware 2001 (Nov.
2001), pp. 329.350.
[16] Stoica I., Morris R., Karger D., Kaashoek, M. F., and
Balakrishnan H. Chord: A scalable peer-to-peer lookup
service for Internet applications. In Proc. of SIGCOMM
(Aug. 2001), pp. 149.160.
[17] Stonebraker M. The case for shared nothing. Database
Engineering Bulletin 9, 1 (Mar. 1986), 4.9.
[18] Zhao B. Y., Kubiatowicz J., and Joseph A. D. Tapestry:
An infrastructure for fault-tolerant wide-area location
and routing. Tech. Rep. UCB/CSD-01-1141, CS
Division, UC Berkeley, Apr. 2001.
IJCATM : www.ijcaonline.org