Analysis of Advanced Thermoelectric Materials and Their ... · Analysis of Advanced Thermoelectric...
35
Analysis of Advanced Thermoelectric Materials and Their Functional Limits Hyun Jung Kim ([email protected]) Senior Research Scientist National Institute of Aerospace March 09, 2015 https://ntrs.nasa.gov/search.jsp?R=20160006914 2020-04-01T02:02:13+00:00Z
Transcript of Analysis of Advanced Thermoelectric Materials and Their ... · Analysis of Advanced Thermoelectric...

Analysis of Advanced Thermoelectric Materials and Their Functional Limits
Hyun Jung Kim([email protected])
Senior Research ScientistNational Institute of Aerospace
March 09, 2015
https://ntrs.nasa.gov/search.jsp?R=20160006914 2020-04-01T02:02:13+00:00Z

Presentation Goal & Outline
- Help audience to establish a strong foundation in fundamental concepts of Thermoelectric
- Share NIA / NASA Langley Research Center TE research
Thermoelectric
Current trends in the physics of TE materials
Measuring TE transport properties
Summary
Strategy

National Institute of Aerospace
• An Independent Non-profit Research and Graduate Education Institute formed in 2002 by a Consortium of Research Universities and the AIAA Foundation
• Conceived by NASA Langley Research Center and established to serve as LaRC’s Collaborative Partner
• Conducts Collaborative Research in Engineering and Science relevant to Aerospace
• Offers Full- and Part-time Resident Graduate Education in Engineering and the Sciences from Member Universities
• Leads and Participates in a wide range of Outreach Programs to enhance the nation’s Science and Technology Workforce

Structures, Materials, Measurement SciencesAerodynamics, Hypersonics, AcousticsFlight Dynamics, Aviation Safety and Aerospace OperationsPlanetary Exploration, Atmospheric Science, and Global Environmental Change
All images credit: NASA

Energy and Thermoelectric(Potential of TE)
U.S. Energy Consumption ~ 102 Quads (2007)“Waste Heat” Can Be Utilized Using Thermoelectrics
Source: LLNL 2008, data from DOE/EIA -0384 (2006)

Thermoelectrics (TE) and background physics
Thermoelectric materials are a group of electronic materials which can interconnect gradients in electrical potential and temperature.
Physics of TEs are governed by three thermodynamics effects
Seebeck effect (1822 )Heat → electric current
Peltier effect (1834)Current → cooling Thomson effect (1850s)
All effects are related to heat being transported by the charge carriers.
V = ɑ∆TV = Voltage
ɑ = Seebeck coefficient∆T = Temperature difference
Released or absorbed internally in a material if the Seebeck
coefficient depends on temperature, balancing for the
flowing Peltier heat.Peltier coefficient is the energy
carried by each electron per unit charge & time

Historic development of TE materials based on applications
• RTG power system for deep space exploration
• VW and BMW announced TE on exhaust in 2008: 24 Bi2Te3 modulus: 600W under motorway driving →
30% of car’s electrical requirement: 5% reduction in fuel consumption through
removing alternator
• Hybrid low cost power sources - Advanced TE system in tandem mode
for high gain of cascade efficiency- Solar thermal applications(Photovoltaic + TE)
Shakouri and Zhang, IEEE trans. 28, 65 (2003); Sang H. Choi, SPIE Newsroom. DOI: 10.1117/2.1200604.0234 (2006)
Heat source (PuO2)Thermoelectric
modules
Concentrated solar energy
Bi2Te3layer
PbTe
SiGe
Output power

Why use Thermoelectrics?

Efficiency of the TE materials and conversion efficiency
• Efficiency determined by Dimensionless figure of merit
S = seebeck coefficientσ = electrical conductivityκ = thermal conductivityε = efficiency of a TE device for electricity generation
TSTZ
2
H
CH
CH
TTZT
ZTT
TT
1
11
= Carnot X Joule losses and irreversible processes

ZT versus Temperature range
Different material harvest optimally at different temperature ranges
▪ Bulk n-Bi2Te3 and p-Sb2Te3 used in most commercial Peltier coolers
▪ Bulk Si1-xGex (x~0.2 to 0.3) used for high temperature satellite applications
G. J. Snyder et al., Nature Mat., 7, 105, 2008

TE properties of conventional materials
L: Lorentz constant, κe and κph correspond to carrier and phonon contribution to thermal conductivity, respectively. m*: carrier effective mass
Conflicting Materials Requirements
S (Seebeck coefficient)Need small n, large m*▪ Semiconductor (valence compound)
σ (Electrical conductivity)Need large n, high μ, low m*▪ Metal
k (Thermal conductivity)Desire small kph, small n
22 2* 3
2
8 ( )3 3
BkS m Teh n
ne
phk k LTne (n, )

TE properties of conventional materials (Cont.)
)/(
222
TLSTSTSZTphphe
G. J. Snyder et al., Nature Mat., 7, 105, 2008
For most bulk materials…
To increase ZT, we want
butS , ,
SS
,
▪ Empirical law from experimental observation that
▪ For low carrier densities in semiconductors, ke << k ph
▪ For high carrier densities in semiconductors, ke>>k ph
▪ Good TE materials should ideally have ke<<kph
constant for metalskT

Current trends in the physics of TE materials(Main strategies for optimizing ZT)
22 2* 3
2
2
2
8 ( )3 3
ln( )[ ]3
1[ ]E3
1( )
B
BB F
gBB F
g
i f
kS m Teh n
k dk T Ee dE
dVk dGk Te G dV dE
ES EeT
ne
2
e ph
SZT T
“Electron Crystal (crystalline semiconductor) – Phonon Glass (insulator)”
► Low-dimensional structures:▪ Quantum confinement effect▪ Increase S through enhanced DOS▪ Make S and σ almost independent
► Energy filtering
Y. I. Ravich et al., Phys.Stat. Sol (b), 43, 453, 1971

Main strategies for optimizing ZT (cont.)
Jean-Pierre Fleurial, Indo-US Workshop on Emerging Trends in Energy Technology, New Delhi, India, March 11-16, 2007
2
e ph
SZT T
“Electron Crystal (crystalline semiconductor) – Phonon Glass (insulator)”
► Reducing thermal conductivity faster than electrical conductivity▪ Skutterudite structure: filling voids with heavy atoms
► Low-dimensional structures:▪ Reduce k through numerous interfaces to increase phonon scattering
► In metals, the thermal conductivity is dominated by ke▪ Exceptions
some pure metals at low temperaturescertain alloys where small ke results in significant kph contributioncertain low dimensional structures where kph can dominant
phk k LTne

NIA / NASA Results

1st Approach:SiGe twin crystal for high temperature application σ, k
Highly Twinned SiGe Layer 85% Single-Crystalline SiGe Layer
{220} pole-figures of [111]-oriented SiGe on trigonal substrate
Phonon-scattering for Thermoelectric Material Application
High-Mobility Semiconductor Device Application
Material Design
Thermal conductivity Electrical conductivity
Hyun Jung Kim et al., Recent Patents on Space Technology, Vol. 3, No. 1, 2013

A313A316
http://www.its.caltech.edu/~jsnyder/thermoelectrics/index.htm
A312
A318
X-ray diffraction measurement on two-samples-(1) grown at 820°C and (2) 850°C.
Figure of merit results
2
3
4
SiGe – TE performance at 300K and 1000K

S2nd Approach:SiGe twin crystal for high temperature application
Stacking Fault
[111]
Low energy electron
High energy electron
Hyun Jung Kim et al., RSC Advances, C2RA21567E, 2012

Scanned Seebeck coefficient results

e-
e-
e-
e-
Nano-crystals:
Ag2TeBi2Te3
Metal nanoparticle:
-Ag or Au (Phonon Mean Free Path
control)
:
KphBi2Te3 and Ag2Te nano-bridge for intermediate / low temperature application
(a)
0.5 wt% Ag / BiTe
Hyun Jung Kim et al., Recent Patents on Space Technology, Vol. 3, No. 1, 2013

Bi2Te3, no Au particles
Bi2Te3, 0.001 wt% Au particles
Bi2Te3, 0.05 wt% Au particles
Bi2Te3, 0.05 wt% Au particles
Bi2Te3, 0.05 wt% Au particles
Higher than reported!!!
Test results and comparison of Bi2Te3
Zhao et al., Appl. Phys. Lett. 86, (2005)

Thermal Drier Drum
p-type TEprinting
n-type TEprinting
Thermal Drier Drum
TE Array on Film
TE Inks for roll-to-roll processMass production
InexpensiveSolar-tandem mode
Hyun Jung Kim et al., Proc. SPIE 8691, 2013
By auspice of Dr. Varadan

Measuring TE transport properties of materials
“In order to direct material development, high precision measurement of ZT as well as good estimates of error is necessary”
Consideration▪ No standard reference material (Round-Robin project)▪ Density of samples (>97% density)▪ Sample homogeneity (scanning system)▪ Geometry factor and coating
Parameter S σ k ZT• Scatter(maximum spread in data / the average)
5% (at 300K)
10% (at 500K)
15% (specific heat)5% (density)
7% (Thermal diffusivity, at 300K)
12% (at 300K)21% (at 475K)
Note(comparing the data
on the same material measured
at several labs)
Geometry error
Twice that in Seebeck coefficient
Above 475K, higher variation can be
expected
Kasper A. Borup et al., Energy Environ. Sci., DOI: 10.1039/c4ee01320d, 2014

Seebeck coefficient
▪ S>0 for p-type, S<0 for n-type
12 TTVS
PRINCIPLES-12
-10
-8
-6
-4
-2
0
delta
V (V
)
35302520151050delta T (K)
38% 600C
y = -0.2248x + 0.0415
S
(K)
(mV)
data
▪ Measure T1, T2, and ∆V
▪ Difficulty and Solution: differences in thermocouple wires, reactive samples, cold finger effect

Thermal conductivity
2
Thermal diffusivity,2 ln
Thermal conductivity,densityspecific heat
LMtN
k C
C
Angstroms method
Difficulty: The difficulty in accurately correcting for radiation loss limits the accuracy at higher temperature.
Solution: ▪ The sample needs to be in good thermal contact with the heater, heat sink, and thermocouples while being thermally insulated from the surroundings▪ Apply the radiation correction (heat loss) factor (Cowan, Cape and Lehman, etc. for laser flash method)

Electrical conductivity
II
V
x x x
Linear 4-point methodDifficulty: ▪ Geometry error▪ Inaccurate temperature
determination-poor temperature determination-poor thermal contact between the sample and the thermocouples-cold or hot finger effect-varying voltage offset (vacuum, feedthrough, connections)
Solutions:▪ Using an insulation shield to reduce the radiation loss from sample surface▪ direct attaching the thermocouples to the sample
NIA / NASA Results

(a)
(c) (d)
(b)
The correction factor
ycor = -3.945E – 9·x3 + 1.1039E-5·x2 + 0.00428·x – 0.5843
TE Characterization system
Hyun Jung Kim et al., RSC Advances, C2RA21567E, 2012

▪ Motorized XYZ probe head▪ Max scan area: 25 x 25 mm▪ Min interval: 0.05μm▪ LabVIEW interface- Keithley 740 Scanning voltage meter & DC servo
motors
TC1
TC2
• Linear bearing• Soft spring
Shiho Iwanaga and G. Jeffrey Snyder, ICT 2011
The scanning Seebeck coefficient measurement system
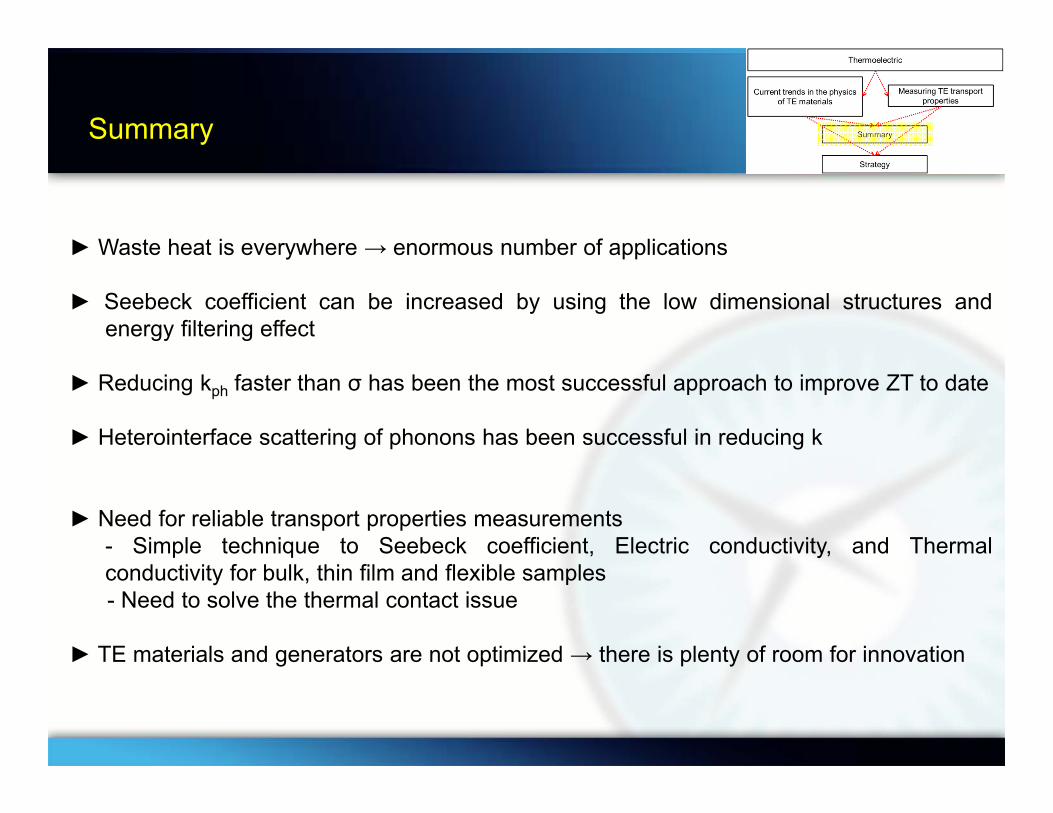
Summary
► Waste heat is everywhere → enormous number of applications
► Seebeck coefficient can be increased by using the low dimensional structures andenergy filtering effect
► Reducing kph faster than σ has been the most successful approach to improve ZT to date
► Heterointerface scattering of phonons has been successful in reducing k
► Need for reliable transport properties measurements- Simple technique to Seebeck coefficient, Electric conductivity, and Thermalconductivity for bulk, thin film and flexible samples- Need to solve the thermal contact issue
► TE materials and generators are not optimized → there is plenty of room for innovation

Strategy 1. (Data driven materials science)
Krishna Rajan, “Data Mining and Materials Informatics: a primer”, TMS / ASM Materials Informatics Workshop, 2006

Strategy 2.(Heat control for maximum output power)
D. M. Rowe (Ed.), Thermoelectric Handbook: Macro to Nano, CRC Taylor and Francis, 2006
A = module leg area
L = module leg length
N = number of modules
▪ F = fabrication factor = perfect system – Rcontact – Rseries – Lost heat
▪ Practical system: both electrical and thermal impedance matching is required
2 2max
1 AP FN T σ2 L
S

Strategy 3.(New thermal conductivity measurement system)
• Fabricate the thermal conductivity based measurement /management system with a novel nanotube based phonon waveguide
Signal
Phonon counting
Signal
Signal
Measurement junction
Reference junction
Voltage signal
transducer
Signal
• Thermal measurement/management systems are currently very slow and relatively inefficient, particularly when compared to advances in photon (light) transport and photon based measurement system
• Additionally inefficiencies in conversion to and from thermal to electrical, optical or other signals in most thermal measurement/management systems lead to further degraded performance.
• At each of the initial signal conversion steps, measurement accuracy and speed is being lost, while the later processing steps each tends to end to the amount of energy consumed in the process.

Strategy 4.(Niche applications abound!)
Sun Jin Kim et al., Energy & Environmental Science, 7, 1959, 2014

Acknowledgements
NASA Langley Research Center: C&I, FHWA DOTFunded by
Shiho Iwanaga
Doug Stanley Bo Walkley Karl Drews
Sang H. Choi Cheol Park Keith Gordon Robert Bryant
Godfrey Sauti
Kunik Lee Vijay Varadan Jungmin Lee
Yeonjoon Park
Catharine Fay
NIA
NASA
Caltech DOT/FHWA
University of
Arkansas