ANALYSIS OF A HIGH-PRESSURE MULTISTAGE AXIAL COMPRESSOR … · 3.5 stages axial compressor,...
13
Paper ID: ETC2017-125 Proceedings of 12th European Conference on Turbomachinery Fluid dynamics & Thermodynamics ETC12, April 3-7, 2017; Stockholm, Sweden ANALYSIS OF A HIGH-PRESSURE MULTISTAGE AXIAL COMPRESSOR AT OFF-DESIGN CONDITIONS WITH COARSE LARGE EDDY SIMULATIONS J. de Laborderie - F. Duchaine - L. Gicquel CFD Team - CERFACS 42 avenue G. Coriolis 31057 Toulouse, FRANCE [email protected] ABSTRACT This paper aims at evaluating Large Eddy Simulations (LES) for the prediction of the performance line and flow at off-design conditions in a multistage high-pressure compres- sor. A coarse and an intermediate grid are specifically investigated, since their associated computational cost appears affordable in an industrial context. Several operating condi- tions of the 3.5 stages high-pressure compressor CREATE are simulated, then results are compared to experimental data and to an existing URANS simulation. Both grids yield iso-speed performance lines close to experimental measurements, but only the intermedi- ate one is able to correctly predict the experimental point at lowest mass flow rate. The unstable regime is specifically investigated in the last stage of the intermediate grid, show- ing the presence of rotating instabilities. Their amount and spinning velocity are similar to experimental observations and previous URANS results. Hence coarse LES appears as an interesting tradeoff for off-design predictions of flow in a multistage compressor. KEYWORDS LES, AXIAL COMPRESSOR, OFF-DESIGN NOMENCLATURE f frequency h/H duct height m circumferential mode N R number of rotor blades N S number of stator vanes P t total pressure Ω rotational velocity Π total pressure ratio INTRODUCTION In the design process of a multistage compressor, an accurate prediction of performances and flow field is critical at off-design conditions and low mass flow rate. Indeed, this directly drives the expected surge margin thereby greatly influencing the compressor efficiency and operating range. At low mass flow rate, a compressor enters an unstable regime that has been under investigation over several decades to improve general understanding of its inception and OPEN ACCESS Downloaded from www.euroturbo.eu 1 Copyright c by the Authors
Transcript of ANALYSIS OF A HIGH-PRESSURE MULTISTAGE AXIAL COMPRESSOR … · 3.5 stages axial compressor,...
Paper ID: ETC2017-125 Proceedings of 12th European Conference on Turbomachinery Fluid dynamics & ThermodynamicsETC12, April 3-7, 2017; Stockholm, Sweden
ANALYSIS OF A HIGH-PRESSURE MULTISTAGE AXIALCOMPRESSOR AT OFF-DESIGN CONDITIONS WITH
COARSE LARGE EDDY SIMULATIONS
J. de Laborderie - F. Duchaine - L. Gicquel
CFD Team - CERFACS42 avenue G. Coriolis
31057 Toulouse, [email protected]
ABSTRACTThis paper aims at evaluating Large Eddy Simulations (LES) for the prediction of theperformance line and flow at off-design conditions in a multistage high-pressure compres-sor. A coarse and an intermediate grid are specifically investigated, since their associatedcomputational cost appears affordable in an industrial context. Several operating condi-tions of the 3.5 stages high-pressure compressor CREATE are simulated, then results arecompared to experimental data and to an existing URANS simulation. Both grids yieldiso-speed performance lines close to experimental measurements, but only the intermedi-ate one is able to correctly predict the experimental point at lowest mass flow rate. Theunstable regime is specifically investigated in the last stage of the intermediate grid, show-ing the presence of rotating instabilities. Their amount and spinning velocity are similarto experimental observations and previous URANS results. Hence coarse LES appears asan interesting tradeoff for off-design predictions of flow in a multistage compressor.
KEYWORDSLES, AXIAL COMPRESSOR, OFF-DESIGN
NOMENCLATUREf frequencyh/H duct heightm circumferential modeNR number of rotor bladesNS number of stator vanesPt total pressureΩ rotational velocityΠ total pressure ratio
INTRODUCTIONIn the design process of a multistage compressor, an accurate prediction of performances
and flow field is critical at off-design conditions and low mass flow rate. Indeed, this directlydrives the expected surge margin thereby greatly influencing the compressor efficiency andoperating range. At low mass flow rate, a compressor enters an unstable regime that has beenunder investigation over several decades to improve general understanding of its inception and
OPEN ACCESSDownloaded from www.euroturbo.eu
1 Copyright c© by the Authors
development (Day, 2016). Depending upon the configuration, this regime may lead to local orglobal modifications of the flow, referred as stall, and ultimately to surge, characterized by massflow reversal. Numerical predictions of stall and surge in compressors are challenging since thesystem is unstable by nature, and the flow is expected to be more complex than at nominalconditions. Nevertheless CFD is definitely a way to bring further understanding and control ofthis unstable regime (Day, 2016).
Among the existing studies, the 3.5 stages axial high-pressure compressor CREATE has re-cently been the object of test campaigns to characterize its behavior at off-design conditions.Courtiade and Ottavy (2013) observed appearance of 18 instabilities rotating at 57% of shaftspeed, that transform into stall cells and finally lead to surge. Crevel et al. (2014) performednumerical studies of CREATE at off-design conditions, using a URANS approach on two con-figurations, one being the compressor alone and the other one being the compressor embeddedin its test rig. In the first case, 24 rotating instabilities at 79.2% of the shaft speed were noticed.In the second case, only 16 rotating instabilities at 80.6% of the shaft speed were captured. Itwas also shown that the plenums located upstream and downstream the compressor need to beaccounted for to simulate a full surge cycle. Recently, on a different version of CREATE, theURANS simulation of Schreiber et al. (2016) showed 32 rotating instabilities at 72% of shaftspeed at a low mass flow rate operating point. All these simulations were performed over anazimuthal sector of the compressor, hence enforcing the amount of instabilities to be a multipleof the circumferential periodicity.
It is commonly admitted by the turbulent modeling community as well as in CFD devel-opments that Large Eddy Simulation (LES) has the potential to become the numerical flowsimulation method that can provide breakthroughs in the design and understanding of futureaeroengine components (Tucker, 2011). If this has already been shown for some parts of theengine at given operating conditions, the computational cost of LES still prevents to fully com-pute a compressor performance map. Recently, LES of the full CREATE compressor has beenperformed at nominal operating conditions (de Laborderie et al., 2016), using a wall law ap-proach. Among the three grids used, the most refined one contains more than one billion cells.Results in terms of global performances and averaged radial profiles were promising with re-spect to experimental data. In an attempt to further evaluate LES of compressors, the objectivesconsist here to assess LES as a tool to obtain a compressor performance map based on theaforementioned preliminary computations, and to analyze the flow at low mass flow rates.
The present paper is structured as follows. The experimental facility is briefly introduced,then the numerical method and its application to the multistage compressor CREATE are de-scribed. Results are then analyzed in terms of global aerodynamic performances and flow fields.Finally, an analysis of instabilities expected to occur at off-design conditions in this machine isperformed to evaluate the capability of LES.
EXPERIMENTAL FACILITYThe multistage research compressor CREATE (Compresseur de Recherche pour l’Etude des
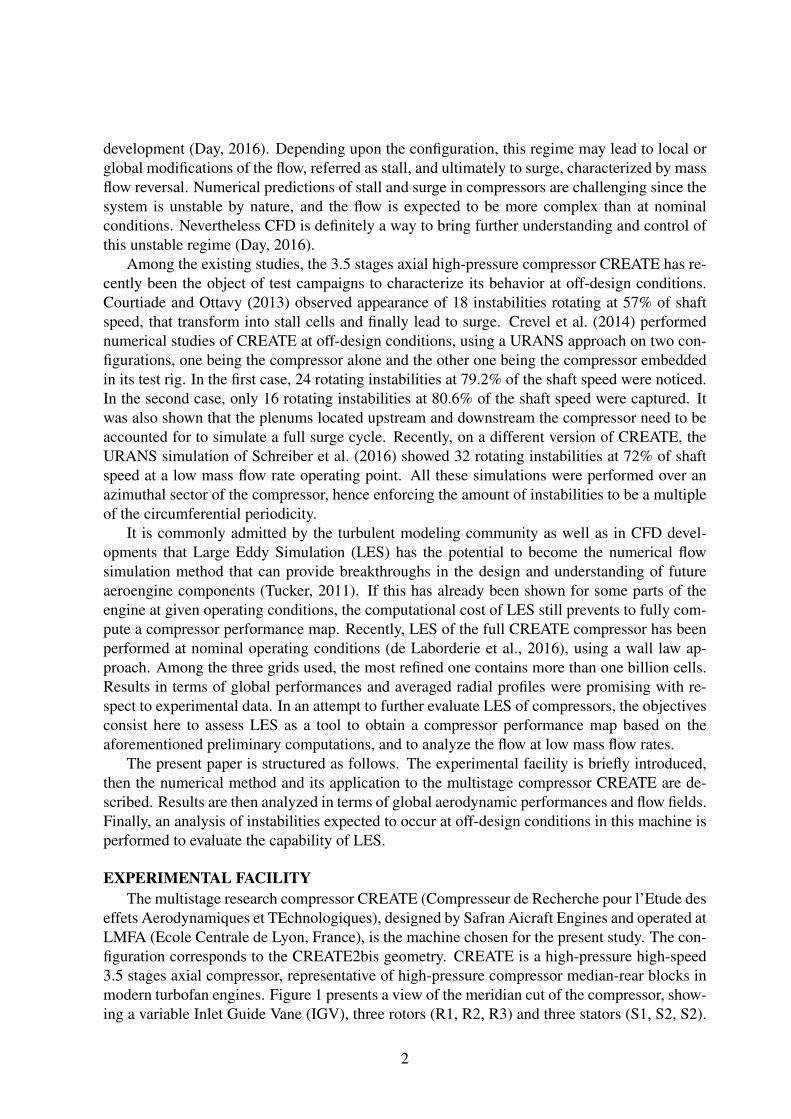
effets Aerodynamiques et TEchnologiques), designed by Safran Aicraft Engines and operated atLMFA (Ecole Centrale de Lyon, France), is the machine chosen for the present study. The con-figuration corresponds to the CREATE2bis geometry. CREATE is a high-pressure high-speed3.5 stages axial compressor, representative of high-pressure compressor median-rear blocks inmodern turbofan engines. Figure 1 presents a view of the meridian cut of the compressor, show-ing a variable Inlet Guide Vane (IGV), three rotors (R1, R2, R3) and three stators (S1, S2, S2).
2
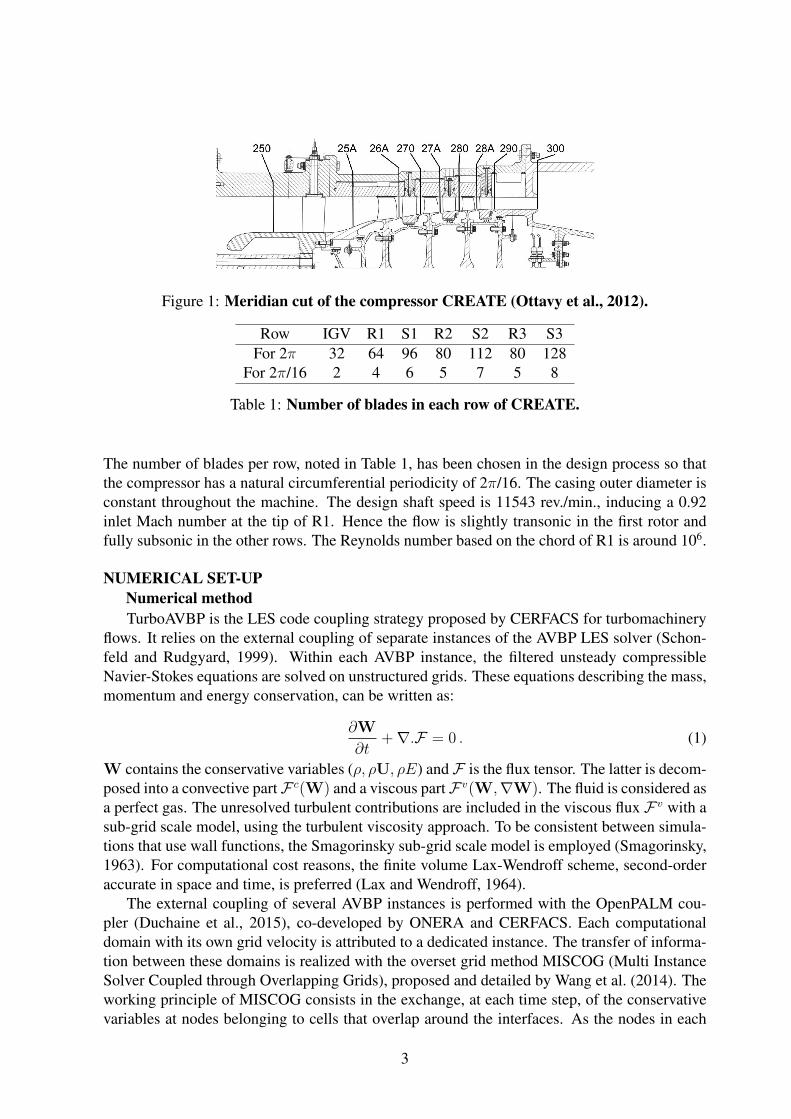
Figure 1: Meridian cut of the compressor CREATE (Ottavy et al., 2012).
Row IGV R1 S1 R2 S2 R3 S3For 2π 32 64 96 80 112 80 128
For 2π/16 2 4 6 5 7 5 8
Table 1: Number of blades in each row of CREATE.
The number of blades per row, noted in Table 1, has been chosen in the design process so thatthe compressor has a natural circumferential periodicity of 2π/16. The casing outer diameter isconstant throughout the machine. The design shaft speed is 11543 rev./min., inducing a 0.92inlet Mach number at the tip of R1. Hence the flow is slightly transonic in the first rotor andfully subsonic in the other rows. The Reynolds number based on the chord of R1 is around 106.
NUMERICAL SET-UPNumerical methodTurboAVBP is the LES code coupling strategy proposed by CERFACS for turbomachinery
flows. It relies on the external coupling of separate instances of the AVBP LES solver (Schon-feld and Rudgyard, 1999). Within each AVBP instance, the filtered unsteady compressibleNavier-Stokes equations are solved on unstructured grids. These equations describing the mass,momentum and energy conservation, can be written as:
∂W
∂t+∇.F = 0 . (1)
W contains the conservative variables (ρ, ρU, ρE) andF is the flux tensor. The latter is decom-posed into a convective partF c(W) and a viscous partFv(W,∇W). The fluid is considered asa perfect gas. The unresolved turbulent contributions are included in the viscous flux Fv with asub-grid scale model, using the turbulent viscosity approach. To be consistent between simula-tions that use wall functions, the Smagorinsky sub-grid scale model is employed (Smagorinsky,1963). For computational cost reasons, the finite volume Lax-Wendroff scheme, second-orderaccurate in space and time, is preferred (Lax and Wendroff, 1964).
The external coupling of several AVBP instances is performed with the OpenPALM cou-pler (Duchaine et al., 2015), co-developed by ONERA and CERFACS. Each computationaldomain with its own grid velocity is attributed to a dedicated instance. The transfer of informa-tion between these domains is realized with the overset grid method MISCOG (Multi InstanceSolver Coupled through Overlapping Grids), proposed and detailed by Wang et al. (2014). Theworking principle of MISCOG consists in the exchange, at each time step, of the conservativevariables at nodes belonging to cells that overlap around the interfaces. As the nodes in each
3
domain are not coincident at every time step, an interpolation of the conservative variables iscarried out. MISCOG was originally developed with a spatially second order accurate inter-polation and has recently been extended with a third order accurate interpolation, based on theHermite polynomial technique. This overset grid approach is not fully conservative (Wang etal., 2014). However, for the CREATE simulations presented in this paper, the relative massand energy errors across each interface are less than 0.1% and 0.2% respectively. In movingdomains, the mesh movement is performed with the ALE method (Moureau et al., 2005) andthe equations are solved in the absolute reference frame.
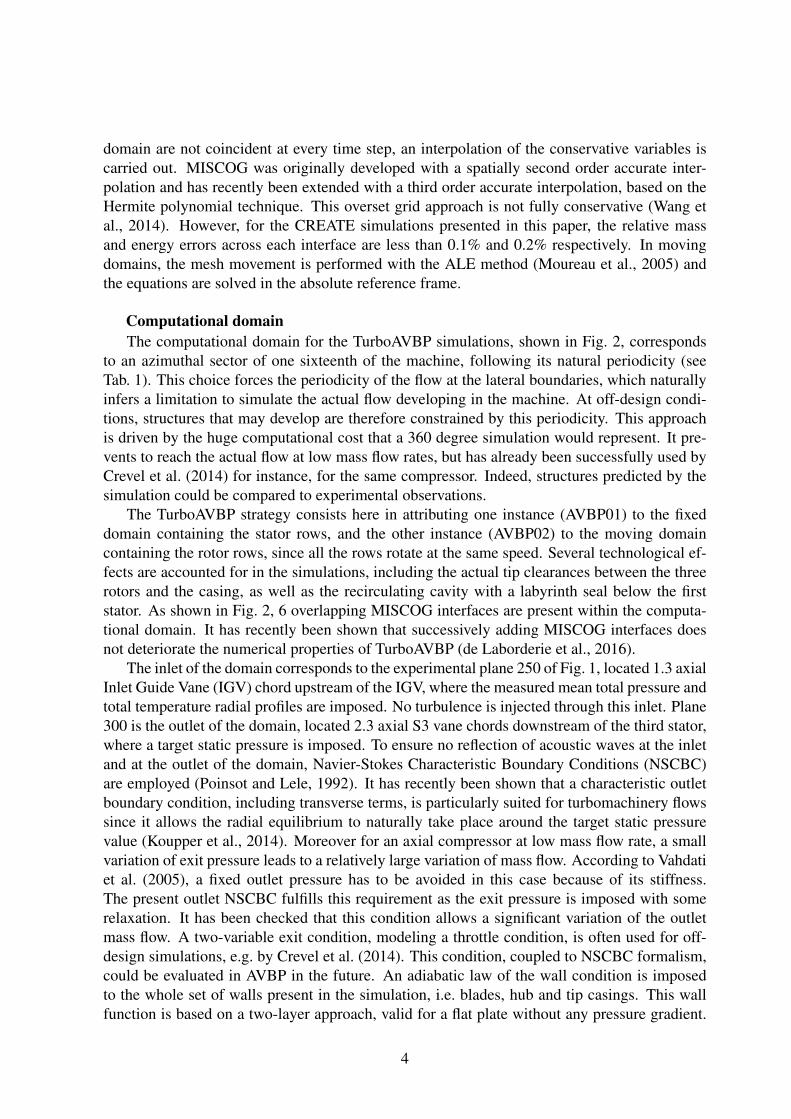
Computational domainThe computational domain for the TurboAVBP simulations, shown in Fig. 2, corresponds
to an azimuthal sector of one sixteenth of the machine, following its natural periodicity (seeTab. 1). This choice forces the periodicity of the flow at the lateral boundaries, which naturallyinfers a limitation to simulate the actual flow developing in the machine. At off-design condi-tions, structures that may develop are therefore constrained by this periodicity. This approachis driven by the huge computational cost that a 360 degree simulation would represent. It pre-vents to reach the actual flow at low mass flow rates, but has already been successfully used byCrevel et al. (2014) for instance, for the same compressor. Indeed, structures predicted by thesimulation could be compared to experimental observations.
The TurboAVBP strategy consists here in attributing one instance (AVBP01) to the fixeddomain containing the stator rows, and the other instance (AVBP02) to the moving domaincontaining the rotor rows, since all the rows rotate at the same speed. Several technological ef-fects are accounted for in the simulations, including the actual tip clearances between the threerotors and the casing, as well as the recirculating cavity with a labyrinth seal below the firststator. As shown in Fig. 2, 6 overlapping MISCOG interfaces are present within the computa-tional domain. It has recently been shown that successively adding MISCOG interfaces doesnot deteriorate the numerical properties of TurboAVBP (de Laborderie et al., 2016).
The inlet of the domain corresponds to the experimental plane 250 of Fig. 1, located 1.3 axialInlet Guide Vane (IGV) chord upstream of the IGV, where the measured mean total pressure andtotal temperature radial profiles are imposed. No turbulence is injected through this inlet. Plane300 is the outlet of the domain, located 2.3 axial S3 vane chords downstream of the third stator,where a target static pressure is imposed. To ensure no reflection of acoustic waves at the inletand at the outlet of the domain, Navier-Stokes Characteristic Boundary Conditions (NSCBC)are employed (Poinsot and Lele, 1992). It has recently been shown that a characteristic outletboundary condition, including transverse terms, is particularly suited for turbomachinery flowssince it allows the radial equilibrium to naturally take place around the target static pressurevalue (Koupper et al., 2014). Moreover for an axial compressor at low mass flow rate, a smallvariation of exit pressure leads to a relatively large variation of mass flow. According to Vahdatiet al. (2005), a fixed outlet pressure has to be avoided in this case because of its stiffness.The present outlet NSCBC fulfills this requirement as the exit pressure is imposed with somerelaxation. It has been checked that this condition allows a significant variation of the outletmass flow. A two-variable exit condition, modeling a throttle condition, is often used for off-design simulations, e.g. by Crevel et al. (2014). This condition, coupled to NSCBC formalism,could be evaluated in AVBP in the future. An adiabatic law of the wall condition is imposedto the whole set of walls present in the simulation, i.e. blades, hub and tip casings. This wallfunction is based on a two-layer approach, valid for a flat plate without any pressure gradient.
4
AVBP01
R1
S1
R2S2
R3S3
IGV AVBP02
Figure 2: Computational domain for TurboAVBP.
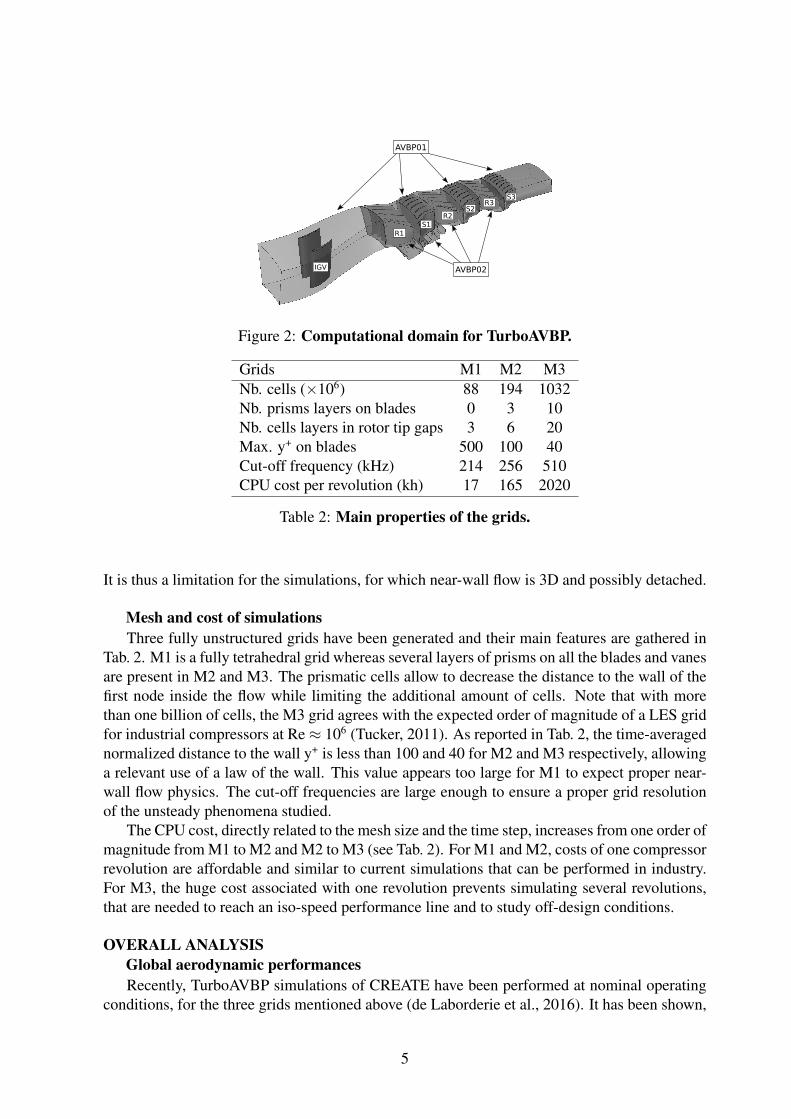
Grids M1 M2 M3Nb. cells (×106) 88 194 1032Nb. prisms layers on blades 0 3 10Nb. cells layers in rotor tip gaps 3 6 20Max. y+ on blades 500 100 40Cut-off frequency (kHz) 214 256 510CPU cost per revolution (kh) 17 165 2020
Table 2: Main properties of the grids.
It is thus a limitation for the simulations, for which near-wall flow is 3D and possibly detached.
Mesh and cost of simulationsThree fully unstructured grids have been generated and their main features are gathered in
Tab. 2. M1 is a fully tetrahedral grid whereas several layers of prisms on all the blades and vanesare present in M2 and M3. The prismatic cells allow to decrease the distance to the wall of thefirst node inside the flow while limiting the additional amount of cells. Note that with morethan one billion of cells, the M3 grid agrees with the expected order of magnitude of a LES gridfor industrial compressors at Re≈ 106 (Tucker, 2011). As reported in Tab. 2, the time-averagednormalized distance to the wall y+ is less than 100 and 40 for M2 and M3 respectively, allowinga relevant use of a law of the wall. This value appears too large for M1 to expect proper near-wall flow physics. The cut-off frequencies are large enough to ensure a proper grid resolutionof the unsteady phenomena studied.
The CPU cost, directly related to the mesh size and the time step, increases from one order ofmagnitude from M1 to M2 and M2 to M3 (see Tab. 2). For M1 and M2, costs of one compressorrevolution are affordable and similar to current simulations that can be performed in industry.For M3, the huge cost associated with one revolution prevents simulating several revolutions,that are needed to reach an iso-speed performance line and to study off-design conditions.
OVERALL ANALYSISGlobal aerodynamic performancesRecently, TurboAVBP simulations of CREATE have been performed at nominal operating
conditions, for the three grids mentioned above (de Laborderie et al., 2016). It has been shown,
5
using available experimental data, that global performances were correctly predicted for eachgrid, as well as radial profiles of total pressure and temperature at each inter-row section (seeFig. 1). It has been noticed though that only the most refined grid (M3) gives an accurateprediction close to the casing, where successive interactions of wakes and tip clearances flowsare responsible for complex flow physics.
Going beyond the study at nominal conditions, the present objective consists first in theevaluation of the capability of LES to predict the performance map of a multistage compressor.This implies the simulation of several operating conditions for each grid. It has already beennoticed that for a given operating point, two wheel revolutions are needed to stabilize the massflow, and only then can statistics be recorded during two further wheel revolutions. The chosenconvergence criterion relies on the variation of averaged mass flow, found to be less than 0.1%between these last two revolutions. Due to the computational cost of one revolution for M3 (seeTab. 2), simulating several operating points is still out-of-reach for the most refined grid. Asthe cost for one revolution is affordable for M1 and M2, the present paper focuses on these twogrids.
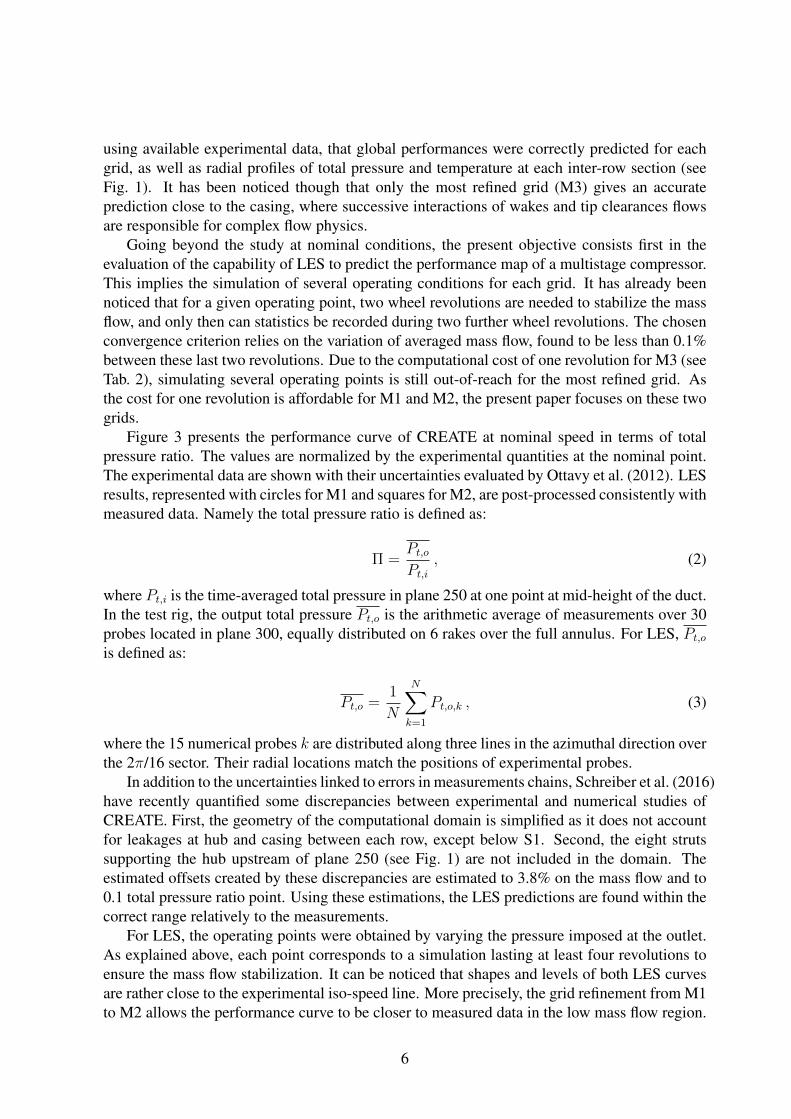
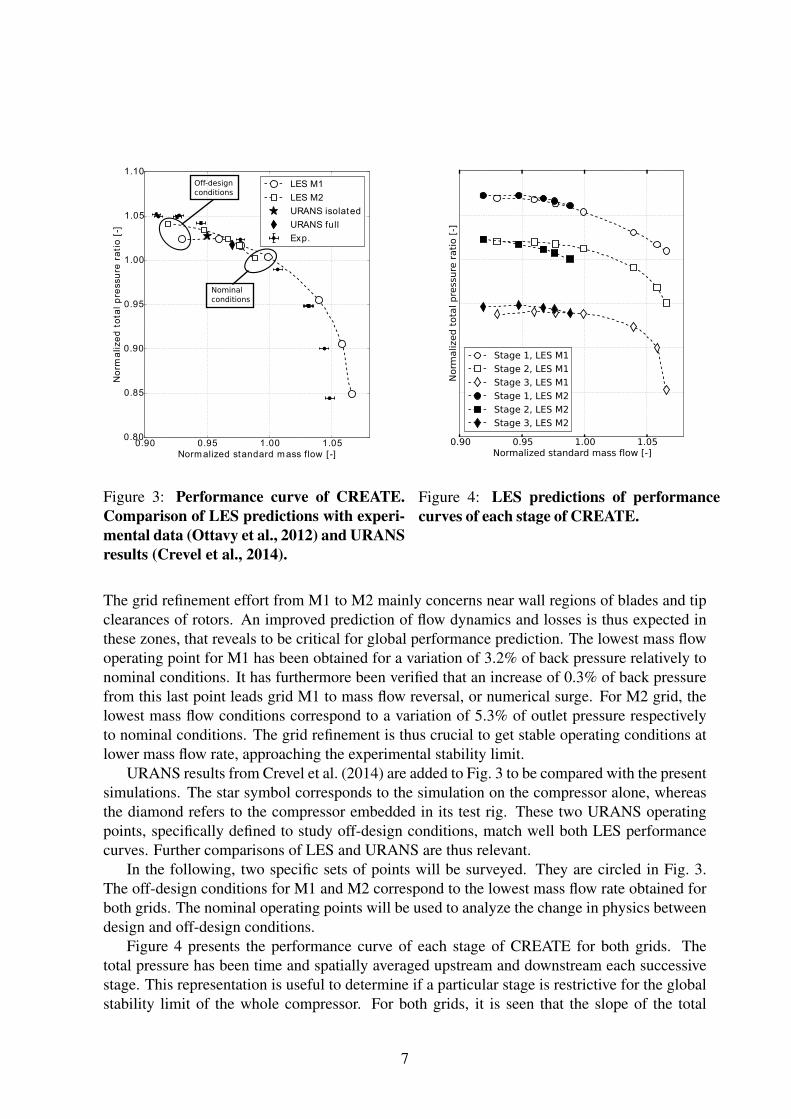
Figure 3 presents the performance curve of CREATE at nominal speed in terms of totalpressure ratio. The values are normalized by the experimental quantities at the nominal point.The experimental data are shown with their uncertainties evaluated by Ottavy et al. (2012). LESresults, represented with circles for M1 and squares for M2, are post-processed consistently withmeasured data. Namely the total pressure ratio is defined as:
Π =Pt,oPt,i
, (2)
where Pt,i is the time-averaged total pressure in plane 250 at one point at mid-height of the duct.In the test rig, the output total pressure Pt,o is the arithmetic average of measurements over 30probes located in plane 300, equally distributed on 6 rakes over the full annulus. For LES, Pt,ois defined as:
Pt,o =1
N
N∑k=1
Pt,o,k , (3)
where the 15 numerical probes k are distributed along three lines in the azimuthal direction overthe 2π/16 sector. Their radial locations match the positions of experimental probes.
In addition to the uncertainties linked to errors in measurements chains, Schreiber et al. (2016)have recently quantified some discrepancies between experimental and numerical studies ofCREATE. First, the geometry of the computational domain is simplified as it does not accountfor leakages at hub and casing between each row, except below S1. Second, the eight strutssupporting the hub upstream of plane 250 (see Fig. 1) are not included in the domain. Theestimated offsets created by these discrepancies are estimated to 3.8% on the mass flow and to0.1 total pressure ratio point. Using these estimations, the LES predictions are found within thecorrect range relatively to the measurements.
For LES, the operating points were obtained by varying the pressure imposed at the outlet.As explained above, each point corresponds to a simulation lasting at least four revolutions toensure the mass flow stabilization. It can be noticed that shapes and levels of both LES curvesare rather close to the experimental iso-speed line. More precisely, the grid refinement from M1to M2 allows the performance curve to be closer to measured data in the low mass flow region.
6
0.90 0.95 1.00 1.05
Norm alized standard m ass flow [ -]
0.80
0.85
0.90
0.95
1.00
1.05
1.10
No
rma
lize
d t
ota
l p
ressu
re r
ati
o [
-]
LES M1
LES M2
URANS isolated
URANS full
Exp.
Nominal
conditions
Off-design
conditions
Figure 3: Performance curve of CREATE.Comparison of LES predictions with experi-mental data (Ottavy et al., 2012) and URANSresults (Crevel et al., 2014).
0.90 0.95 1.00 1.05Normalized standard mass flow [-]
Normalized total pressure ratio [-]
Stage 1, LES M1
Stage 2, LES M1
Stage 3, LES M1
Stage 1, LES M2
Stage 2, LES M2
Stage 3, LES M2
Figure 4: LES predictions of performancecurves of each stage of CREATE. just for editpurpose just for edit purpose just for editpurpose
The grid refinement effort from M1 to M2 mainly concerns near wall regions of blades and tipclearances of rotors. An improved prediction of flow dynamics and losses is thus expected inthese zones, that reveals to be critical for global performance prediction. The lowest mass flowoperating point for M1 has been obtained for a variation of 3.2% of back pressure relatively tonominal conditions. It has furthermore been verified that an increase of 0.3% of back pressurefrom this last point leads grid M1 to mass flow reversal, or numerical surge. For M2 grid, thelowest mass flow conditions correspond to a variation of 5.3% of outlet pressure respectivelyto nominal conditions. The grid refinement is thus crucial to get stable operating conditions atlower mass flow rate, approaching the experimental stability limit.
URANS results from Crevel et al. (2014) are added to Fig. 3 to be compared with the presentsimulations. The star symbol corresponds to the simulation on the compressor alone, whereasthe diamond refers to the compressor embedded in its test rig. These two URANS operatingpoints, specifically defined to study off-design conditions, match well both LES performancecurves. Further comparisons of LES and URANS are thus relevant.
In the following, two specific sets of points will be surveyed. They are circled in Fig. 3.The off-design conditions for M1 and M2 correspond to the lowest mass flow rate obtained forboth grids. The nominal operating points will be used to analyze the change in physics betweendesign and off-design conditions.
Figure 4 presents the performance curve of each stage of CREATE for both grids. Thetotal pressure has been time and spatially averaged upstream and downstream each successivestage. This representation is useful to determine if a particular stage is restrictive for the globalstability limit of the whole compressor. For both grids, it is seen that the slope of the total
7
50% h/H
83% h/H
95% h/H
S2 S3R3
(a) M1, nominal point.
50% h/H
83% h/H
95% h/H
S2 R3 S3
(b) M1, off-design point.
50% h/H
83% h/H
95% h/H
S2 R3 S3
(c) M2, nominal point.
S2 R3 S3
50% h/H
83% h/H
95% h/H
(d) M2, off-design point.
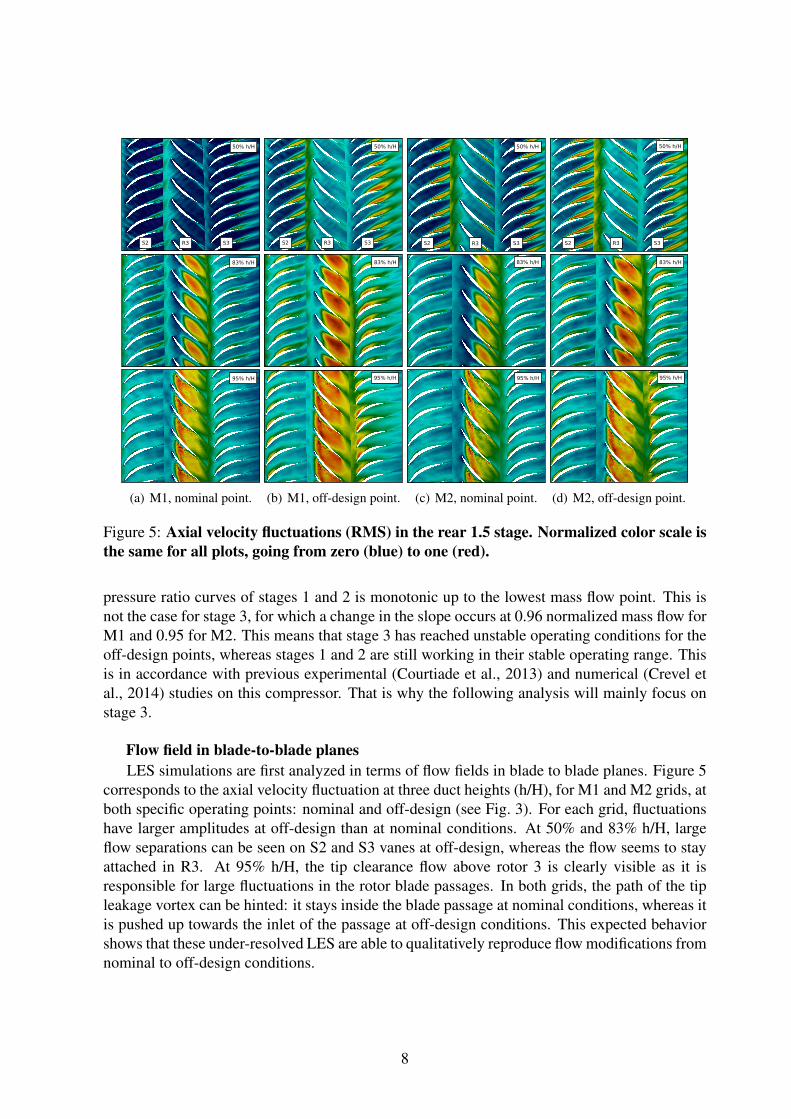
Figure 5: Axial velocity fluctuations (RMS) in the rear 1.5 stage. Normalized color scale isthe same for all plots, going from zero (blue) to one (red).
pressure ratio curves of stages 1 and 2 is monotonic up to the lowest mass flow point. This isnot the case for stage 3, for which a change in the slope occurs at 0.96 normalized mass flow forM1 and 0.95 for M2. This means that stage 3 has reached unstable operating conditions for theoff-design points, whereas stages 1 and 2 are still working in their stable operating range. Thisis in accordance with previous experimental (Courtiade et al., 2013) and numerical (Crevel etal., 2014) studies on this compressor. That is why the following analysis will mainly focus onstage 3.
Flow field in blade-to-blade planesLES simulations are first analyzed in terms of flow fields in blade to blade planes. Figure 5
corresponds to the axial velocity fluctuation at three duct heights (h/H), for M1 and M2 grids, atboth specific operating points: nominal and off-design (see Fig. 3). For each grid, fluctuationshave larger amplitudes at off-design than at nominal conditions. At 50% and 83% h/H, largeflow separations can be seen on S2 and S3 vanes at off-design, whereas the flow seems to stayattached in R3. At 95% h/H, the tip clearance flow above rotor 3 is clearly visible as it isresponsible for large fluctuations in the rotor blade passages. In both grids, the path of the tipleakage vortex can be hinted: it stays inside the blade passage at nominal conditions, whereas itis pushed up towards the inlet of the passage at off-design conditions. This expected behaviorshows that these under-resolved LES are able to qualitatively reproduce flow modifications fromnominal to off-design conditions.
8
S2 R3 S3
(a) M1, nominal point.
S2 R3 S3
(b) M1, off-design point.
S2 R3 S3
(c) M2, nominal point.
S2 R3 S3
(d) M2, off-design point.
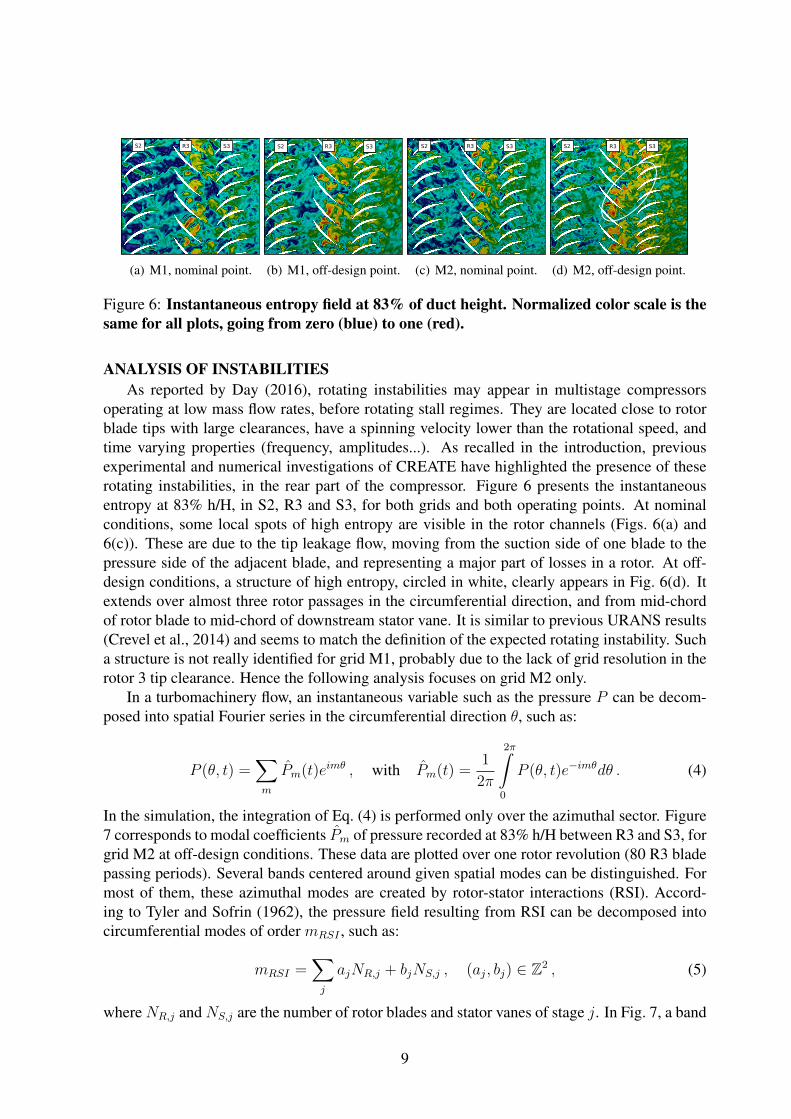
Figure 6: Instantaneous entropy field at 83% of duct height. Normalized color scale is thesame for all plots, going from zero (blue) to one (red).
ANALYSIS OF INSTABILITIESAs reported by Day (2016), rotating instabilities may appear in multistage compressors
operating at low mass flow rates, before rotating stall regimes. They are located close to rotorblade tips with large clearances, have a spinning velocity lower than the rotational speed, andtime varying properties (frequency, amplitudes...). As recalled in the introduction, previousexperimental and numerical investigations of CREATE have highlighted the presence of theserotating instabilities, in the rear part of the compressor. Figure 6 presents the instantaneousentropy at 83% h/H, in S2, R3 and S3, for both grids and both operating points. At nominalconditions, some local spots of high entropy are visible in the rotor channels (Figs. 6(a) and6(c)). These are due to the tip leakage flow, moving from the suction side of one blade to thepressure side of the adjacent blade, and representing a major part of losses in a rotor. At off-design conditions, a structure of high entropy, circled in white, clearly appears in Fig. 6(d). Itextends over almost three rotor passages in the circumferential direction, and from mid-chordof rotor blade to mid-chord of downstream stator vane. It is similar to previous URANS results(Crevel et al., 2014) and seems to match the definition of the expected rotating instability. Sucha structure is not really identified for grid M1, probably due to the lack of grid resolution in therotor 3 tip clearance. Hence the following analysis focuses on grid M2 only.
In a turbomachinery flow, an instantaneous variable such as the pressure P can be decom-posed into spatial Fourier series in the circumferential direction θ, such as:
P (θ, t) =∑m
Pm(t)eimθ , with Pm(t) =1
2π
2π∫0
P (θ, t)e−imθdθ . (4)
In the simulation, the integration of Eq. (4) is performed only over the azimuthal sector. Figure7 corresponds to modal coefficients Pm of pressure recorded at 83% h/H between R3 and S3, forgrid M2 at off-design conditions. These data are plotted over one rotor revolution (80 R3 bladepassing periods). Several bands centered around given spatial modes can be distinguished. Formost of them, these azimuthal modes are created by rotor-stator interactions (RSI). Accord-ing to Tyler and Sofrin (1962), the pressure field resulting from RSI can be decomposed intocircumferential modes of order mRSI , such as:
mRSI =∑j
ajNR,j + bjNS,j , (aj, bj) ∈ Z2 , (5)
whereNR,j andNS,j are the number of rotor blades and stator vanes of stage j. In Fig. 7, a band
9
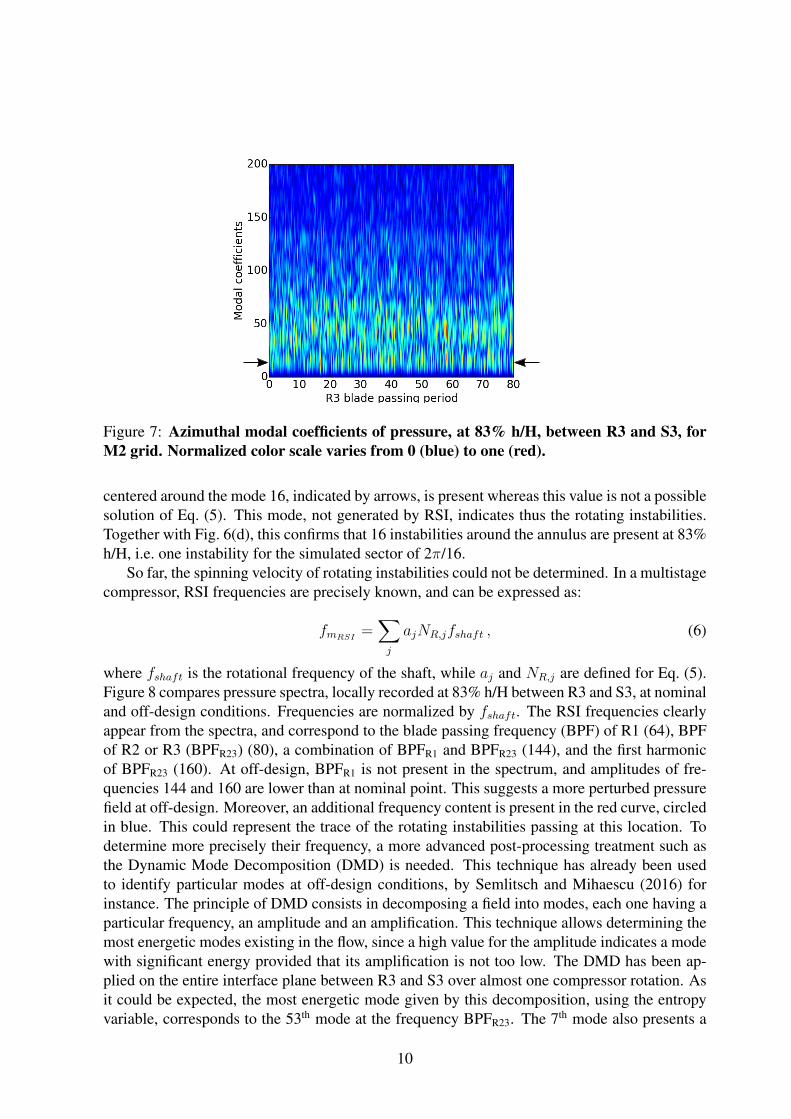
Figure 7: Azimuthal modal coefficients of pressure, at 83% h/H, between R3 and S3, forM2 grid. Normalized color scale varies from 0 (blue) to one (red).
centered around the mode 16, indicated by arrows, is present whereas this value is not a possiblesolution of Eq. (5). This mode, not generated by RSI, indicates thus the rotating instabilities.Together with Fig. 6(d), this confirms that 16 instabilities around the annulus are present at 83%h/H, i.e. one instability for the simulated sector of 2π/16.
So far, the spinning velocity of rotating instabilities could not be determined. In a multistagecompressor, RSI frequencies are precisely known, and can be expressed as:
fmRSI=
∑j
ajNR,jfshaft , (6)
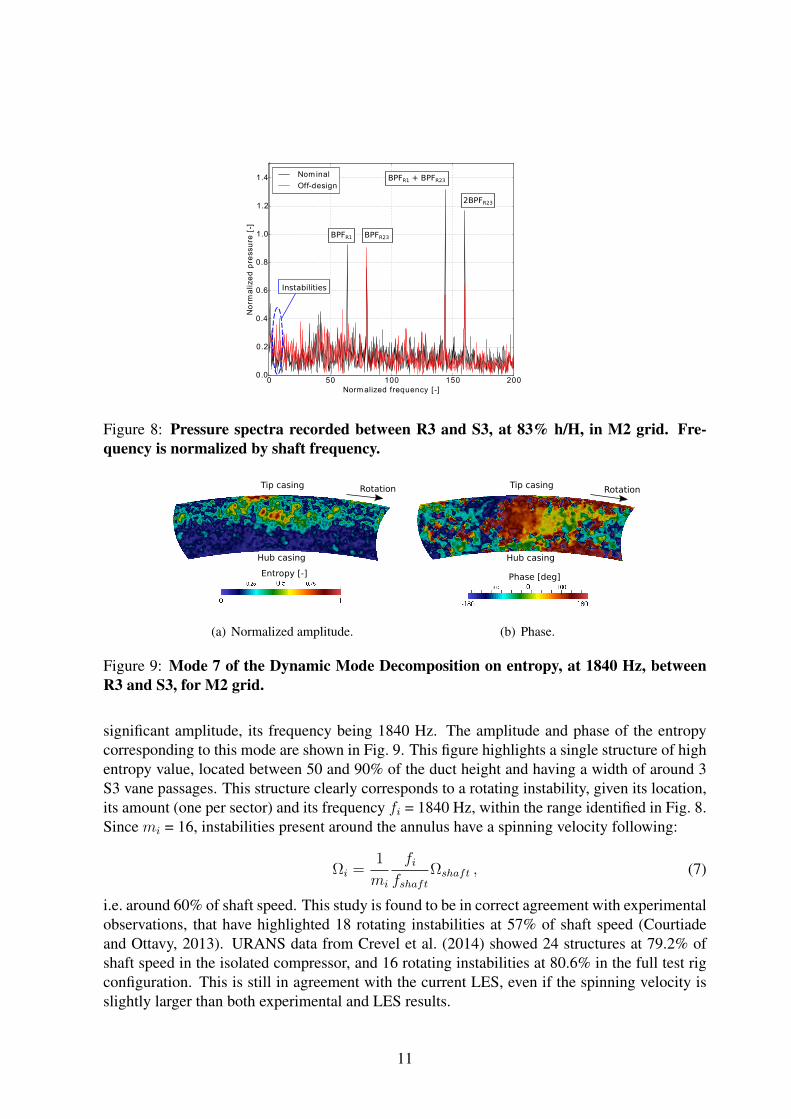
where fshaft is the rotational frequency of the shaft, while aj and NR,j are defined for Eq. (5).Figure 8 compares pressure spectra, locally recorded at 83% h/H between R3 and S3, at nominaland off-design conditions. Frequencies are normalized by fshaft. The RSI frequencies clearlyappear from the spectra, and correspond to the blade passing frequency (BPF) of R1 (64), BPFof R2 or R3 (BPFR23) (80), a combination of BPFR1 and BPFR23 (144), and the first harmonicof BPFR23 (160). At off-design, BPFR1 is not present in the spectrum, and amplitudes of fre-quencies 144 and 160 are lower than at nominal point. This suggests a more perturbed pressurefield at off-design. Moreover, an additional frequency content is present in the red curve, circledin blue. This could represent the trace of the rotating instabilities passing at this location. Todetermine more precisely their frequency, a more advanced post-processing treatment such asthe Dynamic Mode Decomposition (DMD) is needed. This technique has already been usedto identify particular modes at off-design conditions, by Semlitsch and Mihaescu (2016) forinstance. The principle of DMD consists in decomposing a field into modes, each one having aparticular frequency, an amplitude and an amplification. This technique allows determining themost energetic modes existing in the flow, since a high value for the amplitude indicates a modewith significant energy provided that its amplification is not too low. The DMD has been ap-plied on the entire interface plane between R3 and S3 over almost one compressor rotation. Asit could be expected, the most energetic mode given by this decomposition, using the entropyvariable, corresponds to the 53th mode at the frequency BPFR23. The 7th mode also presents a
10
0 50 100 150 200
Norm alized frequency [ -]
0.0
0.2
0.4
0.6
0.8
1.0
1.2
1.4
No
rma
lize
d p
ressu
re [
-]
Nom inal
Off-design
BPFR1 BPFR23
BPFR1 + BPFR23
2BPFR23
Instabilities
Figure 8: Pressure spectra recorded between R3 and S3, at 83% h/H, in M2 grid. Fre-quency is normalized by shaft frequency.
Hub casing
Tip casing Rotation
Entropy [-]
(a) Normalized amplitude.
Hub casing
Tip casingRotation
Phase [deg]
(b) Phase.
Figure 9: Mode 7 of the Dynamic Mode Decomposition on entropy, at 1840 Hz, betweenR3 and S3, for M2 grid.
significant amplitude, its frequency being 1840 Hz. The amplitude and phase of the entropycorresponding to this mode are shown in Fig. 9. This figure highlights a single structure of highentropy value, located between 50 and 90% of the duct height and having a width of around 3S3 vane passages. This structure clearly corresponds to a rotating instability, given its location,its amount (one per sector) and its frequency fi = 1840 Hz, within the range identified in Fig. 8.Since mi = 16, instabilities present around the annulus have a spinning velocity following:
Ωi =1
mi
fifshaft
Ωshaft , (7)
i.e. around 60% of shaft speed. This study is found to be in correct agreement with experimentalobservations, that have highlighted 18 rotating instabilities at 57% of shaft speed (Courtiadeand Ottavy, 2013). URANS data from Crevel et al. (2014) showed 24 structures at 79.2% ofshaft speed in the isolated compressor, and 16 rotating instabilities at 80.6% in the full test rigconfiguration. This is still in agreement with the current LES, even if the spinning velocity isslightly larger than both experimental and LES results.
11
CONCLUSIONSThis work has attempted to evaluate the relevance of wall-modeled LES applied to an actual
high pressure multistage compressor at off-design conditions. A coarse and an intermediategrid were used, the latter fulfilling accepted criteria for near wall resolution on blades in a walllaw context. If both grids are shown to reproduce the shape of the iso-speed performance lineof the compressor, only the intermediate grid satisfactorily approaches the experimental oper-ating point corresponding to the lowest mass flow. Hence this grid resolution seems to appearsufficient for global performance predictions. For both grids, the last stage is found to be un-stable, as previously observed in this compressor in experimental and numerical investigations.In LES, the flow field evolution between nominal and off-design conditions has been analyzedin terms of velocity fluctuations and instantaneous entropy. For the intermediate grid, the ex-pected flow behavior is qualitatively observed, e.g. flow separation on suction surfaces of statorvanes and tip leakage flow pushed towards the inlet of rotor passages. Furthermore, rotatinginstabilities have been evidenced in the intermediate grid at off-design conditions, above theduct mid-height. More specifically, 16 structures spinning at around 60% of shaft speed havebeen highlighted. This amount is enforced to be a multiple of the circumferential periodicity,but is close to experimental observations, in which 18 rotating instabilities were measured at57% of shaft speed. Some comparisons performed with existing URANS results of the samecompressor are also satisfactory, in terms of global performance predictions and rotating insta-bilities in the last stage. Finally relatively coarse wall-modeled LES appears to be promising asan acceptable tradeoff between global flow predictions and computational cost. Complementedby DMD, it is also found to be an efficient technique to identify instabilities at off-design condi-tions. Further evaluations are still required to assess these conclusions. Coupling a two-variableoutlet condition to the current characteristic condition could also be an interesting perspectivefor future simulations of unstable regimes.
ACKNOWLEDGEMENTSThis work was granted access to the HPC resources of CINES under the allocation x20162a-
6074 made by GENCI. The authors are grateful to X. Ottavy and J. Schreiber (LMFA) forfruitful discussions on CREATE.
References[1] N. Courtiade and X. Ottavy. Experimental study of surge precursors in a high-speed mul-
tistage compressor. J. Turbomach. , 135, 2013.
[2] F. Crevel, N. Gourdain, and S. Moreau. Numerical simulation of aerodynamic instabilitiesin a multistage high-speed high-pressure compressor on its test rig - part I: rotating stall.J. Turbomach. , 136, 2014.
[3] I. J. Day. Stall, surge and 75 years of research. J. Turbomach. , 138, 2016.
[4] J. de Laborderie, F. Duchaine, O. Vermorel, L. Gicquel, and S. Moreau. Application ofan overset grid method to the Large Eddy Simulation of a high-speed multistage axialcompressor. In ASME Turbo Expo, number GT2016-56344, 2016.
[5] F. Duchaine, S. Jaure, D. Poitou, E. Quemerais, G. Staffelbach, T. Morel, and L. Gic-
12
quel. Analysis of high performance conjugate heat transfer with the OpenPALM coupler.Computational Science & Discovery, 8(1):15003–15021, 2015.
[6] C. Koupper, T. Poinsot, L. Gicquel, and F. Duchaine. Compatibility of characteristicboundary conditions with radial equilibrium in turbomachinery simulations. AIAA Jour-nal, 52(12):2829–2839, 2014.
[7] P. D. Lax and B. Wendroff. Difference schemes for hyperbolic equations with high orderof accuracy. Commun. Pure Appl. Math. , 17:381–398, 1964.
[8] V. Moureau, G. Lartigue, Y. Sommerer, C. Angelberger, O. Colin, and T. Poinsot. Nu-merical methods for unsteady compressible multi-component reacting flows on fixed andmoving grids. J. Comput. Phys. , 202(2):710–736, 2005.
[9] X. Ottavy, N. Courtiade, and N. Gourdain. Experimental and computational methods forflow investigation in high-speed multistage compressor. J. Prop. Power , 28(6):1141–1155, 2012.
[10] T. Poinsot and S. Lele. Boundary conditions for direct simulations of compressible viscousflows. J. Comput. Phys. , 101(1):104–129, 1992.
[11] T. Schonfeld and M. Rudgyard. Steady and unsteady flows simulations using the hybridflow solver AVBP. AIAA Journal , 37(11):1378–1385, 1999.
[12] J. Schreiber, X. Ottavy, G. Ngo Boum, and N. Gourdain. Influence of rotor tip flow fieldmis-prediction on rotating disturbance near surge in a high speed multistage compressor.In ASME Turbo Expo, number GT2016-57372, 2016.
[13] B. Semlitsch and M. Mihaescu. Flow phenomena leading to surge in a centrifugal com-pressor. J. Energy, 103(572–587), 2016.
[14] J. Smagorinsky. General circulation experiments with the primitive equations: 1. the basicexperiment. Mon. Weather Rev. , 91:99–164, 1963.
[15] P.G. Tucker. Computation of unsteady turbomachinery flows: Part 2 LES and hybrids.Prog. Aerospace Sci. , 47(7):546 – 569, 2011.
[16] J. Tyler and T. Sofrin. Axial flow compressor noise studies. SAE Technical paper 620532,1962.
[17] M. Vahdati, A. Sayma, C. Freeman, and M. Imregun. On the use of atmospheric boundaryconditions for axial flow compressor stall simulations. J. Turbomach. , 127(2):349–351,2005.
[18] G. Wang, F. Duchaine, D. Papadogiannis, I. Duran, S. Moreau, and L. Y. M. Gicquel. Anoverset grid method for large eddy simulation of turbomachinery stages. J. Comput. Phys., 274:333–355, 2014.
13