
Analysis, Inspection, And Repair Methods For Pin ...
101
—— Analysis, Inspection, And Repair Methods For Pin Connections On Illinois Bridges ———. Physical Research Report No. 107 @ Illinois Department of lFansportation Bureau of Materials and Physical Research
Transcript of Analysis, Inspection, And Repair Methods For Pin ...
——
Analysis, Inspection,And Repair MethodsFor Pin ConnectionsOn Illinois Bridges
———.
Physical Research Report No. 107
@
Illinois Department of lFansportationBureau of Materials and Physical Research

Technical Report Documentation Page
I
1. Report No. 2. Government Accass Ion No. 3. ReeIpIont s Cam109 No.
I
FHHA/IL/PR-lo7~,4. Tltl*e“asub,,,,.
I5. Report Date
I
Analysis, Inspection, and Repair Methods for Pin A~ril. 1992
~ Connections6. Porform,ng &gan, zo,, en Cooe
on Illinois Bridges. I7. Au~o+s,
8. Perfenwtn90r9an, zomon Reoor$Ne.I I
J. M. South, C. Hahin, R. O. Telford I PRR-107 I9. P.rfenntm9 Ot9atIx0m0n f’4a#II. atd Address 10. Weti Un,tNe. (TRAIS)
Illinois Department of TransportationBureau of Materials and Physical Research 11. Contract er Grant No.
126 E. Ash StreetSpringfield, IL 62704-4766 13. Type of ReBort ond per, oa ~OVCfMl
12. Smonsav,n. A..mc. Nm. md Address
Iillno{s-Department of TransportationBureau of Materials and Physical Research126 E. Ash Street
‘ Springfield, IL 62704-4766 WII
15. Suppiomtitory NOWSII
Study conducted in cooperation with the U. S. Department of Transportation,Federal Highway Administration.
16. Abstract
This report documents methods used in Illinois for analysis, Inspection,and repair of pin connections in bridges. Weldable foil strain gages were _used to detect the effects of unknown levels of flxlty In pins on cantilevertruss bridges. Other methods for detecting pln movement, including electronicangle sensors and scratch-type po#nter gages were also Investigated. Themaximum effect of complete flxity on pins and hangers was estimated withfinite element models of both cantilever truss and cantilever girder bridges.A pin inspection procedure using ultrasonic instrumentation was developed andtested throughout the state. Design deficiencies of pln connections are
, noted. Modernized details which eliminate many of the existing deficienciesare presented. The ~mprovements include better tolerances on fits andfinishes, Increased degrees of freedom of rotation, provisions for periodiclubrication, high strength, corrosion resistant alloys, extreme pressurelubricants, and toughness requirements based on alloy yield strength. Amethod for calculating factor of safety for pins based on distortion energyprinciples is presented.
I
. I
i7. Koy Woras 118. D,str,bu,,on Stawmont I
Pin connections, strain gages, finite No restrictions. This document is,.
element models, pin inspection, ultra-i available to the public through thesonic testing, safety factors, modern
1
National Technical Informationized pin details. Service, Springfield, VA 22161 I
I
19. S.cunty Ciassif. (of thts report) 20. Sewr, ty Ciasstf. (of ?htspo90~ 21. No. oi Pages 22. Pr, ce I
I
slfled Unclassified I 100 I I~ormDOTF~O.7 (8-72) R~mductiam ofcompkmdpogo authorized
. .—

ANALYSIS, INSPECTION, AND REPAIR METHODSFOR
PIN CONNECTIONS ONILLINOIS BRIDGES
by
Jeffrey M. South, P. E.Structural Analyst
Bureau of Materials and Physical Research
Christopher Hahin, P. E.Engineer of Bridge Investigations
Bureau of Materials and Physical Research
Richard O. Telford, P. E.Bridge Inspection Engineer
Bureau of Maintenance
ILLINOIS DEPARTMENT OF TRANSPORTATIONBUREAU OF MATERIALS AND PHYSICAL RESEARCH
APRIL 1992

The contents of this report reflect the views of the authors who are
responsible for the facts and the accuracy of the data presented herein.
The contents do not necessarily reflect the official views or policy of
the Federal Highway Administration or the Illinois Department of
Transportation. This report does not constitute a standard,
specification, or regulation.
NOTICE
Neither the United States Government nor the State of Illinois endorses
products or manufacturers. Trade or manufacturers’ names appear herein
solely because they are considered essential to the object of this report.

TABLE OF CONTENTS
List of Figures
List of Tables
1 Introduction
2 Detecting Pin Movement
3 Finite Element Analysis
4 Experimental Stress Analysis
5 Ultrasonic Pin Inspection
6 Existing Pin & Link Design;Retrofit Replacement
7 Summary
8 Conclusions
References
PAGE
i
v
1
4
15
26
31
51
78
81
83
Appendices

LIST OF FIGURES
FIGURE NO. DESCRIPTION
1 Photograph of paper gage installedon hanger on 1-270 over Chain-of–RocksCanal near Granite City, Illinois.
2
3
4
5
6
7
8
9
10
11
12
13
PAGE
5
Photograph of a mechanical, scratch-type 7pointer installed on I-55 over IllinoisRoute 29 at Springfield, Illinois.
Photograph of a scratch-type pointer gage 8and a pointer with a calibrated scaleinstalled on I–474 over the IllinoisRiver at Peoria.
Strain gage installation for detection of 9bending strains induced by pin fixity.
Photograph of weldable strain gages installed 10on a hanger on 1-270 bridge.
Photograph of an electronic angle sensor 12installed on Hazel Dell Road over I-55 inSpringfield.
1-270 over Chain-of-Rocks Canal. Bridge 17is symmetrical about the centerline.
Finite element approximation of a truss 18section near a hanger on 1-270 overChain-of-Rocks Canal. Pins are locatedat nodes M13 and G13.
Static deflection diagram of lower chord 19of 1-270 bridge, without deadload effect.
Hazel Dell Road over I-55 in Springfield, 24Illinois.
Wheatstone bridge circuit diagram for 27measurement of bending strains withinsensitivity to axial strains.
Distance and Sensitivity Calibration-Pin 33(DSC-P) calibration block developed foruse with pin inspections.
Photograph of pin with deep wear grooves. 36
i

LIST OF FIGURES, CONT’D
FIGURE NO. DESCRIPTION PAGE
14 Ultrasonic test data for an actual 3-inch 43diameter pin specimen using a straight beamtransducer. Figure shows unadjusted data,results from IDOT procedure, and resultsfrom IDOT procedure without distanceattenuation correction factor.
15
16
17
18
Ultrasonic test data for an actual 3-inch 44diameter pin specimen using a 20 degree anglebeam transducer. Figure shows unadjusted data,results from IDOT procedure, and results fromIDOT procedure without distance attenuationcorrection factor.
Ultrasonic test data for an actual 3-inch 45diameter pin specimen using a 30 degreeangle beam transducer. Figure shows un-adjusted data, results from IDOT procedure,and results from IDOT procedure withoutdistance attenuation correction factor.
Ultrasonic test data for an actual 3-inch 46diameter pin specimen using a 45 degree anglebeam transducer. Figure shows unadjusteddata, results from IDOT procedure, and re-sults from IDOT procedure without distanceattenuation correction factor.
Ultrasonic test data for a plate specimen 47of ASTM A572 steel using a straight beamtranducer. Pertinent specimen geometry wasthe same as that of the tested pin specimen.Figure shows unadjusted data, results fromIDOT procedure, and results from IDOT pro-dure without distance attenuation correctionfactor.
Ultrasonic test data for a plate specimen 48of ASTM A572 steel using a 20 degree anglebeam tranducer. Pertinent specimen geometrywas the same as that of the tested pinspecimen. Figure shows unadjusted data,results from IDOT procedure, and resultsfrom IDOT procedure without distanceattenuation correction factor.
ii

LIST OF FIGURES, CONT ‘D
FIGURE NO. DESCRIPTION
20 Ultrasonic test data for aof ASTM A572 steel using abeam tranducer. Pertinent
21
22
23
24
25
26a
26b
27
28
29
plate specimen30 degree anglespecimen geometry
was the same as that of the tested pin speci–men. Figure shows unadjusted data, resultsfrom IDOT procedure, and results from IDOTprocedure without distancerection factor.
Ultrasonic test data for aof ASTM A572 steel using abeam tranducer. Pertinent
attenuation cor-
plate specimen45 degree anglespecimen geometry
was the same as that of the tested pin speci–men. Figure shows unadjusted data, resultsfrom IDOT procedure, and results from IDOTprocedure without distance attenuation cor-rection factor.
Typical new 9-inch diameter pin connectiondetai 1.
Special wrench for torque application.Overtightening causes the loading pinto shear off.
Nut and seal detail for moisture exclusion.
Nine-inch diameter pin detail also showingmaterial properties and surface finishrequirements.
Detail drawing of link plate.
Finite element model of the link eyebar.Stresses are for maximum loadings for thePeru Bridge. Note that eyelet stressesare about 3X nominal stress. Stress valuesin the legend are in psi.
Machined and finely ground pins forPeru Bridge.
Closeup of pin and general size.
Circular nuts for pins. All grooves andholes for dog bolts were not yet machinedout.
PAGE
49
50
57
59
60
61
62
64
69
69
70
. . .111

LIST OF FIGURES, CONT’D
FIGURE NO.
30
31
32
33
34
DESCRIPTION PAGE
Special chamfer which permits a space for a 70grease seal situated between the nut andlink eyebar.
Machined link eyebars, milled to be completely 71flat and with radii with smooth finishes.Bearings have not yet been inserted in thispicture.
A stack of four bronze inserts, showinginternal grease groove.
Principal forces and stresses on pinsand link eyebars.
Stress factor for typical eyebar design(Ref. 4, page 376).
72
74
75
iv

TABLE NO.
1
2
3
4
5
6
7
8
9
10
11
12
LIST OF TABLES
DESCRIPTION
Torque and torsional shear stress onseven-inch diameter pins (1-270) completelyfixed.
Torque and torsional shear stress ontwelve-inch diameter pins (I-474)completely fixed.
Strain gage data and analysbridge.
Strain gage data and analysbridge.
s for 1-270
s for I-474
Distribution of structures with fracturecritical appraisal ratings of O-8.
Ultrasonic data for notches of known depthand location in an actual pin.
Ultrasonic data for notches of known depthand location in plate specimens.
Various standard pin geometries now in use.
Pin, link, and bearing alloys.
Pin and link lubricants.
Impact toughness requirements forpin and link materials for TemperatureZone 2.
Typical coefficients of static friction.
m
20
22
29
29
37
40
41
53
65
66
68
76
v

-1-
1. INTRODUCTION
The nearly catastrophic failure of several pins in a bridge on I-55
in St. Louis, Missouri in 1987 and other incidence of pin failures
throughout the country such as the collapse of the Mianus River Bridge on
I-95 in Connecticut prompted the Federal Highway Administration (FHHA) to
require inspection of all pins and pinned connections in bridges
throughout the country. This report documents efforts by the Illinois
Department of Transportation to define the problem in Illinois, quantify
the forces and moments involved, develop methods to detect pin movement,
inspect pins for defects, and develop improved pin connection details.
This work was accomplished through
Bureaus of Bridges and Structures,
Research, Local Roads and Streets,
a joint effort by personnel from the
Maintenance, Materials and Physical
and the FHWA in the form of a
Technical Advisory Committee (TAC).
In general, there are three types of pinned connections used in
Illinois.
are used
of bridge
Illinois.
Large pins (typically seven inches in diameter and greater)
n hangers on cantilever truss bridges. An example of this type
is 1-270 over the Chain-of-Rocks Canal near Granite City,
Smaller pins (less than five inches in diameter) ate used in
conjunction with link eyebars to support the end spans of many cantilever
girder bridges throughout the state. Small pins without hanger straps
are also used as a moment-relief
report, hangers refer to members
link eyebars refer to components
mechanism in some bridges. In this
in cantilever truss bridges and links or
in cantilever girder bridges.

.-i-L–
Pins and hangers or link eyebars are normally designed to resist
shear and bending stresses induced by dead
connection is assumed upon installation to
assumption may be valid when the bridge is
exposure to atmosphere, deicing salts, and
wear tend to produce at least a partially
load and traffic. The
be torsion-free. This
new, but after years of
load variations, corrosion and
fixed condition in the pin
connection. This fixity induces shear stresses in both the pin and link
eyebar during expans
and can also produce
cantilever girder br
on and contraction of the bridge with temperature
shear stresses due to live load, especially in
dges. The combination of inadequate design for
torsion accompanied by corrosion and wear of a pin produces undesirable
stress states that can cause internal and external defects, flaws and
discontinuities $0 develop and grow either in the pin or the hanger/link
eyebar. The initiation and growth of a crack in a fracture critical
detail such as a pin or a link eyebar can lead to catastrophic failure.
The number of pins in Illinois bridges that are susceptible to
damage is large. According to data compiled by the TAC, there are
approximately 130 cantilever girder bridges with pin-link eyebar, or
pin-plate details (small pins) in Illinois. There are a total of 3,165
pins in these bridges. There are fifteen cantilever truss bridges in
Illinois with 120 large pins.
As indicated by Carroll, et al.,’ of the Missouri Highway and
Transportation Department, visual inspection of pins for defects is
inadequate, because the areas of corrosion and wear are inaccessible
while under load. Prior to this research, Illinois had no
experiment-based procedures to either determine fixity or adequately
inspect pins for defects. In order to comply with the FHWA directive,
methods for determining fixity and for pin inspection were developed.

-3-
Retrofit details were developed which allow free movement, moisture
exclusion, and galling and corrosion resistance.

-4-
2. DETECTING PIN MOVEMENT
In order to better analyze pin behavior in a partially fixed or
fixed configuration, it was essential to detect pin movement to help
quantify the forces, moments, and stresses involved. Several methods of
detecting pin and/or hanger movement were developed which ranged from
simple to sophisticated. These methods included 1) paper gages, 2) paint
stripes, 3) pointers, 4) strain gages, and 5) electronic rotation sensors.
Paper Gages
The paper gage consisted of a 2 x 6-inch strip of paper with a 1/8
inch wide black strip running down the longitudinal centerline. It was
installed by gluing both ends to a hanger-gusset interface and then
cutting the paper between. The theory was that relative motion
(temperature-induced) would be visible by relative displacement of the
black strip. A picture of an installation on the 1-270 Bridge is shown
in Figure 1. Several drawbacks were noted for this idea: 1) installation
was difficult, 2) even when waterproofed, the paper tended to curl and
degrade over a short time, 3) the gages were often covered with bird
droppings and damaged by maintenance activities, especially by bridge
cleaning with water spray, 4) the method was not very sensitive, and 5) a
quantitative analysis of pin fixity was not possible.
Paint Stripes
Paint stripes were conceived as a refinement to paper gages. A
piece of masking tape was put in place of the
a fast-drying black paint. The tape was then
paper gage and sprayed with
removed. This solved the -

-5-
Figure 1. Photograph of paper gage installed on hanger on 1-270 over
Chain-of-Rocks Canal near Granite City, Illinois.
-6-
installation problem, but did not alleviate the others. Detecting motion
was difficult.
Pointers
Several types of mechanical pointers were investigated. These
pointers recorded movement by scratching the paint on the bridge.
Several of these pointers were installed on I-55 over Illinois Route 29
at Springfield. See Figure 2. Installation was not difficult, although
holes had to be tapped into either the pin or the nut which could
interfere with an ultrasonic inspection. Detection of small movement was
difficult.
Another type of pointer, which included a calibrated angle scale,
was installed on a bridge near Peoria. See Figure 3. This pointer also
required holes to be tapped. Installation was more complicated, since
the graduated scale had to be positioned carefully. Detection of small
movement was still difficult.
Strain Gaqes
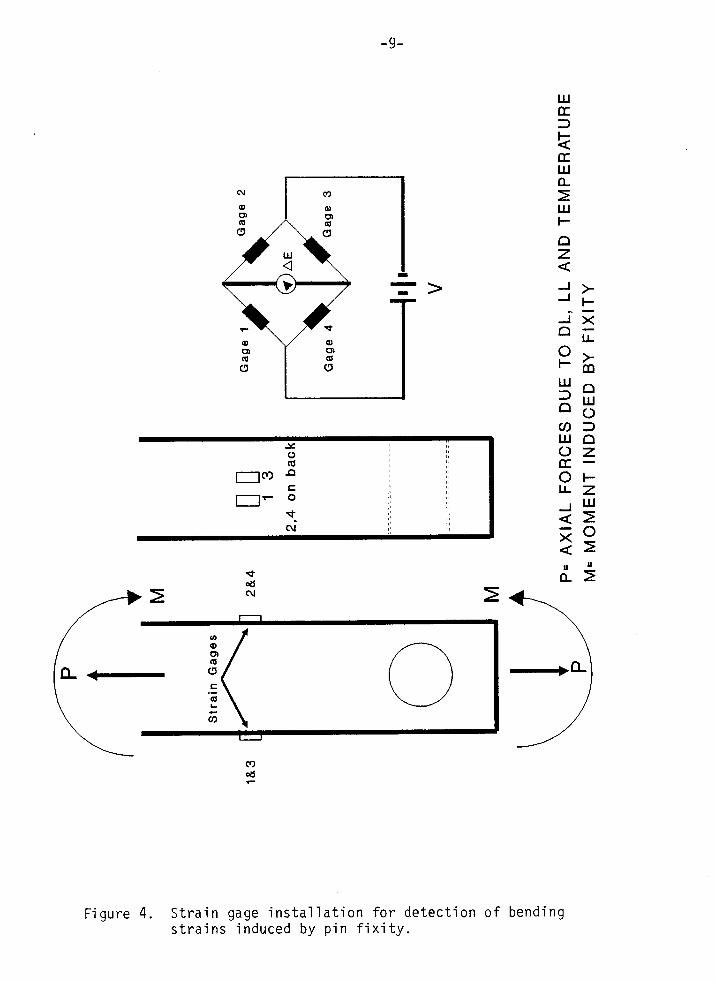
An electrical resistance strain gage installation was designed to
measure bending stresses in a hanger or link eyebar while being
2insensitive to axial stresses. See Figure 4. The theory behind this
method was that free pins would not introduce any bending stresses into
the hanger, while partially fixed and fixed pins would induce some degree
of bending. Several hangers on the 1-270 bridge and I-474 over the
Illinois River at Peoria were instrumented in this fashion. See Figure
5. This method has the advantage of being extremely sensitive to bending
stresses. The major drawbacks of this idea were: 1) strain gages can be -

-7-
Figure 2. Photograph of a mechanical, scratch-type pointer installed
on I-55 over Illlnois Route 29 at Springfield.

-8-
Figure 3. Photograph of a scratch-type pointer gage and a pointer
with a calibrated scale Installed on I-474 over the
Illinois River at Peoria.
-9-
>
z ;, ;;,, ,,,, !,,, ,,
mm ~ ,, ,,,, ,,,!
:
,, ,,
la”,, ,,,, !,
,, ,,
e ,, ,,,, ,,N-
!,,, ,,
// I 1
xa
-x
Figure 4. Strain gage installation for detection of bendingstrains induced by pin fixity.

-1o-
Figure 5. Photograph of weldable strain gages installed on a hanger
on 1-270 bridge.

-11-
difficult for untrained individuals to properly install and w
2) special equipment is necessary to take accurate readings, i
method would be more difficult to apply to small links.
re,
nd 3) this
Electronic Rotation Sensors
An electronic angle sensor was used in conjunction with the pointer
gage to provide sensitivity, accuracy and repeatability. The angle
sensor was mounted on the pointer arm. Rotation was detected by
recording an initial reading at a given temperature, then returning for
another reading when a large temperature change occurred. The problem of
tapping holes in a pin reduces the viability of this method. This method
was able to detect very small relative rotations of the order of 0.1
degrees. Another type of angle sensor was fitted with magnets so that it
could be mounted directly to the link eyebar. See Figure 6. This
configuration does not require any holes, but the instrument must be left
in place for the complete test. Two drawbacks of rotation sensors are
their cost and the fact that further stress analysis on pins and hangers
or link eyebars is difficult.
Loaded Truck Ouick-Stop Test
The biggest problem with all of the methods described is that the
movement to be measured is induced by temperature change; hence the best
comparisons are made between summer and winter. This “time delay” aspect
of the previous methods renders them all undesirable from the point of
view of obtaining a fast, accurate answer on fixity. The use of angle
sensors in conjunction with a loaded truck to induce pin and/or link
eyebar movement in cantilever girder bridges was investigated as a

-12-
Figure 6. Photograph of an electronic angle sensor installed on
Hazel Dell Road over I-55 in Springfield.

-13-
“quick-stop test” method. The equipment consisted of an angle sensor, a
chart recorder and a calibration box. The theory was that a loaded truck
(15-20 tons) could be driven onto the suspended span of the bridge and
stopped quickly to induce a longitudinal force into the bridge. The
angle sensors would measure any relative rotation between pin, link
eyebar, and stringer and these changes could be quantified by recording
thereon a chart recorder and referencing to a calibration input. The
applicability of this method is restricted to bridges with relatively few
pin connections, since the larger the bridge, the less force transmitted
to each individual pin. Preliminary results using this method were not
promising and the method was abandoned.
Results
After a very short exposure, the paper gages and paint stripes were
either completely degraded by weather or covered with bird droppings.
These methods produced no meaningful results and are not recommended for
use. The pointers worked slightly better, but still did not produce
meaningful data. The major drawbacks of the pointer method are that
holes must be drilled and tapped in either the pin or nut
anchor the pointer and that further stress analysis is not
hole in the end of a pin severely interferes with ultrason
n order to
possible. A
c inspection.
This method, therefore, is not recommended for u-se. The strain gages
installed on large hangers worked well, with the exception of some
problems with weatherproofing, which are easily corrected. A strain gage
circuit was also designed for link eyebars but was not field tested.
Meaningful data were produced by the strain gage method, as shown in
Chapter 4. This method is recommended for use as an analysis tool for

-14-
tracking fixity in cantilever truss bridges. The method would be useful
on cantilever girder bridges as well, given proper access for gage
installation.
The electronic rotation sensors were also able to provide meaningful
information, although less so than the strain gages. The question of
rotation is answered, but further stress analysis is more difficult.
Electronic rotation sensors are also much more expensive than strain
gages. The “quick-stop test” method did not work, probably because the
vehicle was too light and could not induce movement. Electronic rotation
sensors are not recommended for general application but are useful for
spot checks for thermal movement, especially at trouble spots on
cantilever girder bridges.
Overall recommendations are the use of strain gage installations,
especially on cantilever truss bridges, and spot use of electronic
rotation sensors on cantilever girder bridges. The practicality of
installing strain gage circuits on cantilever girder bridges remains to
be seen due to structure redundancy and level of effort needed to
instrument each bridge.

-15-
3. FINITE ELEMENT ANALYSIS
In order to generate approximate quantitative data on the maximum
expected torques and stresses resulting from complete pin fixity, three
finite element models were made using two cantilever truss bridges and
one cantilever girder bridge. The cantilever truss bridges modeled were
1-270 over the Chain-of-Rocks Canal and I-474 over the Illinois River at
Peoria. The cantilever girder bridge modeled was Hazel Dell Road over
I-55 in Springfield. The finite element program used was STRUDL.
Simulation of Pins in the Finite Element Analysis
A finite element model contains two types of nodes; free nodes and
support nodes. Free nodes experience displacements and/or rotations
according to structural analysis type. Free nodes in a truss analysis
disregard rotations since the truss assumption allows only axial forces.
Free nodes in a frame analysis may experience both displacements and
rotations. Support nodes are the points in the model which support the
model In space (e.g. piers and abutments). In a mathematical sense,
support nodes are where displacement or rotation boundary conditions are
applied. Support nodes may be modified to act as rollers, fixed points
with rotation allowed, elastically supported points or completely clamped
points. Support nodes experience reaction loads. Since the object of
the finite element analysis was to estimate loads on pins, the bridge
pins in the computer models were simulated by defining them as support
nodes. All displacements were released in order to simulate a free
node. The no fixity condition was simulated by allowing all rotations.
The full fixity condition was simulated by restricting the rotations.

-16-
1-270 Over Chain-of-Rocks Canal
The truss section of the Chain-of-Rocks
long. The cantilevered portion is 150 feet
is 180 feet long. The structure was built c
Canal bridge is 960 feet
ong, and the suspended span
rca 1960. The truss members
are riveted box sections and were modeled using line elements. Since the
truss members have oval holes (approximately 8 x 16 inches) cut in them
on approximately three-foot spacings, the net section properties were
used in the model for each individual member. Stringers, diaphragms, and
floorbeam flanges and stiffeners were also modeled as line elements. The
~loorbeam webs and the concrete deck were modeled with hybrid elements
which are a combination of plate bending and plane stress/plane strain
elements. Only half of the structure was modeled in order to take
advantage of symmetry. See Figure 7. Figure 8 shows a section of the
bridge as a finite element approximation. Pins are located at nodes M13
and G13. The model was checked graphically to check the accuracy of the
input geometry data and was subjected
overall displacement behavior. See F
temperature change was checked with s
to various static loadings to check
gure 9. Movement due to
mplified calculations (using a
constant coefficient of thermal expansion). The computer output for
thermal movement was within three percent of the simplified calculation.
This check does not necessarily prove either method to be correct, but
the close approximation of the two solutions indicates no gross modeling
errors. The torque on the pins for a temperature change of 50°F was
generated by the computer model and the resulting torsional shear stress
on the seven-inch diameter pins (ASTM A237 Class A Steel) was calcu-
lated from

-17-
U8
6
6
8 Panels@ 30 = 240’ 5 Panels@ 30”= 150’ 3 Panels@ 30’-904 * ~ -
ANCHOR SPAN CANTILEVER SPAN SUSPENDED SPAN
I
ISymmetrical about Q
Figure 7. 1-270 over Chain-of-Rocks Canal . Bridge is symmetricalabout the centerline.

Dummy Member
1U12 U13
tU14
7
. . . . . . . . . . . . . . . . . . . . . . .i
. . . . . . . . . . . . . . . . . . . . . . .
L12
1
LI 3 L14
Dummy MemberY~
XG
k ZG
Figure 8. Finite element approximation of a truss section near a hanger
on 1-270 over Chain-of-Rocks Canal. Pins are located at nodes
M13 and G13.

0.2
Def
o
Iect -0.2ion
-0.4inche -0.6
s
-0.8
50 Kips
~
Deflection Diagram for1-270 Bridge
(iNoiJeaa Load)
v50 KipS
,, I I ,, I I 1:
LO L2 L4 L6 L8 LIO LIZ L14 L16
Lower Chord Panel Point
F?gure 9. Static deflection diagram of lower chord of 1-270 bridge,without deadload effect.

-20-
Tt =TJ (1)
J
Where Tt = Torsional shear stress on pin (ksi)
T = Torque on pin (kip-inches)
r = Radius of pin (inches)
J = Polar area moment of inertia (inches4)
= ~4 where d = diameter of pin (inches)32
Torques and resulting torsional shear stress for this bridge are
shown in Table 1. The torque data generated was compared to a simplified
calculation based on angles developed using slope-deflection methods.
The difference between the average of the finite element data and the
simplified calculation was 5.7%.
TABLE 1
TORQUE AND TORSIONAL SHEAR STRESS ON SEVEN-INCHDIAMETER PINS (1-270) COMPLETELYFIXED
PIN DESIGNATION TOROUE(KIP-IN) TORSIONALSHEAR STRESS (KSI)
M13 (Upper) 2102 31N13 (Upper) 2103 31G13 (Lower) 2218 33H13 (Lower) 2218 33
Using distortion energy yield criteria the yield strength in shear
is given by:
Ssy = 0.667Sy (2)
Where Ssy = Yield strength in shear (ksi)
Sy = Yield strength in tension (ksi).

-21-
The tensile yield strength for ASTM A237-A is 50 ksi. Therefore,
the shear yield strength for these pins is 33 ksi. As indicated in Table
1 above, completely fixed pins on this bridge, subjected to a thermal
differential of 50°F, experience shear stresses equal to or very close
to the shear yield strength, even without considering ambient shear
stress in the pins resulting from dead load, live load, and impact.
Ambient shear stress in the pins for this bridge based on dead load, live
load, and impact are on the order of 6 ksi. It should be noted here that
the completely fixed pin joint used in the computer model (equivalent to
a frame connection) allows absolutely no rotation.
I-474 Over Illinois River
The truss section of this bridge is 1,140 feet long. The
cantilevered span is 150 feet long, and the suspended span is 240 feet
long. The structure was built circa 1970. This structure was
computer-modeled similarly to the previous 1-270 bridge analysis. Marked
physic~l differences, in addition to respective span lengths and the
resulting differences in sectional properties, between this and the 1–270
bridge
38 ‘-(j”
on the
include total width (45’–3” center to center of trusses versus
for 1-270), increased use of welded members on I-474, especially
suspended span, and use of K-bracing for the upper and lower
lateral bracing on
differences do not
respective bridges
I-474 as opposed to X-bracing on 1-270. These
materially affect the gross structural behavior of the
and are mentioned only in order to note that the two
bridges are dissimilar in other ways bes
significant difference from a pin fixity
length sleeve to cover the pins on I-474
des length. The most
standpoint was the use of a full
Modeling and checking methods ~
-22-
were similar for both bridges. Pin torques and shear stresses are shown
in Table 2.
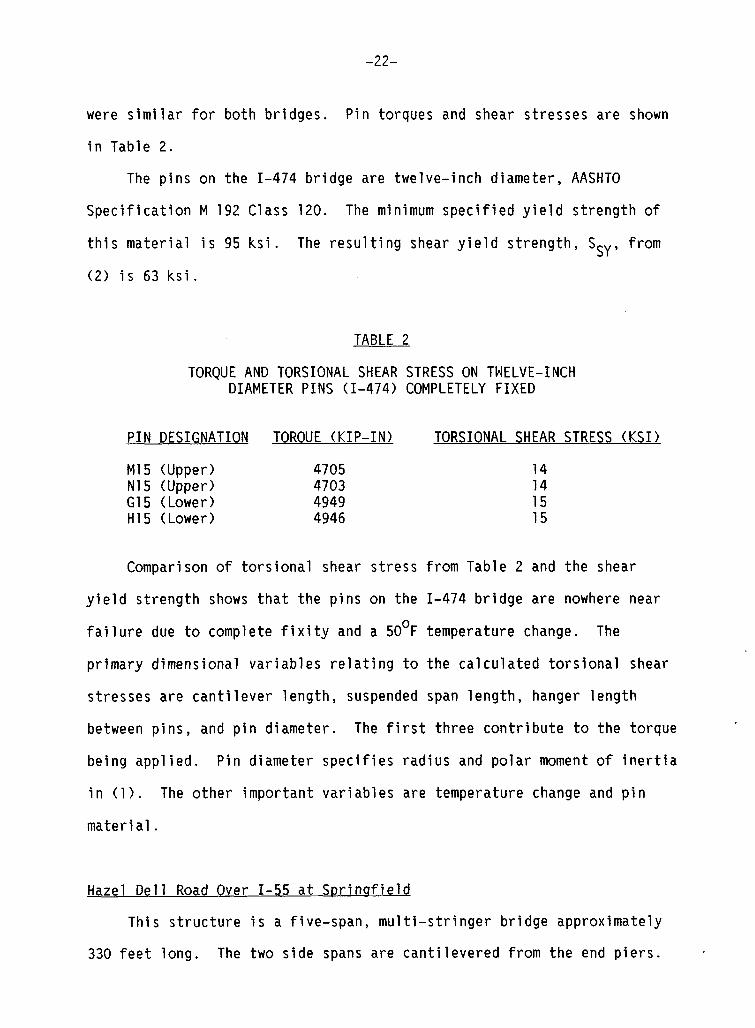
The pins on the I-474 bridge are twelve-inch diameter, AASHTO
Specification M 192 Class 120. The minimum specified yield strength of
this material is 95 ksi. The resulting shear yield strength, S5Y, from
(2) is 63 ksi.
TABLE 2
TORQUE AND TORSIONAL SHEAR STRESS ON TWELVE-INCHDIAMETER PINS (I-474) COMPLETELY FIXED
PIN DESIGNATION TOROUE (KIP-IN) TORSIONAL SHEAR STRESS (KSI)
M15 (Upper) 4705 14N15 (Upper) 4703G15 (Lower) 4949 ::H15 (Lower) 4946 15
Comparison of torsional shear stress from Table 2 and the shear
yield strength shows that the pins on the I-474 bridge are nowhere near
failure due to complete fixity and a 50°F temperature change. The
primary dimensional variables relating to the calculated torsional shear
stresses are cantilever length, suspended span length, hanger length
between pins, and pin diameter. The first three contribute to the torque
being applied. Pin diameter specifies radius and polar moment of inertia
in (l). The other important variables are temperature change and pin
material.
Hazel Dell Road Over I-55 at Springfield
This structure is a five-span, multi-stringer bridge approximately
330 feet long. The two side spans are cantilevered from the end piers. ,

-23-
The suspended portions span from the abutments to the ends of the
cantilevers. See Figure 10. Thermal movement is accommodated with
expansion joints in the side spans at the ends of the cantilevers. The
suspended portions are supported using pin–link eyebar connections. The
pins are three inches in diameter and are three inches long between each
shoulder. Total pin length, including threads, is 5.75 inches. This
bridge was modeled completely since some asymmetries exist. Stringers
are on 5’-9” spacings. The pins were simulated as with the previous
truss bridges. This model was checked for geometry, static deflection,
and thermal expansion. The maximum torque produced by a 50°F
temperature differential was 50.4 kip-inches. The resulting torsional
shear stress is 9.5 ksi. Ambient pin shear stresses due to dead load and
live load are on the order of 1.5 ksi. However, when the torque induced
in fixed pins due to live load is considered, the maximum torque is 767.5
kip-inches and the maximum shear stress on the pins is 144.8 ksi,
“ assuming completely elastic behavior. The pin material was ASTMA36
steel with a shear yield strength of 24 ksi. The pin is by calculation
clearly yielded. A completely fixed condition for these pins results in
permanent deformation and possible rupture. Even though the computer
model represents worst case conditions, very high shear stresses may be
assumed to be induced in pins which are becoming fixed due to corrosion.
Stresses In Hangers and Link Eyebars
The major focus of this investigation was on pins. However, the
potential for failure of the hangers or link eyebars due to fixity-
induced loadings was also investigated. Fixity induces stresses into
connecting members which are not considered in design assumptions.

-24-
24’-10* 1s4” 15’-6” 27’- 10”
“-”~ ‘-’ “4”-——Y——— “-”~
{
\
Figure 10. Hazel Dell Road over I-55 in Springfield, Illinois.

-25-
Ambient hanger tensi’
based on loads given
bridges studied were
e stresses due to dead load, live load, and impact,
in the design plans for the two cantilever truss
on the order of 16 ksi. The torque moment induced
by fixity also induces bending stresses in the hanger members. These
stresses were on the order of 14 ksi at the nominal section of the
hanger. The combination of these stresses approaches the yield strength
for mild (ASTM A36) steel, and could be further increased by the
existence of various stress concentrations such as surface pitting, wear
scores, or notches. Fatigue damage of the components could also be a
concern, even for members which are not complete”
temperature changes, especially common in spring
daily cyclic loadings sufficient to produce cumu”
fatigue aspect should be studied in more detail.
y fixed. Large
and fall, would produce
ative damage. This
The link eyebars on cantilever girder bridges can develop high
stresses, especially near the pin holes. Ambient axial stresses in the
link eyebars due to dead load and live load, based on finite element
data, were on the order of 7 ksi for free pins. Considering the stress
concentration factor for a plate loaded in tension by a pin through a
hole, with clearances to be 3.6, this results in a peak stress of 25
ksi. This stress level is even higher when fixity is considered. Using
the data generated by the finite element model, the shear stress on the
links induced by live load with fixed pins is on the order of 31 ksi at
the outer periphery of the link eyebar, near the pin. Thus, both
eyebars and pins are in jeopardy when complete fixity is present
detai 1. Again, these numbers were generated for the detail in a
completely fixed condition. Fixity, or even partial fixity, in p
eyebar details is a serious condition and should be scheduled for
link
n the
n-link
quick ~
repair using a retrofit detail which will alleviate the problem, not just
postpone it.

-26-
4. EXPERIMENTAL STRESS ANALYSIS
Instrumentation and stress analysis using strain gages on large pin
connections in cantilever truss bridges is discussed in this chapter.
The basic configuration of the instrumented location was shown in
Figure 4. The Wheatstone bridge circuit relevant to this application is
shown in Figure 11. Using the notation shown in Figure 11, let &B be
the bending strain due to the applied moment M (due to fixity) and let
&p be the axial strain due to dead load, live load and thermal effects.
The basic rule of the Wheatstone bridge is that adjacent arms subtract
and opposite arms add (algebraically). The output from Gages 1 and 3 is
CB +Cp each. The output from Gages 2 and 4 is -&B+&p each. The
output from the total circuit is Gage 1 - Gage 2 + Gage 3 - Gage 4.
Therefore,
OUTPUT = 4zB (3)
or, ‘B = ouTPuT/4 . (4)
Where OUTPUT is the reading given by the strain gage Indicator.
circuit, therefore, provides high sensitivity to bend
compensation, and insensitivity to axial load effects
measured by this installation are due to bending.
The bending stress is then calculated from
ng, therms
This
The only strains
(5)

-27-
-c +B
-c +B
E
Figure 11. Wheatstone bridge circuit diagram for measurement of bending
strains with insensitivity to axial strains.

-28-
Where E is the elastic modulus for steel.
The bending moment is calculated from:
M= aBIc
Where M = Bending moment (kip-in)
‘B = Bending stress (ksi) calculated from strain gage data.
(6)
I = moment of inertia of instrumented section about
the appropriate axis (inches4).
c = distance from the centroid of the instrumented
section to the outer fiber (strain gage thickness
is ignored) (inches).
This bending moment is then used as torque T in (1) to ca
torsional shear stress on the pin.
The procedure used for data collection was to collect Inl.
culate the
ial
reference strain and surface temperature data, then collect strain and
temperature data at a later date. From these data temperature
differential and bending strain are calculated. The strain gages used
were weldable, electrical resistance foil strain gages manufactured by
MicroMeasurements of Raleigh, North Carolina. The
was also
Tab’
1-474 br
strain gage indicator
manufactured by MicroMeasurements.
es 3 and 4 present data collected and ana’yzed for the 1-270 and
dges, respectively. Only lower pins were instrumented.

-29-
TABLE 3
STRAIN GAGE DATA AND ANALYSIS FOR1-270 BRIDGE
Stress TorsionalTemperature Strain in hanger Moment stress (shear)
GAGE AT ~B ‘B MLOCATION* (Deg F) (10-6 in/in) (ksi) (kip-in)
EB-W-U
EB-E-U
WB-W-D
WB-E-D
WB-14-U
WB-E-U
GAGE
51 101.25 3.0375 718.34
INSTALLATION DESTROYED
INSTALLATION DESTROYED
INSTALLATION DESTROYED
42 31.0 0.93 219.94
64 87.5 2.63 620.79
TABLE 4
STRAIN GAGE DATA AND ANALYSIS FORI-474 BRIDGE
Tt
(ksi)
10.67
3.27
9.22
Stress TorsionalTemperature Strain in hanger Moment stress (shear)
AT ‘B *B M ‘tLOCATION* (Deg F) (10-6 in/in) (ksi) (kip-in) (ksi)
WB-E-U 21 33.75 1.01 394.27 1.16
WB-W-U 22 11.75 0.35 136.63 0.40
WB-E-D INSTALLATION DESTROYED
WB-W-D 21 21.75 0.65 253.74 0.75
*For example, EB-W-U stands for eastbound, westside, upstream.

-30-
(8)
The total shear stress, TT, is then
TT=Ta+Tt
Where Ta = ambient shear stress from dead load, liveload and impact.
Tt = torsional shear stress in pin due to fixity effects. .
The total shear stress may then be compared to the shear yield strength
of the material, given by (2).
In Chapters 3 and 4, two separate, important methods of analysis
were discussed. Finite element analysis was used to estimate the maximum
effect of complete fixity on pin connection details. This type of
analysis could indicate whether complete pin fixity in a particular
bridge is a serious potential problem or not. In NCHRP Report 333,
Kulicki, et al,4suggest a hand calculation method for evaluating the
magnitude of the bending moments induced in a hanger due to completely
fixed pins. This method could be useful in the absence of a finite
element analysis for establishing the level of shear stress in pins due
to fixity for cantilever truss bridges. The experimental stress analysis
is needed to actually determine the torsional shear stresses induced in
pins due to an unknown degree of fixity. These stresses, combined with
the ambient shear stress calculated from design loads, may be compared to
the shear yield strength for a given pin material, as shown above.

-31-
5. ULTRASONICPIN INSPECTION
This chapter discusses the development of an ultrasonic pin
inspection procedure, results and unit costs of two pilot inspection
contracts, overall results, and comparison of ultrasonic test techniques
to detect defects in the form of machined notches of known depth.
There are many pin-and-link eyebar configurations in use in Illinois
bridges. This variety comes from the fact that consultant designers were
given wide latitude to provide a detail which would satisfy design stress
criteria. As a result, pins vary by diameter, length (both total and
threaded), shoulder depth, and retaining method. This wide variation of
pin geometry requires a very flexible pin inspection procedure.
Ultrasonic testing was chosen as the principal inspection method because
visual inspection and magnetic particle methods provide limited
information, and both acoustic emission and radiographic testing are
costly and time consuming.
Development of Procedure
It was decided very early in the project that the inspection
procedure must be sufficient to provide nearly 100% coverage of the load
bearing portion of the pin from the pin face. In order to accomplish
this, two scanning methods were included in the procedure. Longitudinal,
or straight beam scanning, is used for detection of flaws such as large
cracks or wear grooves. Angle beam, or shear wave scanning, is used to
provide additional coverage of the pin during inspection. Wedge angle
selection is typically 20, 30, or 45 degrees. Angle beam testing can
generally detect small defects that cannot be detected during straight ~
beam testing due to shoulder depth. A 3.5 MHz, l/2-inch diameter

-32-
quick-change transducer was selected to provide a combination of
sensitivity, depth of penetration, and low beam divergence.
No available standard reference block had features that would allow
calibration of a 20 degree wedge, so a suitable reference block was
developed. The Distance and Sensitivity Calibration - Pin (DSC-P)
calibration block was fabricated by in-house machinists for calibrating
straight beam transducers and the 20, 30, and 45 degree wedges to a
0.06-inch diameter hole. The DSC-P block is shown in Figure 12.
The Reference Levels for straight and angle beam testing are the
gain setting needed to bring the 0.06-inch diameter hole in the DSC-P
calibration block to 50% screen height. When calibrating for
sensitivity, the sound path for shear wave testing was the same as that
used for straight beam. Scanning level is typically 18-20 dB above the
Reference Level. The complete procedure, including data recording
sheets, is given in Appendix A.
Pin Inspection Contracts
Two pilot contracts were let for initial ultrasonic pin testing of
all state-maintained cantilever girder bridges. These contracts were
conducted in the summers of 1989 and 1990. A different consultant was
used for each contract. Inspectors were required to be certified as
Level II UT inspectors. All access and traffic control was supplied by
the Department. Each consultant was provided with a DSC-P calibration
block and detailed drawings showing pin cross sections.

$u’-’
‘ ,s
,,+6”
I
,-./6.
(!.1‘1
,.s1./I
I//.s0.1
I
I
1-CI
Q
I~1
_//
1
c.-Lr
..
III
‘d.-..
Figure12.
Distanceand
SensitivityCalibration-Pin
(DSC-P)calibration
blockdeveloped
foruse
withpin
inspections.

-34-
1989 Ins~ection Contract
The inspections started on August 3, 1989 and ended on 0ctober”5,
1989. The department provided surface preparation of the pin faces. All
paint, rust, and debris was removed by small grinding tools. The
inspectors used a plain center punch to identify the twelve o’clock
position on the A face (see Appendix A) of all pins to provide a
consistent reference point for future inspections.
Forty-four structures containing 813 pins were inspected during this
contract. Department personnel evaluated all inspection reports and
placed sixteen structures on a two year inspection frequency. The
inspection frequency was roughly correlated to a condition rating
assigned to each structure based upon the Indication Ratings of the pins.
The lowest recorded Indication Rating was - 4dB on one pin in a
structure with multi-girder, single pin, suspended spans. This indicates
that 4dB less gain was needed to bring the indication to 50% screen
height compared to the reference signal. On removal, it was apparent
that wear grooves in the pin of approximately 3/8-inch were the cause of
the low Indication Rating. The original pin diameter was 2-1/2 inches.
See Figure 13.
Problems were encountered in testing
cotter pins in each end. The interference
testing, especially with the angle beam tri
believed some pins could not be tested due
ink pins with nut-retaining
from the drilled hole hampered
nsducer. The consultant
to severe scattering of the
sound beam due to the pin alloy or its heat treatment, such as
carburizing.
The consultant’s final report included a summary of procedures used, ~
modifications to the procedures developed by the Department and

-35-
recommendations for improving the procedures, a summary of structure
numbers and locations where defects were found and the Indication Rating
of the defects, and a special summary of any significant defects found.
1990 Inst)ection Contract
The inspections started on June 20 and ended on October 25, 1990.
A drawing was required of each structure in plan view showing how the
consultant labeled each girder and pin so the layout could be duplicated
for future inspections. The consultant was also required to document the
method of access to the pins.
The consultant was instructed to assign a subjective fracture
critical appraisal rating to each structure based on the assessment of
the overall condition of the pins. The rating is an arbitrary number
from O-8 derived from the ultrasonic measurements which indicates the
overall condition of a fracture critical member. See Appendix B. The
consultant was inspecting two types of fracture critical structures;
Multi Girder System - Suspension Links and Pins, Code Gl, and Multi
Girder Systems Suspension Single Pins, Code GZ. The 1989 consultant
inspected the same structure types but was not required to assign the
ratings. Eighty-six structures were inspected under this contract.
The consultant assigned a fracture critical rating of O-8 to each
structure. A rating of 6 or less placed the structure on a two-year
ultrasonic inspection frequency. A rating of 7 or 8 placed the structure
on a five-year ultrasonic inspection frequency. Forty-two of the
eighty-six structures were given an appraisal rating of 6 or less and.
were placed on a two-year inspection frequency.
To improve calibration the consultant recommended a model be made
with the same material and geometry as each in-service pin. The model

-36-
,,
.,,’
,,,
\
Figure 13. Photograph of pin with deep wear grooves.

-37-
should contain a flaw that would allow a pass-reject test instead of
determining Indication Ratings. An analysis of this notched pin vs. dB
indication can be found on page 38.
Overall Results
A total of 130 structures containing 3,165 pins were inspected at a
unit cost of $73.60 per pin. This unit cost includes both consultant and
indirect labor and equipment costs to the state. Table 5 shows the
distribution of structures with fracture critical appraisal ratings
ranging from zero to eight. The resulting inspection frequencies are
also shown.
TABLE 5
DISTRIBUTION OF STRUCTURES WITH FRACTURECRITICAL APPRAISAL RATINGS OF O-8
Appraisal Rating 8765432 10
No. of Structures 23 50 39 11 5 2 0 0 0
Inspection Frequency, yrs 5 5 2 2 1 1 - - -
Nearly all structures were inspected in one or two working days. A
couple of large structures required up to four working days.
Based on the experience with these two pilot contracts, some changes
were made in the inspection procedure. These changes included deleting
an adjustment factor based on shoulder depth and use of a reference pin
for each individual bridge. The adjustment factor .was deleted because it
increases the gain level used for scanning and resulted in too much back-
ground noise, which is often referred to as oscilloscope “grass”. This
background noise ’often obscured the real defect. In response to future

-38-
testing requirements, IDOT created an in-house ultrasonic testing unit
within its Bureau of Bridges and Structures. To provide for a better
inspection program, a library of pins and plans for each structure in the
state with pin details is being developed. This library will allow the
inspector to carry a pin of the same geometry with known defects, to a
specific bridge and compare inspection results to the reference pin. The
procedure still uses a round hole to calibrate for a groove or crack.
No pins were found to have large cracks or sustain complete
fractures. Large cracks or partial fractures are immediately apparent on
the instrument CRT screen as shown by the loss or reduction of back echo
from the opposite pin end. Many carburized pins, even those installed as
recently as two years ago, tend to have more severe Indication Ratings
than many in-service untreated pins. These ratings are attributed quench
microcracks in the pin surface and the difference in sound transmission
in high carbon vs. low carbon steel. From an ultrasonic inspection
viewpoint, continued use of carburized pins is not recommended due to the
severity and number of indications.
Comparison of Defect Size with Test Results
A testing program was conducted to try to relate ultrasonic
inspection results to defects of known size and location. The test
program included straight-beam, 20-, 30-, and 45-degree shear beams
ng
The
transducer frequency was 3.5 MHz. TWO specimen types were used. One was
an actual pin removed from a bridge. This three-inch diameter pin had a
3/8-inch shoulder, 1.25-inch threaded length on both sides, and was 7.25
inches long. The surface of the pin was slightly pitted, and had very
shallow (about l/32-inch) wear grooves. The pin material is unknown, but r
was assumed to be ASTM A36 steel. The other specimen was a longitudinal

-39-
cross-section of the same pin geometry. Two of these specimens were
fabricated from 3/4-inch ASTM A572 steel plate.
The defect used in this testing program was a l/16-inch nominal
width saw-cut notch which had varying depth and spacing. For the pin
specimen, the notch depths used were 1/16-, 1/8-, 1/4-, and l/2-inch. By
judicious placement of the notches, several sound path distances for each
notch were achieved. For the plate specimens, the notch depths were
1/16-, 1/8-, 1/4-, and 3/8-inch. Each side of each specimen had a
constant notch depth. Seven notches were placed at l/2-inch spacings
beginning two inches from the side of the specimens.
The collected data were analyzed for three cases: 1) use of
unadjusted data only, 2) use of the IDOT developed pin inspection
procedure, and 3) use of the developed pin inspection procedure but
without application of the distance attenuation correction factor.
Tables 6 and 7 show average and standard deviation for each case for the
pin and the plate specimens, respectively. These data were also plotted
as shown in Figures 14 through 21. The plots show the data scatter in
the form of error bands. The size of each error band is plus and minus
one standard deviation from the average.
The following observations are made from the data:
1) In almost every case, the difference between the inspection
procedure with and without distance attenuation is very small.
This suggests that the distance attenuation correction factor
is not really needed.
2) The longitudinal beam data show a reasonable variation with
notch depth, especially for the data from the pin specimen.
The longitudinal beam data from the plate specimen show an
inability to differentiate between 1/16- and l/8-inch notches.

TRANSDUCER
Long. Beam
20-deg.
30-deg.
45-deg.
-40-
TABLE 6
ULTRASONIC DATA FOR NOTCHES OF KNOWNDEPTH AND LOCATION IN AN ACTUAL PIN*
NOTCH DEPTH (INCHES)
0.0625” 0.125” 0.250”
m std dev m std dev a std dev
73.5 (3.2) Unadjusted data 60.0 (4.1)
22.8 (5.2) IDOT procedure 9.3 (3.6)
21.5 (3.2) IDOT w/o Dist. 8.0 (4.1)
63.5 (1.9) Unadjusted data 64.3 (4.6)
-15.8 (1.8) IDOT procedure -18.6 (3.9)
-14.5 (1.9) IDOTw/oDist. -17.7 (3.9)
63.0 (4.8) Unadjusted data 55.0 (1.4)
-14.4 (5.0) IDOT procedure -22.6 (1.4)
-13.0 (4.8) IDOT w/oDist. -21.0 (1.4)
59.0 (2.6) Unadjusted data 54.0 (5.7)
-24.8 (2.8) IDOT procedure -30.1 (5.7)
-23.0 (2.6) IDOT w/o Dist. -28.0 (5.7)
54.0 (4.7)
3.4 (2.8)
2.0 (4.7)
69.3 (5.6)
-11.0 (5.8)
-10.7 (5.3)
52.0 (0)
-25.6 (0)
-24.0 (0)
52.0 (1.4)
-32.1 (2.8)
-31.0 (4.2)
0.500”
M std dev
42.5 (5.3)
-8.3 (8.4)
-9.5 (5.3)
N/O
N/O
N/O
53.0 (1.4)
-24.6 (1.4)
-21.0 (1.4)
N/O
*Data shown are averages for varying numbers of collected data points.
N/O
N/O
N/O = not obtainable due to geometry of that specimen.

-41-
TABLE 7
ULTRASONIC DATA FOR NOTCHES OF KNOWN DEPTHAND LOCATION IN PLATE SPECIMENS*
NOTCH DEPTH (INCHES)
0.0625” 0.125”
TRANSDUCER ~ std dev m std dev
Long. Beam 72.50(2.2) Unadjusted data 72.0 (3.3)
21.1 (1.8) IDOT procedure 21.1 (3.5)
19.9 (2.3) IDOT w/o Dist. 19.9 (3.5)
20-deg. 71.2 (5.0) Unadjusted data 61.6 (4.3)
-10.5 (7.4) IDOT procedure -20.0 (9.7)
-10.5 (7.4) IDOT w/oDist. -20.4 (5.1)
30-deg. 63.4 (2.7) Unadjusted data 69.1 (9.1)
-13.9 (3.0) IDOT procedure -8.2 (3.9)
-13.4 (2.1) IDOT w/o Dist. -7.6 (4.6)
45-deg. 79.3 (1.2) Unadjusted data 75.0 (4.2)
4.9 (1.4) IDOT procedure -9.6 (3.8)
- 2.7 (1.2) IDOT w/o Dist. -7.0 (4.2)
0.250” 0.375”
m std dev M std dev
65.4 (3.0) 59.4 (4.3)
14.7 (3.0) 8.7 (5.8)
13.4 (3.0) 7.4 (4.3)
63.0 (8.1)
-20.3 (9.6)
-19.0 (10.9)
66.2 (5.0)
-11.1 (4.8)
-10.4 (5.5)
57.5 (5.3)
-26.9 (4.7)
-24.5 (5.3)
58.3 (5.3)
-23.2 (6.7)
-23.1 (6.8)
77.7 (2.1)
0.6 (3.1)
1.4 (2.5)
78.0 (2.8)
-7.2 (3.2)
-4.0 (2.8)
*Data shown are averages for varying numbers of collected data points.

-42-
3) The angle beam data do not show any reasonable relations to notch depth.
The data are widely scattered and show large statistical variation.
Further work is needed to establish a correlation between inspection results
and actual defect size. Such work should include higher frequencies,
compression wave transducers, and other defect shapes. More work is also
needed to develop an adequate procedure to inspect link eyebars and link
plates for cracks.

-43-
80
-20
Ultrasonic Data For Actual Pin SpecimenStraight Beam l?ansducer
f=3.5MHz ~
c “-
-“-””-”” -“-;”>”:-:-~-”’ ---..........................
-II
“~.~
-. ---- 2......-............................................... .........
K““”**-....... .-..t*,,*...... ....-............. ------......-----..----..-- ““*
-* x ●-----...-.,__--+_.. .......‘>
H
*-.‘**
. . . . . . . . . . . . . . . . . . . . . . . . . . . . . . . . . . . . . . . . . . . . . . . . . . . . . . . . . . . . . . . . . . . .
1/16 118 1/4 1/2
Notch Depth (inches)
‘~- db Level Required To Put Signal At--- 50% Screen Height (No Distance or Reference Compensation)-—
* IDOT Procedure-—... .,.
0 IDOT Procedure Wtihout Distance Attenuation Correction Factor. . . . . .
Bands Show +/- 1 Std Dev. From Average
Figure 14. Ultrasonic test data for an actual 3-inch diameter pin
specimen using a straight beam transducer. Figure shows
unadjusted data, results from IDOT procedure, and results
from IDOT procedure without distance attenuation correction
factor.

-44-
Ultrasonic Data For Actual Pin Specimen20 Degree Angle Beam Transducer
f=3.5MHz
.~“~.—-— 1 3.....-.~.m —. . . . . . . —.=. .-. : . . . . . .. ---- . . . . . . . . . . . . . ----- --
. . . . . . . . . . . . . . . . . . . . . . . . . . . ----- . . . . . . . . . . . . . . . . . . . . . . . . . . . . . . . . -----
. . . . ..- . . . . . . . . . . . . . . . . . . ------- . . . . . . . . . . . . . . . . . . . . . . . . . . . . . . . . . . . .
. . . . . ..s..”... ---”-~I
1 3 .W,mm e?..
t
. . . . . . . . . . . . . . . . . . . . . . . . .
I1
ln6 1/8 1/4 1/2
Notch Depth (inches)
‘~- db Level Required To Put Signal At---50% Screen Height (No Disknce or Reference Compensation)
--*
--,, ...,0......
IDOT Procedure
IDOT Procedure Without Distance Attenuation
Bands Show +/- 1 Std Dev. From Average
Correction Factor
Figure 15. Ultrasonic test data for an actual 3-inch diameter pin
specimen using a 20 degree angle beam transducer. Figure
shows unadjusted data, results from IDOT procedure, and
results from IDOT procedure without distance attenuation
correction factor.

60
-20
-40
-45-
Ultrasonic Data For Actual Pin Specimen30 Degree Angle Beam Transducer
f=3.5MHz
r ‘-........ ......-....=. . ..........................--------------— “=-+-i-..~, —*~”.a
. . . . . . -. . . . . . . . . . . . . . . . . . . . ----- ------ ------ . . . . . . . . . . . . . . . . . . . ..-. . .
. . . . . . . . . . . . . . . . . . . . . . . . . . . . . . . . . ..- . . . . . . . . . . . . . . . . . . . . . . . . . . . . ..-. .
E -m. *m -w. 4.$’~*;+.*..m*fl_ --- “ *. . . . . . . .
I
““”””-------- ”%--””””-%-.~ ---”-----**W++.** . . . . . . .
I I
-m-
o---
—-
*
--
.* **..
0. . . . . .
.-1/16 118 114 1/2
Notch Depth (inches)
db Level Required To Put Signal At50?40Screen Height (No Dist&nce or Reference Compensation)
IDOT Procedure
IDOT Procedure Without Distance Attenuation Correction Factor
Bands Show +/- 1 Std Dev. From Average
Figure 16. Ultrasonic test data for an actual 3-inch diameter pin
specimen using a 30 degree angle beam transducer. Figure
shows unadjusted data, results from IDOT procedure, and
results from IDOT procedure without distance attenuation
correction factor.

-46-
---❑
✍✍✍
✍✎☛
�✍
✎✎✎✎✎✎
00 .0...
Ultrasonic Data For Actual Pin Specimen45 Degree Angle Beam Transducer
f=3,5MHz
. . . . . . ..~==-..— ~.,.< : . . . . . . . . . . . . . . . . . . . . . . . . . . . .“~. J —=—”
,- . . . . . . . . . . . . . . . - . . . . . . . . . . . . . . . . . . . . . . . . . . . . ---- ------ ------ ------ .-.
. . . . . . . . . . . . . . . . . . . . . . . . . . . -------- --------- --------- --------- --------,
. . . . . . . .&:’z-”-;;J----:-:-~--”””””””-”--””-----”----’I 3““~..a..=,, -m m---
l/16 118 114
Notch Depth (Inches)
db Level Required To Put Signal At50?40Screen Height (No Distance or Reference
1/2
Compensation)
IDOT Procedure
IDOT Procedure Without Distance Attenuation Correction Factor
Bands Show +/- 1 Std Dev. From Average
Figure 17. Ultrasonic test data for an actual 3-inch diameter pin
specimen using a 45 degree angle beam transducer. Figure
shows unadjusted data, results from IDOT procedure, and
results from IDOT procedure without distance attenuation
correction factor.

---❑
✍✍✍
✍�☛
✍✍
✎✎✎✎✎✎
0......
-47-
Ultrasonic Data For A572 Plate SpecimenStraight Beam Transducer
f=3.5MHz
=:=:= *==____“~.
. . . . . . . . . . . . . . . . . . . . . . ..4 . . . . . . . . . . . . . . ---- t.~ 3.~. .... .........-------................................----................. ........
......S=:zz”z-z!s:::: --:”~-=::: i;;”- ‘-----”----
q--,~,~ ‘*
. . . ..-. . . . . . . . . . . . . . . . . . . . . . ..-. . . . . . . . . . . . . . ---- . . . . . . . .. . . . . . . . . -.
t .—ln6 118 114 318
Notch Depth (Inches)
db Level Reauired To Put Signal At50% Screen Height (No Dist&nce or Reference Compensation)
IDOT Procedure
IDOT Procedure Without Distance Attenuation Correction Factor
Bands Show +/- 1 Std Dev. From Average
Figure 18. Ultrasonic test data for a plate specimen of ASTM A572 steel
using a straight beam tranducer. Pertinent specimen geometry
was the same as that of the tested pin specimen. Figure
shows unadjusted data, results from IDOT procedure, and
results from IDOT procedure without distance attenuation
. correction factor.

-48-
---0
---
--*
--
. . . . . .
0,. ..,,
Ultrasonic Data For A572 Plate S ecimen$20 Degree Angle Beam Trans ucer
f=3.5MHz
. . . . . . .
. . . . . . .
. . . ..- .
(
-- . . . . ..
-.
-. “-............~
. . . . . . . . . . . . . . . . .
. . . . . . . . . . . . . . . . .
=:-Z:-2-Z:-G:Z-------.....................................-----............................................
1/16 118 114
Notch Depth (Inches)
db Level Required To Put Signal At50?40Screen Height (No Distance or Reference
IDOT Procedure
3/8
Compensation)
IDOT Procedure Without Distance Attenuation Correction Factor
Note : Bands Show+/- 1 Std Dev. From Average
.
Figure 19. Ultrasonic test data for a plate specimen of ASTM A572 steel
using a 20 degree angle beam tranducer. Pertinent specimen
geometry was the same as that of the tested pin specimen.
Figure shows unadjusted data, results from IDOT procedure,
and results from lDOT procedure without distance attenuation
correction factor.

-49-
Ultrasonic Data For A572 Plate S eciment30 Degree Angle Beam Trans ucer
f=3.5MHz
60’ ..~=~ I
—=—.3
.60 - F .~=—i—=—...........................................,.=.:.=.............
s~40 “ ------ - ------ ------ . . . . . . ------ . . . . . . . . . . . . . . . . . . . . . . . . . . . . . . . . ..-. -.
20 -------- ----------- ”------ ------------------ b.- . . ..- . . . ..-. . . . . . . . . . . .
0 .
-20 . . . . . . .
- r=;=;=F”;;:
I
l/16 1/8 114 318
Notch Depth (inches)
~~~ db Level Required To Put Signal At50% Screen Height (No Distance or Reference Compensation)
‘*- IDOT Procedure--,,, .,,
0 IDOT Procedure Without Distance Attenuation Correction Factor. . . . . .
Bands Show +/- 1 Std Dev. From Average
Figure 20. Ultrasonic test data for a plate specimen of ASTM A572 steel
using a 30 degree angle beam tranducer. Pertinent specimen
geometry was the same as that.of the tested pin specimen.
Figure shows unadjusted data, results from IDOT procedure,
and results from IDOT procedure without distance attenuation
correction factor.

-50-
Ultrasonic Data For A572 Plate S ecimen(!?45 Degree Angle Beam Trans ucer
f=3.5MHz
80 ----.--”:
Z 60 - . . . . . . .~
jg40 ----”””-m
: 20 ---” ----al
IQo ,
-20 - . . ..-. .
---❑
✍✍✍
✍�
☛✍�
✎✎✎✎✎✎
0.,, .,,
–-”—”-li:---”------”----”-;->”p-----”---. ~.~................. -1........-..<..~...L. L. ........
.........................----------- ................. ........
.........................................-.----------- ........
1
1..............--- ........
.-1/16 118 114 3/8
Notch Depth (inches)
db Level Required To Put Signal At50?40Screen Height (No Distance or Reference Compensation)
IDOT Procedure
IDOT Procedure Without Distance Attenuation Correction Factor
Bands Show +/- 1 Std Dev. From Average
Figure 21. Ultrasonic test data for a plate specimen of ASTM A572 steel
using a 45 degree angle beam tranducer. Pertinent specimen
geometry was the same as that of the tested pin specimen.
Figure shows unadjusted data, results from IDOT procedure,
and results from IDOT procedure without distance attenuation
correction factor.

-51-
6. EXISTING PIN AND LINK EYEBAR DESIGN; RETROFIT REPLACEMENT
This chapter discusses general pin and link eyebar design history,
materials of construction, deficiencies with existing pin and link eyebar
designs, and introduces new improved designs. In this report, links and
link eyebars are considered as interchangeable nomenclature.
General Pin and Link Eyebar Desiun
The basic pin geometry and link eyebar design prevalent in Illinois
bridges is derived from American Institute of Steel Construction design
manuals dating back at least 50 years. 5 The general fit-up of the
structural detail consists of a stout pin of carbon steel which fits
loosely into a web plate of a beam or girder. The web plate or section
may be reinforced by additional boss plates on both sides. The boss
plates are typically fillet-welded to the web plate, but may also be
riveted or bolted to the web in other designs.
. The old design pin connection was purposely designed for looseness
of fit to permit free, unrestricted motion and ease of construction
assembly. This fit is formally classified as LC1l, the widest locational
clearance fit for ANSI Standard B4.1-R1979. The pin is initially
lubricated before installation, and functions well in the initial part of
its life. The pins are inserted into the web, the links subsequently
connected, and then the nuts are spun onto a sharply-radiused shoulder
and threaded shank. The AISC Standard uses the ANSI 6 threads/inch
Unified National Coarse (UNC) series for all pin shank diameters.
Another AISC pin design variation for a large diameter pin configuration
uses a center hole into which a bar, threaded on both ends, is inserted.

-52-
The threaded bar holds down a 0.75-inch thick
pin. A third AISC design uses cotter pins on
cap on both ends of the
both ends of the pin for
restraint. Pins are typically lathe-turned or used in the cold-drawn,
as-received state. Standard design geometry as shown in Table 8 was
extracted directly from the AISC Steel Construction Manual.
Materials of Construction
Initially, pins and links were machined from plain (unalloyed) low
or medium carbon steels, such as ASTM A7 or ASTM A36, or AISI 1045. In a
later variation implemented by the Illinois Department of Transportation,
pins were carburized using AISI 8620 which was to ostensibly provide a
hard wearing surface and a tough pin core. The bearing supporting the
pin was a filament wound composite, and impregnated with graphite for
self-lubrication. The carburized pin was deeply case hardened to a depth
of 0.070-O.100-inch, with a surface hardness of 58 Rc. This high
hardness was achieved by quenching in agitated oil and tempering at
300°F. On pins larger than 3.5 inches in diameter, quench cracking was
common, with major cracks and spans emanating from the sharp shoulder.
Other serious cracks were also present on other surfaces of the pin.
These cracks were noted by inspection before installation and were
rejected. Because the pin was not ground to a 32 microinch surface
finish or better, observation of micro-cracking was difficult by direct
visual methods. Such quench micro-cracks are typically detected by wet
fluorescent magnetic particle inspection methods on ground surfaces.
Many pins were probably placed in service with existing quench
micro-cracks in a deep, carburized case. This case material typically
has a carbon content of 0.70 - 0.80%, and has a very low fracture
toughness because of its extreme hardness of 58 Rc or above. Such high

-53-
TABLE 8
VARIOUS STANDARD PIN GEOMETRIES NOW IN USE.
134
RECESSED PIN NUTS AND COTTER PINSL&rII
1
l--b
Thread
o Shape: American Standardem.: class 2 Flt
Pitch: 6 per inch
tjMaterial: PreSSedSteel
Di&#rPIN NUT
ThreadI
Thick- D!ameter ; RecessD$o$~ Weightness
DIT]cS;:t
.I%’I Rough 1
d t a. I Dia. I S PoundsHole 1— — — —
2 2X l% 1 % % 3 “-’- —3% 2% ?4 lx ,.
2% 2% 2 1% s 1 3% 4).4 3% x 1% 23 *3K 3% 2% 1% 1% 4% 5 3% % 2X 3
*3% 4 3 lx ; 1% 4% 5% 4% % 2?4 4*4X 4% *4X 3)4 1% ?4 1% 5% 6% 5?4 Y2 3?4 5
5 *5X 4 l% ~ 1% 6X 7% 5X % 3% 65~*5~ 6 4fi Iu ~ 1!% 7 8X 6% % 4X 8
*6% *6X 5 in $% lx 7% 8~ 7 % 4% 10
●6X 7 5% 2 )fj 1% 8X g% 7% ~ 5?4 12TX *7X 5?4 2 ~ 1% 8% 10 8 % 5X 14
q% 8 ●8% 6 2fi % 2% 9% 10% 8% % 534 ~ 19*8% *8% 9 6 ?,% ~ 2,% 1ox 11% g% ?4 5% 24
*9% *9~z 6 p% % 2?4 11X 13 10% ?4 5X 32*934 10 6 I z% % 2?4 11~ 13 10% % 5X 32
●Spwial Sines
111.IL *2 !, 9rlp
o~:- :‘ Rsoessed Pin Nutasimilar tothosellsted above
(’q “+’’’’’’’: i:;;t::;:::: ~
are available, in cast steel, for pins up to 24inches in diameter.
For pins over 10 inches in diameter, however,+.., * ! the prsferred practice IS adeta!l slrn!lar to that
l’s,shown at the left, in whmh the pin is held in
~. olace by a reccased cap at each end and secured414 by a bolt passing completely through the caps
TYPICAL PIN CAP D=AIL FOR PINSand pin. Suitable proy!?(on must be made forattaching pllota and dr!wng nuts.
OVER 10 INCHES IN DIAMHER
Dimensions shown are approximate.
HORIZONTAL OR VERTICAL PIN f+ ORIZObJTAL PIf4
EIJ 4!!!!!!!! m-
Z - Length of Pin, in inches.
PinPINS WITH HEADS COITER
PinPINS WITH HEADS COITER
Dia. HD~ci Weight Length Dia. Weight Dia. Tad Wei htof One. 8 ~ ~ pe::W.
Length D;a I Weight
d h“ Pe;;w d h“ of ne.Lb. c P Lb.
. — -l% I)j .19+ .351 4Y- — —?4 — — .82 +1 .681 ‘T2.64 2% 3?’4 % 11.4l% 1% .26 + .501 2% ?4 3.10 13 3% 1.02+2.001 5 % 28.5
lx 2 .33 + .681 2% % 3.50 3% 3% 1.17+2.351 5 x 28.5
2 2% .47+ .891 3 % 9.00 3% 4 1.34+2.731 6 % 33.8
‘2% p% .58+1.131 3% ~ 9.40 3?4 4% 1.51 +3.131 6 % 33.8p% 2% .70+1.391 3% 8% 10.9
AMERICAN IP4STITUTE OF STSEL CONSTRUCTION
-54-
carbon stee’
shock resis
s are often affected by hydrogen cracking and have minimal
ante. The minimum tempering for this hard case should have
been 700 - 800°F, but is presently specified at 300°F. The net
result for temperatures at 300°F is a brittle case at 58 - 62 Rockwell
C hardness. At
are attenuated,
embrittlement.
700°F, most of the gross residual stresses of quenching
and the case is less susceptible to hydrogen
Fortunately, the core alloy is AISI 8620, a tough
material which can blunt case cracks after they propagate through the
brittle case. Pins, whether carbon steel or carburized 8620 pins,
receive no other surface treatment to impart some improved corrosion
resistance, such as grinding and electroplating, galvanizing, chromating,
phosphatizing or electroless nickel. Once the initial lubricant used in
construction has weathered away or has been depleted by cyclic motion,
the pin receives no other form of corrosion protection.
Deficiencies with Existinq Pin & Link Designs
The most serious deficiencies with the existing designs are the
loose fit and the resulting gap between the pin, web, and link. This gap
permits moisture to accumulate and causes crevice corrosion and
accelerated wear. If the grease contains molybdenum disulfide, corrosion
of the steel pin may
the grease fi”
large, grease
viscosity, it
be accelerated due to sulfide attack of the steel if*
m is dssipated. Since the present pin-plate gap is so
is not held captive. If the grease does not have high
can be fluid at temperatures above 120”F. Without a grease
film, and with active corrosion taking place, the onset conditions of
fretting corrosion can be established.
Many examined pins from Illinois and other states exhibited
grooving, which is a direct manifestation of fretting corrosion.

-55-
Fretting corros”
surfaces, which
oxides are then
on is caused by oxides abrading fresh steel from bearing
in turn corrode and form additional oxides. These new
available for further abrasion to perpetuate the cycle.
Fretting corrosion is attenuated by decreasing the gap between rotating
elements and sealing the gaps with inert lubricants.
Wear and corrosion in pinned connections is further exacerbated by
the use of corrosion-susceptible alloys with rough surfaces and loose
tolerances, resulting in a poor fit-up. In addition, there are no
inherent pin markings, references or strain gages which monitor or
indicate motion or movement of pins or link eyebars.
The lubricants that are used in construction are often general
purpose lithium-based greases, not extreme pressure lubricants with high
viscosity and
of retaining
escape by the
Many of -
resistance to atmospheric degradation. A consistent method
ubricants is to keep them captive by preventing their
use of seals and bearing bushings with grease channels.
he previous pin alloys chosen, in addition to having poor
corrosion resistance, also have a susceptibility to galling. There is
also an absence of toughness specifications for pins, eyebars and web
plate materials. Not only are these pin components subject to torsional
forces, they undergo shock loads, particularly when the pin-link fit is
worn or very loose. For this reason, pins, link eyebars, and pin support
and boss plates must have substantial toughness to resist impact
loadings. These impact toughnesses should be compatible with their yield
strength levels.
Finally
replacement.
removed by a
older designs show little regard for removal and
Typically, pins are badly corroded, seized, and must
r arc-gouging. These deficiencies can be remedied by
be
use of ~

-56-
modern pin designs which incorporate automotive, naval, and aircraft
design practices.
New Pin and Link EYebar Desiuns
In the modernized designs, many of the existing deficiencies are
eliminated. These improvements include (a) better tolerances on fits and
finishes, (b) increased degrees of freedom of rotation, and (c)
provisions for periodic lubrication. The bearing materials are stainless
steels or bearing bronzes. The pin materials are either quenched and
tempered steel alloys that rely on lubricant presence for corrosion
inhibition, or are stainless steel or aluminum bronze.
In Figure 22, a typical new 9-inch diameter pin detail is shown.
The pin has a minimum of two degrees of rotational freedom for redundancy
of motion. The
a machined steel
obtained by elim
.OIO-inch, which
ink eyebar rotates about the pin, and the pin rotates in
sleeve bearing. Additional degrees of freedom can be
nating the shrinkfits. The minimum clearance is
is within the tolerances of an ANSI RC 8 fit. An ANSI
RC 8 fit is a loose running clearance, which accommodates the distortion
of shrinkage and inaccuracies of line boring. This fit provides
sufficient clearance
into the web. The s“
line of bearing actif
for the pin after the sleeve bearing is inserted
eeve is grooved in the central portion away from the
n passing through the web. The zerk fittings on
either side are available to purge grease if necessary.
The sleeve is not fillet-welded to the web to prevent any kind of
weld toe cracking which could propagate into the structural member.
Moreover, the line boring of the web elements insures that a true center
and circularity of the hole is achieved, which could never be guaranteed F

57-m
.$
\\;
/ $f’
/“’”w&
*‘‘q
,.-1-
.
:+
.
......................................
.........\.
......
..:
::.-.::...
::,’..:.’,’..
.:’...-,.
.(,-..
;
..
..
..
..
..
..
..
..
..
..
..
..
..
..
..
..
..
..
..
..
..
..
..
..
..
..
..
..
..
..
..
.
..
..
..
..
..
..
..
..
..
..
..
..
..
..
..
..
..
..
..
..
..
..
..
..
..
..
..
..
..
..
..
.
:.........UI
:0
‘vl....-\
.-..-d
b
Figure22.
Atypical
new9-inch
diameterpin
connectiondetail.

-58-
by flame or plasma cutting. The pin passes through the link eyebar
bearing and is secured by two nuts. The first nut is specially chamfered
so that when it is tightened, it provides a clearance of approximately
.025” for a grease seal made of Ryertex CG, a synthetic machinable
composite that is impregnated with graphite. The outer nut is also
circular to limit torque. A special wrench that applies 450 ft.-lbs.
nominal torque is provided, as shown in Figure 23. The wrench is
designed so that if too much torque is applied, the AISI 41L50 cold
finished bar insert will shear off. These pin nuts can also be
fabricated from plate steels into a hexagonal form, and torque can also
be limited by wrench handle length. These nuts interface with the bronze
bearing insert in the link eyebar, forming a corrosion-resisting seal to
exclude moisture. This nut and seal arrangement is shown in Figure 24.
An additional safety precaution is built into the nut by the use of
anti-ratchet dog bolts.
The pin itself, as detailed in Figure 25, is a ground and polished
round bar made of AISI 9310, a low carbon, 3% nickel and 1% chromium
alloy steel with high toughness, particularly in the normalized or
quenched and tempered state. When specified as aircraft quality, the pin
is inspected for surface flaws. The bearing surfaces are ground to a 16
micro-inch finish, minimizing both seizure and corrosion. The radiused
portion of the pin has only a 0.25-inch radius. Previous pin designs
showed a much sharper step which reduces the scanning ability of an
ultrasonic transducer to search for cracking. The reduced gentle radius
now permits full straight beam scanning for internal cracks or flaws.
The link eyebar, as described in Figure 26a, is probably the most
vulnerable detail to rupture. Its highest area of stress concentration

-59-
*
$3’0. %0.s rh “ R.. .%’ /,,
125 ~ 5”4 hole\—
& /2“ R.
// 1“ R.
I 125 36” /1I
ELEVATION~Stump on’ end:
“~OX. Lood 250 Ibs. ”.b’
.
L-4
I-Y I
i’ BOTTOM VIEW% “# AISI 41150Cold finished bar. WRENCHDETAILSTap in ‘* -12 UNCthreaded hole. (2 Required)
Moteriol: ASTM A 572 Grade 50, l%” ploteond AISI 41L50 CF bor. ‘~ “A
Figure 23. Special wrench for torque application. Overtightening
causes the loading pin to shear off.

-60-
//
10.50” O.D. x 10.00” I.D. Ryertex .025@
CG-Tubing Seol.
NUT ANb SEAL
/ ‘E’A’L
Figure 24. Nut and seal detail for moisture exclusion.

-61-
ANSI 8N Threod Series(8 Threads per Inch)
4 /, ~,,
4.50” 27.260” 4.50”
4.48” 27.250” 4.48”36.260”36.210”
I
PM DETAILPins shell be AN 9310 normalized and tempered. oircraft or
beoring quulity 250 BHN min.. 80 ksi yield strength min., 17%elongation min. or AISI 4620 normalized and tempered. aircraftqualify. 183 BHN min.. 63 ksi yield strength min. 22% elongation min.Toughness Requirement: 45 Ft. - Lbs. at 0° F. CVN.
‘o
Typ.
Figure 25. Nine-inch diameter pin detail also showing material
properties and surface finish requirements.

-62-
A%~ NPT Zerk w/Yh
Foil Srrain Gages
I-#&-l10” 10”
w
20”.
I
— —
--l7.5 “ Typ.
“10.500”10.499” 1
64
364 64
G NPT Zerk56* grease
* Bushing Dia. = 10.506” for FN2 fit (Shrink) ‘q-
10.505” SEC. A-A
L INK DETAIL All &tails for hole ond Ln#tiing in
Parallelism: %floces must be pOrOllelbOttOmof link ore typical for top of link.
within .010” or : !j 0.
Link p!ote material sMI be AISI E4130 aircroft qvolity.normalized W ksi UT% 70 ksi YS. 16Z ebgotian.
Tovglwess re@rements: 45 Ft. Lbs. ot 00-~ CVN.
Figure 26a. Detai 1 drawing of 1ink plate.
bymagnetic

-63-
is at the 90° position, where strain gages are mounted to monitor any
plate stress changes.
model of the eyebar in
nuts to prevent strain
The peak stresses are shown in a finite element
Figure 26b. Gages are located a distance from the
gage wire seizure. The lubrication port was
placed at the minimum stress position (at 0°) to decrease the likelihood
of crack formation in the grease hole. The link eyebar is made of AISI
4130 aircraft quality normalized plate. This material has good
hardenability and toughness, with significantly improved machinability,
compared to similar low carbon alloy steels (55%.to 70%). ASTM A514
plate is also another alternative alloy. The link is machined flat by
surface milling. This permits excellent alignment and true
perpendicularity on bearing bores and bushings. In addition, the surface
finish is improved to 64 micro-inches in the areas of maximum tensile
stress. Also, the internal bore surfaces are inspected by wet
fluorescent magnetic particle methods for any internal flaws exposed by
the boring of the plate. Lastly, the link eyeplate and the pin have a
toughness requirement of 45 ft.-lbs. at O“F by the Charpy V-notch impact
test, a level commensurate with its yield strength as per the unified
Fracture Criteria Impact Test Requirements of
Structural Steel for Bridges.
The advantage of this design
that it has close tolerances, wil”
reduced friction for long periods
Table S1.3 of ASTM A709,
compared to existing pin designs is
exclude mo’sture, and will have
of time. A variety of alloys can be
used for linkeyebars, pins, and bearings that are both strong, tough,
and corrosion resistant. These alloys are summarized in Table 9.
The lubricants selected are extreme pressure greases that have also
shown good performance in adverse environments. Lubricant properties are
derived from established commercial technical literature. The lubricants
are summarized in Table 10.

-6!l-
M.’.........................“.:.yw’,.,................................::..k..,...,;,,.,,,,,.,,..,..,..,:.,..,:,,.,,..,:,..,:,.............,.,,,,.,.,.............,,,.,.,,.,,.,,.,,:,..:,..,.,
mifj:$111:.:”:?.....
Figure 26b Finite el
maximum 1
stresses
legend ar
ement model
oadings for
are about 3
‘e in psi.
of the
the Pe
X nomin
Ii
ru
al
nk
Br
St
eyebar
idge.
ress .
Stress
Note that
Stress va
e
1
s a
eye
ues
re for
let peak
in the

-65-
IM.LE-9
Com~onent
Pin
Pin
Pin
Link
Link
Bearings
Bearings
Bearings & Pins
Pins, Plates &ReinforcingBosses
PIN, LINK, AND BEARING ALLOYS
m
Nitronic 60
AISI 8620,quenched & tempered& stress relieved
FerraliumAlloy 255duplex stainless; orSandvikSAF 2205
AISI 4130ASTM A514
AISI 9310 orAISI 8620
ASTM B16(UNS 36000);ASTM 6121, AlloyC35300
Nitronic 60
Ampco 954
ASTM A808;ASTM A808;ASTM A514
Characteristics
corrosion resistant;galling resistant; 60 ksiyield strength; goodtoughness; high cost/lb
tough, low cost; about85 ksi yield; about 2Xcorrosion resistance ofA36
high corrosion resistance,tough, weldable;higher cost grades;may be susceptibleto galling
tough, strong (to 100ksi); 2x better corro-sion resistance than A36
very tough steel; about2x corrosion resistanceof A 36
leaded for freemachining; good bearingproperties, but loweryield; corrosion resistant
corrosion resistant; gallresistant
corrosion resistant;strong for brass alloy(40 ksi yield); bearingproperties not as good asleaded brasses; costly aspins
strong, tough alloys withatmospheric corrosion .resistance 2X ASTM A36.

-66-
Manufacturer
Jet-LubeHouston, TX
Keystone Div.,Pennwalt Corp.King of Prussia, PA
PIN AND
Product Name
202Moly-Lith
ALCO-EP73 Plus
Zeniplex-2
81-EP 2
Mobil Corp. Mobilux EP 2New York, NY
Tech-Lube T-800-SIslip, NY
*Note: Lubricants are listed only
TABLE 10
LINK LUBRICANTS*
General Characteristics .
Low friction, high load with extremeresistance to heat, water, weatheringand oxidation.
Molybdenum disulfide & graphite inan aluminum complex base; suited forsubseawater applications.
Carries extreme pressures with highwater and moisture resistance.
Lithium base grease extremepressure; resistance to moisture andmild acids & alkalis; containsanti–rust inhibitors.
Lithium base extreme pressure greasewith oxidation and rust inhibitors.
Waterproof grease; resistant toacids, alkalis; compatible withbrass and bronze.
in alphabetical order; characteristics arebased on descriptions for manufac~urer’ s”technical literature only and havenot been confirmed by independent government testing.

-67-
The pins themselves must be ground to at least a 32 micro-inch finish.
significant. At
not exceed 3YL of the
the pin and eyebar is
The strength of the pin should be sufficient to satisfy primarily the shear
forces, although torsional forces from seizure can be
maximum anticipated loadings, the shear stress should
yield strength. The impact and fracture toughness of
a function of its yield strength and the surrounding temperature.
Pins, bearings, and links can also be marked for motion sensing; and
strain gages can be welded and sealed on eyebars to detect any excessive
strains due to lockup or outright seizure.
For pins or link eyebars that are fracture critical, the impact
toughness requirements, preferably taken transverse to the bar or plate’s
rolling direction, should conform to the requirements of the supplemental
tables of ASTM A709. Similar reduced values for non-fracture critical pins
and link eyebars are also published in this standard, which is summarized
in Table 11 for Zone 2 (Illinois).
Actual pins, link eyebars and nuts fabricated and machined in
accordance with the new designs are shown in the following set of figures.
These components are being used in the Peru Bride Rehabilitation Project.
In Figure 27, the ground and threaded AISI 9310 pins are readied on pallets
for delivery. A closeup of a single pin is shown in Figure 28. The large
diameter circular nuts that spin onto the ends of the pins are shown in
Figure 29. Note the internal groove where the Ryertex graphite seal fits.
Figure 30 shows how the special chamfer on the nut when it runs into the
pin radius forms a gap for the Ryertex seal. This prevents overtightening
and lockup of the nut against the link eyebar. Figure 31 shows two milled
and bored link eyebars prior to acceptance of the bearing inserts into the
eyelets. Figure 32 is a stack of 4 bearing inserts which are shrunk fit ~
into the link eyebar. Note the internal grease groove.

-68-
TABLE 11
IMPACT TOUGHNESS REQUIREMENTS FOR PIN AND LINK MATERIALS
FOR TEMPERATURE ZONE 2*
Averaue Enercw. ft.-lbs.Yield Strength Non-fracture FractureRanqe. ksi Thickness Critical Critical
36 - 49 up to 4“ 15 @ 40”F 25 @ 40”F
50 - 69 to 2“ (welded/bolted) 15 @ 40”F 25 @ 40”Fto 4“ (bolted) 15 @ 40°F 25 @ 40”Fto 4“ (welded) 20 @ 40”F 30 @ 40”F
70 - 99 to 2 1/2” (welded/bolted) 20 @ 20”F 30 @ 20°Fto 4“ (bolted) 20 @ 20”F 30 @ 20”Fto 4“ (welded) 25 @ 20”F 35 @ 20”F
100 - 130 to 2 1/2” (welded/bolted) 25 @ O“F 35 @ O“Fto 4“ (bolted) 25 @ O°F 35 @ O“Fto 4“ (welded) 35 @ O“F 45 @ O“F
*Based on Tables S1.2 and S1.3 of ASTM A709, Structural Steel for Bridges.
Safety Criteria for Pins and Links
A pin and link eyebar are subjected to a variety of forces throughout
their lifetimes. The principal pin forces are (1) bending stresses induced
by the offset distance between the web’s line of action and the link’s line
of action; (2) the shear forces on the pin itself; (3) the torsional forces
which develop on the pin from friction or permanent seizure at the pin-link
interface. The principal link eyebar forces are (1) tensile and compressive
stresses from loading and (2) torsional forces resulting from friction or
actual seizure with the pin due to poor lubricity as the link moves due to
thermal expansion of the bridge. See Figure 33. These shear and tensile
stresses have both a steady stress component derived from dead load and an
alternating stress component originating from live loads. The torsional ~
stress Is also alternating, since it is derived from rotation induced by
thermal expansion.

-69-
Figure 27. Machined and finely ground pins for Peru Bridge.
Figure 28. Closeup of pin and general size.

-70-
,Figure
Figure
29. Circular nuts for pins. All grooves and holes for
dog bolts were not yet machined out.
30. Special chamfer which permits a space for a grease seal
situated between the nut and link eyebar.
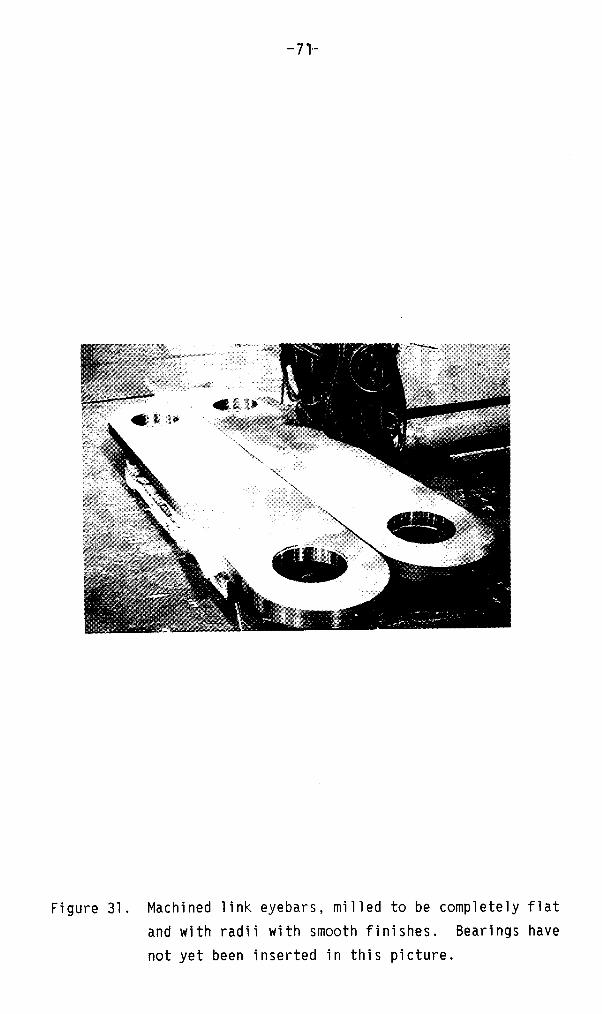
-71’-
Figure 31. Machined link eyebars, milled to be completely flat
and with radii with smooth finishes. Bearings have
not yet been inserted in this picture.

-72-
Figure 32. A stack of four bronze bearing inserts, showing
internal grease groove.

-73-
Link eyebar tensile stresses are at their maximum at the 90° & 270°
positions. The equation predicting such maximum stresses is6:
= J’NIJSmax ArEl
where: W = Weighton link, lbs.W= Stress factor, a function of the clearance
ratio, n = e/r (See Fig. 34).e = clearance between pin and link, inchesr = radius of pin, inchesA = 12/r or ratio of link radius outside R to inside radius r .B = thickness of link, inches
A consequence of loose clearance between pin and link eyebar is a
progressively increasing stress level in the link eyebar.
Shear and bending forces are determined conventionally. Torsional forces
on the pin are determined by making an estimate of the coefficient of friction
between the link eyebar and pin. Torque is applied when frictional forces on
the periphery of the pin increase as the surface is degraded by roughness,
corrosion and the seizure of surface asperities from pin to link. The
peripheral surface forces are determined by the relationship F = I.IN where N is
the normal force and p is the coefficient of friction. These coefficients
vary widely from material to material, and by lubricant and surface
conditions. The coefficients of static friction for various material
combinations used in pins is shown in Table 12.

-74-
—
d--- F~
N
(3wFt ~ ~ Ft
N/
Figure 33. Principal forces and stresses on pins and link eyebars. N is the
normal force exerted on the bearing; Fb is the bending Strf?SS on
the pin; F is the shear stress on the pin; Ft is the torsional
force on the link; T is the torsional stress on the pin.

/
5.5/ 4
/I
//
+ 5.0~!
.L2 /; 4.5 /
I/lmal; 4.0
3.51
I
1I ji,
0.02 0.04 0.06 0.08
Clearance ratio, n = efr
Figure 34. Stress factor for typical eyebar design (Ref. 6, page 376).

-76-
TABLE 12
TYPICAL COEFFICIENTS OF STATIC FRICTION (IJ)
Material Combination ~ Lubricated
hardened steel on hardened steel 0.78 0.11 -0.23mild steel on mild steel .74- 1.2 0.09hardened steel on graphite 0.21 0.09hardened steel on babbit 0.42 0.08- .17mild steel on bronze .45- .51 .11 - .13aluminum on aluminum 1.9 ———
Data sources: Handbook of Chemistry and Physics; Mark’s Mechanical EngineersHandbook.
The forces that impinge on a pin are multiple. The safety of a pin is
best determined by its combined distortion energy. A reasonably conservative
relationship for safety factor for shafting7
is as follows:
n = 1[(Oo/Gu + Ktf~v/ce)2 + 3(00/1.330Y + Ktf~v/0e)211/2
steady bending stress, due to dead load
ultimate tensile strength
alternating bending stress, due to live loads
fatigue strength at 107cycles; for pins approximatelyGu X [.3] subject to minor corrosion
combined steady shear and torsional stresses
alternating shear or torsional stress, due to live loads
yield strength
clamping factor for bearings; is 1.0 for shafts with nonotches
A more simplified safety factor equation can be used for link eyebars.
The Gerber parabola fatigue failure equation is widely used in this case.
n = 1
(Om/0u)2 + (Oa/ ~e)

-77-
where: am = mean Sh!SS, where (OD +ULL
~D = peak tensile stress from dead
~LL= peak tensile stress from live
‘r = tension from friction due to
+~F )/2 =~m
load at 90° position
load at 90° position
ack of lubrication orcorrosion or both in eyelet.
CJa = tilt,ernatlng stress, where OLL/2 +OF/2 =~a
~u = ultimate tensile strength
Oe . fatigue strength at 107 cycles, where OuX [.31.
As a rough approximation, 10% of the live load stress may be added to
compensate for frictional forces in a lubricated pin. For pins and links
these values should not fall below n = 1.50 because many of the coefficients
of friction are estimates and fatigue strengths of very high strength
materials often level off atou = 150 ksi or greater. For pins suspected
of higher frictional forces, the link eyebars should be either instrumented
with strain gages or monitored with photoelastic coatings to note peak
stress levels.

-78-
7. SUMMARY
Pin connections on bridges in 1’
Many failures of both pins and link
linois are a potentially serious problem.
eyebars have been reported throughout the
country as shown in NCHRP 333. These connections were designed to move freely
in response to traffic and thermal movements, but years of corrosion and wear
usually result in at least a partially fixed condition. This fixity
introduces unintended bending stresses in the hangers or link eyebars and
shear stresses in the pins.
Several methods of detecting relative movement or rotation were developed
and field tested in order to study actual pin connection behavior. Strain
gages and electronic rotation sensors were found to be most suitable for
gathering quantitative data. Strain gage installations were better suited for
further stress analysis.
Finite element models of three actual structures were employed to estimate
the maximum effect of fixity on pins, hangers, and link eyebars due to live
load and thermal movement. A thermal differential of fifty degrees Fahrenheit
was used in all models. Analysis of this data reveals that complete fixity
can create a highly dangerous condition for both pins and hangers or link
eyebars in a given connection. Partial fixity also induces high stresses
which may cause yielding in a component and/or accelerate fatigue damage,
depending on the degree of fixity. Analysis of strain gage data collected
from installations on the 1-270 and I-474 bridges showed that pins do
experience shear stresses due to thermal changes. These shear stresses ranged
from approximately 0.4 ksi to 11 ksi in magnitude.
Previous researchers showed that the most practical way to inspect pins
for defects was by ultrasonic methods. An inspection and calibration
procedure was developed and implemented. Two pilot contracts were let for f

-79-
pin inspections during the summers of 1989 and 1990. Results of these
inspections revealed relatively few defects of appreciable size and no
complete failures.
The inspection procedure provides a calibration block. It
calibrates both longitudinal and angle beam transducers to a l/16-inch
hole to provide a degree of repeatability. Angle beam and straight beam
techniques were used because of the many pin sizes and configurations in
use in Illinois. The pin inspection procedure is presently undergoing
further refinement.
Existing pin designs and materials used in Illinois bridges were
reviewed. The basic pin and link eyebar geometry and design date back at
least 50 years. Several deficiencies of the current designs and
materials were noted. The most serious deficiencies with the existing
designs are the loose fit and the resulting gap between the pin, web, and
link eyebar. This condition allows any lubricants present to dissipate,
and the accumulation of moisture, causing crevice corrosion. The large
gap also allows fretting corrosion to occur. The lubricants used, if
any, are often general purpose greases which may not have sufficient
resistance to atmospheric degradation. The alloys presently specified
are corrosion-susceptible and have rough surfaces and loose tolerances.
These conditions result in poor fit-up. Many of the alloys used are also
susceptible to galling. There
links, or web plates. The ales’
eyebar removal and replacement
are no toughness specifications for pins,
gns show little regard for pin and link
A modernized design was presented in which many of the existing
deficiencies are eliminated. The improvements include better tolerances
on fits and finishes, increased degrees of freedom of rotation,

-80-
provisions for periodic lubrication, higher strength, more corrosion-
resistant alloys, and the use of extreme pressure lubricants. Toughness
requirements based on alloy yield strength were also presented.

-81-
8. CONCLUSIONS
Based on the
made:
1)
2)
3)
4)
5)
6)
7)
8)
9)
work done in this report, the following conclusions are
The effects of pin fixity can be quantitatively measured by a
strain gage circuit and strain gages mounted on hangers or link
eyebars.
In cantilever truss bridges, completely fixed pins are
subjected to varying stress levels, depending on structure
length, pin material properties, and pin diameter.
Cantilever girder bridges may experience conditions which could
result in yielding and permanent deformation due to the
combination of complete fixity and live load.
Hangers or link eyebars, in addition to pins, are at risk due
to fixity due to cyclic fatigue stressing in the yielded stage.
Partial
hangers
The pin
between
fixity effects could result in fatigue damage of
or link eyebars.
inspection procedure requ
defect size and test data
Based on the results of the pin
relatively few pins in Illinois
complete fractures.
Existing pin connection designs
res more work for correlation
inspection contracts, there are
with serious defects, and no
have deficiencies which allow
crevice corrosion, fretting corrosion, and fixity to occur.
New pin connection designs, using standard automotive, naval,
and aircraft designs for bearings, provide more degrees of
freedom of rotation, access for lubrication, and alloys with
high toughness, galling resistance, and corrosion resistance.

-82-
10) The toughness of the entire assembly, including pins, link
eyebars, pin plates, boss plates or sleeves, should have
sufficient toughness to resist impact. Impact toughness levels
should be compatible with the alloys yield strength and the
lowest temperature that the bridge will encounter, preferably
meeting the standard of ASTM A709, Tables S1.2 and S1.3.

-83-
REFERENCES
‘ Carroll, F., Martin, F., McDonald, S., “Non-destructive Bridge Pin
Testing.” Public Works, Volume 120, Number 1, January 1989.
2 Ross, C.T.F., “Applied Stress Analysis.” Halsted Press, New York
City, New York, 1987, p. 309.
3 Shigley, J., Mitchell, L., “Mechanical Engineering Design.” 4th
edition, McGraw-Hill Book Company, New York City, New York, 1983,
p. 842.
4 Kulicki, J., Prucz, Z., Sorgenfrei, D., Mertz, D., Young, W.,
“Guidelines for Evaluating Corrosion Effects in Existing Steel
Bridges.” NCHRP Report Number 333, Transportation Research Board,
Washington, D. C., 1990, pp 92-94.
5 Steel Construction Manual, 2nd Edition, AISC, New York City,
New York, 1934, pp. 114-115.
6 Blake, A., “Practical Stress Analysis in Engineering Design.” 2nd
edition, Marcel Dekker, Inc., New York City, New York, 1990, p. 376.
7Marks Standard Handbook for Mechanical Engineers, 8th Edition,
McGraw-Hill, New York, 1978, pp 8-49
8 Collins, J., Failure of Materials in Mechanical Design, John Wiley, ~
New York, 1981, pp 218.
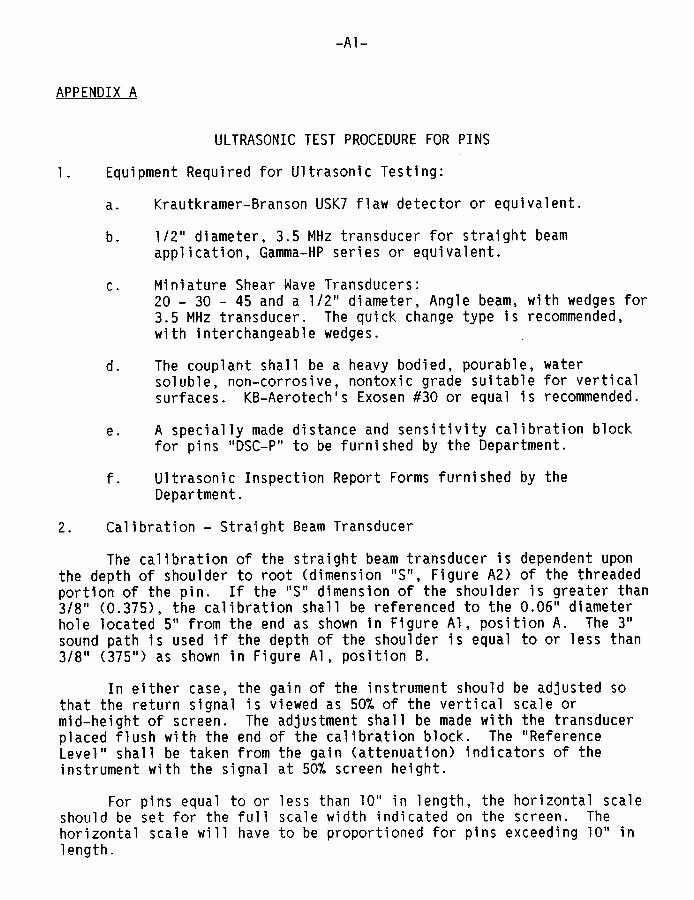
-Al-
APPENDIX A
ULTRASONIC TEST PROCEDURE FOR PINS
1. Equipment Required for Ultrasonic Testing:
a. Krautkramer-Branson USK7 flaw detector or equivalent.
b. 1/,2”diameter, 3.5 MHz transducer forapplication, Gamma-HP series or equivi
c. Miniature Shear Have Transducers:20-30- 45 and a 1/2” diameter, Ang’3.5 MHz transducer. The quick changewith interchangeable wedges.
d. The cou~lant shall be a heavy bodied,
straight beamlent.
e beam, with wedges fortype is recommended,
pourable, watersoluble; non-corrosive, nont~xic grade” suitable for verticalsurfaces. KB-Aerotech’s Exosen #30 or equal is recommended.
e. A specially made distance and sensitivity calibration blockfor pins “DSC-P” to be furnished by the Department.
f. Ultrasonic Inspection Report Forms furnished by theDepartment.
2. Calibration - Straight Beam Transducer
The calibration of the straight beam transducer is dependent uponthe depth of shoulder to root (dimension “S”, Figure A2) of the threadedportion of the pin. If the “S” dimension of the shoulder is greater than3/8” (0.375), the calibration shall be referenced to the 0.06” diameterhole located 5“ from the end as shown in Figure Al, position A. The 3“sound path is used if the depth of the shoulder is equal to or less than3/8” (375”) as shown in Figure Al, position B.
In either case, the gain of the instrument should be adjusted sothat the return signal is viewed as 50% of the vertical scale ormid–height of screen. The adjustment shall be made with the transducerplaced flush with the end of the calibration block. The “ReferenceLevel” shall be taken from the qain (attenuation) indicators of theinstrument
Forshould behorizonta”length.
with the signal at 50% screen height.
pins equal to or less than 10” in length, the horizontal scaleset for the full scale width indicated on the screen. Thescale will have to be proportioned for pins exceeding 10” in

-A2-
3. Calibration - Angle Beam Transducer
The calibration of the shear wave transducers for “Reference Level”is determined directly from the instrument’s gain indicator. After thetransducer angle has been chosen based on pin geometry for the pin areain question the test block sound path closest to the anticipated soundpath distance is used to establish the “Reference Level”. The gain isthen adjusted until the maximum return signal is viewed as 50% of thevertical scale.
The sound path distance used for calibration shall be recorded onthe UT report in the column below the transducer angle.
Example: A 30° Wedge angle was determined to give the necessarycoverage in the area subject to the most corrosive wear, and a sound pathof approximately 3 1/2” was chosen to scan the region. Calibration isaccomplished by placing the transducer on the side of the block at thepoint intersecting the 3 7/16” sound path line. The gain of theinstrument is adjusted until the maximum return signal of the deficiencyis viewed as 50% of the vertical scale. The “Reference Level” is readdirectly from the instrument and recorded on the UT reports. A 3 7/16”is recorded below the 30 column. (Figure Al, position C)
4. Ultrasonic Test Procedure: General
The ends of pins to be tested shall be free of accumulated paint,rust burrs, and any roughness than would prevent the transducer frommaking full contact and restricting movement across the surface. Duringscanning, the gain of the instrument is to be set approximately 20 dbabove the Reference Level. Each pin end shall be scanned with both astraight beam and at least one angle beam transducer. The scanning levelshould be recorded under “Remarks”.
Apply an approved couplant to the surface of the end of pin beingtested. Position the transducer on the end of the pin and slowly move itover the entire area of the pin with an even amount of pressure to keepthe couplant under the transducer while testing is in progress.
An “Attenuation Factor” of 2 dB per inch of sound travel less thanor greater than the calibration length shall also be recorded on theform. The attenuation factor shall be recorded as a minus value if thesound path is greater than the sound path used for calibration or whenthe path is less than the sound path used for calibration. The“Indication Rating” shall be taken as the Indication Level minus thedifference between the Reference Level and the Attenuation Factor.

-A3-
Example: The gain of the instrument is adjusted to 70 dB so that themaximum return signal of a defect, is viewed at mid-height of the screen.The Reference Level, determined on the test block, is 56 dB afterapplying a straight beam adjustment factor. The sound path is one inchlonger than the calibration sound path setting the Attenuation Factorequal to 2 dB. The “Indication Rating” iS 70dB- (56 dB-2 dB) = 16 dB
5. Straight Beam Testing
The CRT screen reading for a good pin will show an initial pulsesignal and reflections from the threaded reduction shoulder and the endof the pin. The reading for a pin with a defect at the hanger plateswill show a signal at the location of the defect. If the defect extendsbelow the shoulder, the reflective signals from the shoulder will be lostdue to the return signal from the flaw.
A pin that has an indication between the initial signal and thesignal from the far shoulder is evaluated by adjusting the gain either upor down until that signal is.at mid-height on the CRT screen. The amountof gain that it takes to bring the indication to mid-height is recordedon the report under “Indication Level”. The location of the signal fromthe horizontal base line on the CRT screen will correspond to thedistance of the indication from the end of_ the pin and is recorded on theUT report as “Location from A“ or “Location from B“.
6. Shear Wave Testing (Angle Beam Testing)
The transducer is moved with even pressure along a diametral linestarting at the 12:00 position, See Figure A2, and rotating clockwisearound the end of the pin until the entire surface of the pin iscovered. The transducer should not be lifted off the face of the pinend. The scanning motion is as follows: 12:00 to 6:00, 7:00 to 1:00,2:00 to 8:00, etc. It is essential that a generous amount of couplant bemaintained between the surface of the pin and the transducer at alltimes, especially if the ends of the pins are pitted from rust ororiginal fabrication. The sound path to the defect is recorded under“Sound Path”. Special measures are necessary to scan pins with cotterpin holes, centering holes from original machining, extremely longthreads, no turned-down shoulders, or end caps with capture bolts.Procedures for these situations shall be coordinated with the Engineer.

-A4-
5“~
0
DSC-P
,/’’”
~-l\@’
0
1A
1c
RB
Figure Al.
D = Pin Dia. in Inches
E = Dia. of Root of Threads in Inches
S = Depth of Shoulder to Root of Threads
L = End of Pinto Far Shoulder
T = Total Length of Pin
BM = Length of Threads s
rA
I 11,
D-f 1’E
L-w-
-LL
121
2
3
4
1211
10
9 3
8
5 I 76 Figure A2.
7’ 56

x-x x-l
TestDate
Temp. (Air) (Surf.)
Route
Section
County
Str.No.
UT Instr.
Anchor Sus ndedSpan rpan
X+--J
‘~ 8j+/’6 6
InspectedBy
Cert.Level
Agency
‘S’ Dim. Pin ( )
Sound Path-DSC-P: angular ( )straight ( )
Formula d=a-b-c
T.0:
.
Eok
———
+
30° 45 SB-+a b
1
#
I1
r
I—
—
—
—
s—
—
—
—
——
Sheet of%

x-x x--l
TestDate
Temp. (Air) (Surf.)
Route
Section
County
Str.No.
Sus ndedr pan
SW. S*W3
67UT Instr.
Inspected By
Cert. Level
Agency
‘S’ Dim. Pin ( )
Sound Path-DSC-P: angular ( )straight ( )
Formula d=a-b-c
!!9‘*
SB
—
zco.=~.-=c
—
—
—
—
—
—
—
—
—
—
—
—
—
—
—
—
—
20a 30°1 45(
+
B
-1-- =1=+
I
I
3= T1
1
T!
TZ%. Sheet of

-Bl-
APPENDIX BG1 and G2 Condition Ratings
Angle BeamCode Condition Indication Rating
8
7
6
5
4
3
2
VERY GOOD-Noproblems noted.
GOOD-Very minor surfacerust, insignificantindications and highindication ratings.
SATISFACTORY-Pi tting,shallow corrosion orwear grooves but notaffecting structuralcapacity.
FAIR-Corrosion or weargrooves producing prob-able section loss whichmay affect structuralcapacity for over-loads.
POOR-Significantcorrosion or weargrooves causing definitesection 10ss.
SERIOUS-Deep corrosionor wear grooves causingsignificant section loss.
NI
above 8
4-8
4-8
0-3
0-3
Gr;oves below shoulders.Requires posting andinvestigation by structuralengineer.
CRITICAL-Extreme section -lo to -1loss due to corrosion,wear grooves, or crackspresent. Shore beams.Pins should be replaced.Lanes may be closed pendingan investigation by astructural engineer.
Adjusted Straight FrequencyBeam Indication Rating Years
NI 5
NI 5
NI 2
6-15
6-15
0-5
-4 to -1
2
*

-B2-
Angle Beam Adjusted Straight FrequencyCode Condition Indication Ratinq Beam Indication Rating Years
1 IMMINENT FAILURE-Pins -20 to -1 -lo to -5 *
partially severed.Structure or lane mustbe closed pending cor-rective action if morethan 30% of beam linesso rated. Shoreaffected lines.
o FAILED-Out of service. Below -20Deep fracture. Closestructure/lane if morethan 25% of lines so rated.Shore affected lines.
Below -20
NI = No Indication
* Inspection interval and remedial action to be established by the CentralOffice considering the specific site characteristics.
The above are guides for coding the condition of pin and hanger assemblies inmulti-girder steel bridges. The inspector must take into consideration theseverity of the deficiency, the number of beams affected, and the number ofadjacent beams with similiar deficiencies.