Analysis and Predictions from Escherichia coli Sequences ... · PDF fileAnalysis and...
32
Analysis and Predictions from Escherichia coli Sequences, or E. coli In Silico A. HÉNAUT AND A. DANCHIN 114 INTRODUCTION Bacteria have been studied as living entities (in vivo) for 150 years and in cell-free systems (in vitro) for almost half that time. With the availability of DNA sequence information, it has become evident that genes can also be studied as lines of text. A new domain of knowledge and research concerned with this means of studying living systems has arisen; it has been referred to as informatics but also involves standard aspects of mathematics and statistics as well. Beside using computer programs that mechanically perform standard but tedious analysis of the information content of DNA, investigators are now using programs that help generate new knowledge about this information. Thus, in addition to the study of bacteria in vivo and in vitro, there is now an active endeavor studying them “in silico.” Escherichia coli has been a paradigm for such studies. It is anticipated that the E. coli genome sequence will be known by the end of 1997. In parallel, a vast amount of data on a variety of organisms has been collected, and it has become an important task not only to handle this huge quantity of information but also to extract from it the features that pertain to the concrete expression of life in general and to E. coli in particular. For the E. coli geneticist, no literature reviewing this new aspect of research exists; information is scattered through a vast number of journals and papers, often presenting independent but redundant approaches. Here we have summarized the less self-evident aspects of the data presented in the literature. Readers interested in features relevant specifically to informatics can find in the databank SEQANALREF an updated bibliography on software dealing with sequence analysis (SEQANALREF, present in the EMBL data library package, contained 3,076 references in release 64 [October 1995]). Major DNA and protein data banks are accessible on the Internet. The appropriate addresses can be found in references 23, 42, and 71. We shall follow the path that molecular geneticists pursue when they use formal techniques for investigating the significance of genes at the DNA level or of proteins at the polypeptide chain level: acquisition of sequences, analysis of these data, and management of DNA, RNA, and protein sequence data. METHODS FOR SEQUENCE ACQUISITION Generation of Long DNA Fragments without Gaps Sequencing short pieces of DNA (i.e., less than 5 kb) does not require the use of specialized programs for aligning sequence subfragments obtained experimentally. One can start from both ends of the original segment and extend the sequence by using oligonucleotides or by using sequencing of nested deletions. This is not an easy or cost-effective effort when one is sequencing large segments. In this case, it is more efficient to use as the starting material a DNA library generated by shotgun cloning of ultrasonicated DNA or DNA fragmented with frequently cutting restriction enzymes. In this regard, it is important to make use of programs permitting automated alignment of fragments, generating contiguous overlaps (contigs). This task is not trivial, however, because the sequenced DNA segment often contains repeated regions displaying little or no variation. In addition, sequenced fragments contain errors, especially at their extremities, which are the very regions relied on for generating contigs.
-
Upload
truongtuyen -
Category
Documents
-
view
216 -
download
0
Transcript of Analysis and Predictions from Escherichia coli Sequences ... · PDF fileAnalysis and...

Analysis and Predictions from Escherichia coli Sequences,or E. coli In Silico
A. HÉNAUT AND A. DANCHIN
114INTRODUCTION
Bacteria have been studied as living entities (in vivo) for 150 years and in cell-free systems (in vitro) foralmost half that time. With the availability of DNA sequence information, it has become evident thatgenes can also be studied as lines of text. A new domain of knowledge and research concerned with thismeans of studying living systems has arisen; it has been referred to as informatics but also involvesstandard aspects of mathematics and statistics as well. Beside using computer programs thatmechanically perform standard but tedious analysis of the information content of DNA, investigators arenow using programs that help generate new knowledge about this information. Thus, in addition to thestudy of bacteria in vivo and in vitro, there is now an active endeavor studying them “in silico.”Escherichia coli has been a paradigm for such studies. It is anticipated that the E. coli genome sequencewill be known by the end of 1997. In parallel, a vast amount of data on a variety of organisms has beencollected, and it has become an important task not only to handle this huge quantity of information butalso to extract from it the features that pertain to the concrete expression of life in general and to E. coliin particular.
For the E. coli geneticist, no literature reviewing this new aspect of research exists; information isscattered through a vast number of journals and papers, often presenting independent but redundantapproaches. Here we have summarized the less self-evident aspects of the data presented in theliterature. Readers interested in features relevant specifically to informatics can find in the databankSEQANALREF an updated bibliography on software dealing with sequence analysis (SEQANALREF,present in the EMBL data library package, contained 3,076 references in release 64 [October 1995]).Major DNA and protein data banks are accessible on the Internet. The appropriate addresses can befound in references 23, 42, and 71.
We shall follow the path that molecular geneticists pursue when they use formal techniques forinvestigating the significance of genes at the DNA level or of proteins at the polypeptide chain level:acquisition of sequences, analysis of these data, and management of DNA, RNA, and protein sequencedata.
METHODS FOR SEQUENCE ACQUISITION
Generation of Long DNA Fragments without Gaps
Sequencing short pieces of DNA (i.e., less than 5 kb) does not require the use of specialized programsfor aligning sequence subfragments obtained experimentally. One can start from both ends of theoriginal segment and extend the sequence by using oligonucleotides or by using sequencing of nesteddeletions. This is not an easy or cost-effective effort when one is sequencing large segments. In thiscase, it is more efficient to use as the starting material a DNA library generated by shotgun cloning ofultrasonicated DNA or DNA fragmented with frequently cutting restriction enzymes. In this regard, it isimportant to make use of programs permitting automated alignment of fragments, generating contiguousoverlaps (contigs). This task is not trivial, however, because the sequenced DNA segment often containsrepeated regions displaying little or no variation. In addition, sequenced fragments contain errors,especially at their extremities, which are the very regions relied on for generating contigs.
Roger Staden has developed a program which has improved over the years in efficiency, speed, anduser friendliness. It is now incorporated in many sequence analysis softwares and generates a contiguoussequence from a few hundred fragments (33, 34, 59, 175, 177, 178). Recent availability of sequencingmachines has renewed interest in constructing new programs aiming at generating reliable contigs, andthis is good news for investigators sequencing genomes of bacteria related to E. coli such as Salmonellatyphimurium (official designation, Salmonella enterica serovar Typhimurium). New programs areneeded because of limitations in current programs, such as the following: (i) one must often orderbatches of more than 1,000 sequences; and (ii) one can seldom make use of the original raw data, eventhough this would be extremely helpful, because most fragments contain a high level of ambiguousassignments, as well as erroneous insertions or deletions (of the order of 1% or more), and also becausesome fragments corresponded to duplicated regions very similar in sequence. The new programs basedon completely new and original principles permit construction of reliable contigs generated from morethan 1,000 fragments within a few hours, using a workstation (80) or simply a personal computer (60),even when the sequenced segment contains repetitions. New improvements deal mainly with contiglength.
All programs for contig construction proceed in two steps. They start by determining a similarityindex between fragments, in order to identify overlaps, and subsequently concatenate those whichdisplay regions of strong similarity, using a procedure designed for automatic classification.
(i) Programs differ chiefly in the methods used for detecting similarities. Those described inreferences 80 and 135 compute a similarity index by dynamic programming (the latter takes into accounta global similarity index between sequences, whereas the former uses the highest score from the besthomology fragment present in similar sequences). The program described in reference 177 identifies thelongest common similar motif, and that described in reference 60 combines an information indexcomputed from the number of words in common between fragments with a score obtained by dynamicprogramming.
(ii) The programs described in references 80, 135, and 177 use the same method for contigconstruction: they order the fragments as matching pairs according to their similarity. Two fragments arethe most proximate when their similarity (as discussed above) is higher. The method is a sequential one,each fragment being placed with respect to the fragments which have already been positioned withrespect to each other. This kind of approach is questionable when sequences are chimeric or repeated, orwhen they display numerous errors at their extremities (backtracking inappropriate ordering is extremelydifficult when the starting clustering process is erroneous). In contrast, the program written by Gleizesand Hénaut (60) proposes a global approach: the fragment collection is taken as a single entity, and thefragments are ordered into each contig before alignment, thus allowing early detection of unlikelyevents.
An important aspect of the procedure used for generating contigs will be the management of themany sequences which are present in the literature and which can be combined to generate a detailedpatchwork chromosomal sequence for organisms such as E. coli.
At this stage of data acquisition, elimination of parasite data (vector sequences) is an important issue(cf. the many vector sequences present in data libraries [96, 108, 141]). On the whole, sequenceinformation is generally obtained from analysis of short DNA fragments cloned into a variety of vectors,and one must discard the sequences which contain vector sequences. This is not particularly difficult. Ina first round, sequences containing only vector sequences are eliminated, and chimeric sequencescontaining fragments of the vectors are subsequently treated, with knowledge of characteristic featuresof the vectors; “clean” sequences, with no remaining vector sequences, are then used for contiggeneration.
Localization on the Restriction Map
E. coli was the first living organism for which we possessed a detailed physical map. In 1987, Koharaand coworkers, in a seminal paper, described the restriction map of the entire E. coli K-12 chromosome,using eight restriction enzymes, EcoRI, EcoRV, HindIII, BamHI, BglI, KpnI, PstI, and PvuII (92). The
corresponding map ordered almost 8,000 restriction sites. It was therefore generally difficult, knowingonly a list of fragment lengths from a cloned region, to map it by visual comparison with Kohara’s map.Many programs permitting direct comparisons between restriction maps have been written, and somehave been devoted specifically to E. coli (81, 113, 120, 154). The programs of Médigue et al. (113) andRudd et al. (154) are specifically designed for the E. coli genome. They take into account the fact thatKohara’s data are not always accurate (i.e., some sites are missing, and sites that are next to each otherare often inverted when they originate from different enzymes or are taken as a single site when theycome from a single enzyme). Such programs have been used for some time to permit localization ofcloned genes, in order to avoid using the tedious and sometimes difficult in vivo genetic mappingstrategy.
It is clear, however, that as more and more sequences of genes have become known, these programshave become obsolete. It is now much easier to sequence a short fragment of the cloned gene andcompare it with the known sequence (e.g., the BigSeq file proposed by Rudd and coworkers [153]). Inprinciple, however, the programs could be used to map genes on other chromosomes, at the start ofgenome projects, when a restriction map is known.
Data Libraries and Specialized Databases
Data Libraries. At present, four main libraries constitute a repository of an almost complete set of theDNA sequences generated worldwide (Table 1): the EMBL-EBI data library (146), GenBank (geneticsequences data bank [11], now administered by the National Center for Biotechnology Information),DDBJ (DNA data bank of Japan [122]), and GSDB (genome sequence data bank [1]). These librariescollect all existing information on DNA sequences published or submitted for publication. They are notspecialized for individual organisms; in fact, they contain all data sent to them, from sequences shorterthan 10 nucleotides (!) to complete individual genomes. As a result, the corresponding information ishighly redundant.
Data can be organized into phylogenetically consistent patterns, which permits one to compare aparticular organism, in our case E. coli and other, related enterobacteria, with near and distant relatives.As a case in point, the Ribosomal Database Project compiles ribosomal sequences and related data fromall possible organisms and redistributes them in aligned and phylogenetically ordered form. It also offersvarious software packages for handling, analyzing, and displaying sequences. In addition, this projectoffers certain analytic services dealing with phylogenies of rRNAs. The project is still in an intermediatestage of development but may be expected to bring important information on the structures andfunctions of ribosomes in general and of model organisms in particular (98, 127). R. Christen([email protected], unpublished data) has also developed an rRNA database for bacteria whichcomprises more than 1,800 individual species.
For protein sequences, data have been collected since the early 1950s. A paradigm is the Atlas ofProtein Sequence and Structure, developed by Dayhoff and coworkers and published yearly (32). Atpresent, there are two main protein data banks: PIR/NBRF (9) and SwissProt (8). The latter is much lessredundant than the former, and Bairoch is very careful in annotating sequences as precisely andcompletely as possible. This is, understandably, at the expense of exhaustivity
There also exist libraries which are derivatives of these primary sources of information anddedicated to a specific topic. They contain an “added value” due to the fact that their authors have doneconsiderable work— sometimes measured in years of effort— to organize or annotate the data. The mostfrequently used are NRL_3D, PROSITE, and BLOCKS. NRL_3D (133) is a PIR/NBRF subproduct; itcontains all protein sequences whose structures have been determined at a significant resolution level,generally by X-ray diffraction or high-resolution nuclear magnetic resonance spectroscopy. PROSITE(7) is distributed by the EMBL-EBI. It is a bank of consensus motifs organizing the protein sequencespresent in SwissProt into classes. For each class, the corresponding annotations are the result of the work

of specialists. As a result, they are very rich and precise. The way in which they are indexed permits aneasy analysis of protein classes present in the genomes of prokaryotes, such as E. coli and S.typhimurium. BLOCKS (76) has the same goal as PROSITE, but it provides multiple alignmentscorresponding to the consensus motifs.
PRODOM is a protein data library, generated from SwissProt, which aims at identifying individualdomains present in proteins and assembled in a combinatorial way in different types of proteins (173).PRODOM identifies domains only when they are part of proteins differing in structure or function.Hence, domains can be identified only when they have been shuffled during evolution betweendifferent protein types. A multidomain protein having only homologous counterparts with the sameoverall structure will appear as a single domain protein for PRODOM. As a consequence, as timeelapses, many proteins present in PRODOM as now displaying one domain will be split into severaldomains.
Searching Data Banks. The total amount of data in sequence libraries is so large that it is impossible toextract appropriate information without the help of a specialized query interface. Many programs aimingat fast interrogation have been written, but none can execute all search criteria that any scientist wouldlike to follow. However, ACNUC, ATLAS, SRS, and Entrez, taken together, cover most of the needs.ACNUC (62) is used mostly for nucleic acid sequences. It has the unique feature of verifying theconsistency of the information present in the EMBL data library, GenBank, or PIR before it creates itsown index tables and thus is the cleanest and surest search program. In contrast, ATLAS (9) is usedmostly for proteins. It allows one to answer immediately queries of the type “which are all the proteins,present in the banks, having the sequence GDSGGP?” or “which are the proteins having less than 15%acidic residues?” SRS (48) permits one to work with almost any type of data library by automaticgeneration of links between them; from a sequence identified in the EMBL-EBI data library, it ispossible to find the records for the protein in PIR or SwissProt to see whether it contains a motifidentified in PROSITE or BLOCKS and extract all proteins belonging to the same family. Entrezconstitutes the paradigm for the new generation of search softwares. It links sequences present inGenBank or PIR to references present in MEDLINE. In addition, this software links together thesequences which have been considered similar by the program BLAST (5).
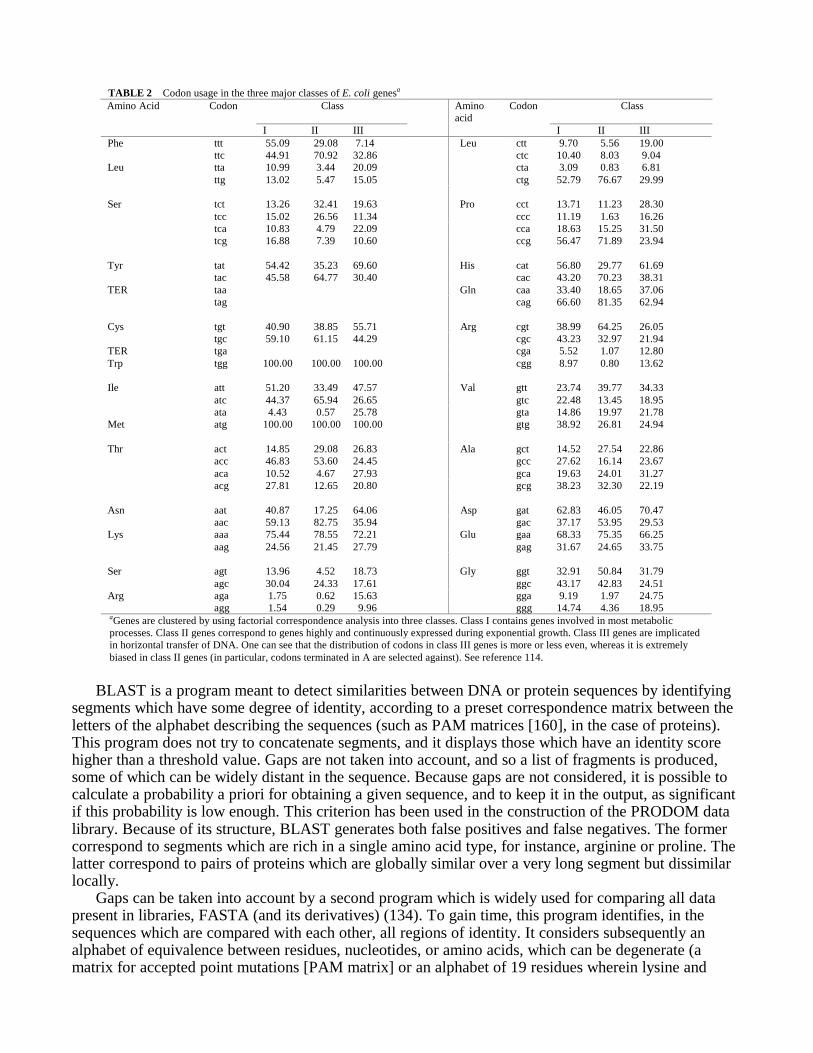
TABLE 2 Codon usage in the three major classes of E. coli genesa
Amino Acid Codon Class Aminoacid
Codon Class
I II III I II IIIPhe ttt 55.09 29.08 7.14 Leu ctt 9.70 5.56 19.00
ttc 44.91 70.92 32.86 ctc 10.40 8.03 9.04Leu tta 10.99 3.44 20.09 cta 3.09 0.83 6.81
ttg 13.02 5.47 15.05 ctg 52.79 76.67 29.99
Ser tct 13.26 32.41 19.63 Pro cct 13.71 11.23 28.30 tcc 15.02 26.56 11.34 ccc 11.19 1.63 16.26 tca 10.83 4.79 22.09 cca 18.63 15.25 31.50 tcg 16.88 7.39 10.60 ccg 56.47 71.89 23.94
Tyr tat 54.42 35.23 69.60 His cat 56.80 29.77 61.69 tac 45.58 64.77 30.40 cac 43.20 70.23 38.31
TER taa Gln caa 33.40 18.65 37.06 tag cag 66.60 81.35 62.94
Cys tgt 40.90 38.85 55.71 Arg cgt 38.99 64.25 26.05 tgc 59.10 61.15 44.29 cgc 43.23 32.97 21.94
TER tga cga 5.52 1.07 12.80Trp tgg 100.00 100.00 100.00 cgg 8.97 0.80 13.62
Ile att 51.20 33.49 47.57 Val gtt 23.74 39.77 34.33 atc 44.37 65.94 26.65 gtc 22.48 13.45 18.95 ata 4.43 0.57 25.78 gta 14.86 19.97 21.78
Met atg 100.00 100.00 100.00 gtg 38.92 26.81 24.94
Thr act 14.85 29.08 26.83 Ala gct 14.52 27.54 22.86 acc 46.83 53.60 24.45 gcc 27.62 16.14 23.67 aca 10.52 4.67 27.93 gca 19.63 24.01 31.27 acg 27.81 12.65 20.80 gcg 38.23 32.30 22.19
Asn aat 40.87 17.25 64.06 Asp gat 62.83 46.05 70.47 aac 59.13 82.75 35.94 gac 37.17 53.95 29.53
Lys aaa 75.44 78.55 72.21 Glu gaa 68.33 75.35 66.25 aag 24.56 21.45 27.79 gag 31.67 24.65 33.75
Ser agt 13.96 4.52 18.73 Gly ggt 32.91 50.84 31.79 agc 30.04 24.33 17.61 ggc 43.17 42.83 24.51
Arg aga 1.75 0.62 15.63 gga 9.19 1.97 24.75 agg 1.54 0.29 9.96 ggg 14.74 4.36 18.95
aGenes are clustered by using factorial correspondence analysis into three classes. Class I contains genes involved in most metabolicprocesses. Class II genes correspond to genes highly and continuously expressed during exponential growth. Class III genes are implicatedin horizontal transfer of DNA. One can see that the distribution of codons in class III genes is more or less even, whereas it is extremelybiased in class II genes (in particular, codons terminated in A are selected against). See reference 114.
BLAST is a program meant to detect similarities between DNA or protein sequences by identifyingsegments which have some degree of identity, according to a preset correspondence matrix between theletters of the alphabet describing the sequences (such as PAM matrices [160], in the case of proteins).This program does not try to concatenate segments, and it displays those which have an identity scorehigher than a threshold value. Gaps are not taken into account, and so a list of fragments is produced,some of which can be widely distant in the sequence. Because gaps are not considered, it is possible tocalculate a probability a priori for obtaining a given sequence, and to keep it in the output, as significantif this probability is low enough. This criterion has been used in the construction of the PRODOM datalibrary. Because of its structure, BLAST generates both false positives and false negatives. The formercorrespond to segments which are rich in a single amino acid type, for instance, arginine or proline. Thelatter correspond to pairs of proteins which are globally similar over a very long segment but dissimilarlocally.
Gaps can be taken into account by a second program which is widely used for comparing all datapresent in libraries, FASTA (and its derivatives) (134). To gain time, this program identifies, in thesequences which are compared with each other, all regions of identity. It considers subsequently analphabet of equivalence between residues, nucleotides, or amino acids, which can be degenerate (amatrix for accepted point mutations [PAM matrix] or an alphabet of 19 residues wherein lysine and

arginine would be equivalent, for instance), and computes a score for each similarity segment. It caneasily be seen that speed increases at the expense of sensitivity: two “homologous” segments displayinga large number of conservative replacements will escape identification. In a second step, FASTA tries tochain homologous segments and aligns the regions located in between with a classical algorithm. Thus,FASTA attempts to create an alignment for the largest possible composite segment, creating gaps atappropriate locations. However, because there is a penalty score for gaps, if the gap is too large, only thebest aligned segment will be conserved, leaving parts of the sequence aside even though they had beenidentified as significant in the first round.
BLAST and FASTA are complementary programs: a similarity detected by one program can escapethe other, and vice versa. It is therefore important to have an idea of the significance of alignments, interms of both statistics and biology, and, in many cases, to use both programs. The algorithm permittingdetection of local homology written by Smith and Waterman (171) (program BESTFIT of the GeneticsComputer Group package [40]) is more sensitive, but it is also much slower and cannot be used forscanning the totality of banks unless run on machines having a dedicated architecture (program BLITZon a machine using 4096 parallel processors, accessible through an electronic mail server at the EMBL-EBI). The very high number of sequence duplicates in data libraries makes the identification ofsimilarities difficult. Altschul et al. (4) discuss some of the means which can be used to get round thisdifficulty.
It has not been possible to give a straightforward interpretation of the significance of a sequencealignment. As usual, E. coli provided paradigm studies. Landès et al. (97), analyzing E. coli tRNAsynthetases, have shown that one of the most reliable methods, but certainly one not without flaws, isbased on a statistical evaluation, using the simulation power of computers, of the score value Q ofprogram BESTFIT (106). The principle of the method is to compare score Qij obtained by usingBESTFIT between sequences i and j with the score obtained with sequence i and a random permutationof the symbols describing sequence j. This operation is repeated a hundred times, permitting calculationof a mean score Qm and a standard deviation σ. The Z score Zij for sequences i and j is given by Zij = (Qij– Qm)/σ. One can extract from the Z score histogram a value Z0 that permits separation between thosesequences which are strongly related to each other and the others (Z scores higher than Z0 for the formerand lower than Z0 for the latter). To calculate the distance dij between sequences i and j, one firstcalculates the probability pij that a score Z will be higher than score Zij , assuming that Z scores follow anormal distribution (p0 is the value of this probability for score Z0): dij = log(pij) – log(p0) if Zij < Z0 anddij = 0 otherwise.
Databases Dedicated to E. coli. Several data libraries dedicated to E. coli have been maintained, someof them for a long time. Since 1989, Wahl et al. have collected the E. coli sequences present in theEMBL data library and in GenBank (187, 188). In the same way, Rudd et al. have developed a softwarewhich contains both data files and programs for collecting, aligning, representing graphically, andanalyzing sequences (151–153). This permits them to represent the gene and restriction maps togetherwith sequences obtained from various laboratories after elimination of redundancies. These programsand data sets are available from the National Center for Biotechnology Information at the U.S. NationalLibrary of Medicine (Table 1). EcoSeq is a nonredundant collection of genomic DNA sequences;EcoMap is an alignment and integration of EcoSeq with the genomic restriction map of Kohara et al.(92); EcoGene is a database of information about genes and gene products; MapSearch is a restrictionmap alignment program; PrintMap is a Postscript-based publication-quality map drawing utility;GeneScape is a genomic restriction map editor/browser for Macintosh computers; ChromoScope is aplatform-independent network-based application for sequence/map display, alignment, retrieval, andmaintenance. Also, StySeq1 (11% of the chromosome of S. typhimurium) has just been completed and ispresently available on the same site. It is described in this book (chapter 110). At much the same time,Médigue and coworkers developed a database managed by the relational database management system(DBMS) 4th Dimension on Macintosh (116). The corresponding data structure, which allowsmulticriterion searches, was exported to develop specialized databases for other genomes such as that ofSaccharomyces cerevisiae (170) or Bacillus subtilis (123). Finally a database for managing E. coli

sequences, Escherichia coli Genome Database (95), has been developed in Japan. More recently Moriand coworkers have organized E. coli sequence data into a series of flat files, GenoBase, which can beaccessed through a graphic interface: clicking with the mouse on a given region of the map (displayedgraphically) allows one to display the records containing the related information (DNA and proteinsequences, aligned result of a FASTA search) (GenoBase 1.1; K. Takemoto, M. Yano, Y. Akiyama, andH. Mori, unpublished data). This structure does not provide, however, the relational interface permittingmulticriterion searches.
A recent trend in the development of databases dedicated to the management of compete genomesis the use of sophisticated informatics techniques allowing scientists to handle not only data but also theknowledge associated with them. Development of software able to guide the user in the choice ofappropriate methods for a given purpose would constitute a significant advance. Environments whichallow one to model and to manipulate descriptive knowledge generated by a genome sequencingprogram, to help the user in solving sequence analysis problems through task decomposition and methodselection, and finally to display and to manage the set of newly created objects are being constructed.These systems are therefore meant to integrate descriptive knowledge on the entities involved (genes,promoters, maps, etc.) together with methodological knowledge on a large and extendable set of analysismethods. Such object-oriented knowledge bases have been developed by Shin et al. (166) and byPerrière and Gautier (ColiGene [138]).
Finally, there are databases dedicated to the management of bacterial strains. The paragon is the basedeveloped by Berlyn and Letovsky for the management of B. Bachmann’s E. coli Genetic Stock Center(13, 102; chapter 134 in this volume). A description of the Salmonella Genetic Stock Center and relatedinformation appear in chapters 135 and 136. There is also a reference collection, EcoR, for naturalisolates of E. coli isolated from all parts of the world (126).
Linking Gene Databases to Data on Intermediary Metabolism. A few databases are oriented to theintermediary metabolism of E. coli. DBEMP (database for enzymes and metabolic pathways) is beingdeveloped by E. Selkov et al. (Institute of Biophysics, Puschino, Russia). DBEMP contains informationon enzymes and metabolic pathways derived from published articles. Its major strength comes from itscomprehensiveness: 10,000 records, based on 6,000 articles and including more than 2,000 enzymeactivities from all animal and plant sources. The DBEMP format contains about 300 individual fields,covering all features of enzymology. The software management system has been built specifically forthis application; it is developed under MS-DOS and runs on PCs.
METALGEN (150) is a relational database constructed with the relational database managementsystem 4th Dimension (Macintosh). It presents metabolic charts inspired by Boehringer’s metabolicchart (118). Metabolic pathways (the actual schemes are predefined) are freely explored by the userwhile keeping links to the corresponding genes and their regulation. In addition to its dedicated graphics,METALGEN has a built-in possibility to edit pathways and data and to do multicriterion searches.Attached procedures are regularly created and updated for specialized queries. In particular, it permitscalculation of optimal pathways, for a given constraint, as a function of the culture medium and permitsinvestigation of the possible phenotypes derived from the presence of one or several mutations, asproposed by the user. METALGEN currently contains information about 17 general metabolic pathwaysand 111 specialized pathways. They are represented by 300 pictures, 50 of which can be starting pointsto specialized pathways, using mouse clicks. A total of 550 enzymes or protein complexes that catalyze602 reactions and transport are described. They involve 587 metabolites and 450 E. coli genes. Inparallel, it is being linked to information about intermediary metabolism in other model organisms. Thestoichiometry of 5,000 biosynthetic pathways has also been calculated by an embedded program and isincluded in the database.
Finally, EcoCyc, a sibling of the knowledge base CompoundKB dedicated to compounds ofintermediary metabolism (88), is a knowledge base of E. coli genes and metabolism that runs on theMacintosh on Unix workstations. Its graphical user interface creates drawings of metabolic pathways, ofindividual reactions, and of the E. coli genetic map (89, 90). Users can call up objects through a varietyof queries (such as retrieving an enzyme by a substring search) and then navigate to related entities

shown in the resulting display window. For example, a user could zoom in on a region of the geneticmap, click on a gene to obtain detailed information about it, and then navigate to the enzyme product ofthe gene and then to the metabolic pathway containing the enzyme. Metabolic pathway drawings areproduced automatically and can be executed in several styles, such as with compound structures presentor absent. The EcoCyc knowledge base currently contains information about 38 pathways, 200 enzymesthat catalyze 160 reactions, 1,100 metabolic compounds, and 2,030 E. coli genes. EcoCyc containsextensive information about each enzyme, including its cofactors, activators and inhibitors (qualified bytype), subunit composition, substrate specificity, and molecular weight. Individual values in theknowledge base are extensively annotated with citations to the literature, as are comment fields.
Two-Dimensional Gels. Finally, there exists a large collection of data describing two-dimensional gelelectrophoresis of proteins, organized in a specialized database (see chapter 115). It will be important, inthe future, to connect the corresponding data to databases describing genes, sequences, and geneproducts and their functions.
IDENTIFICATION OF SIGNALS IN NUCLEIC ACID SEQUENCES
Identification of Genes
Predicting Genes Coding for Proteins. The first problem addressed by experts when they are facingnewly sequenced DNA segments is localization of the regions which code for proteins. Despite the factthat many methods for solving this problem have been published, none are totally successful. In the caseof E. coli, the problem has been initially simplified, because the codon usage, as derived from the firstset of sequenced genes, is strongly biased. Knowing that an open reading frame (i.e., a region of 3nnucleotides limited by a translation termination codon, UAA, UAG, or UGA) contains a high frequencyof such biased codons strongly suggests that a protein-coding sequence is contained within the openreading frame (with the corresponding reading frame) (176).
This method is suitable only for genes which have a codon bias defined by the first set of geneswhich have been sequenced and is therefore dangerous to use as an only source of information fordefining protein-coding sequences (we reflect here the experimentalist’s bias). Indeed, as found byMédigue et al. (114), there is in E. coli at least one class of genes which escapes identification: the classof genes exchanged by horizontal transfer. Other methods should therefore be used in this case.Examples are the method of Fichant and Gautier (52) (which is based on the identification of aheterogeneity in the frequency of bases present in each of the three reading frames) and the GenMark(renamed GeneMark, for copyright reasons) software (20), derived from work on periodical Markovchains (91). Both methods are based on the identification of the triplet base composition bias betweenthe three frames inside coding regions.
Predicting the Physiological Activity of Genes Coding for Proteins. Because the genetic code isredundant, the codons specifying a given amino acid may be used in genes at highly variablefrequencies. It was established long ago that at least under certain circumstances, there is a relationshipbetween codon preference and expression level of genes (17, 61, 65). It has been therefore interesting toorder genes having similar codon usage by using the computation of a χ2 distance between genesaccording to their codon usage. This distance has been subsequently used for clustering genes by usingfactorial correspondence analysis (64, 77, 99). In particular, resorting to this method (35, 73) permittedMédigue et al. to unambiguously demonstrate that E. coli genes fall into three main classes based oncodon usage (114).
In this method, classes are characterized by the importance of the bias between synonymous codons.For example, as seen in Table 2, it was observed that in class II genes, leucine is coded by CUA in lessthan 1% of the cases, whereas CUG accounts for 77% of the codons. The bias is lower in class I genes(3% CUA and 53% CUG) and becomes weak in class III genes (7% CUA and 30% CUG, whichnevertheless remains the major leucine codon). The number of avoided codons (frequency of less than

6%) is very high in class II genes (61, 66, 84, 165). In class I genes, there are only five codons offrequency lower than 6%, and there are none in class III genes. Médigue et al. have summarized theclustering of more than 780 genes of E. coli into the three most obvious classes (116). The classes areunequal; class I comprises 64% of the genes, class II comprises 25%, and class III comprises 11%.Generally speaking, there is a functional kinship between the members of a given class. Genes found inclass III are involved in genetic exchange between organisms. A separate analysis has shown that genespresent in plasmids belong to this latter class.
It had long been assumed that codon usage in a gene was the result of a selection pressure adjustingthe pool of available tRNA molecules to the codon frequency, as a function of the drift toward a meanbase composition mediated by mutations. Class II genes were thought to best reflect this adaptation (17,65, 66, 83, 84, 164). Kurland et al., however, have shown that isoacceptor tRNA concentration andrelative abundance vary as a function of the growth rate, and that the tRNA pool is constantly adapted tothe mean protein composition of the cell (45–47). Correspondence between tRNA relative abundanceand codons used in class II genes, as noticed by Ikemura (83), is true only during exponential growth ona rich medium. The diversity in tRNA composition is much more important when cells are not growingexponentially, and it matches much better the codon frequency of class I or class III genes.
Bacteria are rarely living under exponential growth conditions, and the other states are certainly asimportant for population survival. Accordingly, the results obtained by Kurland and coworkers suggest anew interpretation for the meaning of codon usage: the preferential usage of a codon in a gene reflectsthe composition of the tRNA pool under conditions in which the gene is normally expressed, and thiscomposition can be very different from that of class II genes. This hypothesis predicts that all genesspecific to a given physiological state tend to use synonymous codons in the same way, the degree ofexpression having only a secondary effect on modulating the adjustment between codons and tRNAs.Whether this is true will probably be seen in the fine analysis of codon usage in gene families expressedunder similar conditions. In conclusion, analysis of codon usage is interesting because it can provideinformation on the integration of a gene function in E. coli physiology.
Predicting Genes for tRNAs and rRNAs. With regard to RNA genes, the situation for E. coli isunique, because the sequences as well as the locations in the genome of presumably all rRNA and tRNAgenes are known. The programs which have been developed for proposing identification of suchsequences therefore are not of much use. However, in the case of tRNAs in particular, there might begenes that are cryptic, or expressed in very special conditions, and thus not yet identified. It wouldtherefore be of interest to use programming language such as the one devised by Searls, which uses alinguistic approach to identify tRNA molecules (161, 162). The program of Fichant and Burks (51),which integrates the knowledge of many tRNA genes into a software constructed ad hoc, permitsscanning of the E. coli genome for putative sequences. This program is supposed to yield less than 1(presumably false-positive) positive outcome for 3 × 10⁵ bp. This low value should prompt furtherinvestigation by the biologist, when a positive score corresponding to no known gene is encountered, todetermine whether this result indicates the presence of a cryptic gene.
Identification of Sequence Signals
Predicting Promoters. Three definitions of a promoter coexist: (i) the region permitting the control oftranscription of an operon, as defined by Monod and coworkers; (ii) the binding site of an RNApolymerase, active for transcription initiation; and (iii) a transcription start site, as seen by actualidentification of the 5′ terminus of mRNA molecules. The first definition encompasses large regions ofDNA and involves in particular those regions where transcription factors interact directly or indirectlywith RNA polymerase. Generally speaking, promoter sequences are identified as corresponding to thesecond definition, and this permitted early investigators to propose the existence of so-called consensusregions believed to identify the binding sites for RNA polymerase, after isolation of a collection ofpromoter region sequences. According to this definition, E. coli promoters encompass a ≈75-nucleotideregion upstream of the RNA start site. Counting from the start site, Pribnow initially proposed that a

consensus sequence TAT(A/G)AT, comprising six bases, was situated around –10 (144). Subsequently,Maniatis et al. (110) discovered that a second conserved region, TGTTG, was located around –35.Siebenlist et al. (169) further refined the consensus by changing it to TTGACA after having analyzed acollection of promoters. Automatic identification of promoters started with this concept of consensus.However, as more promoters were collected, the very notion of consensus became more and more fuzzy,because for each position of a promoter, an exception could be found. The degeneracy is such that acombination of –10 or –35 motifs can be found every 200 nucleotides in a random sequence (44). Thisobviously precludes the use of consensus sequences in the actual prediction of promoters. It is thereforeclear that one has to find other means to identify promoters (and indeed, when facing the problem, thoseinvolved in the sequencing of the E. coli genome have in fact combined a consensus approach withindividual scanning of the sequence by eye).
Some progress was made when it was recognized that the spacing between the consensus regionswas preserved (presumably indicating some sort of physical constraint between RNA polymerasesubunits). This demonstrated that the meaning of a consensus motif depended on its surroundingregions. One therefore had to incorporate biological knowledge of the actual process of recognition ifone wished to construct predictive methods (6, 72). Hawley and McClure (72) introduced the idea thatthe significance of a consensus motif in the overall composition of the region was to be found in theglobal nucleotide composition of the region. Harley and Reynolds (70) demonstrated that the regionbetween –35 and –10 generally spanned 17 ± 1 nucleotides, the maximum variation being between 15and 21 nucleotides. On the basis of this description, most promoters can be separated into three groupsas a function of the spacing between the consensus regions (16, 17, or 18 nucleotides), maximumefficiency being obtained when the spacing is 17 nucleotides (6).
Schneider et al. (159) proposed to give a measure for consensus sequence “plasticity” at a givenposition (its degree of uncertainty), thus giving a quantitative background to the concept of signal. Forthis, they used a fundamental concept in information theory, Shannon’s entropy (163).
H, Shannon’s entropy of system X, is described as
H(X) = -∑ i=1 n pi log2 pi
where pi represents the probability for the different states of the system (i.e., probability of findingnucleotide A, C, G, or T at a given position X). Three properties justify the use of Shannon’s entropyH(X) as a measure of the degree of uncertainty: (i) it becomes zero when a given state is known forcertain (a single nucleotide type can be present at position X); (ii) for a given number of states, it ismaximum when the states have equal probability, and it increases with the number of states (the entropyvalue is 2 if the four bases have equal probability); (iii) it is additive (i.e., when several independentsystems are taken as a whole, their entropies are added [the entropy of a sequence is equal to the sum ofthe entropies of each position]). It must be emphasized that this measure of information refers not to asingle sequence but only to families of sequences. The bit is the entropy unit.
Despite its very primitive character (it is simply the computation of an average value), Shannon’sentropy can measure some degree of knowledge about a given sequence. Let us consider a sequencesegment X; we shall evaluate the information which is added when the state of the system is becomingknown. Before knowing the function of the system (initial state), the probability that a given position isoccupied by a given nucleotide is equal to the probability pi of presence of this nucleotide in thesegment. The corresponding Shannon’s entropy H(X) is maximum. Once the function Y of the segmentis deciphered (for example, it is a promoter), the uncertainty as to the presence of a nucleotide at a givenposition is reduced, and Shannon’s entropy H(X|Y) is lower than the entropy a priori (it becomes zero ifthere is only one nucleotide possible at each position). If we term IYàX the information brought about bythe determination of state Y of system X, it can be measured by the diminution of Shannon’s entropywhen compared with the situation a priori: IYàX = H(X) – H(X|Y).
Stormo proposes two additional approaches to measure the information content of a sequence (180,181). The first one is based on an analogy with a thermodynamic equilibrium, and the second is basedon a probabilistic view of the problem (likelihood statistics). The domain of validity of the

thermodynamic analogy has been experimentally studied (181). Each of these different viewpoints hasits own value. All lead to the same mathematical equations. In what follows, we shall use only thevocabulary of information theory, but one should bear in mind that the underlying justification could reston assumptions other than those explicitly made in this theory.
In the practical use of the concept of Shannon’s entropy, one must take into account the fact that it isrelative and refers to families of sequences having the same general properties. To speak of the Shannoninformation content of a given genome, as is sometimes done, therefore makes no sense.
When considering a set of sequences for which a consensus is sought, one must be sure of theconformity of each sequence with respect to all sequences present in the consensus set. Thus, O’Neill(128) proposed a semiempirical formula derived from the work of Berg and von Hippel (12), who havedetected a composition bias in the 58 nucleotides covering the promoter region. This semiempiricalformula results in a description of an E. coli σ70 promoter which is more complete than the descriptionwhich uses a consensus matrix (176). It takes into account the probability of dissociation of RNApolymerase as a factor permitting discrimination of promoter sequences.
All of these methods, which helped refine the concept of signal and progressively led toabandonment of the idea of consensus (70, 112, 176), permitted O’Neill and Chiafari (132) to constructa prediction method for identification of σ70 promoters. Despite the fact that one has to look for a singlebiological entity, these authors have been led to construct four different programs; they take into accounta region spanning 58 nucleotides and split the search between four promoter types, in which 16, 17, and18 nucleotides, as noticed by Hawley and McClure (72), separate the –35 region from the –10 region.The fourth type corresponds to viral promoters, wherein a 17-nucleotide span is fixed, and it differs fromchromosomal counterparts.
We wish to emphasize at this point that the very nature of a promoter remains a mystery; theprograms of O’Neill and Chiafari (132) cluster together heuristics (an heuristic is a general explorationprocedure, an educated guess based on intuition and expertise, which models reality but explores onlythe “best” pathways and therefore cannot necessarily achieve its goal or provide an explanation for itspossible success), which are applicable only to promoters for which the separation between the –35 and–10 regions is 16 to 18 nucleotides. Not only do they leave open the question of the other types ofpromoters, but they also assume the existence of four types, while at the same time it is supposed that itis the same σ70 holoenzyme which recognizes all types. The true reason underlying the promoterrecognition process by RNA polymerase is therefore still unknown (see, however, reference 41).
O’Neill (129) summarized efforts made during 15 years to precisely identify promoters. He studiedthe logic underlying the organization of the various types of promoters. It seems that in all cases, onecould identify a 10-nucleotide-long degenerate palindromic sequence, repeated at least five times andconstituting the core sequence of all promoters. However, there is no experimental verification of theimportance of degenerate palindromes, and the statistical analyses that led to these conclusions wereflawed by the small sample size and too many related promoters, as pointed out by Cardon (24), whoused a larger, more complete promoter collection.
The analysis of crystals of a repressor-operator complex permitted identification of some of theconstraints operating in the protein-DNA interaction, which could be important in the case of RNApolymerase-promoter interactions (93). This would explain some of the variety of conservation observedalong the promoter sequences: some nucleotides interact directly with the protein, whereas others areresponsible for minute alterations in the local DNA structure, permitting optimum accommodation of theprotein. This change in standpoint, which has witnessed a change in the study of promoter sequencesfrom a simple linear consensus sequence to a three-dimensional structure wherein nucleotides do notplay a role in themselves but act through their influence on the spatial configuration, is typical of amajor trend in the evolution of ideas in the future analysis of genomes in silico. A comparable evolutionis witnessed at present in the direct experimental approach, whereby, for example, supercoiling of DNAis now taken into account as a major determinant of promoter function (53). This change is in factreflecting a modification in our understanding of the biological meaning of the sequence: in terms ofShannon’s entropy, this means that we are changing our baseline. The actual information (in the sense ofShannon) is in fact measured by the deviation from an a priori that we do not know; a major task for

biologists will be to propose new ideas about the nature of the sequence a priori (what is a randomsequence?) in order to pinpoint the deviation, biologically significant, from this zero level. This placesinformation analysis of genomes in a position where the discussion of Bayesian statistics has been themost passionate. And one must note that this zero level can differ according to the biological processwhich is considered. As a first approximation, for instance, the zero level for replication machinery is arandom sequence having the same base composition. In contrast, for translation it is likely that oneshould use as the random baseline a sequence, taking into account the triplet structure of the codingsequences.
Predicting Transcription Terminators. Two processes control transcription termination in E. coli.Among other features, they differ by the proteins which are involved, in particular by the presence oftermination factor Rho. Most operons terminate transcription in a Rho-independent manner at siteswhich have been defined by the presence of stem-loop structures followed by a run of T’s. Identificationof terminators is a good example of the variety of viewpoints which must be correlated when one wishesto assign a function to a nucleotide sequence with some efficiency. Despite their distinctive features,true Rho-independent terminators cannot be predicted easily.
At first sight, the efficiency of a termination signal should be governed by the stability of its stem-loop structure and by the length of the run of T’s. But many counterexamples exist, and one can describestem-loop structures with the same thermodynamic stability placed in terminators having very differentefficiencies. There also exist strong terminators with no or only a few T’s. In the same way, the twosequences proposed to be important by Brendel et al. (21), CGGG(C/G) and TCTG, are absent frommany terminators. As in the case of promoters, consensus sequences cannot be used to predict that asequence acts as a terminator. It seems, however, reasonable to assume that the stem-loop structure,ending in T’s, can constitute the core sequence of terminators. D’Aubenton-Carafa et al. (31) haveanalyzed the structure of terminators, and in particular the role of the run of T’s, and have proposed thatwhat is important is the relative position of each T residue with respect to the length of the T run. Theyhave defined an empirical parameter nucleotide which penalizes an interruption of the poly(T) sequencethe most when it is located near the end of the stem structure.
The second requisite for the sequence to be a terminator is that it form a hairpin structure in the 50nucleotides upstream of the poly(T). The efficiency of the hairpin as a terminator is measured by theparameter Y, which is the ratio of its energy stability ∆G (calculated according to the model of Yagerand von Hippel [193]) to the total length of the hairpin, including the loop. An empirical linearcombination of both parameters permits one to decide whether a sequence is likely to be a Rho-independent terminator. According to the authors, using this criterion gives 5% false positives and 5%false negatives. A direct experimental approach has substantiated some of this description, but it couldnot be further confirmed because the efficiency of terminators may be strongly dependent on theenvironmental growth conditions (143, 179).
Rho-independent transcription termination signals illustrate identification of sequence signalswithout going through a step whereby consensus sequences are looked for. The efficiency of the methodof d’Aubenton-Carafa et al. (31) is probably due to the fact that their description takes into accountactual physicochemical processes involved in termination. Another example of such identification is thesearch for self-splicing intron sequences.
Predicting Introns. Self-splicing introns have been discovered in eukaryotic cells and their viruses.However, it was found early on that bacteriophage T4 harbored several group I introns, and suchintervening sequences were also found in archaebacteria and most organisms (25, 94, 145, 168, 192).More recently, mobile elements encoding reverse transcriptase were found in myxobacteria and in E.coli B (105). It was further discovered that E. coli strains in the EcoR collection often contained group IIintrons (50). It was therefore of interest to devise programs able to predict the locations of introns in newDNA sequences. Group I introns are defined in biochemical terms by their ability to make a covalentlink between a guanosine and their 5′ end during the first phase of excision. Group I introns are sodiverse that only seven nucleotides are strictly conserved, and among these only two are located at a

fixed distance from each other in the sequence. In contrast, the secondary structure of the intron’s core isvery well preserved, having six helices always present. There are, however, a large variety of forms,including bulging nucleotides, unpaired bases, variation in length, and, from time to time, largeinsertions, so that the lengths of the terminal loops as well as the distance between the core and theexcision site are impossible to predict (for a review, see reference 119). In spite of these problems,Lisacek et al. (107) showed that it was possible to predict the presence of a group I intron with aprobability of 92%, with less than one false positive in 106 bases. The recognition process consists ofgenerating and evaluating a large number of possible local solutions, which are then progressivelycombined into more and more complex structures, up to a stage where a complete core is formed (six toseven putative helices are formed of paired segments, six segments form connecting regions, and threeloops form the ends). Identification of a group I intron core rests not on identification of a special motifbut, on the contrary, on a global approach whereby all data on primary or secondary sequencessimultaneously interplay. This success has been possible because the program of Lisacek et al. (107) isnot simply heuristic but reflects in a formal way the very nature, in physicochemical terms, of theseobjects and permits the direct and unambiguous search of the corresponding pattern in the sequencesunder study. At present, E. coli K-12 seems to be an exception in that it does not appear to harbor anyintron.
Initiation of Translation. In 1974, Shine and Dalgarno (167), studying the translation start sites ofRNA virus genes, discovered that these sites were complementary to the 3′-OH end of 16S rRNA. Theyimmediately proposed that this corresponded to a specific site selected by the ribosome 30S subunit foridentification of the start codon, AUG, GUG, or UUG. This was the first example of a consensussequence, and it can be surmised that Shine and Dalgarno’s publication started the general trend forlooking for consensus sequences as determining recognition processes for regulatory sites. WhenmRNAs were identified, it became more and more evident that something like the Shine-Dalgarnosequence was in general present upstream of the start codon, but that the spacing between theseribosome binding sites and the start codon could vary widely (from 5 to 13 nucleotides). In fact, it hasbeen difficult to establish the definition of a domain that is necessary for initiation of translation (182).Several motifs have been identified either upstream (184) or downstream (174) of the initiation codon instrongly expressed genes. Thanaraj and Pandit (184) have combined the identification of a consensussequence with information on putative secondary structures; Sprengart et al. performed experimentsdirectly on the translation initiation region of gene 0.3 of bacteriophage T7 (the T7 gene displaying thehighest expression level) (174). Finally, Dreyfus (43) randomly cloned translation initiation regionsfrom E. coli and compared these regions with in-phase initiation codons of eukaryotic origin. This ledhim to identify some of the constraints operating in the –20,+15 region of the initiation region. He coulddemonstrate that this region, although still not well characterized, is sufficient to entirely determine thepresence of a start site, despite the fact that the region studied corresponded to genes translated with anextremely variable efficiency. This result was further extended and substantiated by analysis of theexpression of more translation initiation regions, including regions with artificially constructed Shine-Dalgarno sequences (10, 147).
Perrière explored the idea that there is a strong correlation between translation initiation signals andthe degree of gene expression (137). With this aim in mind, he constructed three sets of genes thought todiffer in expression level plus a random sequence batch displaying the same average base composition.He then compared the information content IY→ X, the similarity with the 3′ end of 16S rRNA, the pairingenergy between mRNA and rRNA, and the putative secondary structures in the region spanningpositions –55 to –1 of the mRNA. This study indicated that the additional sites proposed as favoringtranslation initiation (139, 174, 184) were not preferentially found in strongly expressed genes.Furthermore, the actual distribution of the analyzed criteria does not differ from what would be found inrandom sequences. There is a clear contribution of structure to initiation efficiency, however. Forexample, de Smit and van Duin investigated the influence of secondary structures on the ribosomebinding site and found that competition between intramolecular and intermolecular binding forces was adeterminant for initiation efficiency (38, 39).

Thus, notwithstanding a significant role of secondary structures, the Shine-Dalgarno sequence is theonly signal which has been clearly demonstrated as pertinent in translation initiation, and it is generallycloser to the consensus in strongly expressed genes than in the others (the motif described by Sprengartet al. [174] is a specific case because it seems characteristic of phages T4 and T7). In conclusion,although a probably pertinent description of translation initiation regions involving binding of themRNA to the 3′ end of 16S rRNA has been proposed (82), the level of gene expression in this regioncannot be evaluated with only knowledge of the sequences because we do not know yet how to predictreliably the existence of secondary structures in individual mRNAs.
Theoretical Considerations for the Identification of Signals
Signal Description Using Consensus Sequences. Finding signals has been the first application ofinformatics to sequence analysis in E. coli. The vast majority of studies aiming at identifying signalsdealt with the implementation of heuristics and not with searches of solutions modeled from a realisticrepresentation of phenomena. They are much faster than exhaustive searches but may miss their goal ina generally unpredictable way. This heuristic approach was usually summarized as consensus sequenceidentification. The corresponding studies can be ordered as a function of the estimated complexity of theconsensus sequence.
(i) The consensus sequence is composed of letters (representing nucleotides or amino acids) present,at a given position, in more than half of the sequences. Sometimes it is even less well characterized,displaying a frequency in the examples as low as 35%. In this situation, to use a consensus motif meansto look for an identical or nearly identical motif in a new genomic sequence or in a new protein. Theunderlying logic of this approach is very similar to that used in syntactic analysis. The best results areobtained with proteins (which justifies the use of the PROSITE database of Bairoch) rather than withnucleic acids.
(ii) The composition diversity at a given position in a consensus sequence is conserved in a multiplealignment (this corresponds to another database, BLOCKS [76]), in a consensus matrix (176), or in theShannon’s entropy of a motif (128). In all such cases, it is possible to use an algorithm of dynamicprogramming in order to evaluate the similarity between the consensus and the analyzed sequence, thuspermitting introduction of gaps (insertions or deletions) when necessary.
Description Using Attributes. The methods described above aim solely at preserving a more or lessexact motif in a sequence, implicitly supposed to be the archetype or ancestor from which allexperimental sequences would have been derived by mutation (or toward which the sequence couldconverge). Each position is considered an isolated entity, and no correlation between letters or positionsis considered. Several methods can take into account the existing correlations between letters present atdiffering positions in a given sequence. They have several features in common and can be thought of asmethods involving a process of learning from examples meant to solve classification problems (eitherthrough discrimination between two sets of objects or through assimilation of objects to a set of objectshaving some feature in common). They are used when one does not know, a priori, a decision procedurebut when one has a sufficient number of positive and negative examples. Following a training step usinga set of examples, one builds up a procedure meant to solve the problem. The most significant methodsof this type are as follows.
(i) The Perceptron, a classical learning method in pattern recognition research (149), is aninput/output automaton whereby the input and output levels are linked in such a way that each inputpoint is linked to all output points. Learning consists in making the efficiency (weight) of eachconnection (synapse) evolve by “training” in such a way that at the end of the training period, thebehavior of the overall system reflects as much as possible the behavior expected from the set of givenexamples. This allows one to compute, using the training set, a weight for each synapse. The system issubsequently used in a fixed way, with the synapses having the weight that they obtained after thetraining period. Stormo and coworkers have pioneered the field by using a Perceptron approach forcreating matrices permitting identification of the ribosome binding sites in E. coli mRNAs (183), and

they have been followed by many other authors both for the study of DNA and protein sequences andfor generating pertinent patterns for promoter recognition (2, 124). The Perceptron cannot manage thelogical “or” rule, however; it can recognize only classes well enough separated (it cannot separate aclass for which two properties are simultaneously true or simultaneously false from a class for whichone of the properties is true when the second is false).
(ii) The algorithm of back-propagation gradient (generalized delta rule) alleviates some of thelimitations of the Perceptron by allowing implementation of the logical “or” (155). However, theconvergence of the method toward an optimal solution is not certain. Neural networks represent an easyway to implement this class of algorithms, but they do not permit generation of classifications moreefficient than those obtained using nonneural algorithms of equivalent complexity, as illustratedempirically by Hirst and Sternberg (78). However, they have the advantage that because they can beparallelized, they can sometimes be very fast (37, 49, 79, 109, 130, 131).
(iii) An alternative to these approaches consists of using artificial intelligence techniques.Statisticosyntactic learning techniques have been used for identification of translation initiation regions(148) as well as of promoters (158). With such methods, each object’s description is summarized as alist of attributes. The knowledge generated through learning is visualized as a set of rules (e.g., there is apurine at position 3 and a C at position 7), taken as arguments in favor of a decision process. In order totake a decision, one follows quantitative logic rules, using appropriate threshold values (for instance,true in more than x% of the examples and less than y% of the counterexamples) (172).
(iv) Classical techniques in data analysis (multidimensionnal scaling) are scarcely used in thisdomain despite the fact that they provide solutions which seem to be well adapted to the analysis ofrelationships existing between the positions correlated in short sequences (137).
Such methods represent the most evolved form of investigation in terms of consensus sequences. Allhave some limitation. In particular, they operate poorly on motifs in which one allows for randominsertions or deletions. A significant improvement can be made when the conceptual analysis of thebiological problem can be implemented in the structure of the network. But this does not correspond to atrue help in discovery, since it is precisely biological intuition which is implemented at the start duringthe building up of the network. In this respect, one should remember that most neural networks aresensitive to the “ugly duckling” effect described by Watanabe (189), which indicates that a learningimage can be blurred when the number of learning examples in the training sets increases, unless theexamples have strictly homogeneous properties. But in order to fit this requirement, one must either beextremely lucky or have already understood most of the problem. In addition, there is another difficultyinherent to methods which are not explicitly based on statistical analysis: one cannot check that there areenough degrees of freedom in the system; i.e., the sample may contain many more pieces of informationthan the number of parameters which are computed. The problem is particularly difficult to tackle in thecase of neural networks which are overdimensioned compared with the volume of data. One obtains asystem which behaves very well on the training data, because it can effectively “memorize,” but doesnot do well at generalizing and therefore does poorly on test data not included in the training set.
The Perceptron, as well as most neural network learning techniques (and this has often escapedattention), because they involve reversible formal synapses, have a weight which evolves in aquantitative fashion as a function of their actual use. This means that the synapse weight can fluctuate asa function of the training set. As a consequence, when the set size increases, the weight of each synapsemay go through an optimum value and then slowly go back toward a more or less average value, thuslosing discrimination power. Therefore, as the training set of examples increases in size, the actualefficiency of the consensus matrix created by the learning procedure loses accuracy. In fact, it would beuseful to test ancestors of neural networks which evolve in such a way that the effective transmittingcapacity of a synapse goes irreversibly to zero when its value falls below a certain threshold value,freezing the learning state (29). This is reminiscent of the importance of the terminating step in recursivealgorithms. A relevant example is the prediction of promoter recognition by Horton and Kanehisa (79).These authors used “trimmed” neural networks, in which they reduced the number of weights in theinput window during training by deleting weights when they fell below a threshold (low) value. It wouldbe important to compare and develop new approaches with emphasis on the stability of their learning

capacity as a function of the training sets.
Structural Descriptions. Such descriptive methods provide us only with heuristics, which can becompletely disconnected from the biological reality. A series of studies performed 10 years ago hasidentified the following bottlenecks (55, 56). (i) Biochemical objects are well accounted for if one usesstructural descriptions, whereas such objects can be described only partially in terms of attributes. (ii)There are specific learning methods adapted to the structural mode of description. The knowledge thatthey generate significantly differs from the knowledge derived from more classical methods and cannotbe reduced to the latter (because the descriptions that they use are more complete). (iii) Such modes ofdescription, together with the corresponding learning methods, are complex (“learning” is used herewith the meaning found in computer sciences), and this requires large amounts of central processing unitand memory allocation.
Gascuel and Danchin (57) demonstrated the validity of this structural approach when theycharacterized the structural differences between signal peptides necessary for protein secretion inprokaryotes and eukaryotes. The studies described above further demonstrate that a pertinent descriptionof a signal is possible only if one considers the physicochemical structure and dynamics of theunderlying biological process. In these cases, the solution was obtained not after identification of one orseveral consensus sequences but from a description combining information which does not correspondto the same level (primary sequence, secondary structures), in which the three-dimensional organizationplays a major role.
Linguistic Approaches. The case of consensus sequences reflects the inadequacy of context-freegrammars in the description of biological signals. One needs a descriptive process that takes intoaccount the actual biological recognition process in order to fit the experimental data. As stated byCollado-Vides (27, 28), a model that is descriptively adequate can be thought of as a classificationscheme which takes into account all well-formed signals and discards those which do not fit. Asystematic and integrated description has to be consistent with the actual mechanistic explanations of theprocess. The main illustrations of this approach are the Prolog-derived description of Searls (161, 162)and the linguistic description of units of genetic information (promoters and the like) devised byCollado-Vides (27, 28). Created for the specific situation of σ70-dependent E. coli promoters, it is anattempt which is still in its infancy and as yet unable to make accurate predictions. One therefore muststill consider other methods permitting investigation of biological sequences.
Chaitin-Kolmogorov Algorithmic Complexity. Biology is more a science of relationships betweenobjects than a science of objects (this is indeed the raison d’être of analyses based on genetics). Inparticular, the very nature of the information carried, from generation to generation, in the DNAmolecules that constitute genes cannot be summarized by Shannon’s entropy. For example, “context,”“meaning,” or “semantics” are, by construction, absent from a figure such as a simple statistical mean(which actually represents Shannon’s entropy). When we speak of the “genetic program,” biologyprovides us with a metaphor that displaces the idea of information toward a new field, that ofprogramming and informatics. Is there more insight in these new fields than in the “natural” way ofconsidering information? At least since 1965, Kolmogorov and Chaitin, following Solomonoff and theRussian school of electronicians, have formulated the problem in detail in the following way (for ageneral description, see references 104 and 195). Let us consider the simple case of a chain of characterssuch as those found in computer sciences. What can be said about its information content? A way toconsider the chain is to try to reduce its length so that it can be accommodated in a memory, forexample, using the minimum space, without altering its performance when used in a program (at least interms of accuracy, if not in terms of time)— in short, without losing its information content. This iscalled compressing the data. This problem is of very broad and general interest. It is possible, given achain, to define the shortest formal program (in terms of Turing’s universal computation algorithms, i.e.,algorithms that can be implemented on any machine operating on integers) that can compress an originalchain or restore it given its compression state. The algorithmic complexity, or information value of a

chain S, is therefore defined in this model as the minimal length of the program that can represent S in acompressed form.
The complexity of the sequence made of 1 million A’s is very low, for there are very short programs(e.g., “for i = 1 to 1,000,000; print A; end”) which print this sequence out. The (short) programs whichpermit printing out long sequences can be considered compressed versions of the sequences. In contrast,a sequence of length 1,000,000 having a Chaitin-Kolmogorov complexity equal to 1,000,000 is notcompressible: no means allows it to be described in a shorter form. With this definition, it appears that acompletely random chain S cannot be compressed, implying that the minimal program required tocompress S is identical to S. In this context, the information of a sequence is defined as the measure ofits compressibility (one often uses the concept of complexity rather than information in this context). Asequence of symbols is random if and only if it is not compressible.
Represented as sequences of letters, genes and chromosomes have an intermediate information(complexity) content: one finds local repetitions or, in contrast, sequences which are impossible topredict locally. Their complexity is intermediary between randomness and repetition. The overallcomplexity of sequences originating from higher eukaryotes or prokaryotes is very different, and it linksgenomic sequences to both sides of the “uninteresting” fraction of information (repetition orrandomness). The complexity of the former is more repetitive and is usually much lower than that of thelatter, which looks more random (63). This is quite understandable if one remembers that bacterial orviral genomes are submitted to stringent economy constraints, implying that they must remain verycompact. In contrast, the lengths of genomes of higher eukaryotes are much less constrained, and theycontain, for instance, many repetitive sequences.
Up to this point, we have considered the Chaitin-Kolmogorov complexity of a sequence, but this canalso apply to programs meant to identify meaningful sequences. In addition to the knowledge, presentbut hidden, in a given sequence, it is possible to propose an evaluation of the quality of a description bymeasuring its complexity. (i) The description operating at the lowest level consists of a complete list ofall known sequences. The corresponding information is not at all compressed, which is equivalent tosaying that the sequences are random (the complexity is maximum). (ii) In contrast, structuraldescriptions such as those used for describing Rho-independent transcription termination, or used fordescribing the class I intron core, provide a measure of the Chaitin-Kolmogorov complexity of thesebiological objects, because one now knows the length of a program able to build them up.
(iii) Descriptions using attributes allow the writing of programs much shorter than those which havejust been described. These too simple programs are likely to have a complexity lower than that of thesignals they attempt to describe. In this case accordingly, they correspond to attempts which must fail.
FURTHER ANALYSIS OF NUCLEOTIDE SEQUENCE INFORMATION
From an abstract point of view, a DNA molecule can be seen as a long sequence possessing meaning,but becoming more and more random as the result of mutagenic processes. In contrast, from thebiologist’s point of view this sequence is submitted to a variety of constraints and certainly carries manysignals, even if it looks random. The self-consistency of a genome is maintained as the result of naturalselection, the individual’s survival being the result of these constraints and signals.
The paragraphs above have shown that even when it corresponds to well-identified processes, theanalysis of known signals is not an easy task. A fortiori, the analysis of other (yet unknown) signals in aDNA molecule will be very difficult, precisely because one does not know their very existence.Furthermore, one has reason to suspect, especially in prokaryotes, that the information carried bydifferent signals can correspond to superimposed signals at a given position of the sequence. The geneticcode redundancy for example allows superimposition of independent information at a given position inthe sequence. In addition, there exists a further degree of freedom in protein sequences because aminoacid residues are functionally similar. Nobody knows, at present, how to measure the contribution of thislatter level of degeneracy in the genome.

Lacking a direct experimental approach for evaluating information in sequences, one must rest onmethods which have been validated in various fields other than biology, such as signal analysis orlinguistics: identification of heterogeneity in nucleotide composition, detection of motifs which areunder- or overrepresented, as well as study of their distribution, analysis of regularities, etc.
Identification of Significant Motifs
As in the preceding examples, E. coli has been a paradigm for the identification of motifs. The basicidea for identifying significant motifs is to design, a priori, a probabilistic model permitting generationof a theoretical genetic sequence (for example, actualizing the probability of chaining appropriatenucleotides) and then to compute the mean frequency (expected value) of a given motif in this model-derived sequence. This latter theoretical motif frequency is subsequently compared with the frequencyobserved in the real sequence. If the difference between the two frequencies is important, one cansurmise that the motif reflects a process of biological significance. This approach asks mathematicalquestions (what is the statistical significance of the deviation?) as well as biological questions (how canone interpret the observations?).
The Statistical Meaning of Motifs. Knowing the absolute value of the distance between a meanfrequency and the observed frequency is not enough to permit one to define the statistical meaning of amotif’s frequency. One must also know the standard deviation in the frequency distribution of the motif.A first, classical, approximation is to assume that the standard deviation is equal to the observed mean(Poisson’s law).
The simplest method, and the only possible one in the case of complex models, is to generate a set ofsequences in which the chaining of letters follows a given probability law and then to determineempirically the frequency distribution of the motifs in these sequences (69, 74). The method isparticularly well suited to the identification of motifs located in genes coding for proteins. In this case,the most appropriate theoretical model generates a nucleotide sequence while preserving the amino acidcontent, the specific codon usage of the gene, and the dinucleotide frequency in the codon chaining. Thistheoretical model permits elimination of all constraints linked to the nature and the function of theprotein as well as of the general features of the considered nucleic acid segment.
Unfortunately, construction of such a simulation is not adapted when the frequency of the motifs issmall (i.e., for long motifs). A precise estimate of motif distribution is impossible because this wouldrequire generation of extremely long theoretical sequences, an exercise that poses insuperable practicaldifficulties.
In fact, a rigorous analysis of the problem is even more complicated, because the characteristicfeatures of the frequency distribution of motifs depend not only on the length of the motif but also onpossible overlapping of the motif with itself (for example, two TATA motifs can overlap with a two-letter shift). Gardner (54) has nicely illustrated some unexpected consequences of such overlaps andshown that intuition is of no help if one wishes to make a statistical study of motif distribution.
Pevzner et al. (140) have proposed a measure for the evaluation of the statistical meaning of anymotif. The standard deviation of the frequency is increased according to a specific law when the motifallows for overlaps. These authors have also calculated the distribution of motifs comprising severalwords, not necessarily contiguous. Taking into account in this way complex motifs as well as motifswith allowed overlaps is a technical trick which permits one to easily consider the behavior of Markovchains of high order. Such chains correspond to models in which the probability for finding a letter at agiven position depends on the letters present upstream. The simplest model is the Markov chain of order1: it generates a sequence of letters which keeps the composition bias of dinucleotides (or dipeptides inprotein sequences) observed in experimental sequences. Periodic Markov chain models (19) wereintroduced for more accurate description of DNA regions which code for proteins in E. coli. PeriodicMarkov chains of order 1 keep the three periodic variations in dinucleotide frequencies observed in aprotein-coding region, as a function of their situation in the reading frame. Kleffe and Borodovsky (91)

have established the exact value for the mean and standard deviation of the frequency of a motif in thecase of periodical Markov chains. In this model, one identifies 12 symbols: the four letters (A, T, G, C)in the first position, the four letters (A′, T′, G′, C′) in the second position, and the four same letters (A″,T″, G″, C″) in the third position of a reading frame of period 3. Using this alphabet sequence, ACTGTT. . . is rewritten AC′T″GT′T″. . ., the transition probability for a letter doublet being different accordingto the position in the hypothetical codon. Possessing such a model permits one to calculate directly theexact statistical parameters (means, standard deviation, etc.) of the motif’s frequency in sequencescoding for proteins, whereas simulations give only approximations of such parameters, even after a longcomputation time (to generate long random sequences of digits is very costly in terms of computationtime).
Burge et al. (22) have modified Pevzner formulas which compute the mean value of a motif’sfrequency in order to take into account the fact that a DNA molecule is double stranded, imposing thecondition that the constraints operating on one strand must also be consistently operating on thecomplementary strand.
Several authors have been interested in motifs which are prominent not because of their frequency inthe sequence but because they display special features. Guibas and Odlyzko (67, 68) have studiedrepeated motifs, such as ATAT . . . AT, or the periodicity of motifs in sequences. Their work does not,unfortunately, provide an analytic description for the standard deviation of the distribution of suchrepeated motifs. Karlin and coworkers (86) have solved the problem by using classical tools innonparametric statistics, which permit one to compare the values of variables for which the theoreticalfrequency distribution is completely unknown, including their means and standard deviations, but at thecost of efficiency.
From Statistical to Biological Meaning. There is no method which permits one to go from astatistically significant observation to a biologically significant interpretation. In fact, the biologicalinterpretation always faces difficult problems. One has to propose various biological representations of agiven situation in order to analyze whether a statistical model may be significant. In the end, theappropriate way to be sure that what has been proposed is meaningful is to build up mutants whichshould behave in the way predicted from the interpretation of the models. Bacteria will be, for thisreason, extremely well-adapted tools for the investigation of the meaning of genomic sequences.
The difficulty can be seen from the very start of sequence analysis: different authors identifydifferent motifs as “significant,” even though they have analyzed the same set of sequences. This isbecause the statistically significant outcome of a given analysis can vary according to the model chosenfor calculating the statistical mean or for generating the statistical baseline (theoretical sequence).Nussinov (125), for instance, noticed a long time ago that there are correlations between a givennucleotide and its neighbors. This can be interpreted in statistical terms by saying that a sequence is, tomake a minimum hypothesis, a Markov chain of order 1. But Blaisdell (15) and Phillips et al. (142) haveshown that the Markov chain must be at least of order 3 if one wants a theoretical chain to simulatecorrectly an experimental one. Hénaut and Vigier (75) and Hanai and Wada (69) have obtained resultsfor motifs present inside coding sequences, but their approach uses the fact that the region considereduses the genetic code in order to generate the theoretical reference sequence, therefore implying that themethod cannot be generalized to noncoding regions (or to regions coding for RNA molecules). Fromthese studies, it appears that the probabilistic model used for generating the reference sequence musttake into account the local composition and significance (such as “this is a protein-coding region”) of theDNA molecule if one wants the comparison between the theoretical model and the experimentalsequence to be meaningful. The same statement comes from investigation of protein coding regions(19), whereby it was shown that ordinary Markov chain analysis cannot simulate properly any codingregion.
Furthermore, the very fact that a given motif is favored or avoided does not mean that the motif itselfis the target sequence for a biological process. Selection can operate on a longer or shorter motifcomprising the prominent motif. Finding the motif which is actually significant is not trivial. We shallillustrate this point in the case of the CTAG motif, which has been noticed by several authors to be
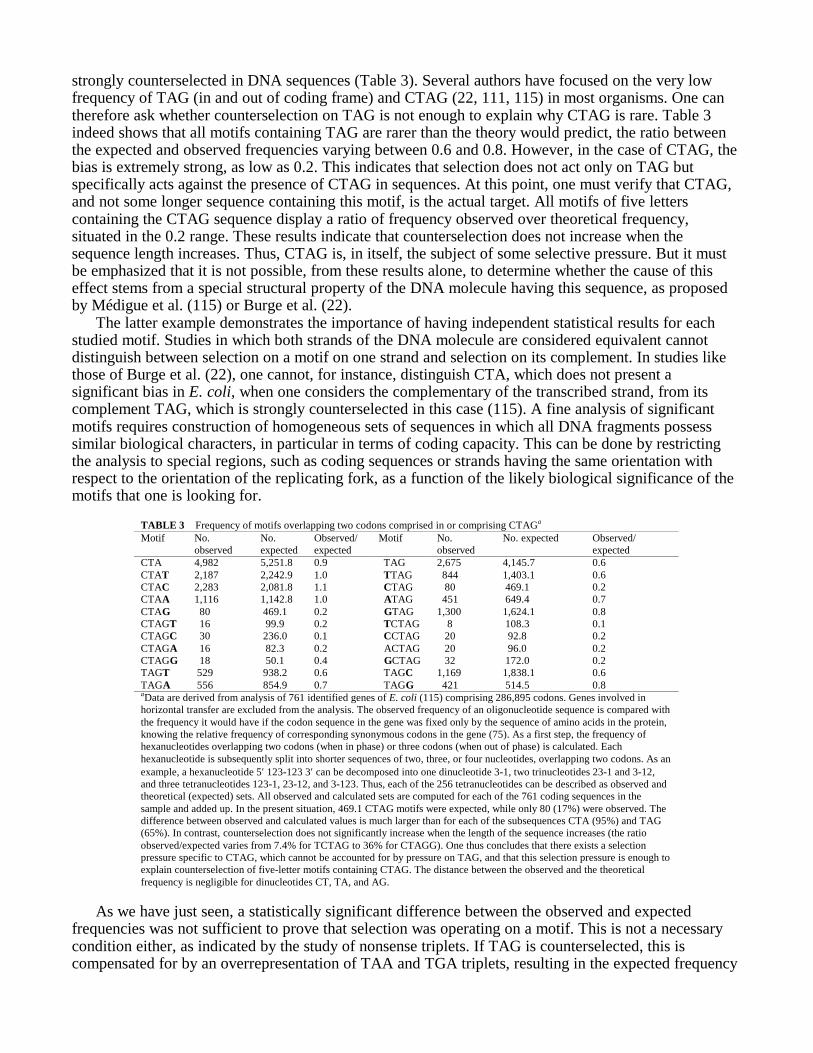
strongly counterselected in DNA sequences (Table 3). Several authors have focused on the very lowfrequency of TAG (in and out of coding frame) and CTAG (22, 111, 115) in most organisms. One cantherefore ask whether counterselection on TAG is not enough to explain why CTAG is rare. Table 3indeed shows that all motifs containing TAG are rarer than the theory would predict, the ratio betweenthe expected and observed frequencies varying between 0.6 and 0.8. However, in the case of CTAG, thebias is extremely strong, as low as 0.2. This indicates that selection does not act only on TAG butspecifically acts against the presence of CTAG in sequences. At this point, one must verify that CTAG,and not some longer sequence containing this motif, is the actual target. All motifs of five letterscontaining the CTAG sequence display a ratio of frequency observed over theoretical frequency,situated in the 0.2 range. These results indicate that counterselection does not increase when thesequence length increases. Thus, CTAG is, in itself, the subject of some selective pressure. But it mustbe emphasized that it is not possible, from these results alone, to determine whether the cause of thiseffect stems from a special structural property of the DNA molecule having this sequence, as proposedby Médigue et al. (115) or Burge et al. (22).
The latter example demonstrates the importance of having independent statistical results for eachstudied motif. Studies in which both strands of the DNA molecule are considered equivalent cannotdistinguish between selection on a motif on one strand and selection on its complement. In studies likethose of Burge et al. (22), one cannot, for instance, distinguish CTA, which does not present asignificant bias in E. coli, when one considers the complementary of the transcribed strand, from itscomplement TAG, which is strongly counterselected in this case (115). A fine analysis of significantmotifs requires construction of homogeneous sets of sequences in which all DNA fragments possesssimilar biological characters, in particular in terms of coding capacity. This can be done by restrictingthe analysis to special regions, such as coding sequences or strands having the same orientation withrespect to the orientation of the replicating fork, as a function of the likely biological significance of themotifs that one is looking for.
TABLE 3 Frequency of motifs overlapping two codons comprised in or comprising CTAGa
Motif No.observed
No.expected
Observed/expected
Motif No.observed
No. expected Observed/expected
CTA 4,982 5,251.8 0.9 TAG 2,675 4,145.7 0.6CTAT 2,187 2,242.9 1.0 TTAG 844 1,403.1 0.6CTAC 2,283 2,081.8 1.1 CTAG 80 469.1 0.2CTAA 1,116 1,142.8 1.0 ATAG 451 649.4 0.7CTAG 80 469.1 0.2 GTAG 1,300 1,624.1 0.8CTAGT 16 99.9 0.2 TCTAG 8 108.3 0.1CTAGC 30 236.0 0.1 CCTAG 20 92.8 0.2CTAGA 16 82.3 0.2 ACTAG 20 96.0 0.2CTAGG 18 50.1 0.4 GCTAG 32 172.0 0.2TAGT 529 938.2 0.6 TAGC 1,169 1,838.1 0.6TAGA 556 854.9 0.7 TAGG 421 514.5 0.8aData are derived from analysis of 761 identified genes of E. coli (115) comprising 286,895 codons. Genes involved inhorizontal transfer are excluded from the analysis. The observed frequency of an oligonucleotide sequence is compared withthe frequency it would have if the codon sequence in the gene was fixed only by the sequence of amino acids in the protein,knowing the relative frequency of corresponding synonymous codons in the gene (75). As a first step, the frequency ofhexanucleotides overlapping two codons (when in phase) or three codons (when out of phase) is calculated. Eachhexanucleotide is subsequently split into shorter sequences of two, three, or four nucleotides, overlapping two codons. As anexample, a hexanucleotide 5′ 123-123 3′ can be decomposed into one dinucleotide 3-1, two trinucleotides 23-1 and 3-12,and three tetranucleotides 123-1, 23-12, and 3-123. Thus, each of the 256 tetranucleotides can be described as observed andtheoretical (expected) sets. All observed and calculated sets are computed for each of the 761 coding sequences in thesample and added up. In the present situation, 469.1 CTAG motifs were expected, while only 80 (17%) were observed. Thedifference between observed and calculated values is much larger than for each of the subsequences CTA (95%) and TAG(65%). In contrast, counterselection does not significantly increase when the length of the sequence increases (the ratioobserved/expected varies from 7.4% for TCTAG to 36% for CTAGG). One thus concludes that there exists a selectionpressure specific to CTAG, which cannot be accounted for by pressure on TAG, and that this selection pressure is enough toexplain counterselection of five-letter motifs containing CTAG. The distance between the observed and the theoreticalfrequency is negligible for dinucleotides CT, TA, and AG.
As we have just seen, a statistically significant difference between the observed and expectedfrequencies was not sufficient to prove that selection was operating on a motif. This is not a necessarycondition either, as indicated by the study of nonsense triplets. If TAG is counterselected, this iscompensated for by an overrepresentation of TAA and TGA triplets, resulting in the expected frequency

for nonsense triplets (91). These triplets do not have a special frequency or distribution along thechromosome, but if one analyzes the interval between two successive such triplets, imposing thecondition that this interval be a multiple of 3, a very prominent and well-known figure emerges,corresponding to open reading frames comprising protein-coding sequences. This demonstrates theimportance of the reading frame in the analysis of DNA sequences. Curiously, however, no analysismethod takes this fact into consideration.
DNA Stretches with Special Structural Properties: Defined Ordered Sequences
Complexity of Substrings in dosDNA. Numerous regions of defined ordered sequence DNA(dosDNA) exist in the genomes of prokaryotes and eukaryotes (190). The analysis of the complexity ofsuch sequences is somewhat similar to that of significant motifs, as already discussed. The minimumanalytic criterion is to identify the variety in composition of the sequence. Intuitively, once again, onecan consider that a sequence made of identical letters has a minimum complexity and, at the otherextreme, that the most complex sequences are those for which the probability for a letter at any givenposition is equal to that at any other position, all letters being randomly intertwined. We find here thesame analysis as that given above for measuring the Chaitin-Kolmogorov complexity. But this analysisis not well fitted for analyzing short sequences: the shortest program permitting one to print out thesequence of the first eight digits of π is still “print 3.14159265,” which means that the most condensedform to describe the sequence is the sequence itself (as in the case of random sequences), whereas thiswould no longer be true for the first 500 digits of π.
To take this situation into account, several authors (156, 157, 191) have proposed a measure, K, forthe complexity of sequences of length L when L is small. K takes into account the degree ofinhomogeneity of the substring. In this model, a substring in which all four nucleotides are equallyrepresented is maximum, while it is zero if the substring contains only one type of nucleotide. Thecomplexity K is easier to compute than the complexity of Chaitin and Kolmogorov, but this is because itcorresponds to a much coarser view of reality. In particular, K does not contain any information on theactual chaining of letters in the substring. A repeated string such as ATGCATGC . . . ATGC, which hasa low Chaitin-Kolmogorov complexity (“for i=1 to n; print ATGC; end”), has the same K value as arandom sequence having the same composition.
Lebbe and Vignes (100) give a measure of the complexity of substrings more refined than K. Forthis, they use the analysis of local prediction in a sequence. A substring of length L is of low complexityif the knowledge of a few letters is enough to reconstitute the string. It has a maximum complexity if theknowledge of L – 1 letters is not enough to predict the Lth letter. The algorithm predicts the letterlocated in the middle of the string L, the neighborhood of this position being constituted by the L – 1other letters. A training procedure is performed on the totality of the sequence (of length N >> L). Theprediction takes into account not only the neighborhoods of the letter which is studied, when they areidentical to each other, but also the k neighborhoods which are the most similar to them. The fact thatthese k neighborhoods are taken into consideration improves the prediction by smoothing out thesampling-induced fluctuations. The local previsibility is measured by the mean of the differencesobserved between the predicted letter and the letter observed in the real sequence.
Repeated Sequences. Clift et al. (26) have introduced the usage, in molecular biology, of an algorithmable to identify all repeated strings, of any given length, in a sequence. This algorithm has theenormous advantage of asking for a computation time and a memory allocation, which is a linearfunction of the length of the sequence (18). They have proposed a graphical representation of the results,a “landscape,” whereby each repetition is localized along the sequence. Unusually long repetitionsappear as peaks and valleys containing sequences which are rare or unique.
Such programs are limited to the identification of exact repeats. But biologists often believe thatlooking for approximate repetitions might be more rewarding. Leung et al. (103) have solved theproblem when the studied motif is made of a succession of exact repeats, chained through shortsegments where the sequences are permitted to differ. It is indeed necessary to limit the error amount

which one admits in approximate repeats if one does not want to find that any one sequence matches theinvestigated pattern. The constraint imposed in the method of Leung et al. (103) is to fix the minimumlength of the exacts repeats (b) and the maximum length of the segments which are allowed to vary (ε).Although the complexity of the algorithm is not a linear function of the length of the sequence, theprogram can still be run on standard computers if b is large and ε is small compared with the analyzedsequence. This program allowed Blaisdell et al. (16) to discover new classes of repetitive extragenicpalindromes (58) in E. coli.
Several authors use the concept of information compression (121, 194). It is a measure of Chaitin-Kolmogorov algorithmic complexity as presented above. The compression range of a sequence is verysensitive to the presence of symmetry elements (palindromes, tandem duplications, etc.) or to the type ofmono- or oligonucleotide repetitions found in dosDNA. The programs of Milosavljevic and Jurka (121)and of Yee and Allison (194) take only direct repetitions into account, but this reflects simply a technicalchoice made by the authors, not any specific limit of the method. Restricting investigation to repetitionsin a sequence, it can be seen that the more repetitions, the stronger the compression. In addition, theoutcome of the compression permits one to take chance into account, i.e., the fact that if repetition of asubstring does not allow any compression (because it is too short), this repetition does not have anyother algorithmic explanation, chance aside.
Distribution of Motifs along the Sequence. We have seen above that it is necessary to take into accountthe distribution of nonsense triplets in each reading frame if one wants to discover that they have aspecial function. Classical methods in statistical analysis designed for the study of the distribution ofmotifs along a sequence do not perform the investigation at such a deep level. They do go, however,beyond the simple model of an exponential distribution of the intervals between to successive motifs. Animportant improvement in sensitivity is to study the distance between the extremities of a fragmentlimited by two motifs and containing k motifs. This statistical analysis allows one to recognize regionsexhibiting unusual regular features or unusually dense clustering of motifs. It has been used in molecularbiology to demonstrate that the early steps of mutation fixation in a divergent evolution scheme arelinked to constraints operating on the DNA itself and not on the proteins (36). Karlin and Macken (87)have generalized this method under the name r-fragment analysis. They have thus shown that in E. coli,restriction sites made of 6 bp are more regularly spaced than a random sequence would predict (86).Since then, Karlin and coworkers have extensively used r-fragment analysis, for example to studySaccharomyces cerevisiae chromosome III (85), but at least one new algorithm has discovered internalrepeats which had escaped the attention of Karlin et al. in this case (101).
Looking for long-distance correlations (several hundreds of nucleotides) requires new methods, suchas those derived from the study of fractal signals. A preliminary observation has been made by Peng etal. (136). They have studied the distribution of purines and pyrimidines along sequences by giving thevalue –1 to a purine and the value +1 to a pyrimidine. The analysis of sequences devoid of introns, inparticular E. coli sequences, does not reveal any long-range correlation. For this reason, a periodicalMarkov chain model, such as the one devised by Borodovsky and coworkers, reveals most importantfeatures in E. coli sequences. In contrast, in sequences containing many introns, long-distancecorrelation are prominent, with specific scale-invariant properties typical of fractal structures. In the caseof the purine/pyrimidine analysis, this means that one finds similar organizations whether one looks atsegments of 1,000 nucleotides or 10,000 nucleotides, provided that the analysis sliding window, used forsmoothing out noise, is changed in the same proportions. The work by Peng et al. (136) has beencriticized for technical reasons (see the discussion in reference 85). It seems, however, that despite someinaccuracy at the quantitative level, its conclusions are valid (6a).
Some Biological Results
Trifonov and Brendel (185) have created GNOMIC, a dictionary of the genetic codes wherein motifsequences are associated with their biological meanings. Unfortunately, the explosion of results derivedfrom the many sequences accumulated in data libraries has made their initial attempt impossible to

continue. In addition, it was soon observed that a meaningful motif in a given organism could have nosignificance in another organism, and vice versa. Even in a given organism, there are importantdifferences between genes belonging to a given category and the others (e.g., translation and coreintermediary metabolism versus genes involved in horizontal transfer [74, 114, 115, 142]). It is easy insome cases to relate an observation to a biological feature: GGAGG is counterselected in genes (theratio between the theoretical and observed frequencies is 4.2), which is certainly linked to its presence inthe Shine-Dalgarno consensus sequence. As mentioned above, the selection against CTAG may berelated to the fact that the double helix is kinked at the center of this motif. But there remains only littlehope that all “significant” motifs correspond to actual biological signals or are linked to the stability ofthe DNA molecule. Indeed, there is some contradiction between the elusiveness of the concept ofconsensus sequences, as discussed above, and the idea that signals corresponding to precise motifswould be the target of selection.
A completely different approach consists of considering the motifs as indicative of the presence ofvery general constraints, having no direct relationship with the meaning of the actual motifs’ sequences.There is a strong correlation between the frequency of a codon and that of its complementarycounterpart in E. coli (3). This correlation is even stronger in the case of oligonucleotides overlappingcodons, which is permitted because synonymous codons can be chosen, preserving the nature of theamino acid residue in the coded protein. The correlation between complementary oligonucleotides isalso present in phage T7 and lambda genomes, which have different strategies for codon usage. Thiscorrelation is true for all three classes of genes in E. coli (114, 142, 186).
Bhagwat and McClelland (14) and Merkl et al. (117) have proposed that in E. coli, the frequencyanomalies for some tetra- and pentanucleotides are the result of a specific process of mismatchrepair, the so-called very short patch repair. This process repairs T⋅G pairs as C⋅G pairs when themispair occurs in a motif 5′T(A/T)GG3′/3′G(T/A)CC5′ or in a motif 5′CT(A/T)G3′/3′GG(T/A)C5′ atthe positions of the boldfaced letters. These tetranucleotides are part of the CC(A/T)GG pentanucleotidesequence that is methylated (on the second C) by the dcm gene product, Dcm cytosine methylase. Thus,this system could have evolved to prevent C→ T mutagenesis caused by spontaneous or enzyme-mediated deamination of 5-methylcytosine to T. However, if this repair system were very efficient, theneach replication error G opposite template T at the above position would be fixed by this specializedrepair system to a TA→ CG mutation instead of being corrected by the long patch strand-directedmismatch repair system (mutHLSU), hence a T→ C mutagenesis! With time, this process should lead toa decrease in the presence of tetranucleotides TAGG, CCTA, TTGG, CCAA, CTAG, CTTG, andCAAG and to an enrichment in tetranucleotides CAGG, CTGG, CCAG, and CCTG.
It seems possible to extend this kind of analysis to other repair processes inducing spontaneousmutations. Many over- or underexpressed motifs are part of what Wells and Sinden (190) name dosDNA(see above). Such sequences generally contain elements having some kind of symmetry (palindromes,tandem duplications, and the like) or multiple repetitions of mono- or oligonucleotides. Regionsorganized as dosDNA can have spatial configurations which significantly differ from the standard B-DNA structure. This implies that dosDNA is associated with specific mutation processes and withinstabilities during DNA replication. In humans, this seems to be at the origin of many genetic diseases.Studies performed in the next several years should lead us to understand whether preferred or excludedmotifs are indeed the scar of such genetic instabilities. Identifying specific substrings by statisticalmeans will then necessarily be linked to a direct experimental approach in order to understand genomestability.
CONCLUSION
After much debate, and promises which have not been fulfilled, it appears that molecular genomeanalysis has at last come of age. One can expect that most if not all of the E. coli genome will be knownby the end of 1997. A measure of the corresponding success is that progress in sequence acquisition nolonger seems remarkable, stretches of the order of 100 kb or more being now commonplace. However,although some information can be derived from the knowledge of sequences only, it seems that much

work must still be performed if one is to correlate a given sequence and its biological function.In addition to the information levels discussed in this chapter, several other levels of information
should be considered if one wishes to understand the true meaning of biological sequences. It is, forinstance, of particular importance to take into account the time-dependent part of biological processes.We have mentioned this fact when discussing the efficiency of transcription terminators. The underlyingdynamic processes give their biological meaning to graphical representations wherein a sliding windowis used in order to smooth out the fluctuations of a given variable. Indeed, when using a sliding window,one considers implicitly that the phenomenon which is described is homogeneous at the correspondingscale. The interpretation is self-evident when the window comprises a few tens of nucleotides, becausethis can correspond to the region of interaction of a protein with its particular target. This is no longer sowhen one uses windows longer than 1,000 nucleotides. In the presence of an unexpected regularity, onemust then assume that this is the speed (or, more generally, the inertia) of a sliding machinery, or of aglobal deformation wave which has to be taken into account, because this would explain why thephenomenon remains unchanged over such a large length. As an illustration, one could visualize awindow of a few thousand nucleotides as showing the genome as it is seen by a DNA polymerasecomplex, while a window of a few hundred nucleotides would correspond to transcription. All of thiswould require general considerations which will not be discussed here (see reference 30 for a generaldiscussion). In any case, it seems very important to make hypotheses and to test them experimentally byconstructing appropriate mutant strains. We think that this will be a major future trend of moleculargenetics once the sequences of the complete genomes are known.
We have summarized in this chapter the many informatics approaches which enable geneticists toexplore the meaning of the sequences they have been able to generate. This is but the first step in a muchdeeper analysis for which research is presently starting. One can see from the work which has alreadybeen done that the light which can be shed by informatics techniques on sequences can certainly helpgeneticists in building up rich and promising biological experiments: E. coli can be studied in silicobefore one returns to it in vivo.
ACKNOWLEDGMENTS
We thank Mark Borodovsky, Marie-Odile Delorme, F. Neidhardt, M. Radman, and M. Riley as wellas anonymous referees for improvement of the manuscript, Joël Potier for providing us with a largereference data library, Max Dauchet, Simon Diner, and Jean-Paul Delahaye for stressing the importanceof Chaitin-Kolmogorov information, and Jean-Loup Risler for improving our knowledge of databasesand linked software. This work was supported by grants from the Groupement de Recherche et d’Etudesdes Génomes (91CO82) and Groupement de Recherches (GDR 1029), from the Centre National de laRecherche Scientifique.
LITERATURE CITED
1. Adamson, A., and D. Casey. 1994. Managing genome sequence data. Hum. Genome News 8:2–7. 2. Alexandrov, N. N., and A. A. Mironov. 1987. Recognition of Escherichia coli promoters given the
DNA primary structure. Mol. Biol. (Moscow) 21:242–249. 3. Alff Steinberger, C. 1984. Evidence for a coding pattern on the non coding strand of the E. coli
genome. Nucleic Acids Res. 12:2235–2239. 4. Altschul, S. F., M. S. Boguski, W. Gish, and J. C. Wooton. 1994. Issues in searching molecular
sequence databases. Nat. Genet. 6:119–129. 5. Altschul, S. F., W. Gish, W. Miller, E. W. Myers, and D. J. Lipman. 1990. Basic local alignment
search tool. J. Mol. Biol. 215:403–410. 6. Aoyama, T., M. Takanami, E. Ohtsuka, Y. Taniyama, R. Marumoto, H. Sato, and M. Ikehara.
1983. Essential structure of E. coli promoter: effect of spacer length between the two consensus onpromoter function. Nucleic Acids Res. 11:5855–5864.
6a.Arnéodo, A., E. Bacny, P. V. Graves, and J. F. Muzy. 1995. Characterizing long-range

correlations in DNA sequences from wavelet analysis. Phys. Rev. Lett. 74:3293–3296. 7. Bairoch, A. 1992. PROSITE: a dictionary of sites and patterns in proteins. Nucleic Acids Res.
20:2013–2018. 8. Bairoch, A., and B. Boeckmann. 1993. The SWISS-PROT protein sequence data bank. Nucleic
Acids Res. 19:2247–2249. 9. Barker, W. C., D. G. George, H.-W. Mewes, F. Pfeiffer, and A. Tsugita. 1993. The PIR-
International databases. Nucleic Acids Res. 21:3089–3092. 10. Barrick, D., K. Villanueba, J. Childs, R. Kalil, T. D. Schneider, C. E. Lawrence, L. Gold, and
G. D. Stormo. 1994. Quantitative analysis of ribosome binding sites in E. coli. Nucleic Acids Res.22:1287–1295.
11. Benson, D., D. J. Lipman, and J. Ostell. 1993. GenBank. Nucleic Acids Res. 21:2963–2965. 12. Berg, O. G., and P. H. von Hippel. 1987. Selection of DNA binding sites by regulatory proteins.
Statistical-mechanical theory and application to operators and promoters. J. Mol. Biol. 193:723–750. 13. Berlyn, M. B., and S. Letovsky. 1992. Genome-related datasets within the E. coli genetic stock
center database. Nucleic Acids Res. 20:6143–6151. 14. Bhagwat, A. S., and M. McClelland. 1992. DNA mismatch correction by very short patch repair
may have altered the abundance of oligonucleotides in the E. coli genome. Nucleic Acids Res.20:1663–1668.
15. Blaisdell, B. E. 1985. Markov chain analysis finds a significant influence of neighboring bases onthe occurrence of a base in eucaryotic nuclear DNA sequences both protein-coding and noncoding. J.Mol. Evol. 21:278–288.
16. Blaisdell, B. E., K. E. Rudd, A. Matin, and S. Karlin. 1993. Significant dispersed recurrent DNAsequences in the Escherichia coli genomes. Several new groups. J. Mol. Biol. 229:833–848.
17. Blake, R. D., and P. W. Hinds. 1984. Analysis of the codon bias in E. coli sequences. J. Biomol.Struct. Dyn. 2:593–606.
18. Blumer, A., J. Blumer, A. Ehrenfeucht, D. Haussler, M. T. Chen, and J. Seiferas. 1985. Thesmallest automaton recognizing the subwords of a word. Theor. Comput. Sci. 40:31–56.
19. Borodovskii, M. Y., Y. A. Sprizhitskii, E. I. Golovanov, and A. A. Aleksandrov. 1986.Statistical patterns in primary structures of the functional regions of the genome in Escherichia coli-.Mol. Biol. 20:826–833.
20. Borodovsky, M., and J. McIninch. 1993. GENMARK: parallel gene recognition for both DNAstrands. Comput. Chem. 17:123–133.
21. Brendel, V., G. H. Hamm, and E. N. Trifonov. 1986. Terminators of transcription with RNApolymerase from Escherichia coli: what do they look like and how to find them. J. Biomol. Struct.Dyn. 3:705–723.
22. Burge, C., A. M. Campbell, and S. Karlin. 1992. Over- and under-representation of shortolignonucleotides in DNA sequences. Proc. Natl. Acad. Sci. USA 89:1358–1362.
23. Butler, B. 1994. Nucleic acid sequence analysis software packages. Curr. Opin. Biotechnol. 5:19–23.
24. Cardon, L. R. 1992. Expectation maximization algorithm for identifying protein-binding sites withvariable lengths from unaligned DNA fragments. J. Mol. Biol. 223:159–170.
25. Cech, T. R. 1988. Conserved sequences and structures of group I introns: building an active site forRNA catalysis— a review. Gene 73:259–271.
26. Clift, B., D. Haussler, R. McConnell, T. D. Schneider, and G. D. Stormo. 1986. Sequencelandscapes. Nucleic Acids Res. 14:141–158.
27. Collado-Vides, J. 1992. Grammatical model of the regulation of gene expression. Proc. Natl.Acad. Sci. USA 89:9405–9409.
28. Collado-Vides, J. 1993. The elements for a classification of units of genetic information with acombinatorial component. J. Theor. Biol. 163:527–548.
29. Danchin, A. 1979. The generation of immune specificity: a general selective model. Mol. Immunol.16:515–526.
30. Danchin, A. 1996. On genomes and cosmologies. In J. Collado-Vides, B. Magasanik, and T. Smith

(ed.), Integrative Methods in Molecular Biology. MIT Press, Cambridge, Mass. 31. d’Aubenton-Carafa, Y., E. Brody, and C. Thermes. 1990. Prediction of rho-independent
Escherichia coli transcription terminators. A statistical analysis of their RNA stem-loop structures. J.Mol. Biol. 216:835–858.
32. Dayhoff, M. O., R. M. Schwartz, and B. C. Orcutt. 1978. Atlas of Protein Sequence andStructure, p. 345–352. National Biomedical Research Foundation, Washington, D.C.
33. Dear, S., and R. Staden. 1991. A sequence assembly and editing program for efficientmanagement of large projects. Nucleic Acids Res. 19:3907–3911.
34. Dear, S., and R. Staden. 1992. A standard file format for data from DNA sequencing instruments.DNA Sequence 3:107–110.
35. Delorme, M.-O., and A. Hénaut. 1988. Merging of distance matrices and classification bydynamic clustering. CABIOS 4:453–458.
36. Delorme, M. O., A. Hénaut, and P. Vigier. 1988. Mutations in the NAM2 genes ofSaccharomyces cerevisiae and Saccharomyces douglasii are clustered non-randomly as a result ofconstraints on the nucleic acid sequence and not on the protein. Mol. Gen. Genet. 213:310–314.
37. Demeler, B., and G. W. Zhou. 1991. Neural network optimization for E. coli promoter prediction.Nucleic Acids Res. 19:1593–1599.
38. de Smit, M. H., and J. van Duin. 1990. Secondary structure of the ribosome binding sitedetermines translational efficiency: a quantative analysis. Proc. Natl. Acad. Sci. USA 87:7668–7672.
39. de Smit, M. H., and J. van Duin. 1994. Translation initiation on structured messengers. Anotherrole for the Shine-Dalgarno interaction. J. Mol. Biol. 235:173–184.
40. Devereux, J., P. Haeberli, and O. Smithies. 1984. A comprehensive set of sequence analysisprograms for the VAX. Nucleic Acids Res. 12:387–395.
41. Dombroski, A. J., W. A. Walter, M. T. Record, D. A. Siegele, and C. A. Gross. 1992.Polypeptides containing highly conserved regions of transcription initiation factor σ70 exhibitspecificity of binding to promoter DNA. Cell 70:501–512.
42. Doolittle, R. F. 1994. Protein sequence comparisons: searching databases and aligning sequences.Curr. Opin. Biotechnol. 5:24–28.
43. Dreyfus, M. 1988. What constitutes the signal for the initiation of protein synthesis on Escherichiacoli mRNAs. J. Mol. Biol. 204:79–94.
44. Dykes, G., R. Bambara, K. Marians, and R. Wu. 1975. On the statistical significance of primarystructural features found in DNA-protein interaction sites. Nucleic Acids Res. 2:327–345.
45. Ehrenberg, M., and C. G. Kurland. 1984. Cost of accuracy determined by a maximal growthconstraint. Q. Rev. Biophys. 17:45–82.
46. Emilsson, V., and C. G. Kurland. 1990. Growth rate dependence of transfer RNA abundance inEscherichia coli. EMBO J. 9:4359–4366.
47. Emilsson, V., A. K. Naslund, and C. G. Kurland. 1993. Growth-rate dependent accumulation oftwelve tRNA species in Escherichia coli. J. Mol. Biol. 230:483–491.
48. Etzold, T., and P. Argos. 1993. SRS— an indexing and retrieval tool for flat file data libraries.CABIOS 9:49–57.
49. Ezhov, A. A., Y. A. Kalambet, and D. Y. Cherny. 1989. Neuron network for the recognition of E.coli promoters. Stud. Biophys. 129:183–192.
50. Férat, J. L., M. Le Gouar, and F. Michel. 1994. Multiple group II self-splicing introns in mobileDNA from Escherichia coli. C. R. Acad. Sci. (Paris) 317:141–148.
51. Fichant, G., and C. Burks. 1991. Identifying potential tRNA genes in genomic DNA sequences. J.Mol. Biol. 220:659–671.
52. Fichant, G., and C. Gautier. 1987. Statistical methods for predicting protein coding regions innucleic acids sequences. CABIOS 3:287–295.
53. Figueroa, N., N. Wills, and L. Bossi. 1991. Common sequence determinants of the response of aprokaryotic promoter to DNA bending and supercoiling. EMBO J. 10:941–949.
54. Gardner, M. 1974. On the paradoxical situations that arise from nontransitive relations. Sci. Am.231:120–125.

55. Gascuel, O. 1985. Structural description, learning and discrimination of these descriptions.Biochimie 67:499–507.
56. Gascuel, O. 1993. Inductive learning and biological sequence analysis. The PLAGE program.Biochimie 75:363–370.
57. Gascuel, O., and A. Danchin. 1986. Protein export in prokaryotes and eukaryotes: indications fora difference in the mechanism of exportation. J. Mol. Evol. 24:130–142.
58. Gilson, E., W. Saurin, D. Perrin, S. Bachellier, and M. Hofnung. 1991. Palindromic units arepart of a new bacterial interspersed mosaic element (BIME). Nucleic Acids Res. 19:1375–1383.
59. Gleeson, T. J., and R. Staden. 1991. An X windows and UNIX implementation of our sequenceanalysis package. CABIOS 7:398.
60. Gleizes, A., and A. Hénaut. 1994. A global approach for contig construction. CABIOS 10:401–405.
61. Gouy, M., and C. Gautier. 1982. Codon usage in bacteria: correlation with gene expressivity.Nucleic Acids Res. 10:7055–7074.
62. Gouy, M., C. Gautier, M. Attimonelli, C. Lanave, and G. DiPaola. 1985. ACNUC— a portableretrieval system for nucleic acid sequence databases: logical and physical designs and usage. CABIOS1:167–172.
63. Graniero-Porati, M. I., and A. Porati. 1988. Informational parameters and randomness ofmitochondrial DNA. J. Mol. Evol. 27:109–113.
64. Grantham, R., and C. Gautier. 1980. Genetic distances from mRNA sequences.Naturwissenchaften 67:93–94.
65. Grantham, R., C. Gautier, M. Gouy, M. Jacobzone, and R. Mercier. 1981. Codon catalogusage is a genome strategy modulated for gene expressivity. Nucleic Acids Res. 9:r43-r74.
66. Gribskov, M., J. Devereux, and R. R. Burgess. 1984. The codon preference plot: graphic analysisof protein coding sequences and prediction of gene expression. Nucleic Acids Res. 12:539–549.
67. Guibas, L. J., and A. M. Odlyzko. 1980. Long repetitive patterns in random sequences.Wahrcheinlichkeitstheorie 53:241–262.
68. Guibas, L. J., and A. M. Odlyzko. 1981. Periods in strings. J. Combinatorial Theory Ser. A30:19–42.
69. Hanai, R., and A. Wada. 1989. Novel third-letter bias in Escherichia coli codons revealed byrigorous treatment of coding constraints. J. Mol. Biol. 207:655–660.
70. Harley, C. B., and R. P. Reynolds. 1987. Analysis of E. coli promoter sequences. Nucleic AcidsRes. 15:2343–2361.
71. Harper, R. 1994. Access to DNA and protein databases on the Internet. Curr. Opin. Biotechnol.5:4–18.
72. Hawley, D. K., and W. R. McClure. 1983. Compilation and analysis of Escherichia coli promoterDNA sequences. Nucleic Acids Res. 11:2237–2255.
73. Hénaut, A., and M. O. Delorme. 1988. Distance matrix comparison and tree construction. PatternRecognition Lett. 7:207–213.
74. Hénaut, A., J. Limaiem, and P. Vigier. 1985. The origins of the strategy of codon use. Biochimie67:475–483.
75. Hénaut, A., and P. Vigier. 1985. Etude des contraintes qui s’exercent sur la succession des basesdans un polynucléotide: I. La signification de la dégénérescence du code. C. R. Acad. Sci. (Paris)301:277–282.
76. Henikoff, S., and J. G. Henikoff. 1991. Automated assembly of protein blocks for databasesearching. Nucleic Acids Res. 19:6565–6572.
77. Hill, M. O. 1974. Correspondence analysis: a neglected multivariate method. Appl. Stat. 23:340–353.
78. Hirst, J. D., and M. J. Sternberg. 1991. Prediction of ATP-binding motifs: a comparison of aperceptron-type neural network and a consensus method. Protein Eng. 4:615–623.
79. Horton, P. B., and M. Kanehisa. 1992. An assessment of neural network and statisticalapproaches for prediction of E. coli promoters sites. Nucleic Acids Res. 16:4331–4338.

80. Huang, X. 1992. A contig assembly program based on sensitive detection of fragment overlap.Genomics 14:18–25.
81. Huang, X., and M. S. Waterman. 1992. Dynamic programing algorithms for restriction mapcomparison. CABIOS 8:511–520.
82. Hüttenhofer, A., and H. F. Noller. 1994. Footprinting mRNA-ribosome complexes with chemicalprobes. EMBO J. 13:3892–3901.
83. Ikemura, T. 1981. Correlation between the abundance of Escherichia coli transfer RNAs andoccurrence of the respective codons in its protein genes. J. Mol. Biol. 146:1–21.
84. Ikemura, T. 1981. Correlation between the abundance of Escherichia coli transfer RNA and theoccurrence of the respective codons in its protein gene: a proposal for a synonymous codon choicethat is optimal for E. coli translation system. J. Mol. Biol. 151:389–409.
85. Karlin, S., B. E. Blaisdell, R. J. Sapolsky, L. Cardon, and C. Burge. 1993. Assessments of DNAinhomogeneities in yeast chromosome III. Nucleic Acids Res. 21:703–711.
86. Karlin, S., C. Burge, and A. M. Campbell. 1992. Statistical analyses of counts and distributionsof restriction sites in DNA sequences. Nucleic Acids Res. 20:1363–1370.
87. Karlin, S., and C. Macken. 1991. Assessment of inhomogeneities in an E. coli physical map.Nucleic Acids Res. 19:4241–4246.
88. Karp, P. 1992. A knowledge base of the chemical compounds of intermediary metabolism.CABIOS 8:347–357.
89. Karp, P., and S. Paley. 1994. Representation of metabolic knowledge: pathways, p. 203–211. InR. Altman, D. Brutlag, P. Karp, R. Lathrop, and D. Searls (ed.), Second International Conference onIntelligent Systems and Molecular Biology. AAAI Press, Washington, D.C.
90. Karp, P., and M. Riley. 1993. Representation of metabolic knowledge, p. 207–215. In L. Hunter,D. Searls, and J. Sharlik (ed.), First International Conference on Intelligent Systems and MolecularBiology. AAAI Press, Washington, D.C.
91. Kleffe, J., and M. Borodovsky. 1992. First and second moment of counts of words in randomtexts generated by Markov chains. CABIOS 8:433–441.
92. Kohara, Y., K. Akiyama, and K. Isono. 1987. The physical map of the whole E. colichromosome: application of a new strategy for rapid analysis and sorting of a large genomic library.Cell 50:495–508.
93. Koudelka, G. B., S. C. Harrison, and M. Ptashne. 1987. Effect of non-contacted bases on theaffinity of 434 operator for 434 repressor and Cro. Nature (London) 329:886–888.
94. Kuehsel, M. G., R. Strickland, and J. D. Palmer. 1990. An ancient group I intron shared byeubacteria and chloroplasts. Science 250:1570–1573.
95. Kunisawa, T., M. Nakamura, H. Watanabe, J. Otsuka, A. Tsugita, L. S. Yeh, D. G. George,and W. C. Barker. 1990. Escherichia coli K12 genomic database. Protein Sequences Data Anal.3:157–162.
96. Lamperti, E. D., J. M. Kittelberger, T. F. Smith, and L. Villa-Komaroff. 1992. Corruption ofgenomic databases with anomalous sequence. Nucleic Acids Res. 20:2741–2747.
97. Landès, C., A. Hénaut, and J. L. Risler. 1992. A comparison of several similarity indices used inthe classification of protein sequences: a multivariate analysis. Nucleic Acids Res. 20:3631–3637.
98. Larsen, N., G. J. Olsen, B. L. Maidak, M. J. McCaughey, R. Overbeek, T. J. Macke, T. L.Marsh, and C. R. Woese. 1993. The Ribosomal Database Project. Nucleic Acids Res. 21:3021–3023.
99. Lebart, L., A. Morineau, and K. A. Warwick. 1984. Multivariate Descriptive StatisticalAnalysis. John Wiley & Sons, New York.
100. Lebbe, J., and R. Vignes. 1993. Local predictability in biological sequences, algorithm andapplications. Biochimie 75:371–378.
101. Lefèvre, C., and J.-E. Ikeda. 1994. A fast word search algorithm for the representation ofsequence similarity in genomic DNA. Nucleic Acids Res. 22:404–411.
102. Letovsky, S., and M. B. Berlyn. 1994. Issues in the development of complex scientific databases.Biotechnol. Comput. 5:5–14.
103. Leung, M.-Y., B. E. Blaisdell, C. Burge, and S. Karlin. 1991. An efficient algorithm for

identifying matches with errors in multiple long molecular sequences. J. Mol. Biol. 221:1367–1378.104. Li, M., and P. M. B. Vitanyi. 1993. An Introduction to Kolmogorov Complexity and Its
Applications. Springer-Verlag, New York.105. Lim, D. 1991. Structure of two retrons of Escherichia coli and their common chromosomal
insertion site. Mol. Microbiol. 5:1863–1872.106. Lipman, D. J., W. J. Wilbur, T. F. Smith, and S. Waterman. 1984. On the statistical
significance of nucleic acid similarities. Nucleic Acids Res. 12:215–226.107. Lisacek, F., Y. Diaz, and F. Michel. 1994. Automatic identification of group I intron cores in
genomic DNA sequences. J. Mol. Biol. 235:1206–1217.108. Lopez, R. S., T. Kristensen, and H. Prydz. 1992. Vector sequences contaminating the sequence
data bases. Nature (London) 355:211–211.109. Lukashin, A. V., V. V. Anshelevich, B. R. Amirikyan, A. I. Gragerov, and M. D. Frank-
Kamenetskii. 1989. Neural network models for promoter recognition. J. Biomol. Struct. Dyn.6:1123–1133.
110. Maniatis, T. M., K. Ptashne, D. Backman, S. Kleid, A. Flashman, A. Jeffrey, and R. Maurer.1975. Recognition sequences of repressor and polymerase in the operators of bacteriophage lambda.Cell 5:109–113.
111. McClelland, M., R. Jones, Y. Patel, and M. Nelson. 1987. Restriction endonucleases for pulsed fieldmapping of bacterial genomes. Nucleic Acids Res. 15:5985–6005.
112. McClure, W. R. 1985. Mechanism and control of transcription initiation in prokaryotes. Annu.Rev. Biochem. 54:171–204.
113. Médigue, C., J. P. Bouché, A. Hénaut, and A. Danchin. 1990. Mapping of sequenced genes(700 kbp) in the restriction map of the Escherichia coli chromosome. Mol. Microbiol. 4:169–187.
114. Médigue, C., T. Rouxel, P. Vigier, A. Hénaut, and A. Danchin. 1991. Evidence for horizontalgene transfer in Escherichia coli speciation. J. Mol. Biol. 222:851–856.
115. Médigue, C., A. Viari, A. Hénaut, and A. Danchin. 1991. Escherichia coli molecular geneticmap (1500 kbp): update II. Mol. Microbiol. 5:2629–2640.
116. Médigue, C., A. Viari, A. Hénaut, and A. Danchin. 1993. Colibri: a functional data base for theEscherichia coli genome. Microbiol. Rev. 57:623–654.
117. Merkl, R., M. Kröger, P. Rice, and H. J. Fritz. 1992. Statistical evaluation and biologicalinterpretation of non-random abundance in the E. coli K-12 genome of tetra and pentanucleotidesequences related to VSP DNA mismatch repair. Nucleic Acids Res. 20:1657–1662.
118. Michal, G. 1982. Biochemical pathways wall chart. Boehringer-Mannheim GmbH.Universitätsdruckerei H. Sturtz AG, Würzburg.
119. Michel, F., and E. Westhof. 1990. Modeling of the three-dimensional architecture of group Icatalytic introns based on comparative sequence analysis. J. Mol. Biol. 216:581–606.
120. Miller, W., J. Barr, and K. E. Rudd. 1991. Improved algorithms for searching restriction maps.CABIOS 7:447–456.
121. Milosavljevic, A., and J. Jurka. 1993. Discovering simple DNA sequences by the algorithmicsignificance method. CABIOS 9:407–411.
122. Miyazawa, S. 1989. DNA Databank of Japan. Present status and future plans, p. 47–62. InComputers and DNA, SFI Studies in the Sciences of Complexity. Addison-Wesley, Reading, Mass.
123. Moszer, I., P. Glaser, and A. Danchin. 1995. SubtiList: a relational data base for the Bacillussubtilis genome. Microbiology 141:261–268.
124. Nakata, K., M. Kanehisa, and J. J. Maizel. 1988. Discriminant analysis of promoters regions inEscherichia coli sequences. CABIOS 4:367–371.
125. Nussinov, R. 1981. The universal dinucleotide assymmetry rules in DNA and amino acid codonchoice. Nucleic Acids Res. 17:237–244.
126. Ochman, H., and R. K. Selander. 1984. Standard reference strains of Escherichia coli fromnatural populations. J. Bacteriol. 157:690–693.
127. Olsen, G. J., R. Overbeek, N. Larsen, T. L. Marsh, M. J. McCaughey, M. A. Maciukenas,W.-M. Kuan, T. J. Macke, Y. Xing, and C. R. Woese. 1992. The Ribosomal Database Project.
Nucleic Acids Res. 20:2199–2200.128. O’Neill, M. C. 1989. Consensus methods for finding and ranking DNA binding sites. Application
to Escherichia coli promoters. J. Mol. Biol. 207:301–310.129. O’Neill, M. C. 1989. Escherichia coli promoters. I. Consensus as it relates to spacing class,
specificity, repeat substructure, and three-dimensional organization. J. Biol. Chem. 264:5522–5530.130. O’Neill, M. C. 1991. Training back-propagation neural networks to define and detect DNA-
binding sites. Nucleic Acids Res. 19:313–318.131. O’Neill, M. C. 1992. Escherichia coli promoters: neural networks develop distinct descriptions in
learning to search for promoters of different spacing classes. Nucleic Acids Res. 20:3471–3477.132. O’Neill, M. C., and F. Chiafari. 1989. Escherichia coli promoters. II. A spacing class-dependent
promoter search protocol. J. Biol. Chem. 264:5531–5534.133. Pattabiraman, N., K. Namboodiri, A. Lowrey, and B. P. Gaber. 1990. NRL-3D: a sequence
structure database derived from the protein data bank (PDB) and searchable within the PIRenvironment. Protein Sequences Data Anal. 3:387–405.
134. Pearson, W. R., and D. J. Lipman. 1988. Improved tools for biological sequence comparison.Proc. Natl. Acad. Sci. USA 85:2444–2448.
135. Peltola, H., H. Soderlund, and E. Ukkonen. 1984. SEQAID: a DNA sequence assembling programbased on a mathematical model. Nucleic Acids Res. 12:307–321.
136. Peng, C. K., S. V. Buldyrev, A. L. Goldberger, S. Havlin, F. Sciortino, M. Simons, and H. E.Stanley. 1992. Long-range correlations in nucleotide sequences. Nature (London) 356:170.
137. Perrière, G. 1992. Application of a knowledge representation based upon objects to the modellingof some aspects of Escherichia coli gene expression. Doctoral thesis. Université Claude Bernard,Lyon 1, Lyon, France.
138. Perrière, G., and C. Gautier. 1993. ColiGene: object-centered representation for the study of E.coli gene expressivity by sequence analysis. Biochimie 75:415–422.
139. Petersen, G. B., P. A. Stockwell, and D. F. Hill. 1988. Messenger RNA recognition inEscherichia coli: a possible second site of interaction with 16S ribosomal RNA. EMBO J. 7:3957–3962.
140. Pevzner, P. A., M. Y. Borodovsky, and A. A. Mironov. 1989. Linguistics of nucleotidessequences. I. The significance of deviations from mean statistical characteristics and prediction of thefrequencies of occurrence of words. J. Biomol. Struct. Dyn. 6:1013–1026.
141. Pfeiffer, F., and W. A. Gilbert. 1988. VecBase: a cloning vector sequence data base. ProteinSequences Data Anal. 1:269–280.
142. Phillips, G. J., J. Arnold, and R. Ivarie. 1987. The effect of codon usage on the oligonucleotidecomposition of the E. coli genome and identification of over- and underrepresented sequences by Markovchain analysis. Nucleic Acids Res. 15:2627–2638.
143. Platt, T. 1986. Transcription termination and regulation of gene expression. Annu. Rev. Biochem.55::339–372.
144. Pribnow, D. 1975. Nucleotide sequence of an RNA polymerase binding site at an early T7promoter. Proc. Natl. Acad. Sci. USA 72:784–788.
145. Reinhold-Hurek, B., and D. A. Shub. 1992. Self-splicing introns in tRNA genes of widelydivergent bacteria. Nature (London) 357:173–176.
146. Rice, C. M., R. Fuchs, D. G. Higgins, P. J. Stoehr, and G. N. Cameron. 1993. The EMBL datalibrary. Nucleic Acids Res. 21:2967–2971.
147. Ringquist, S., S. Shinedling, D. Barrick, L. Green, J. Binkley, G. D. Stormo, and L. Gold.1992. Translation initiation in Escherichia coli: sequences within the ribosome-binding site. Mol.Microbiol. 6:1219–1229.
148. Rodier, F., and J. Sallantin. 1985. Localization of the initiation of translation in messenger RNAsof prokaryotes by learning techniques. Biochimie 67:533–539.
149. Rosenblatt, F. 1959. Principles of Neurodynamics. Spartan Books, New York.150. Rouxel, T., A. Danchin, and A. Hénaut. 1993. METALGEN.DB: metabolism linked to the genome
of Escherichia coli, a graphics-oriented database. CABIOS 9:315–324.

151. Rudd, K. E. 1992. Alignment of E. coli DNA sequences to a revised, integrated genomicrestriction map, p. 2.3–2.43. In J. Miller (ed.), A Short Course in Bacterial Genetics: a LaboratoryManual and Handbook for Escherichia coli and Related Bacteria. Cold Spring Harbor LaboratoryPress, Cold Spring Harbor, N.Y.
152. Rudd, K. E. 1993. Maps, genes, sequences, and computers: an Escherichia coli case study. ASMNews 59:335–341.
153. Rudd, K. E., W. Miller, C. Werner, J. Ostell, C. Tolstoshev, and S. G. Satterfield. 1991.Mapping sequenced E. coli genes by computer: software, strategies and examples. Nucleic Acids Res.19:637–647.
154. Rudd, N. G. E., W. Miller, J. Ostell, and D. A. Benson. 1990. Alignment of Escherichia coliK12 DNA sequences to a genomic restriction map. Nucleic Acids Res. 18:313–321.
155. Rumelhart, R., and M. McClelland. 1986. Parallel Distributed Processing Exploration in theMicro-Structure of Cognition. MIT Press, Cambridge, Mass.
156. Salamon, P., and A. K. Konopka. 1992. A maximum entropy principle for distribution of localcomplexity in naturally occurring nucleotide sequences. Comput. Chem. 16:117–124.
157. Salamon, P., J. C. Wooton, A. K. Konopka, and L. Hansen. 1993. On the robustness ofmaximum entropy relationships for complexity distributions of nucleotide sequences. Comput. Chem.17:135–148.
158. Sallantin, J., J. Haiech, and F. Rodier. 1985. Search for promoter sites of prokaryotic DNAusing learning techniques. Biochimie 67:549–553.
159. Schneider, T. D., G. D. Stormo, L. Gold, and A. Ehrenfeucht. 1986. Information content ofbinding sites in nucleotide sequences. J. Mol. Biol. 188:415–431.
160. Schwartz, R. M., and M. O. Dayhoff. 1978. Atlas of Protein Sequence and Structure. NationalBiomedical Research Foundation, Washington, D.C.
161. Searls, D. B. 1988. Representing genetic information with formal grammars, p. 386–391. In 7thNational Conference on Artificial Intelligence, vol. 1. Morgan Kauffman Publishers, San Mateo,Calif.
162. Searls, D. B. 1989. Investigating the linguistics of DNA with definite clause grammars, p. 189–208. In E. Lusk and R. Overbeek (ed.), Logic Programming: Proceedings of the North AmericanConference, vol. 1. MIT Press, Cambridge, Mass.
163. Shannon, C. E., and W. Weaver. 1949. The Mathematical Theory of Communication. Universityof Illinois Press, Urbana.
164. Sharp, P. M., and W. H. Li. 1986. Codon usage in regulatory genes in Escherichia coli does notreflect selection for ‘rare’ codons. Nucleic Acids Res. 14:7737–7749.
165. Sharp, P. M., and W. H. Li. 1987. The codon adaptation index— a measure of directionalsynonymous codon usage bias, and its potential applications. Nucleic Acids Res. 15:1281–1925.
166. Shin, D.-G., C. Lee, J. Zhang, K. E. Rudd, and C. M. Berg. 1992. Redesigning, implementingand integrating Escherichia coli genome software tools with an object-oriented database system.CABIOS 8:227–238.
167. Shine, J., and L. Dalgarno. 1974. The 3′-terminal sequence of Escherichia coli 16 S ribsomalRNA: complementarity to nonsense triplets and ribosome binding sites. Proc. Natl. Acad. Sci. USA71:1342–1346.
168. Shub, D. A., J. M. Gott, M. Q. Xu, B. F. Lang, F. Michel, J. Tomaschevski, J. Pedersen-Lane,and M. Belfort. 1988. Structural conservation among three homologous introns of phage T4 and thegroup I introns of eukaryotes. Proc. Natl. Acad. Sci. USA 85:1151–1155.
169. Siebenlist, U., R. B. Simpson, and W. Gilbert. 1980. E. coli RNA polymerase interactshomologously with two different promoters. Cell 20:269–281.
170. Slonimski, P. P., and S. Brouillet. 1993. A data-base of chromosome III of Saccharomycescerevisiae. Yeast 9:941–1029.
171. Smith, T. F., and M. S. Waterman. 1981. Comparison of bio-sequences. Adv. Appl. Math. 2:482–489.
172. Soldano, H., and J. L. Moisy. 1985. Statistico-syntactic learning techniques. Biochimie 67:493–498.

173. Sonnhammer, E. L. L., and D. Kahn. 1994. Modular arrangement of proteins as inferred fromanalysis of homology. Protein Sci. 3:482–492.
174. Sprengart, M. L., H. P. Fatscher, and E. Fuchs. 1990. The initiation of translation in E. coli:apparent base pairing between the 16S rRNA and downstream sequences of the mRNA. Nucleic AcidsRes. 18:1719–1723.
175. Staden, R. 1982. Automation of the computer handling of gel reading data produced by the shotgunmethod of DNA sequencing. Nucleic Acids Res. 10:4731–4751.
176. Staden, R. 1984. Computer methods to locate signals in nucleic acid sequences. Nucleic Acids Res.12:505–519.
177. Staden, R. 1984. A computer program to enter DNA gel reading data into a computer. Nucleic AcidsRes. 12:499–503.
178. Staden, R. 1987. Computer handling of DNA sequencing projects, p. 173–217. In M. J. Bishop andC. J. Rawling (ed.), Nucleic Acid and Protein Sequence Analysis: a Practical Approach. IRL Press,Oxford.
179. Stanssens, P., E. Remaut, and W. Fiers. 1986. Inefficient translation initiation cause prematuretranscription termination in the lacZ gene. Cell 44:711–718.
180. Stormo, G. D. 1990. Consensus patterns in DNA. Methods Enzymol. 183:211–221.181. Stormo, G. D. 1991. Probing information content of DNA-binding sites. Methods Enzymol. 208:458–
468.182. Stormo, G. D., T. D. Schneider, and L. Gold. 1982. Characterization of translational initiation sites
in E. coli. Nucleic Acids Res. 10:2971–2996.183. Stormo, G. D., T. D. Schneider, L. Gold, and A. Ehrenfeucht. 1982. Use of the ‘Perceptron’
algorithm to distinguish translational initiation sites in E. coli. Nucleic Acids Res. 10:2997–3011.184. Thanaraj, T. A., and M. W. Pandit. 1989. An additional ribosome-binding site on mRNA of highly
expressed genes and a bifunctionnal site on the colicin fragment of 16S rRNA from Escherichia coli:important determinants of the efficiency of translation initiation. Nucleic Acids Res. 17:2973–2985.
185. Trifonov, E. F., and V. Brendel. 1985. GENOMIC, a Dictionary of Genetic Codes. BalabanPublisher, Rehovot, Irsael.
186. Vigier, P., and A. Hénaut. 1986. Etude des contraintes qui s’exercent sur la succession des basesdans un polynucléotide. II. La distribution des tétranucléotides complémentaires dans les gènesd’Escherichia coli et des bactériophages lambda et T4. C. R. Acad. Sci. (Paris) 302:1–6.
187. Wahl, R., and M. Kröger. 1995. ECDC— a totally integrated and interactively usable genetic mapof Escherichia coli K12. Microbiol. Res. 150:7–61.
188. Wahl, R., P. Rice, C. M. Rice, and M. Kröger. 1994. ECD— a totally integrated database ofEscherichia coli. Nucleic Acids Res. 22:3450–3455.
189. Watanabe, S. 1968. Knowing and Guessing. John Wiley & Sons, New York.190. Wells, R. D., and R. R. Sinden. 1993. Defined ordered sequence DNA, DNA structure, and
DNA-directed mutation, p. 107–138. In K. E. Davies and S. T. Warren (ed.), Genome Analysis, vol. 7.Cold Spring Harbor Press, Cold Spring Harbor, N.Y.
191. Wooton, J. C., and S. Federhen. 1993. Statistics of local complexity in amino acid sequences andsequence database. Comput. Chem. 17:149–163.
192. Xu, M. Q., S. D. Kathe, H. Goodrich-Blair, S. A. Nierzwicki-Bauer, and D. A. Shub. 1990.Bacterial origin of a chloroplast intron: conserved self-splicing group I intron in cyanobacteria.Science 250:1566–1570.
193. Yager, T. D., and P. H. von Hippel. 1987. Transcript elongation and termination in Escherichiacoli, p. 1241–1275. In F. C. Neidhardt, J. L. Ingraham, K. B. Low, B. Magasanik, M. Schaechter, andH. E. Umbarger (ed.), Escherichia coli and Salmonella typhimurium: Cellular and Molecular Biology.American Society for Microbiology, Washington, D.C.
194. Yee, C. N., and L. Allison. 1993. Reconstruction of strings past. CABIOS 9:1–7.195. Yockey, H. P. 1992. Information Theory and Molecular Biology. Cambridge University Press,
Cambridge.