Analysis and Parametric Study of Reinforced Concrete Two ...Two-Way Ribbed (Waffle) slab system can...
21
16 American Scientific Research Journal for Engineering, Technology, and Sciences (ASRJETS) ISSN (Print) 2313-4410, ISSN (Online) 2313-4402 © Global Society of Scientific Research and Researchers http://asrjetsjournal.org/ Analysis and Parametric Study of Reinforced Concrete Two-Way Ribbed Slabs by using ANSYS Dr. Ayad Abdulhameed Sulaibi a *, Dhifaf Natiq H. Al-Amiery b a Asst. Prof., PhD Civil Engineering,University of Anbar, Iraq b MSc Student, Civil Engineering, University of Anbar, Iraq a Email: [email protected] b Email: [email protected] Abstract This paper presents the results of finite element analysis for two experimental works (taken from other research works). The aim of this study is to use finite element method (FEM) by using ANSYS (v.15) software to analyse the specimens of experimental work to verify the validity of FEM by comparison with experimental results. In addition, some parametric studies on these works are done to cover the effect of some important variables on the ultimate load capacity and deflection which were not covered in the experimental work. The results of ANSYS software for chosen examples shows good agreement with the experimental results. Load-deflection curves for ANSYS models are higher than the experimental curves. The average value of correlation factor is (98.85%)for first example and (73.7%) for the second one. Results have shown that the percentage of increase in stiffness increases with increasing of slab thickness, but this increase is governed by the spacing between ribs. Keywords: Ribbed slab; waffle slab; finite element analysis; ANSYS. 1. Introduction Two-Way Ribbed (Waffle) slab system can be defined as the slab constructions having a flat flange plate, or deck, and equally spaced parallel beams in two orthogonal direction, or grillage. The main purpose of using two-way ribbed (waffle) slabs is to reduce the quantity of concrete and reinforcement and hence the weight ------------------------------------------------------------------------ * Corresponding author.
Transcript of Analysis and Parametric Study of Reinforced Concrete Two ...Two-Way Ribbed (Waffle) slab system can...
16
American Scientific Research Journal for Engineering, Technology, and Sciences (ASRJETS) ISSN (Print) 2313-4410, ISSN (Online) 2313-4402
© Global Society of Scientific Research and Researchers http://asrjetsjournal.org/
Analysis and Parametric Study of Reinforced Concrete
Two-Way Ribbed Slabs by using ANSYS
Dr. Ayad Abdulhameed Sulaibia*, Dhifaf Natiq H. Al-Amieryb
aAsst. Prof., PhD Civil Engineering,University of Anbar, Iraq
bMSc Student, Civil Engineering, University of Anbar, Iraq aEmail: [email protected]
bEmail: [email protected]
Abstract
This paper presents the results of finite element analysis for two experimental works (taken from other research
works). The aim of this study is to use finite element method (FEM) by using ANSYS (v.15) software to analyse
the specimens of experimental work to verify the validity of FEM by comparison with experimental results. In
addition, some parametric studies on these works are done to cover the effect of some important variables on the
ultimate load capacity and deflection which were not covered in the experimental work. The results of ANSYS
software for chosen examples shows good agreement with the experimental results. Load-deflection curves for
ANSYS models are higher than the experimental curves. The average value of correlation factor is (98.85%)for
first example and (73.7%) for the second one. Results have shown that the percentage of increase in stiffness
increases with increasing of slab thickness, but this increase is governed by the spacing between ribs.
Keywords: Ribbed slab; waffle slab; finite element analysis; ANSYS.
1. Introduction
Two-Way Ribbed (Waffle) slab system can be defined as the slab constructions having a flat flange plate, or
deck, and equally spaced parallel beams in two orthogonal direction, or grillage. The main purpose of using
two-way ribbed (waffle) slabs is to reduce the quantity of concrete and reinforcement and hence the weight
------------------------------------------------------------------------
* Corresponding author.
American Scientific Research Journal for Engineering, Technology, and Sciences (ASRJETS) (2017) Volume 30, No 1, pp 16-36
17
Reference [1] tested three models of reinforced concrete waffle slab to study the effect of rib orientation on the
carrying capacity of waffle slab. The models were different in the shape and construction method, but having
the same volume of concrete and the same area of reinforcing steel bars. It was concluded from the experimental
results that the shape and method of construction for reinforced concrete slab affected the ultimate load capacity
and stiffness. Reference [2] used experimental study and theoretical analysis to discuss the effect of rib spacing
and the depth of rib on the flexural rigidity resistance for waffle slabs, and compared between the results of
different models. In the experimental work, six models of square panels of ribbed flat slabs in 1: 4 scale and two
solid flat slabs had been tested. To study the effect of the bending and torsion the slabs were considered
isotropic in shape and reinforced in two perpendicular directions, so that the resistant moments were identical in
both directions. The test specimen was simply supported along the four edges and its dimensions were (1540
*1540) mm. It was concluded that increasing the number of ribs, or decreasing their spacing, stiffness of waffle
slab was increased and the deflection in elastic uncracked range was decreased. In 2009, Large in [3] studied the
effect of using high performance fiber concrete on the top slab in waffle slab structures. In this research, 11
various series were tested. The specimens are differed in types of fibers and concrete mixture used. They were
subjected to different combinations of flexural and torsion loads. Test results showed higher shear and torsion
capacity with using fibre concrete. Therefore, steel fibers can be placed instead of conventional shear
reinforcement. Reference [4] presented and discussed the optimum design problem of reinforced concrete two-
way ribbed slabs by using genetic algorithms. Two cases had been studied; the first was a waffle slab with solid
heads, and the second was a waffle slab with band beams. The researchers concluded that the total cost of waffle
slab with band beams was higher than that with solid head for slabs with the same span length. The ratio of the
total costs was found to be within the range (1.10 - 2.12) and the cost ratio decreases as the span length
increases. Reference [5] focused on analysis of two-way ribbed slabs with hidden beams. From the obtained
results, the researcher concluded that the distribution of moments in two-way slabs with hidden beams was
similar to the distribution of moments in slabs without beams if the stiffness of the hidden beams was small. In
addition, using of three dimensional modelling by computer software provides a good solution for moment’s
determination and distribution. In the present study, six specimens are chosen from reference [2] and one
specimen is taken from reference [6]. The dimensions of these specimens are slightly changed for purpose of
easy meshing. Nonlinear analysis by 3D finite elements model is done using ANSYS-v15. The total load
applied to finite element model is divided into a series of load increments called load steps. At the completion of
each incremental solution, the stiffness matrix of the model is adjusted to reflect nonlinear changes in the
structural stiffness before proceeding to the next load increment [7]. The ANSYS program uses Newton-
Raphson equilibrium iterations for updating the model stiffness.
2. Finite Element Modelling & Analysis by ANSYS
2.1 First Example
Reference [2] used experimental study and theoretical analysis to discuss the effect of rib spacing (S) and rib
depth on the flexural rigidity of two-way ribbed (waffle) slabs, and compare between results for these methods.
In experimental work, six models of square panels of ribbed flat slabs in 1: 4 scale and two solid flat slabs had
been tested. The Slabs were considered isotropic in shape and reinforced in two
American Scientific Research Journal for Engineering, Technology, and Sciences (ASRJETS) (2017) Volume 30, No 1, pp 16-36
18
perpendicular directions, so that the resistant moments were identical in both directions. Dimensions of test
specimens were (1540 x 1540) mm and simply supported along the four edges. Figure (1) shows the details of
slabs.
In the present study, six specimens have been analysed by using ANSYS package (version 15), then compare
the results with the experimental results of Reference [2]. Table (1) shows the six specimens analysed in this
study.
2.1.1 Real Constants
The real constants for this example are shown in Table (2).
Figure 1: Geometry of Waffle Slabs, Loading Arrangement, and Reinforcement.[2]
Table 1: The Slab dimensions used in the present study.
As (mm2/m)
h/t
(7)
H (mm) (6)
W (mm) (5)
T (mm) (4)
S (mm) (3)
Bays
(2)
Slab number
(1)
301 4.75 95 50 20 170 9x9 S2
168 4.75 95 50 20 300 5x5 S4
301 6.25 125 60 20 165 9x9 S5
301 3.25 65 45 20 165 9x9 S6
301 1.00 75 — — — Solid S7
301 1 00 95 S lid S8
American Scientific Research Journal for Engineering, Technology, and Sciences (ASRJETS) (2017) Volume 30, No 1, pp 16-36
19
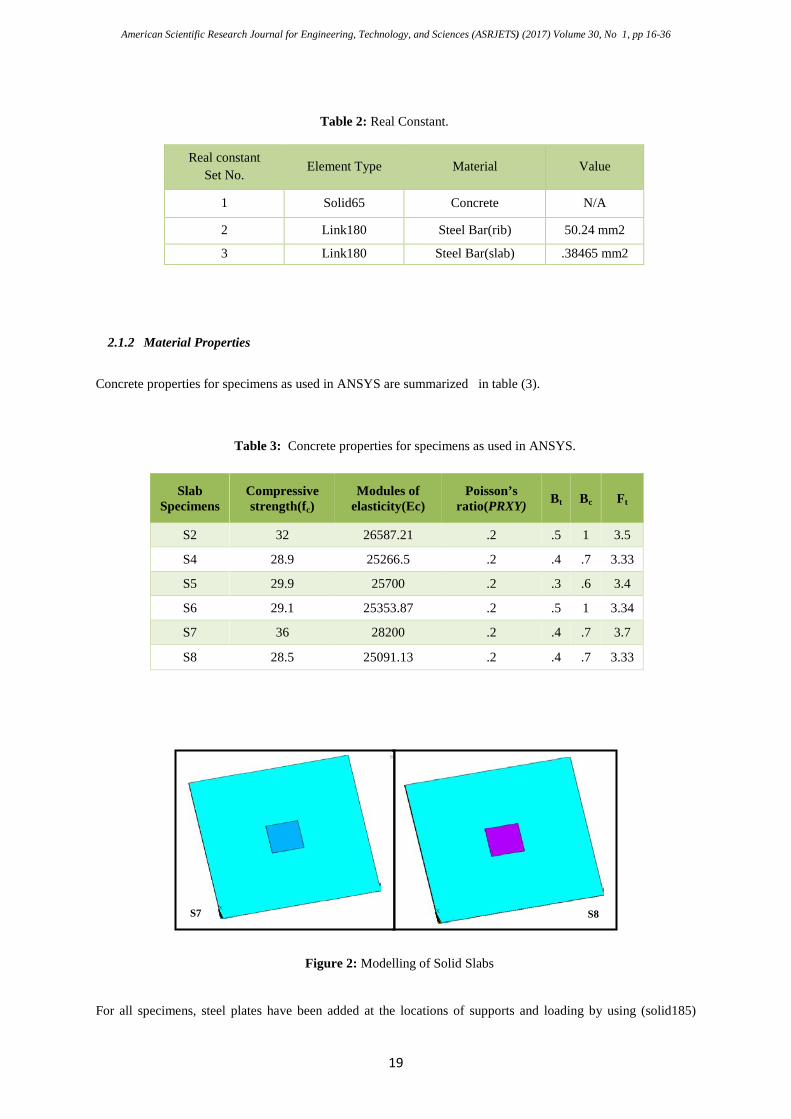
Table 2: Real Constant.
Value Material Element Type Real constant
Set No.
N/A Concrete Solid65 1
50.24 mm2 Steel Bar(rib) Link180 2
.38465 mm2 Steel Bar(slab) Link180 3
Table 3: Concrete properties for specimens as used in ANSYS.
Ft Bc Bt Poisson’s ratio(PRXY)
Modules of elasticity(Ec)
Compressive strength(fc)
Slab Specimens
3.5 1 .5 .2 26587.21 32 S2
3.33 .7 .4 .2 25266.5 28.9 S4
3.4 .6 .3 .2 25700 29.9 S5
3.34 1 .5 .2 25353.87 29.1 S6
3.7 .7 .4 .2 28200 36 S7
3.33 .7 .4 .2 25091.13 28.5 S8
2.1.2 Material Properties
Concrete properties for specimens as used in ANSYS are summarized in table (3).
For all specimens, steel plates have been added at the locations of supports and loading by using (solid185)
X
Y Z
X
Y Z
SE
Figure 2: Modelling of Solid Slabs
S7 S8
American Scientific Research Journal for Engineering, Technology, and Sciences (ASRJETS) (2017) Volume 30, No 1, pp 16-36
20
XY
Z
SEP 1 15
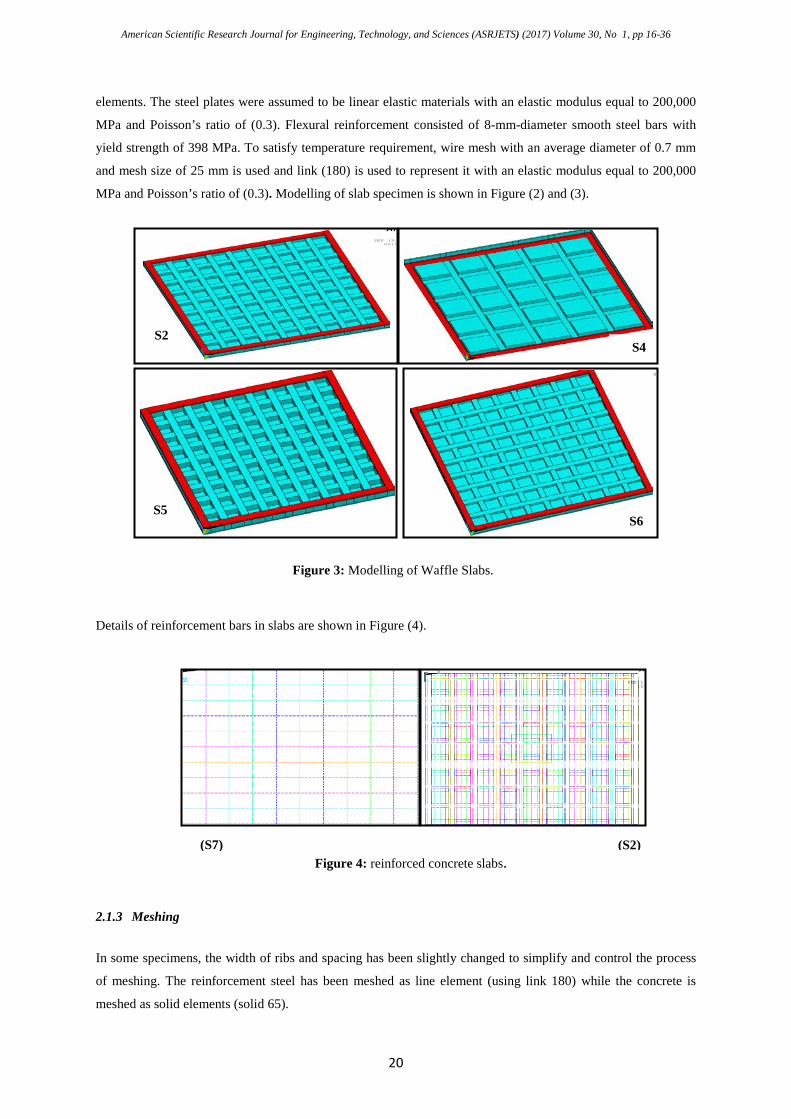
elements. The steel plates were assumed to be linear elastic materials with an elastic modulus equal to 200,000
MPa and Poisson’s ratio of (0.3). Flexural reinforcement consisted of 8-mm-diameter smooth steel bars with
yield strength of 398 MPa. To satisfy temperature requirement, wire mesh with an average diameter of 0.7 mm
and mesh size of 25 mm is used and link (180) is used to represent it with an elastic modulus equal to 200,000
MPa and Poisson’s ratio of (0.3). Modelling of slab specimen is shown in Figure (2) and (3).
Details of reinforcement bars in slabs are shown in Figure (4).
2.1.3 Meshing
In some specimens, the width of ribs and spacing has been slightly changed to simplify and control the process
of meshing. The reinforcement steel has been meshed as line element (using link 180) while the concrete is
meshed as solid elements (solid 65).
XYZ
1
XY
Z
SEP 19 09:5
XY
Z
XY
Z
S
S2 S4
S5 S6
Figure 3: Modelling of Waffle Slabs.
(S7)
(S2)
Figure 4: reinforced concrete slabs.
American Scientific Research Journal for Engineering, Technology, and Sciences (ASRJETS) (2017) Volume 30, No 1, pp 16-36
21
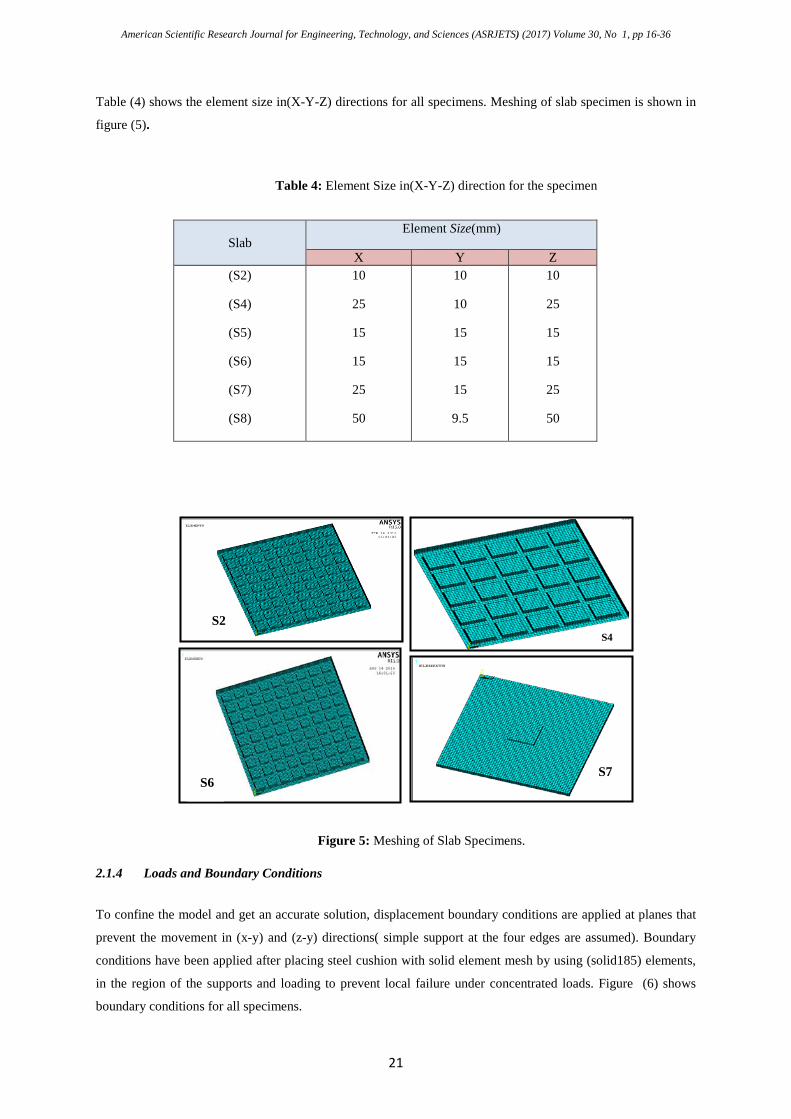
Table (4) shows the element size in(X-Y-Z) directions for all specimens. Meshing of slab specimen is shown in
figure (5).
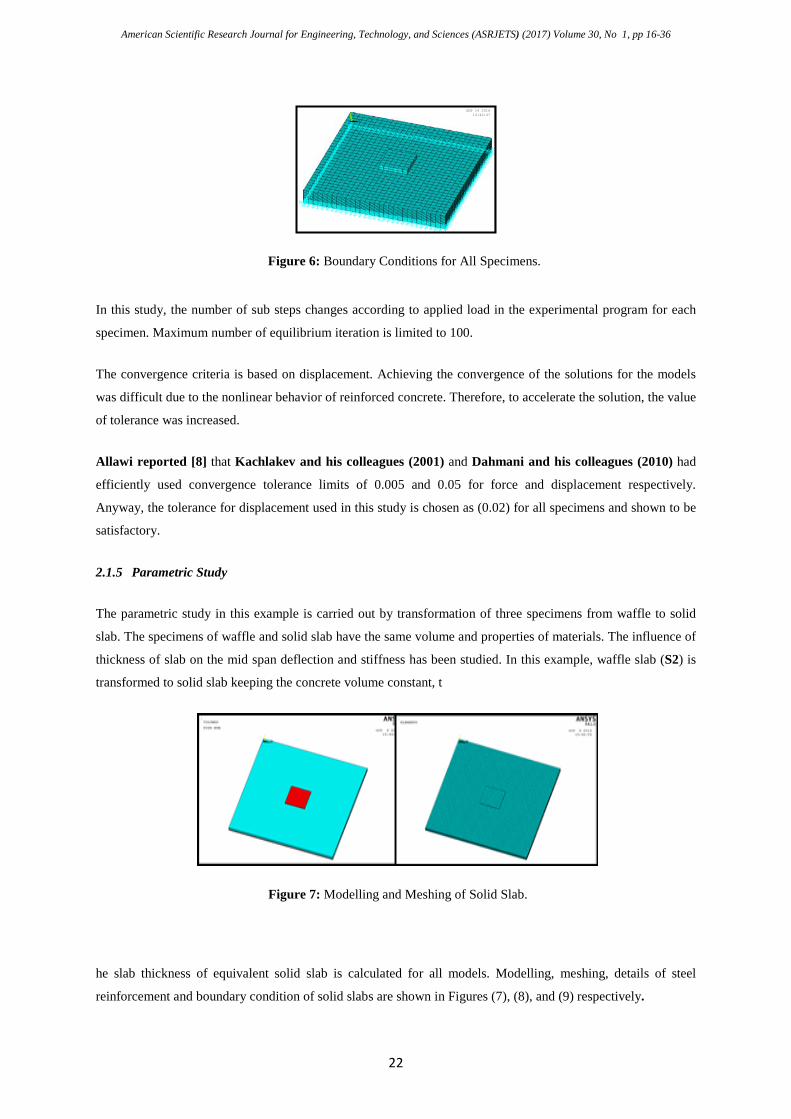
2.1.4 Loads and Boundary Conditions
To confine the model and get an accurate solution, displacement boundary conditions are applied at planes that
prevent the movement in (x-y) and (z-y) directions( simple support at the four edges are assumed). Boundary
conditions have been applied after placing steel cushion with solid element mesh by using (solid185) elements,
in the region of the supports and loading to prevent local failure under concentrated loads. Figure (6) shows
boundary conditions for all specimens.
Table 4: Element Size in(X-Y-Z) direction for the specimen
Slab Element Size(mm)
X Y Z (S2)
(S4)
(S5)
(S6)
(S7)
(S8)
10
25
15
15
25
50
10
10
15
15
15
9.5
10
25
15
15
25
50
XYZ
SEP 1
Figure 5: Meshing of Slab Specimens.
S2 S4
S7 S6
American Scientific Research Journal for Engineering, Technology, and Sciences (ASRJETS) (2017) Volume 30, No 1, pp 16-36
22
In this study, the number of sub steps changes according to applied load in the experimental program for each
specimen. Maximum number of equilibrium iteration is limited to 100.
The convergence criteria is based on displacement. Achieving the convergence of the solutions for the models
was difficult due to the nonlinear behavior of reinforced concrete. Therefore, to accelerate the solution, the value
of tolerance was increased.
Allawi reported [8] that Kachlakev and his colleagues (2001) and Dahmani and his colleagues (2010) had
efficiently used convergence tolerance limits of 0.005 and 0.05 for force and displacement respectively.
Anyway, the tolerance for displacement used in this study is chosen as (0.02) for all specimens and shown to be
satisfactory.
2.1.5 Parametric Study
The parametric study in this example is carried out by transformation of three specimens from waffle to solid
slab. The specimens of waffle and solid slab have the same volume and properties of materials. The influence of
thickness of slab on the mid span deflection and stiffness has been studied. In this example, waffle slab (S2) is
transformed to solid slab keeping the concrete volume constant, t
he slab thickness of equivalent solid slab is calculated for all models. Modelling, meshing, details of steel
reinforcement and boundary condition of solid slabs are shown in Figures (7), (8), and (9) respectively.
X
Y
Z
SEP 14 201614:42:47
Figure 6: Boundary Conditions for All Specimens.
Figure 7: Modelling and Meshing of Solid Slab.
American Scientific Research Journal for Engineering, Technology, and Sciences (ASRJETS) (2017) Volume 30, No 1, pp 16-36
23
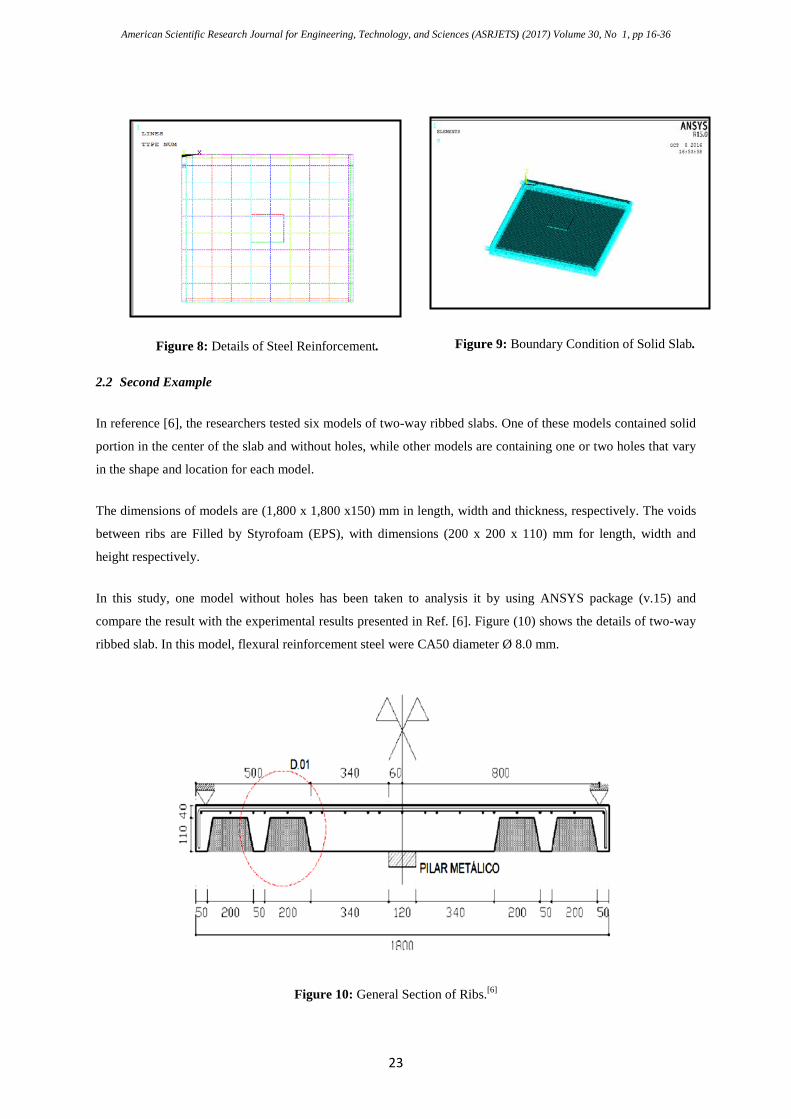
Figure 8: Details of Steel Reinforcement.
Figure 9: Boundary Condition of Solid Slab.
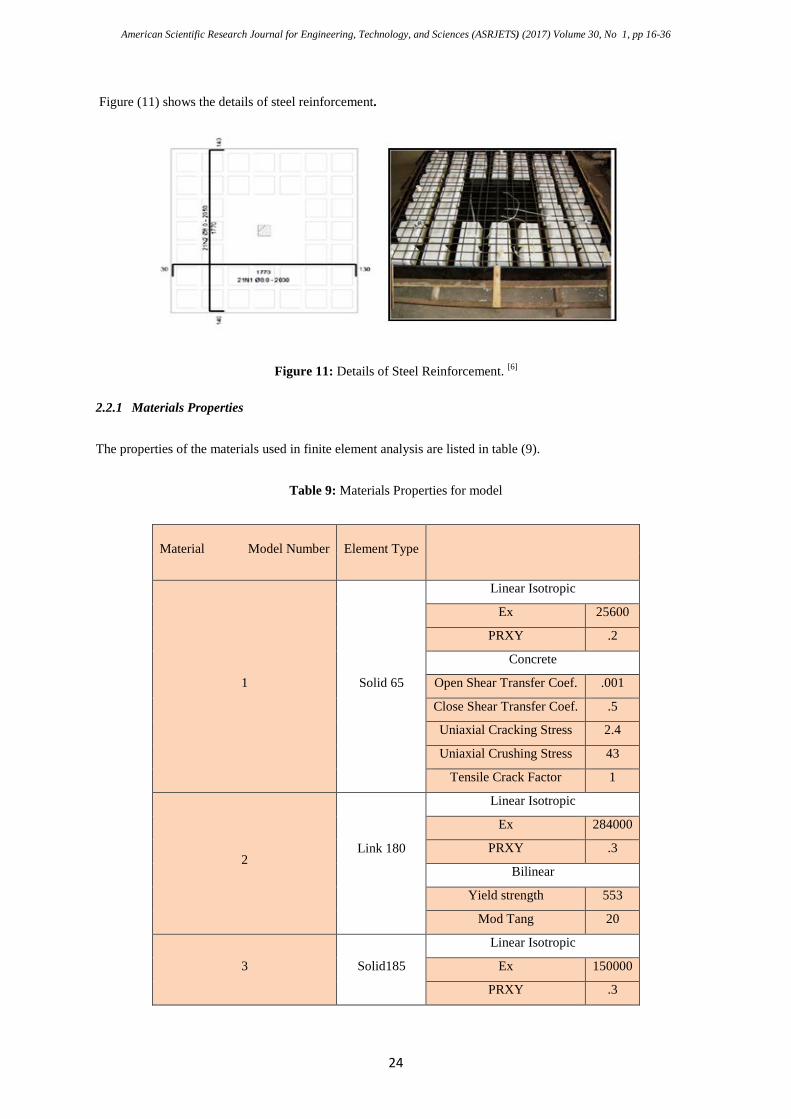
2.2 Second Example
In reference [6], the researchers tested six models of two-way ribbed slabs. One of these models contained solid
portion in the center of the slab and without holes, while other models are containing one or two holes that vary
in the shape and location for each model.
The dimensions of models are (1,800 x 1,800 x150) mm in length, width and thickness, respectively. The voids
between ribs are Filled by Styrofoam (EPS), with dimensions (200 x 200 x 110) mm for length, width and
height respectively.
In this study, one model without holes has been taken to analysis it by using ANSYS package (v.15) and
compare the result with the experimental results presented in Ref. [6]. Figure (10) shows the details of two-way
ribbed slab. In this model, flexural reinforcement steel were CA50 diameter Ø 8.0 mm.
Figure 10: General Section of Ribs.[6]
American Scientific Research Journal for Engineering, Technology, and Sciences (ASRJETS) (2017) Volume 30, No 1, pp 16-36
24
Figure (11) shows the details of steel reinforcement.
Figure 11: Details of Steel Reinforcement. [6]
2.2.1 Materials Properties
The properties of the materials used in finite element analysis are listed in table (9).
Table 9: Materials Properties for model
Element Type Material Model Number
Linear Isotropic
Solid 65 1
25600 Ex
.2 PRXY
Concrete
.001 Open Shear Transfer Coef.
.5 Close Shear Transfer Coef.
2.4 Uniaxial Cracking Stress
43 Uniaxial Crushing Stress
1 Tensile Crack Factor
Linear Isotropic
Link 180
2
284000 Ex
.3 PRXY
Bilinear
553 Yield strength
20 Mod Tang
Linear Isotropic
Solid185 3 150000 Ex
.3 PRXY
American Scientific Research Journal for Engineering, Technology, and Sciences (ASRJETS) (2017) Volume 30, No 1, pp 16-36
25
2.2.2 Modelling of two-way ribbed slab
In the modelling of two-way ribbed slab, some of the original dimensions of Ref [6] are slightly changed for
purpose of easy meshing. Table (10) shows the dimensions of the model that used in this study.
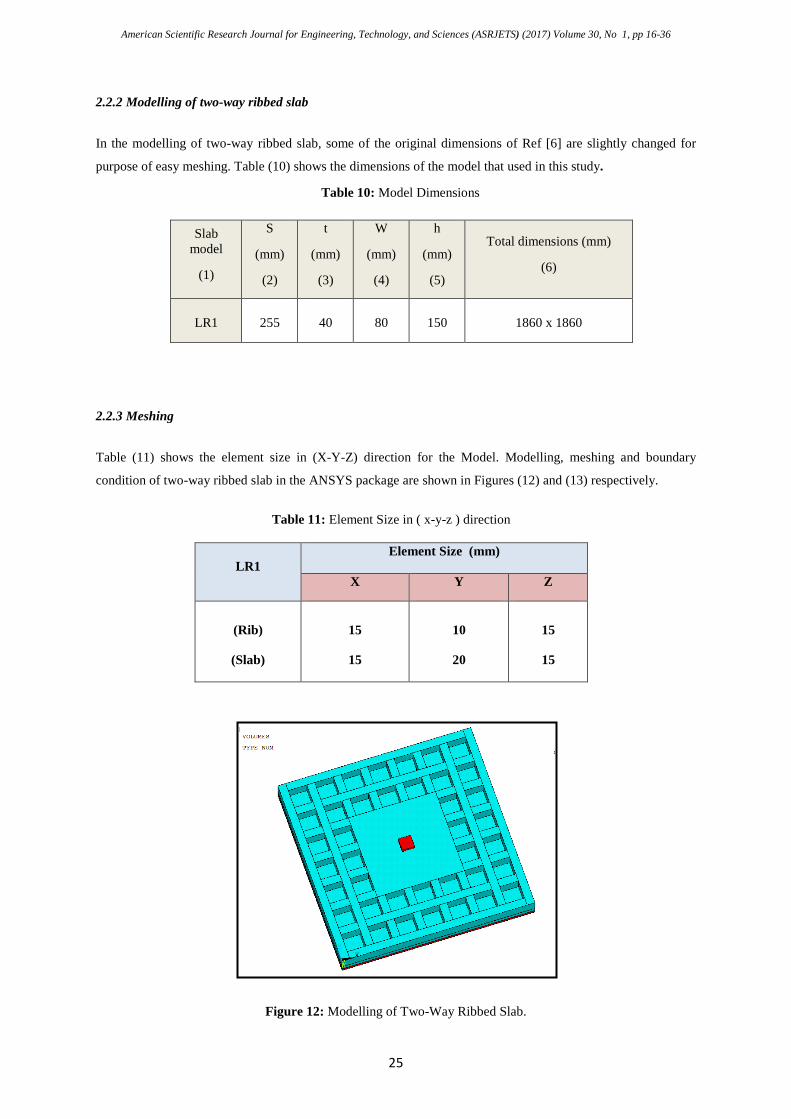
2.2.3 Meshing
Table (11) shows the element size in (X-Y-Z) direction for the Model. Modelling, meshing and boundary
condition of two-way ribbed slab in the ANSYS package are shown in Figures (12) and (13) respectively.
Figure 12: Modelling of Two-Way Ribbed Slab.
Table 10: Model Dimensions
Total dimensions (mm)
(6)
h
(mm)
(5)
W
(mm)
(4)
t
(mm)
(3)
S
(mm)
(2)
Slab model
(1)
1860 x 1860 150 80 40 255 LR1
Table 11: Element Size in ( x-y-z ) direction
LR1 Element Size (mm)
X Y Z
(Rib)
(Slab)
15
15
10
20
15
15
American Scientific Research Journal for Engineering, Technology, and Sciences (ASRJETS) (2017) Volume 30, No 1, pp 16-36
26
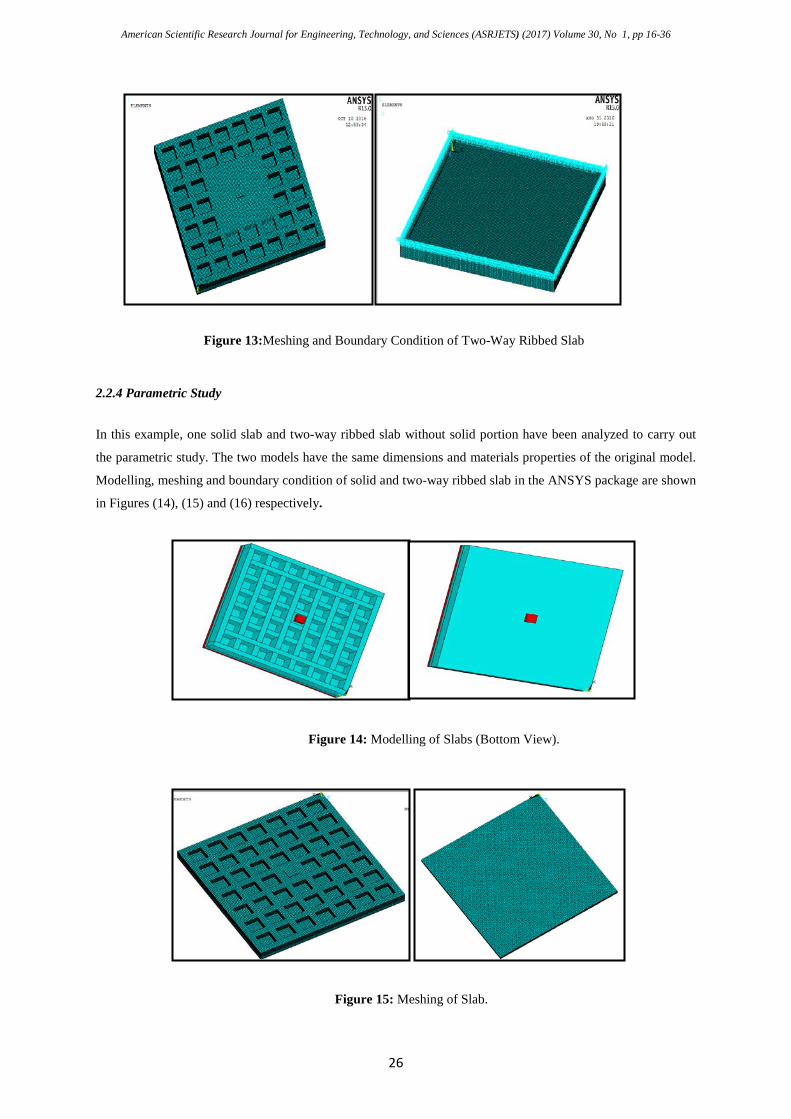
2.2.4 Parametric Study
In this example, one solid slab and two-way ribbed slab without solid portion have been analyzed to carry out
the parametric study. The two models have the same dimensions and materials properties of the original model.
Modelling, meshing and boundary condition of solid and two-way ribbed slab in the ANSYS package are shown
in Figures (14), (15) and (16) respectively.
Figure 13:Meshing and Boundary Condition of Two-Way Ribbed Slab
Figure 14: Modelling of Slabs (Bottom View).
Figure 15: Meshing of Slab.
American Scientific Research Journal for Engineering, Technology, and Sciences (ASRJETS) (2017) Volume 30, No 1, pp 16-36
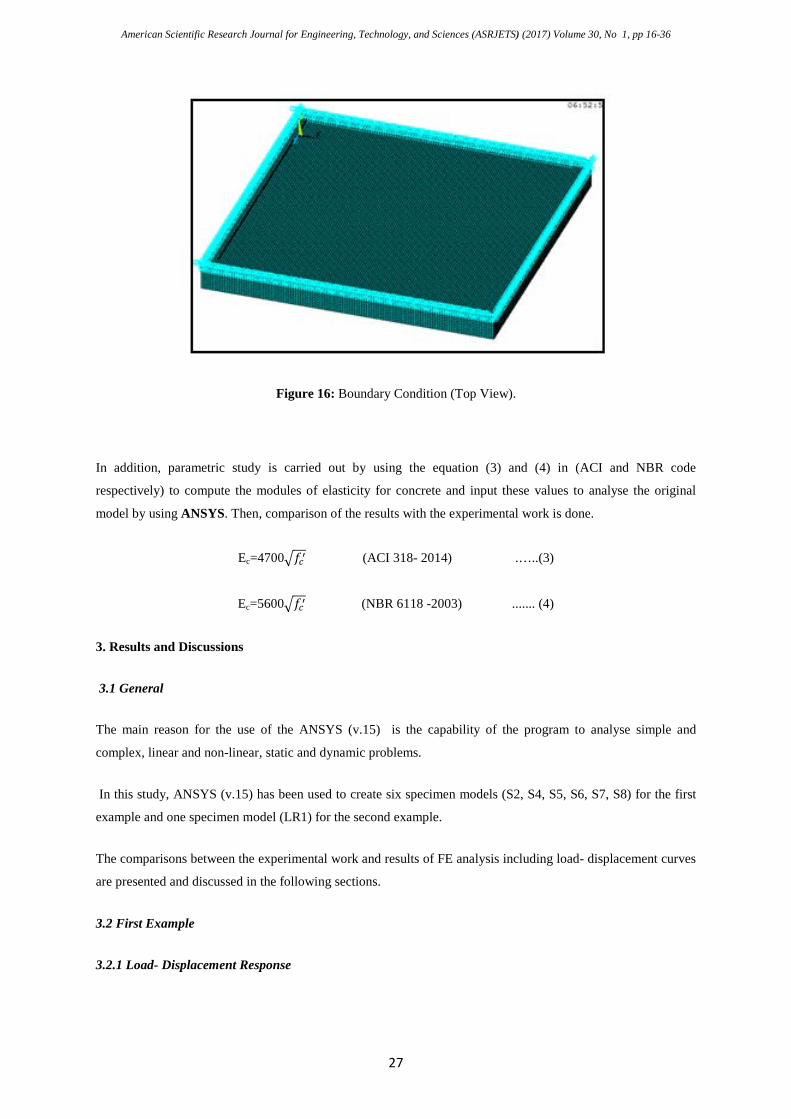
27
Figure 16: Boundary Condition (Top View).
In addition, parametric study is carried out by using the equation (3) and (4) in (ACI and NBR code
respectively) to compute the modules of elasticity for concrete and input these values to analyse the original
model by using ANSYS. Then, comparison of the results with the experimental work is done.
Ec=4700�𝑓𝑓𝑐𝑐′ (ACI 318- 2014) .…..(3)
Ec=5600�𝑓𝑓𝑐𝑐′ (NBR 6118 -2003) ....... (4)
3. Results and Discussions
3.1 General
The main reason for the use of the ANSYS (v.15) is the capability of the program to analyse simple and
complex, linear and non-linear, static and dynamic problems.
In this study, ANSYS (v.15) has been used to create six specimen models (S2, S4, S5, S6, S7, S8) for the first
example and one specimen model (LR1) for the second example.
The comparisons between the experimental work and results of FE analysis including load- displacement curves
are presented and discussed in the following sections.
3.2 First Example
3.2.1 Load- Displacement Response
American Scientific Research Journal for Engineering, Technology, and Sciences (ASRJETS) (2017) Volume 30, No 1, pp 16-36
28
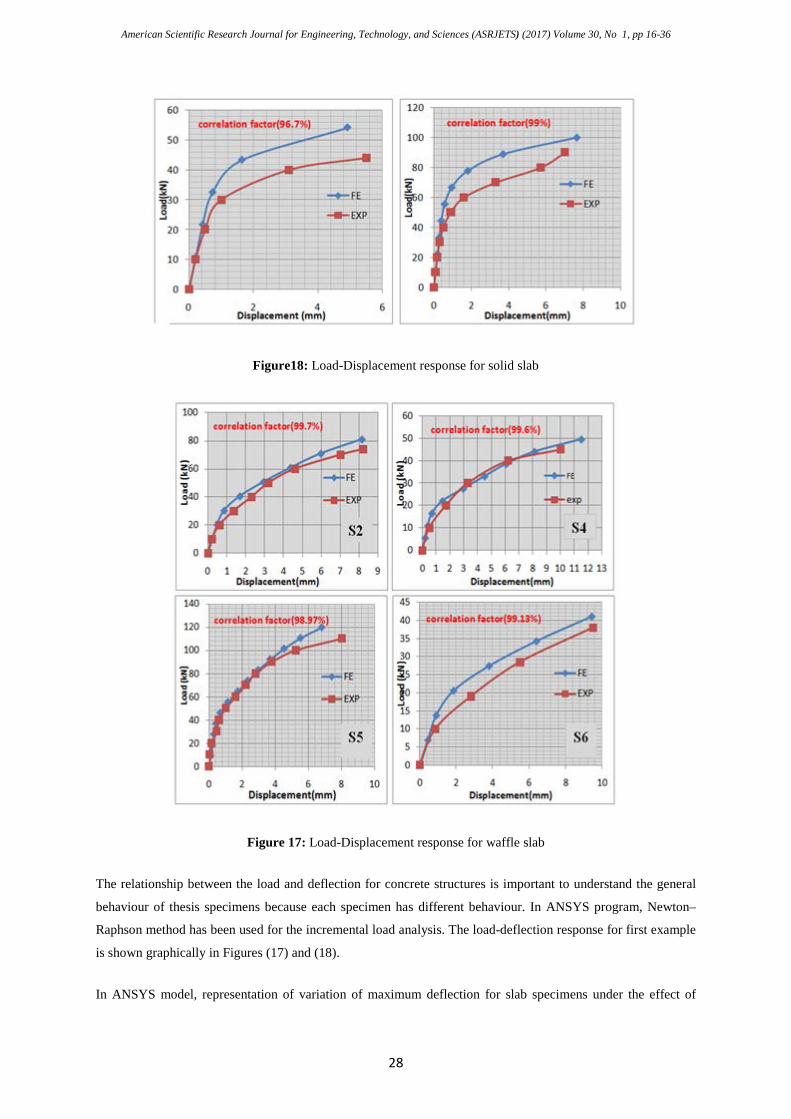
Figure18: Load-Displacement response for solid slab
Figure 17: Load-Displacement response for waffle slab
The relationship between the load and deflection for concrete structures is important to understand the general
behaviour of thesis specimens because each specimen has different behaviour. In ANSYS program, Newton–
Raphson method has been used for the incremental load analysis. The load-deflection response for first example
is shown graphically in Figures (17) and (18).
In ANSYS model, representation of variation of maximum deflection for slab specimens under the effect of
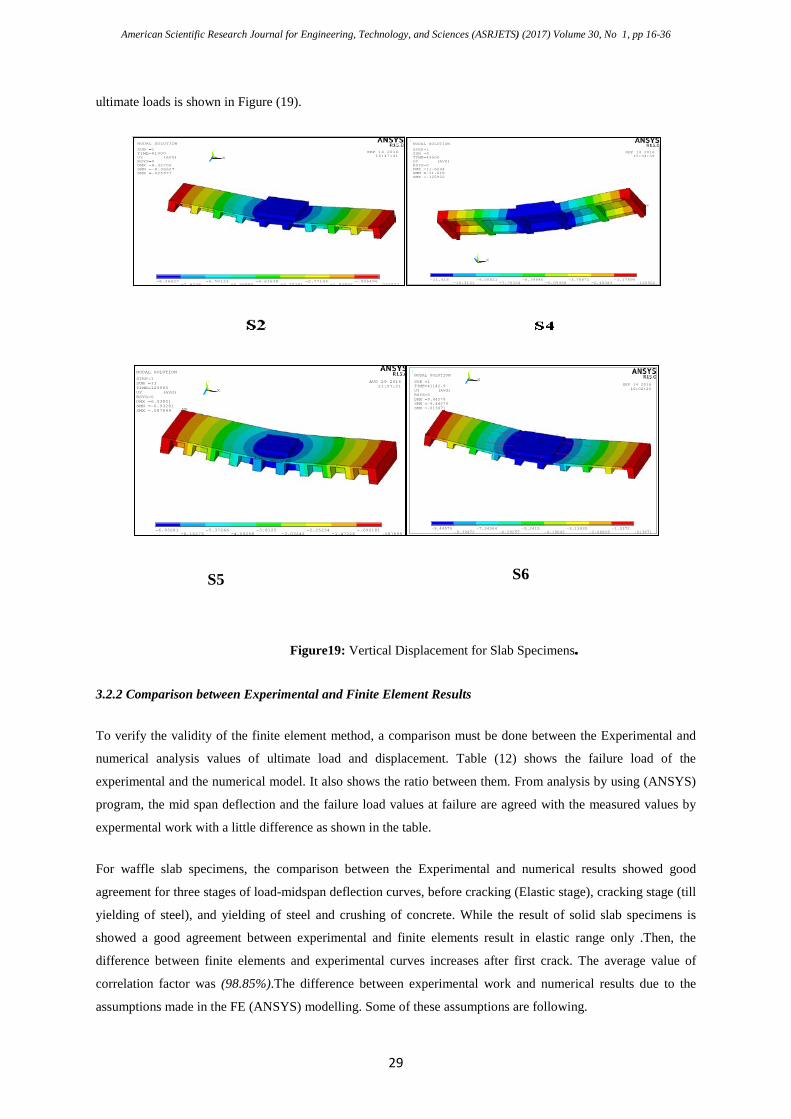
American Scientific Research Journal for Engineering, Technology, and Sciences (ASRJETS) (2017) Volume 30, No 1, pp 16-36
29
ultimate loads is shown in Figure (19).
3.2.2 Comparison between Experimental and Finite Element Results
To verify the validity of the finite element method, a comparison must be done between the Experimental and
numerical analysis values of ultimate load and displacement. Table (12) shows the failure load of the
experimental and the numerical model. It also shows the ratio between them. From analysis by using (ANSYS)
program, the mid span deflection and the failure load values at failure are agreed with the measured values by
expermental work with a little difference as shown in the table.
For waffle slab specimens, the comparison between the Experimental and numerical results showed good
agreement for three stages of load-midspan deflection curves, before cracking (Elastic stage), cracking stage (till
yielding of steel), and yielding of steel and crushing of concrete. While the result of solid slab specimens is
showed a good agreement between experimental and finite elements result in elastic range only .Then, the
difference between finite elements and experimental curves increases after first crack. The average value of
correlation factor was (98.85%).The difference between experimental work and numerical results due to the
assumptions made in the FE (ANSYS) modelling. Some of these assumptions are following.
1
MN
MX
X
Y
Z
-8.36627
-7.4338-6.50133
-5.56886-4.63638
-3.70391-2.77144
-1.83897-.906496
.025977
SEP 14 201615:47:41
NODAL SOLUTION
SUB =1TIME=81000UY (AVG)RSYS=0DMX =8.42702SMN =-8.36627SMX =.025977
1
MN
MX
XYZ
-11.618
-10.3131-9.00821
-7.70334-6.39846
-5.09358-3.78871
-2.48383-1.17896
.125922
SEP 14 201615:34:39
NODAL SOLUTION
STEP=1SUB =9TIME=49500UY (AVG)RSYS=0DMX =11.6244SMN =-11.618SMX =.125922
1
MN
MX
X
Y
Z
-6.93281
-6.15273-5.37266
-4.59258-3.8125
-3.03242-2.25234
-1.47226-.692181
.087899
AUG 29 201621:57:21
NODAL SOLUTION
STEP=1SUB =13TIME=120000UY (AVG)RSYS=0DMX =6.93501SMN =-6.93281SMX =.087899
1
MN
MX
X
Y
Z
-9.44579
-8.39472-7.34364
-6.29257-5.2415
-4.19042-3.13935
-2.08828-1.0372
.013871
SEP 14 201616:02:20
NODAL SOLUTION
SUB =1TIME=41142.9UY (AVG)RSYS=0DMX =9.44579SMN =-9.44579SMX =.013871
Figure19: Vertical Displacement for Slab Specimens.
S5 S6
American Scientific Research Journal for Engineering, Technology, and Sciences (ASRJETS) (2017) Volume 30, No 1, pp 16-36
30
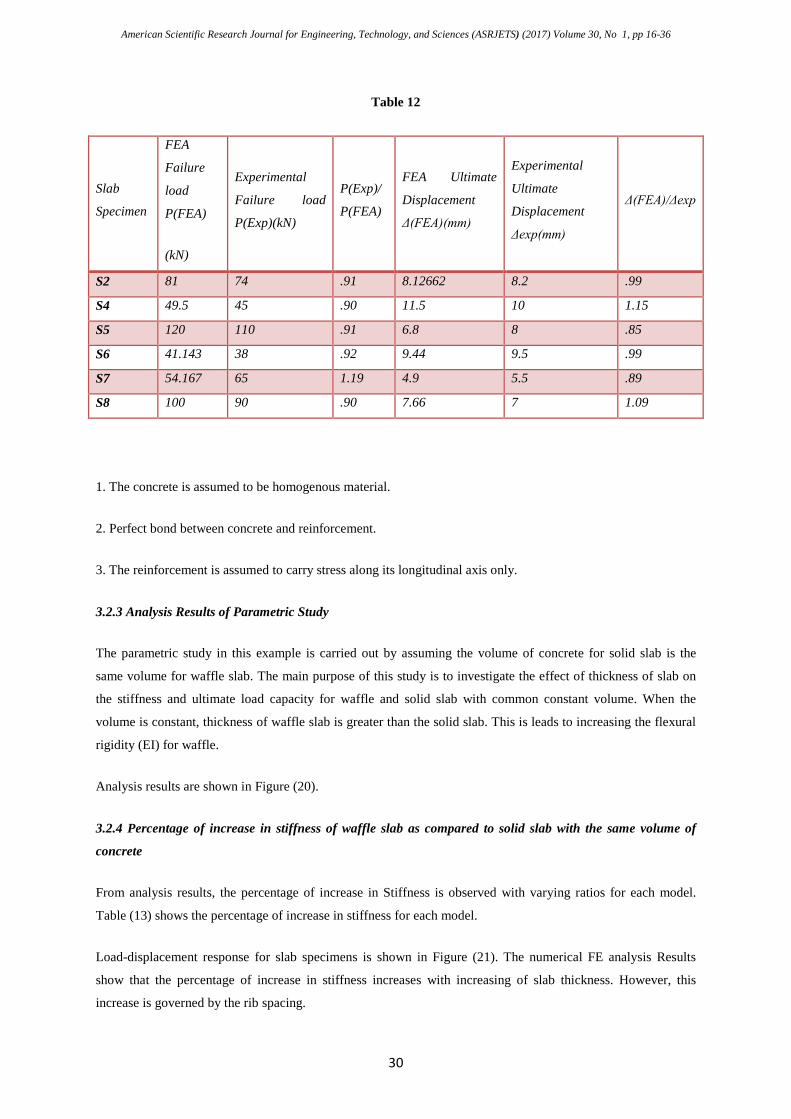
Table 12
Slab
Specimen
FEA
Failure
load
P(FEA)
(kN)
Experimental
Failure load
P(Exp)(kN)
P(Exp)/
P(FEA)
FEA Ultimate
Displacement
Δ(FEA)(mm)
Experimental
Ultimate
Displacement
Δexp(mm)
Δ(FEA)/Δexp
S2 81 74 .91 8.12662 8.2 .99
S4 49.5 45 .90 11.5 10 1.15
S5 120 110 .91 6.8 8 .85
S6 41.143 38 .92 9.44 9.5 .99
S7 54.167 65 1.19 4.9 5.5 .89
S8 100 90 .90 7.66 7 1.09
1. The concrete is assumed to be homogenous material.
2. Perfect bond between concrete and reinforcement.
3. The reinforcement is assumed to carry stress along its longitudinal axis only.
3.2.3 Analysis Results of Parametric Study
The parametric study in this example is carried out by assuming the volume of concrete for solid slab is the
same volume for waffle slab. The main purpose of this study is to investigate the effect of thickness of slab on
the stiffness and ultimate load capacity for waffle and solid slab with common constant volume. When the
volume is constant, thickness of waffle slab is greater than the solid slab. This is leads to increasing the flexural
rigidity (EI) for waffle.
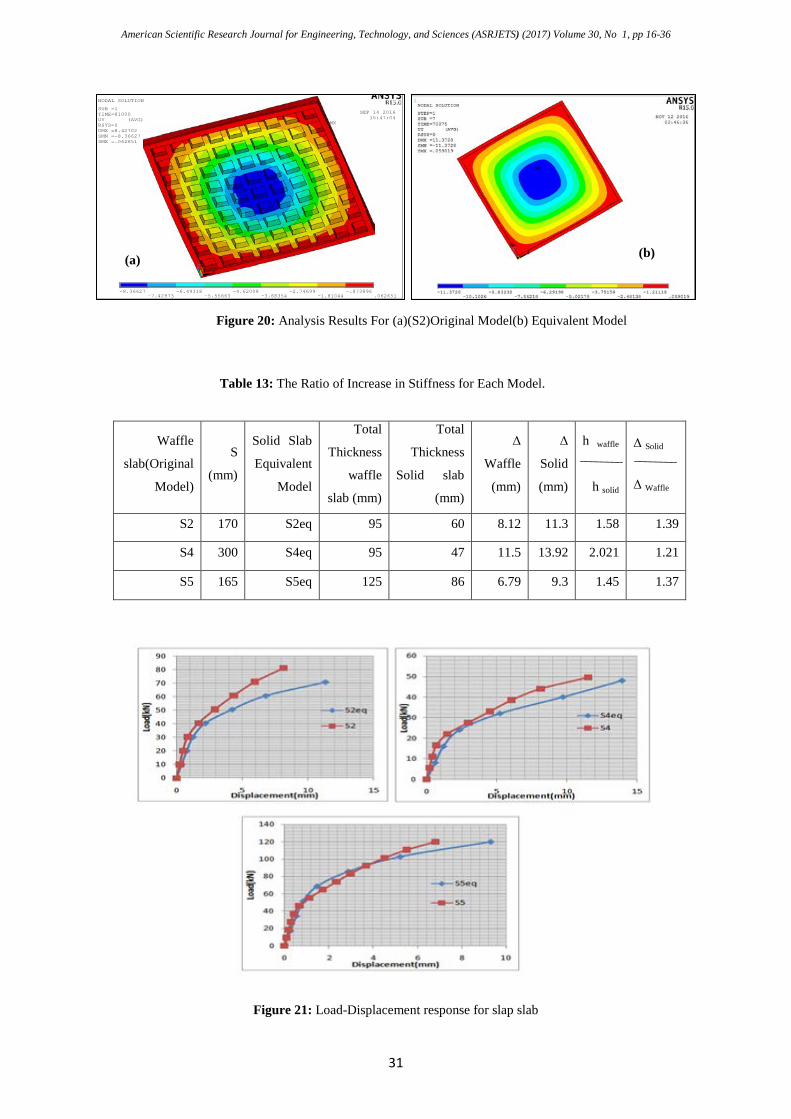
Analysis results are shown in Figure (20).
3.2.4 Percentage of increase in stiffness of waffle slab as compared to solid slab with the same volume of
concrete
From analysis results, the percentage of increase in Stiffness is observed with varying ratios for each model.
Table (13) shows the percentage of increase in stiffness for each model.
Load-displacement response for slab specimens is shown in Figure (21). The numerical FE analysis Results
show that the percentage of increase in stiffness increases with increasing of slab thickness. However, this
increase is governed by the rib spacing.
American Scientific Research Journal for Engineering, Technology, and Sciences (ASRJETS) (2017) Volume 30, No 1, pp 16-36
31
Figure 21: Load-Displacement response for slap slab
Δ Solid
Δ Waffle
h waffle
h solid
Δ
Solid
(mm)
Δ
Waffle
(mm)
Total
Thickness
Solid slab
(mm)
Total
Thickness
waffle
slab (mm)
Solid Slab
Equivalent
Model
S
(mm)
Waffle
slab(Original
Model)
1.39 1.58 11.3 8.12 60 95 S2eq 170 S2
1.21 2.021 13.92 11.5 47 95 S4eq 300 S4
1.37 1.45 9.3 6.79 86 125 S5eq 165 S5
1
MN
MX
XYZ
-8.36627
-7.42973-6.49318
-5.55663-4.62008
-3.68354-2.74699
-1.81044-.873896
.062651
SEP 14 201615:47:04
NODAL SOLUTION
SUB =1TIME=81000UY (AVG)RSYS=0DMX =8.42702SMN =-8.36627SMX =.062651
(b)
Figure 20: Analysis Results For (a)(S2)Original Model(b) Equivalent Model
(a)
Table 13: The Ratio of Increase in Stiffness for Each Model.
American Scientific Research Journal for Engineering, Technology, and Sciences (ASRJETS) (2017) Volume 30, No 1, pp 16-36
32
3.3. Second Example
3.3.1 Load-Displacement Response
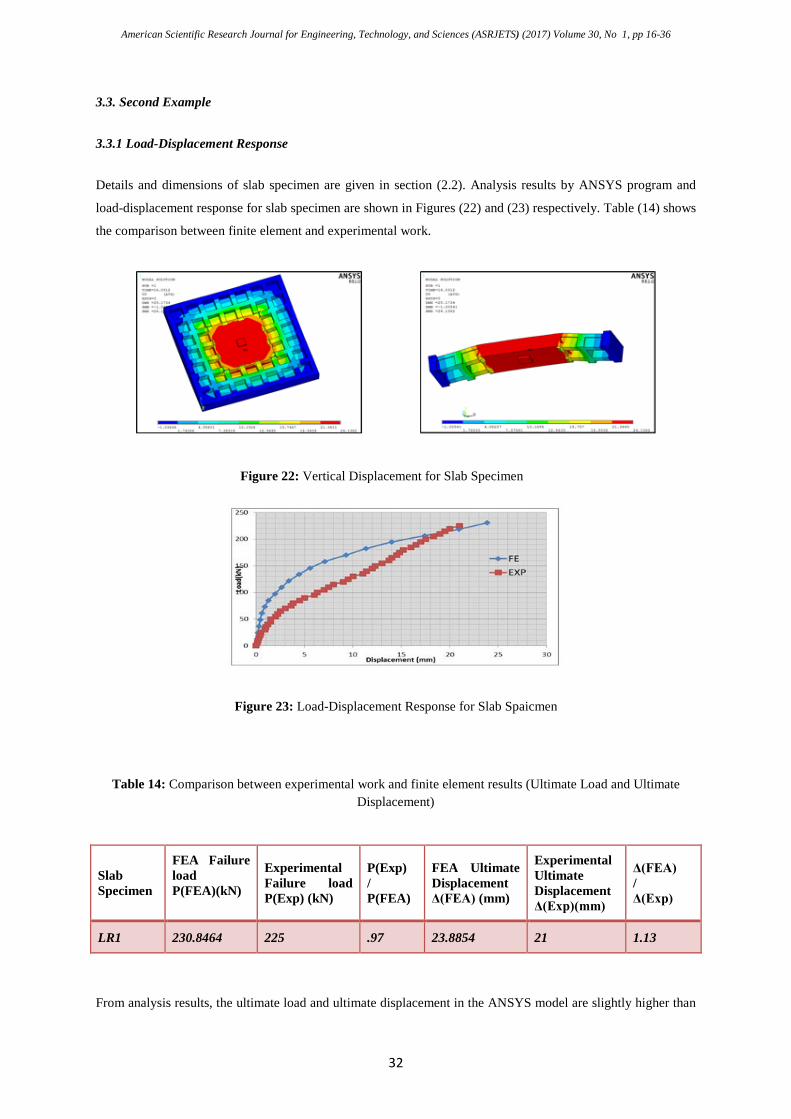
Details and dimensions of slab specimen are given in section (2.2). Analysis results by ANSYS program and
load-displacement response for slab specimen are shown in Figures (22) and (23) respectively. Table (14) shows
the comparison between finite element and experimental work.
Figure 22: Vertical Displacement for Slab Specimen
Figure 23: Load-Displacement Response for Slab Spaicmen
Table 14: Comparison between experimental work and finite element results (Ultimate Load and Ultimate Displacement)
From analysis results, the ultimate load and ultimate displacement in the ANSYS model are slightly higher than
Slab Specimen
FEA Failure load P(FEA)(kN)
Experimental Failure load P(Exp) (kN)
P(Exp) / P(FEA)
FEA Ultimate Displacement Δ(FEA) (mm)
Experimental Ultimate Displacement Δ(Exp)(mm)
Δ(FEA) / Δ(Exp)
LR1 230.8464 225 .97 23.8854 21 1.13
American Scientific Research Journal for Engineering, Technology, and Sciences (ASRJETS) (2017) Volume 30, No 1, pp 16-36
33
the experimental work in the elastic range. In the cracking stage, the difference between experimental work and
Finite Element result is increased. This difference may be due to the existence of errors in experimental work or
the measure of deflection is not accurate. In addition to the imposition of perfect bond in numerical analysis.
The correlation factor value is found to equal (73.7%).
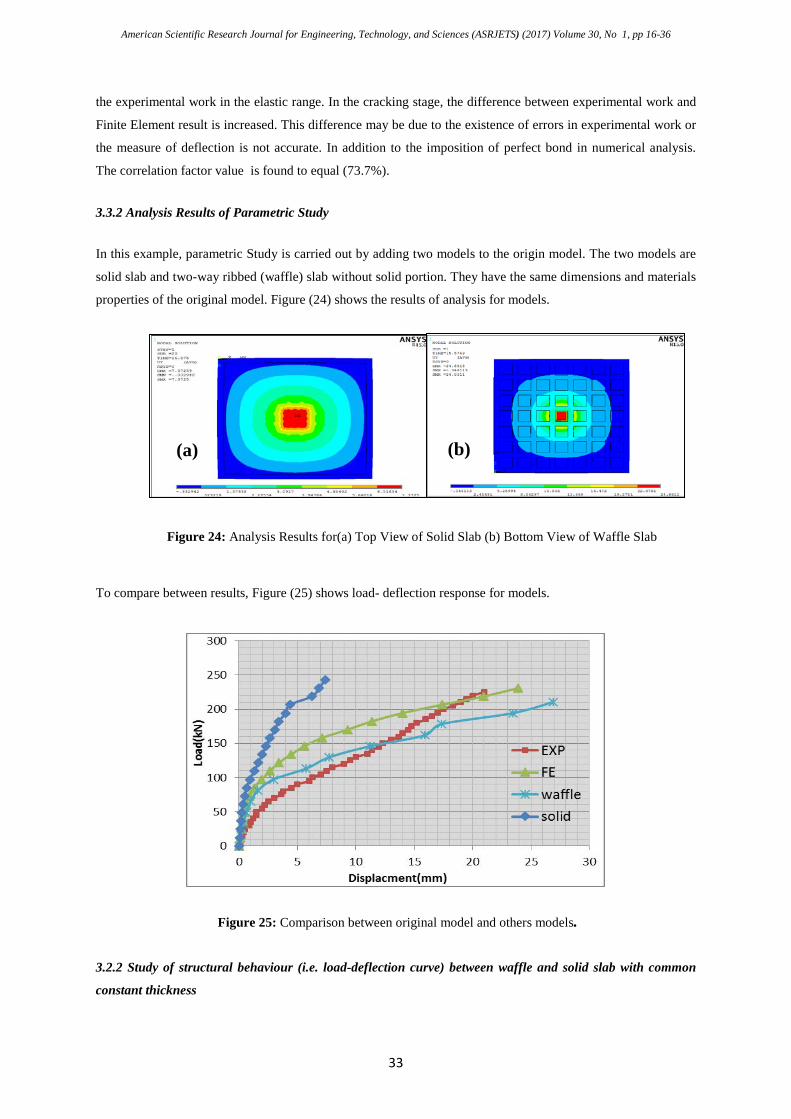
3.3.2 Analysis Results of Parametric Study
In this example, parametric Study is carried out by adding two models to the origin model. The two models are
solid slab and two-way ribbed (waffle) slab without solid portion. They have the same dimensions and materials
properties of the original model. Figure (24) shows the results of analysis for models.
To compare between results, Figure (25) shows load- deflection response for models.
3.2.2 Study of structural behaviour (i.e. load-deflection curve) between waffle and solid slab with common
constant thickness
Figure 24: Analysis Results for(a) Top View of Solid Slab (b) Bottom View of Waffle Slab
(a) (b)
Figure 25: Comparison between original model and others models.
American Scientific Research Journal for Engineering, Technology, and Sciences (ASRJETS) (2017) Volume 30, No 1, pp 16-36
34
After analysis, the results for the two proposed models have been compared with the original model. The results
showed that the solid slab has higher stiffness because the thickness for all specimens is equal. Two way ribbed
(waffle) slab has higher stiffness up to (150) kN loading. Beyond this limit, the stiffness for this model is
slightly decreased.
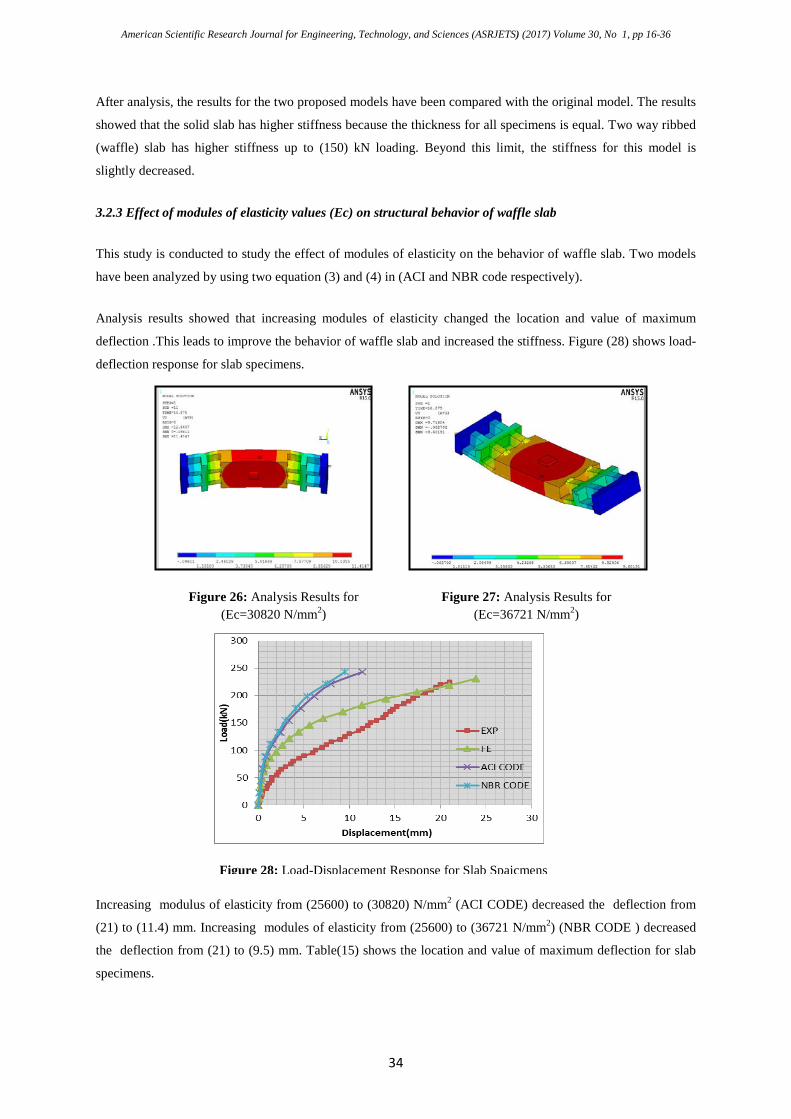
3.2.3 Effect of modules of elasticity values (Ec) on structural behavior of waffle slab
This study is conducted to study the effect of modules of elasticity on the behavior of waffle slab. Two models
have been analyzed by using two equation (3) and (4) in (ACI and NBR code respectively).
Analysis results showed that increasing modules of elasticity changed the location and value of maximum
deflection .This leads to improve the behavior of waffle slab and increased the stiffness. Figure (28) shows load-
deflection response for slab specimens.
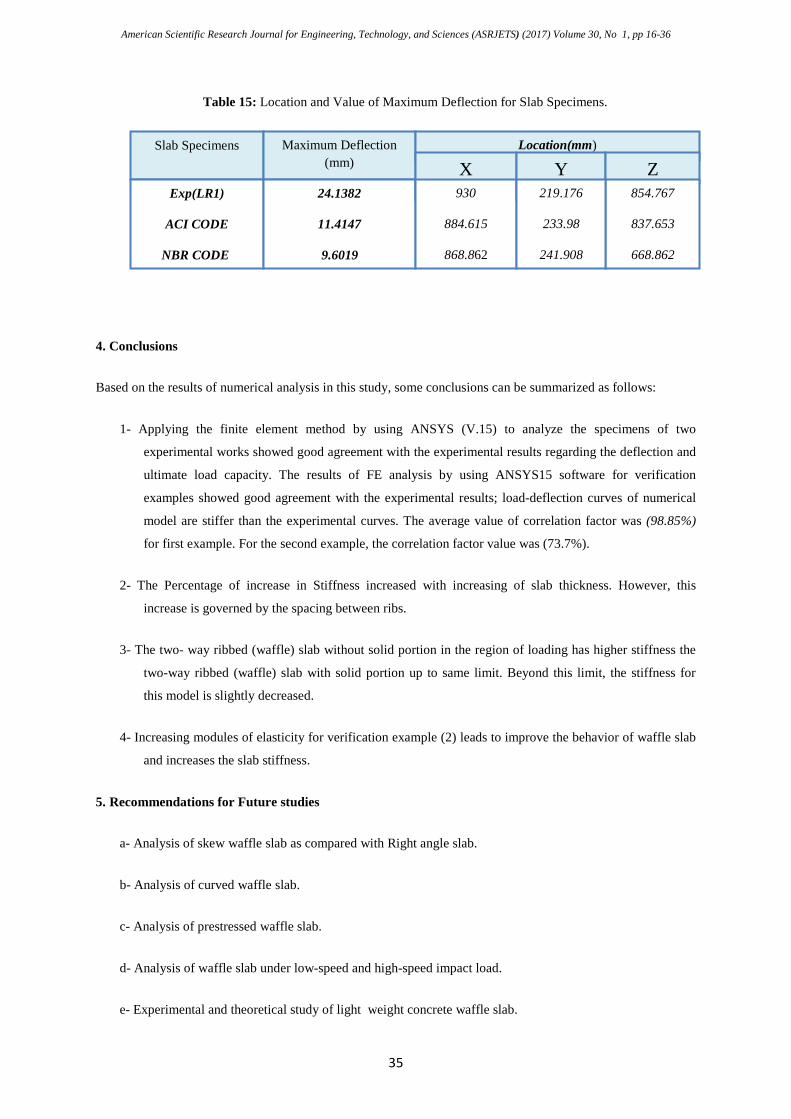
Increasing modulus of elasticity from (25600) to (30820) N/mm2 (ACI CODE) decreased the deflection from
(21) to (11.4) mm. Increasing modules of elasticity from (25600) to (36721 N/mm2) (NBR CODE ) decreased
the deflection from (21) to (9.5) mm. Table(15) shows the location and value of maximum deflection for slab
specimens.
Figure 28: Load-Displacement Response for Slab Spaicmens
Figure 26: Analysis Results for (Ec=30820 N/mm2)
Figure 27: Analysis Results for (Ec=36721 N/mm2)
American Scientific Research Journal for Engineering, Technology, and Sciences (ASRJETS) (2017) Volume 30, No 1, pp 16-36
35
Table 15: Location and Value of Maximum Deflection for Slab Specimens.
4. Conclusions
Based on the results of numerical analysis in this study, some conclusions can be summarized as follows:
1- Applying the finite element method by using ANSYS (V.15) to analyze the specimens of two
experimental works showed good agreement with the experimental results regarding the deflection and
ultimate load capacity. The results of FE analysis by using ANSYS15 software for verification
examples showed good agreement with the experimental results; load-deflection curves of numerical
model are stiffer than the experimental curves. The average value of correlation factor was (98.85%)
for first example. For the second example, the correlation factor value was (73.7%).
2- The Percentage of increase in Stiffness increased with increasing of slab thickness. However, this
increase is governed by the spacing between ribs.
3- The two- way ribbed (waffle) slab without solid portion in the region of loading has higher stiffness the
two-way ribbed (waffle) slab with solid portion up to same limit. Beyond this limit, the stiffness for
this model is slightly decreased.
4- Increasing modules of elasticity for verification example (2) leads to improve the behavior of waffle slab
and increases the slab stiffness.
5. Recommendations for Future studies
a- Analysis of skew waffle slab as compared with Right angle slab.
b- Analysis of curved waffle slab.
c- Analysis of prestressed waffle slab.
d- Analysis of waffle slab under low-speed and high-speed impact load.
e- Experimental and theoretical study of light weight concrete waffle slab.
Slab Specimens
Exp(LR1)
ACI CODE
NBR CODE
Maximum Deflection (mm)
24.1382
11.4147
9.6019
Location(mm)
X 930
884.615
868.862
Y Z 854.767
837.653
668.862
219.176
233.98
241.908
American Scientific Research Journal for Engineering, Technology, and Sciences (ASRJETS) (2017) Volume 30, No 1, pp 16-36
36
References
[1] Kennedy J.B., "Orientation of Ribs In Waffle-Slab Skew Bridges" ,Journal of Structural Engineering,
ASCE, Vol. 109, No.3,pp.811-816, (1983).
[2] Abdul-Wahab H. M. S. & KhaliI M. H., "Rigidity And Strength of Orthotropic Reinforced Concrete
Waffle Slab" ,ACI, Journal Structural Engineering, Vol. 126, No.2,pp. 219-227. ,(2000).
[3] P. Hájek, M. Kynčlová & C. Fiala3, "Large Scale Tests and Environmental Evaluation of The Waffle
Floor Slabs from Fibre Concrete", FIBRE CONCRETE September(2009).
[4] Alaa C. Galeb &Zainab F. Atiyah, "Optimum Design of Reinforced Concrete Waffle Slabs",
International journal of civil and structural engineering, Vol. 1, No .4, ,pp.,862-880, 2011
[5] Ibrahim Mohammad Arman, "Analysis Of Two- Way Ribbed and Waffle Slabs with Hidden Beams",
International journal of Civil and Structural Engineering ,Vol 4, No. 3, ,pp.,342-352, 2014.
[6] AGUIAR, Amaury J. O. de, "Experimental Analysis of Reinforced Concrete Two-Way Waffle Flat
Slabs with Holes Adjacent to the Column". Belém,. 199p. Dissertação (Mestrado) –Programa de Pós-
GraduaçãoemEngenharia Civil, Universidade Federal do Pará, 2009.
[7] Damian Kachlakev & Thomas Miller ,"Finite Element Modeling of Reinforced Concrete Structures
strengthened With FRP Laminates", Ph.D Thesis, Oregon Department of Transportation& Federal
Highway Administration,2001.
[8] Nada Mohammed Allawi, “Behavior and Strength Of One- Way Voided Reinforced Concrete Slabs",
M.SC. Thesis, University of Anbar, Iraq, May 2014.