Analysis and Optimization of Shielded Metal Arc Welding...
14
ISSN No: 2309-4893 International Journal of Advanced Engineering and Global Technology I Vol-05, Issue-01, January 2017 1431 www.ijaegt.com Analysis and Optimization of Shielded Metal Arc Welding Parameters on Mechanical Properties of Carbon Steel Joints by Taguchi Method S. H. Zoalfakar a , A. A. Hassan * b a, b Department of Mechanical Engineering, The Higher Technological Institute (HTI), 10 th of Ramadan City, Egypt. * Corresponding author’s Email: [email protected] Tel.: 01005855475 Abstract The effect of welding parameters on mechanical and microstructural properties of St.37/2, St.44/2 and St.52/3 joints produced by shielded metal arc welding (SMAW) was analyzed in the present study. Different heat inputs (H) were applied to butt- welding joints by controlling current. To study the effect of groove angles on mechanical properties, the specimens were machined with different groove angles 40˚, 60˚, 80˚ and 100˚. In order to determine the effect of welding process on the local heat affected zone (HAZ) thermal cycle during welding, three different conditions were chosen, where temperatures were recorded by using K-type thermocouples and a data acquisition system card of USB 6008, National Instrument type. The mechanical properties were evaluated by means of microhardness and tensile tests at room temperature. Taguchi approach was applied to determine the most influential control factors which will yield better mechanical properties of the joints, where Taguchiʼs tools such as signal-to- noise ratio (S/N) have been used to observe the significant parameters and the optimal combination level of SMAW parameters. KEYWORDS: Optimization, orthogonal array, S/N ratio, ANOVA., SMAW. I NTRODUCTION Shielded Metal Arc Welding (SMAW), commonly called stick, or covered electrode, welding, is a manual welding process whereby an arc is generated between a flux-covered consumable electrode and the workpiece. The process uses the decomposition of the coat flux to generate a shielding gas and to provide fluxing elements to protect the molten weld-metal droplets and the weld pool [1]. The problem that has faced the manufacturer is the control of the process input parameters to obtain a good welded joint with the required weld quality. Traditionally, it has been necessary to study the weld input parameters for welded product to obtain a welded joint with the required quality. To do so, requires a time-consuming trial and error development method. Design of experiment (DOE) was first introduced in 1920's by R. A. Fisher who developed the basic principles of factorial design and the associated data analysis known as ANOVA; Analysis of Variance; [2]. S. R. Patil and C.A. Waghmare [3] studied the optimization of welding parameters on ultimate tensile strength (UTS) of AISI 1030 mild steel using Taguchi technique. From this study, they observed that welding current and welding speed are major parameters which affect the tensile strength of the welded joint. The optimization of process parameters in gas tungsten arc welding (GTAW) using Taguchi was investigated by Ajit Khater et al. [4]. They came to the conclusion that control factors have varying effects on the tensile strength and welding voltage having the highest effect. R. Sathish et al. [5] studied the weldability and process parameter optimization of dissimilar pipe joints using GTAW. They found that, lower heat input resulted in lower tensile strength and too high heat input also
Transcript of Analysis and Optimization of Shielded Metal Arc Welding...

ISSN No: 2309-4893 International Journal of Advanced Engineering and Global Technology I Vol-05, Issue-01, January 2017
1431 www.ijaegt.com
Analysis and Optimization of Shielded Metal Arc Welding Parameters
on Mechanical Properties of Carbon Steel Joints by Taguchi Method
S. H. Zoalfakar a, A. A. Hassan *b
a, b Department of Mechanical Engineering, The Higher Technological Institute (HTI),
10th
of Ramadan City, Egypt. *
Corresponding author’s Email: [email protected] Tel.: 01005855475
Abstract
The effect of welding parameters on mechanical and microstructural properties of St.37/2,
St.44/2 and St.52/3 joints produced by shielded metal arc welding (SMAW) was analyzed in
the present study. Different heat inputs (H) were applied to butt- welding joints by controlling
current. To study the effect of groove angles on mechanical properties, the specimens were
machined with different groove angles 40˚, 60˚, 80˚ and 100˚. In order to determine the effect
of welding process on the local heat affected zone (HAZ) thermal cycle during welding, three
different conditions were chosen, where temperatures were recorded by using K-type
thermocouples and a data acquisition system card of USB 6008, National Instrument type.
The mechanical properties were evaluated by means of microhardness and tensile tests at
room temperature. Taguchi approach was applied to determine the most influential control
factors which will yield better mechanical properties of the joints, where Taguchiʼs tools such
as signal-to- noise ratio (S/N) have been used to observe the significant parameters and the
optimal combination level of SMAW parameters.
KEYWORDS: Optimization, orthogonal array, S/N ratio, ANOVA., SMAW.
I NTRODUCTION
Shielded Metal Arc Welding (SMAW), commonly called stick, or covered electrode,
welding, is a manual welding process whereby an arc is generated between a flux-covered
consumable electrode and the workpiece. The process uses the decomposition of the coat flux
to generate a shielding gas and to provide fluxing elements to protect the molten weld-metal
droplets and the weld pool [1]. The problem that has faced the manufacturer is the control of
the process input parameters to obtain a good welded joint with the required weld quality.
Traditionally, it has been necessary to study the weld input parameters for welded product to
obtain a welded joint with the required quality. To do so, requires a time-consuming trial and
error development method.
Design of experiment (DOE) was first introduced in 1920's by R. A. Fisher who developed
the basic principles of factorial design and the associated data analysis known as ANOVA;
Analysis of Variance; [2]. S. R. Patil and C.A. Waghmare [3] studied the optimization of
welding parameters on ultimate tensile strength (UTS) of AISI 1030 mild steel using Taguchi
technique. From this study, they observed that welding current and welding speed are major
parameters which affect the tensile strength of the welded joint. The optimization of process
parameters in gas tungsten arc welding (GTAW) using Taguchi was investigated by Ajit
Khater et al. [4]. They came to the conclusion that control factors have varying effects on the
tensile strength and welding voltage having the highest effect. R. Sathish et al. [5] studied the
weldability and process parameter optimization of dissimilar pipe joints using GTAW. They
found that, lower heat input resulted in lower tensile strength and too high heat input also

ISSN No: 2309-4893 International Journal of Advanced Engineering and Global Technology I Vol-05, Issue-01, January 2017
1432 www.ijaegt.com
resulted in reduced tensile strength. An intermediate value of heat input gave the highest
tensile strength. The optimization of weld bead geometry and welding parameters in SMAW
using Taguchi was studied by S. M. Ravikumar and P. Vijian [6]. They used ANOVA to
identify the most significant factor. They concluded that the welding current is the most
significant welding process parameter followed by welding speed then weld velocity.
Optimization of welding parameters using Taguchi's and DOE for different welding
technique was studied to understand the most significant parameters affecting on the welding
quality [7-14].
The present study is intended to determine the optimal process condition in SMAW
process to yield desired weld quality and also to evaluate the effect of various parameters on
mechanical and microstructural properties of St.37/2, St.44/2 and St.52/3 joints, rank theses
cores, and determine the optimal welding parameter settings. Also confirmation tests are
performed by using experiments. ANOVA is performed to investigate the more influencing
parameters on the multiple performance characteristics.
2. EXPERIMENTAL PROCEDURE
SMAW process is done on 160 mm x 90 mm x 5 mm ST 37/2, ST 44/2 and ST 52/3 steel
plates. The experimental setup of the workpiece for SMAW process is shown in Fig.1. The
chemical compositions of the steel plates and the consumable electrode used for SMAW,
E6013 (φ3mm) are shown in Table 1. The levels of parameters are listed in Table 2. The
experimental design and observed values from the specimens are given in Table 4.
Table 1 Chemical compositions of base materials and consumable electrode (weight in %).
Materials C Si Mn P S N
ST 37/2 0.19 - 1.5 0.055 0.055 0.011
ST44/2 0.21 - 1.6 0.045 0.045 0.011
ST52/3 0.24 0.6 1.7 0.045 0.045 NON
E6013 0.10 0.35 0.3 0.04 0.035 NON
Table 2 Experimental parameters and levels.
Input parameters Symbol Levels
1 2 3 4
Groove angle (θ ) θ 40 60 80 100
C.E % CE 0.36 0.39 0.43 0.36
Heat input, kJ mm H 24.4 27.1 29.8 32.5
Preheating (˚C) Pr 25 600 950 25
To calculate carbon equivalent (C.E.) we have to use the equation [15]:
C.E. = C + Mn/6 + (Cr + Mo + V)/5 + (Ni + Cu)/15 (1)
Four values of the current were used.
I = 90, 100, 110, 120. [Ampere]

ISSN No: 2309-4893 International Journal of Advanced Engineering and Global Technology I Vol-05, Issue-01, January 2017
1433 www.ijaegt.com
To calculate the heat input (H)
(2)
Where:
H: Heat input (kJ/mm).
E: Arc voltage (Volts).
I: Current (Ampere).
S: Weld speed (mm/min).
Arc voltage and weld speed were kept contact at 280 V and 84 mm/min respectively.
Preheating of tested plates is performed in a muffle furnace at 600 ˚C and 950 ˚C for a time 2
hr.
1. Experimental Design
The design of experiments (DOEs) is a powerful scientific systematic statistical technique for
determining the optimal factor settings of a process and thereby achieving improved process
performance, reduced process variability and improved manufacturability of products and
processes. Taguchi’s such approach is a powerful tool for the successful design application of
high quality experimental procedure for quality products [16]. Taguchi’s technique focuses
on off-line experiments of single quality characteristic optimization for a product or a process
that needs improvement leading to controlling factors determination and subsequent
regulation, managing to adjust their influence even under a very noisy environment. The first
step in Taguchi’s statistical design is the selection of levels and their factors. In the present
study, groove angle (Ө), C.E, heat input and preheating were considered as parameters. Based
on the available literature and laboratory trials, various levels of these mix parameters were
chosen. Table 2 shows the chosen factors and their levels. A standard L16(44) orthogonal
array (OA) was selected for the design of experimental trial runs with four factors and four
levels, giving rise to a total of sixteen combination of trial mixes as shown in Table 4.
Taguchi used the S/N ratio as the quality characteristic of choice. The S/N ratio is used as a
measurable value instead of the standard deviation because, as the mean decreases, the
standard deviation also decreases, and vice versa [17 and 18]. By comparing the S/N ratio of
the observed values, the optimal combination levels of post-fire parameters were determined.
Each experiment is repeated three times to reduce the influence of the uncontrolled factors
(noise factors). The quality values (yi) of three-repeated numbers are transformed into the
S/N ratio (η) via the relation:
⁄ ( ) (
∑
)
(3)
Where the quality value with larger-the-better style has been assumed for all of the measured
quality parameters. A control parameter with the largest effect means that it has the most
significant influence on the weld quality. The analysis of variance (ANOVA) is used to
discuss the relative importance of all control parameters on the weld quality and to determine
which control parameter has the most significant effect. The predicted value of the S/N ratio
at the optimum parameter levels (Yopt) is calculated by using the following formula:
ISSN No: 2309-4893 International Journal of Advanced Engineering and Global Technology I Vol-05, Issue-01, January 2017
1434 www.ijaegt.com
∑ ( ) (4)
Where k is the number of control parameters, is the overall mean value of the 16
experiments, and Ymi is the average S/N ratio for i the control parameter corresponding to the
optimum parameter level.
3. Characterizations
3.1 Thermal measurements
In order to determine the effect of welding process on the local SMAW thermal cycle during
welding, three different conditions were chosen and used to produce welds instrumented with
thermocouples. During welding process, the temperature was measured by rapid response of
1 mm diameter K- type thermocouples. The thermocouples were imbedded in a series of
small hole (1.5 mm diameter) at different distances from welding edge, and as closed as
possible to the consumable electrode at different distance of 3.5 mm, 7 mm, 10.6 mm from
the edge of piece as shown in Fig.1. The holes were precision drilled into the tested plates of
the workpiece at 2.5 mm depth. The thermally conducting past was packed in the holes to
seat the thermocouples. The temperature was recorded digitally every one second by using
data acquisition card, shown in Fig.2.
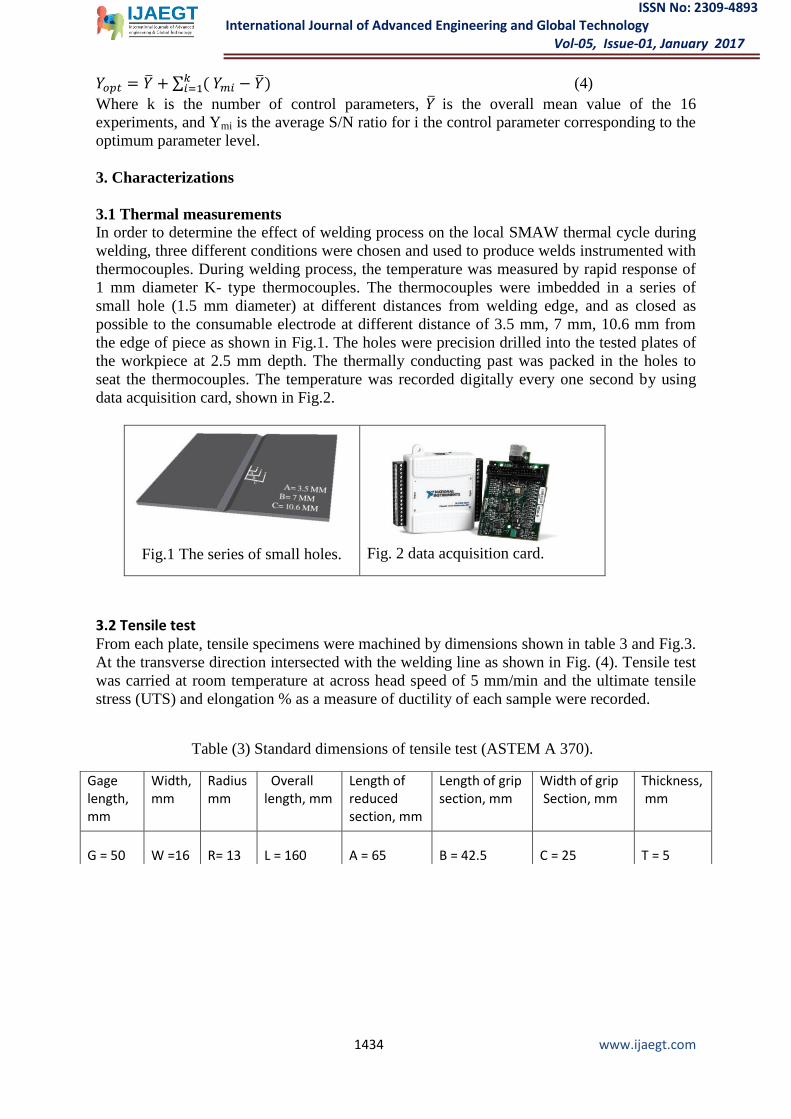
Fig.1 The series of small holes. Fig. 2 data acquisition card.
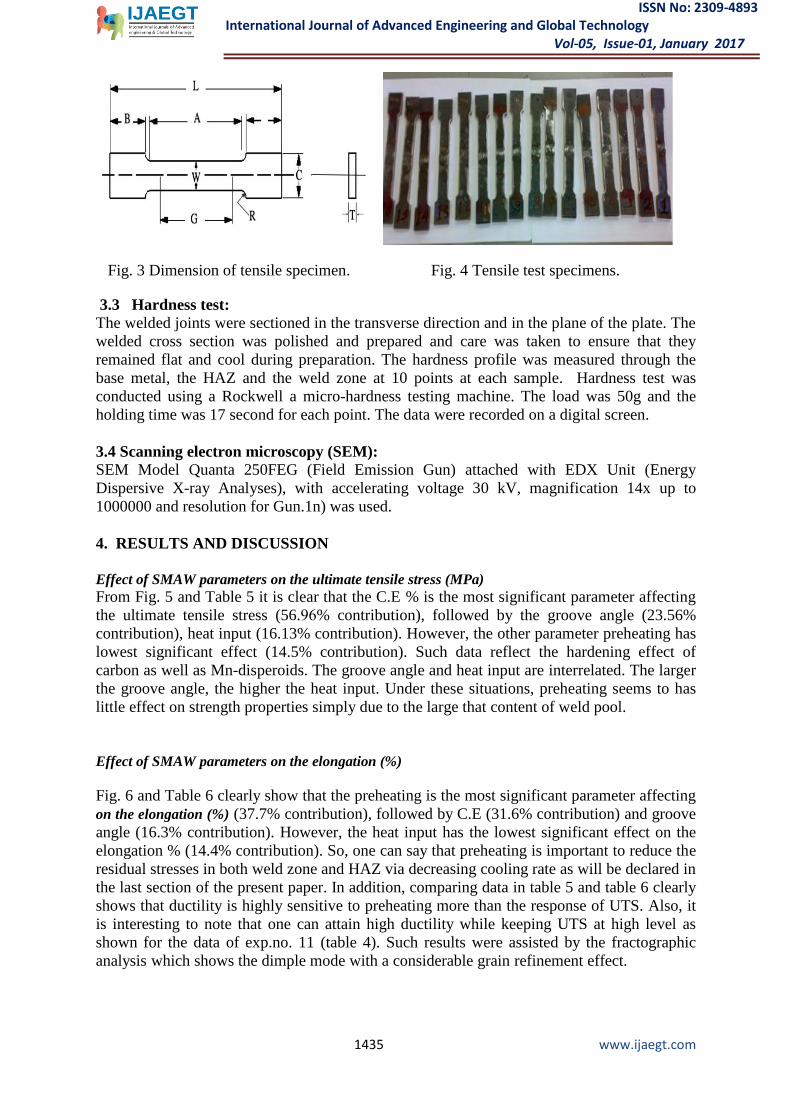
3.2 Tensile test From each plate, tensile specimens were machined by dimensions shown in table 3 and Fig.3.
At the transverse direction intersected with the welding line as shown in Fig. (4). Tensile test
was carried at room temperature at across head speed of 5 mm/min and the ultimate tensile
stress (UTS) and elongation % as a measure of ductility of each sample were recorded.
Table (3) Standard dimensions of tensile test (ASTEM A 370).
Gage length, mm
Width, mm
Radius mm
Overall length, mm
Length of reduced section, mm
Length of grip section, mm
Width of grip Section, mm
Thickness, mm
G = 50 W =16 R= 13 L = 160 A = 65 B = 42.5 C = 25 T = 5
ISSN No: 2309-4893 International Journal of Advanced Engineering and Global Technology I Vol-05, Issue-01, January 2017
1435 www.ijaegt.com
Fig. 3 Dimension of tensile specimen. Fig. 4 Tensile test specimens.
3.3 Hardness test:
The welded joints were sectioned in the transverse direction and in the plane of the plate. The
welded cross section was polished and prepared and care was taken to ensure that they
remained flat and cool during preparation. The hardness profile was measured through the
base metal, the HAZ and the weld zone at 10 points at each sample. Hardness test was
conducted using a Rockwell a micro-hardness testing machine. The load was 50g and the
holding time was 17 second for each point. The data were recorded on a digital screen.
3.4 Scanning electron microscopy (SEM):
SEM Model Quanta 250FEG (Field Emission Gun) attached with EDX Unit (Energy
Dispersive X-ray Analyses), with accelerating voltage 30 kV, magnification 14x up to
1000000 and resolution for Gun.1n) was used.
4. RESULTS AND DISCUSSION
Effect of SMAW parameters on the ultimate tensile stress (MPa)
From Fig. 5 and Table 5 it is clear that the C.E % is the most significant parameter affecting
the ultimate tensile stress (56.66% contribution), followed by the groove angle (23.56%
contribution), heat input (16.13% contribution). However, the other parameter preheating has
lowest significant effect (14.5% contribution). Such data reflect the hardening effect of
carbon as well as Mn-disperoids. The groove angle and heat input are interrelated. The larger
the groove angle, the higher the heat input. Under these situations, preheating seems to has
little effect on strength properties simply due to the large that content of weld pool.
Effect of SMAW parameters on the elongation (%)
Fig. 6 and Table 6 clearly show that the preheating is the most significant parameter affecting
on the elongation (%) (37.7% contribution), followed by C.E (31.6% contribution) and groove
angle (16.3% contribution). However, the heat input has the lowest significant effect on the
elongation % (14.4% contribution). So, one can say that preheating is important to reduce the
residual stresses in both weld zone and HAZ via decreasing cooling rate as will be declared in
the last section of the present paper. In addition, comparing data in table 5 and table 6 clearly
shows that ductility is highly sensitive to preheating more than the response of UTS. Also, it
is interesting to note that one can attain high ductility while keeping UTS at high level as
shown for the data of exp.no. 11 (table 4). Such results were assisted by the fractographic
analysis which shows the dimple mode with a considerable grain refinement effect.

ISSN No: 2309-4893 International Journal of Advanced Engineering and Global Technology I Vol-05, Issue-01, January 2017
1436 www.ijaegt.com
Table 4 L16 matrix for the experiments and experimental results.
Exp.
no. Input parameters Experimental results
Groove
angle C.E %
heat
input
kJ
Preheating
˚C UTS
(MPa)
Elongation%
Average
hardness
1 40 0.36 24.4 25 292.5 9 42.46
2 40 0.39 27.1 600 250 10.6 39.27
3 40 0.43 29.8 950 380 5 52.38
4 40 0.36 32.5 25 290 10.2 43.7
5 60 0.36 27.1 950 250 6.2 41.48
6 60 0.39 24.4 25 282.5 8.4 43.61
7 60 0.43 32.5 25 330 7 51.11
8 60 0.36 29.8 600 342.5 15 43.28
9 80 0.36 29.8 25 327.5 11.6 43.01
10 80 0.39 32.5 950 262.5 4.6 38.86
11 80 0.43 24.4 600 452.5 10.2 49.72
12 80 0.36 27.1 25 337.5 19 40.95
13 100 0.36 32.5 600 340 12.2 42.72
14 100 0.39 29.8 25 375 12.2 42.42
15 100 0.43 27.1 25 442.5 8.4 50.26
16 100 0.36 24.4 950 282.5 11 38.12
Table 5 Analysis of the ultimate tensile stress (MPa) results.
Level Groove angle C.E heat input preheating
1 49.53 49.72 50.12 50.40
2 49.51 49.21 49.85 50.60
3 50.59 52.00 51.02 49.24
4 51.01 49.72 49.66 50.40
Delta 1.50 2.79 1.36 1.36
Rank 2 1 3 4
Contribution % 23.56% 56.96 16.13 14.5

ISSN No: 2309-4893 International Journal of Advanced Engineering and Global Technology I Vol-05, Issue-01, January 2017
1437 www.ijaegt.com
Fig. 5 Main effects plot (data means) for the ultimate tensile stress.
Table 6 Analysis of the elongation (%) results.
Level groove angle C.E heat input Preheating
1 18.44 21.01 19.64 20.22
2 18.69 18.49 20.10 21.48
3 20.07 17.38 20.13 15.98
4 20.69 21.01 18.01 20.22
Delta 2.26 3.62 2.12 5.50
Rank 3 2 4 1
Contribution % 16.3 31.6 14.4 37.7
Fig. 6 Main effects plot (data means) for the elongation.

ISSN No: 2309-4893 International Journal of Advanced Engineering and Global Technology I Vol-05, Issue-01, January 2017
1438 www.ijaegt.com
Effect of SMAW parameters on average hardness
The data given in Fig.7 and Table 7 demonstrated that the C.E is the most significant
parameter affecting on the average hardness (87.5% contribution), followed by heat input (5%
contribution), and followed by preheating (4.3% contribution). However, the groove angle
(3.2% contribution) has no significant effect on the average hardness simply because the first
two factors overwhelm the effect of groove angle.
Table 7 Analysis of average hardness results.
Level groove angle C.E heat input Preheating
1 32.91 32.45 32.73 32.98
2 33.01 32.25 32.63 32.79
3 32.66 34.13 33.08 32.54
4 32.70 32.45 32.85 32.98
Delta 0.35 1.87 0.46 0.44
Rank 4 1 2 3
Contribution % 3.2 87.5 5 4.3
Fig. 7 Main effects plot (data means) for the hardness.
Mathematical modeling
The regression models are very promising for practical applications, such as estimating the
observed values and correlated parameters, although the parameters may not be as precise as
those produced by the Taguchi method. The models for the quality of SMAW were
developed to evaluate the relationship of welding process parameters to ultimate tensile
stress, elongation %, and average hardness. Through these models, any experimental results
of the measured response data with any combination of SMAW process parameters can be
estimated. The model has been employed on the basis of experimental results. Among several
models tested, the exponential model is found to be the best-fit model. If the quadratic model
is chosen, the second-order polynomial function that is the most accurate is given. The
quadratic model of [19] can be written as:
(5)
jii j
ij
k
i j
kXXX
iiX
i iy 2
110

ISSN No: 2309-4893 International Journal of Advanced Engineering and Global Technology I Vol-05, Issue-01, January 2017
1439 www.ijaegt.com
The coefficient ßo is the free term, the coefficients ßi are the linear terms, the coefficients ßij
are the interaction terms, and the coefficients ßii are the quadratic terms.
Where: Groove angle C.E, Heat input, preheating
Process multi-response optimization
A single response optimization algorithm provides a single optimal solution.
However, most of the multi- response problems, in principle, give rise to a set of optimal
solutions instead of a single optimal solution. In the present work, three responses have
been considered, i.e. ultimate tensile strength, elongation (%) and average hardness. For the
production purpose, the best combination of parameter level should produce the maximum
values of ultimate tensile strength, elongation (%) and average hardness. A single optimal
solution will not serve our purpose, as these objectives are conflicting in nature.
Derringer and Suich [20] described a multiple response method called desirability. It is an
attractive method for industry to optimize multiple quality characteristic problems. The
method makes the use of an objective function, D (X), called the desirability function
(utility transfer function) and transforms an estimated response into a scale free value (di)
called desirability. The desirable range was ranging from zero to one (least to most
desirable respectively).
In the present study, four parameters have been optimized simultaneously using developed
models, i.e. Eq. (5) based on composite desirability optimization technique. In response,
optimization, a measure of how the solution has satisfied the combined goals for all
responses, must be assured. Figure 8 represents the optimized graphs of the three responses
(Ultimate tensile stress, elongation %, and average hardness) and also the optimization
results. The vertical lines inside the cells represent current optimal parametric setting, and
the horizontal dotted lines represent the current response values. The value of composite
desirability 0.97042, the current optimal process parameters setting are groove angle of
100, C.E of 0.39, heat input of 30, and preheating of 25 ˚C.
Model validation
Once the optimal level of the process parameters is selected, the final step is to predict
and verify the improvement of the performance characteristic using the optimal level of the
input parameters. Experiments performed to carbon steel joint at the above optimal input
parametric setting for the response values. Table 8 shows the % error of experimental
Validation of the developed models for the responses with optimal parametric setting.
From the analysis of this table, it can be observed that the calculated error is small. The
smallest error % between experimental and predicted values is for ultimate tensile stress,

ISSN No: 2309-4893 International Journal of Advanced Engineering and Global Technology I Vol-05, Issue-01, January 2017
1440 www.ijaegt.com
elongation %, and average hardness lie within 2.1, 3.1, and 4 respectively. Obviously, this
confirms excellent reproducibility of the experimental conclusions.
Table (8) Experimental validations of the developed models with optimal parameters.
Responses Predicted Experimental Error%
UTS (MPa) 372.22 380 2.1
Elongation. % 12.62 13.02 3.1
Average hardness (Hv) 42.197 44 4
Fig. 8 Multi response optimization results.
Thermal Cycles
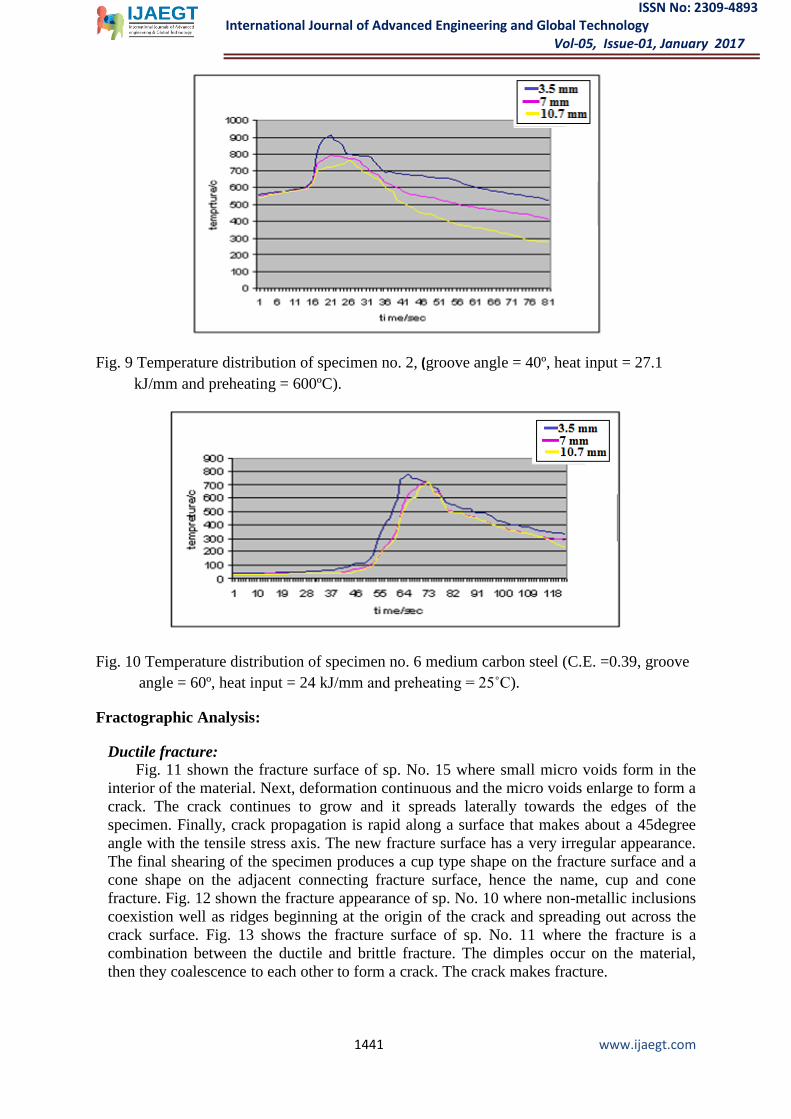
Fig.9 show the temperature distribution of sp. No. 2 (C.E = 0.39), an increase in temp. was
observed and a temp. of 900 °C was reached. Fig.10 show the temperature distribution of sp.
No. 6 (C.E = 0.39). A peak temperature of 780 ºC was recorded as compared with 900 ºC for
sp. No. 2. Such difference can be related to the rate of preheating.
ISSN No: 2309-4893 International Journal of Advanced Engineering and Global Technology I Vol-05, Issue-01, January 2017
1441 www.ijaegt.com
Fig. 9 Temperature distribution of specimen no. 2, (groove angle = 40º, heat input = 27.1
kJ/mm and preheating = 600ºC).
Fig. 10 Temperature distribution of specimen no. 6 medium carbon steel (C.E. =0.39, groove
angle = 60º, heat input = 24 kJ/mm and preheating = 25˚C).
Fractographic Analysis:
Ductile fracture:
Fig. 11 shown the fracture surface of sp. No. 15 where small micro voids form in the
interior of the material. Next, deformation continuous and the micro voids enlarge to form a
crack. The crack continues to grow and it spreads laterally towards the edges of the
specimen. Finally, crack propagation is rapid along a surface that makes about a 45degree
angle with the tensile stress axis. The new fracture surface has a very irregular appearance.
The final shearing of the specimen produces a cup type shape on the fracture surface and a
cone shape on the adjacent connecting fracture surface, hence the name, cup and cone
fracture. Fig. 12 shown the fracture appearance of sp. No. 10 where non-metallic inclusions
coexistion well as ridges beginning at the origin of the crack and spreading out across the
crack surface. Fig. 13 shows the fracture surface of sp. No. 11 where the fracture is a
combination between the ductile and brittle fracture. The dimples occur on the material,
then they coalescence to each other to form a crack. The crack makes fracture.

ISSN No: 2309-4893 International Journal of Advanced Engineering and Global Technology I Vol-05, Issue-01, January 2017
1442 www.ijaegt.com
Fig.11 Ductile fracture surface of sp.no. 15 with different magnifications, (groove angle
=100°, C.E. =0.43, heat input 27.1 KJ/MM and preheated 25°C).
Fig.12 The brittle fracture surface of sp.no. 10, (groove angle =80°, C.E. =0.39, heat input
32.5 KJ/MM and preheated 950 °C).

ISSN No: 2309-4893 International Journal of Advanced Engineering and Global Technology I Vol-05, Issue-01, January 2017
1443 www.ijaegt.com
Fig.13 The mixed mode fracture surface of sp.no. 11 (groove angle =80°, C.E. =0.43, heat
input 24.4 KJ/MM and preheated 600 °C).
Conclusions
In this study, the effect of experimental parameters namely groove angle, C.E, heat input, and
preheating on UTS, elongation and average hardness are investigated experimentally and
statistically Taguchi technique and ANOVA. Specific findings of this research include the
followings:
- The combined effect of both carbon equivalent and groove angle seems play an
important role in improving tensile strength while keeping ductility at relatively high
level.
- The right choice of groove angle and chemical composition of steel is a suitable tool
to obtain a weld with tough structure. In this regard annealing is effect to reduce the
hardening effect during and after welding via reducing crack susceptibility.
- The error between the experimental results at the optimum settings and the predicted
values for UTS, elongation%, and average hardness (Hv) lie within 2.1, 3.1, and 4%
respectively. Obviously, this confirms excellent reproducibility of the experimental
conclusions
References
1. Welding, Brazing and Soldering, THE ASM HANDBOOK. VOLUME 6 (1993).
2. N. Alagumurthi K. Palaniradja and V. Soundararajan, “Optimization of Grinding
Process Through Design of Experiment DOE; A Comparative Study”, Materials and
Manufacturing Process, Vol. 21 No 1 (2006) 19-21.
3. S. R. Patil and C. A. Waghmare, “Optimization of MIG Welding Parameters for
Improving Strength of Welded Joints”, International Journal of Advanced
Engineering Research and Studies. (2013) 14-16.
ISSN No: 2309-4893 International Journal of Advanced Engineering and Global Technology I Vol-05, Issue-01, January 2017
1444 www.ijaegt.com
4. Ajit Khatter, Pawan Kumar and Manish Kumar, “Optimization of Process Parameter
in TIG Welding Using Taguchi of Stainless Steel-304”,International Journal of
Research in Mechanical Engineering &Technology, (2014) 31- 36.
5. R.Sathish, B.Naveen, P.Nijanthan,K.ArunVasanthaGeethan and VaddiSeshagiri Rao,
“Weldability and Process Parameter Optimization of Dissimilar Pipe Joints Using
GTAW”, International Journal of Engineering Research and Applications (IJERA)
(2012) 2525-2530.
6. S.M.RavikumarandDr.P.Vijian, “Optimization of weld bead geometry in
ShieldedMetal Arc Welding using Taguchi Based Grey Relational Analysis”,
International Journal of Mechanical & Mechatronics Engineering Vol:14, (2014) 86-
91.
7. M. Satheesh and J. Edwin Raja Dhas,” Multi Objective Optimization of Flux Cored
Arc Weld Parameters Using Fuzzy Based Desirability Function”, IJST Transactions
of Mechanical Engineering, Vol. 37 (2013)175-187.
8. M. Satheesh and J. Edwin Raja Dhas, “Multi Objective Optimization of Weld
Parameters of Boiler Steel Using Fuzzy Based Desirability Function “, Journal of
Engineering Science and Technology Review 7 (1) (2014) 29–36.
9. S. P. Kondapalli, S. R. Chalamalasetti and N. R. Damera, “Application of Taguchi
based Design of Experiments to Fusion Arc Weld Processes”, International Journal of
Business Research and Development Vol. 4 No. 3, (2015) 1-8.
10. Mohan B. Raut and S. N. Shelke, “Optimization of Special Purpose Rotational MIG
Welding by Experimental and Taguchi Technique”, International Journal of
Innovative Technology and Exploring Engineering (IJITEE), (2014) 39-46.
11. Satyaduttsinh P. Chavda 1, JayeshV.Desai 2, TusharM.Patel,” A Review on
Optimization of MIG Welding Parameters using Taguchi’s DOE Method”,
International Journal of Engineering and Management Research (2014) 16-21.
12. Joydeeproy, Arindammajumder, J. D. Barma and S. C. Saha,” An Approach for
Solving Multi Characteristics Optimization of Submerged Arc Welding Process
Parameters by using Gray Based Genetic Algorithm”, Journal of Scientific &
Industrial Research, (2013) 340-347.
13. Imran A. Shaikh and M. Veerabhadra Rao, “A Review on Optimizing Process
Parameters forTIG Welding using Taguchi Method & Grey Relational Analysis”,
International Journal of Science and Research (IJSR), (2015) 2449-2452.
14. AnkushBatta, J.K Aggarwal,VarinderKhurana and Amarjeet Singh Sandhu,”
Optimization of Submerged Arc Welding Process: A Review”, Journal of Mechanical
and Civil Engineering, (2015) 39-44.
15. Dearden J and OO'Neill H 'A guide to the selection and welding of low alloy
structural steel' Transactions of the Institute of Welding, Vol.3, 1940, pp203-214
16. Antony J, Antony JF. “Teaching the Taguchi method to industrial engineers”. Work
Study 2001; 50(4):141–9.
17. Taguchi G “Introduction to quality engineering. Asian Productivity Organization”,
Tokyo, (1990) .
18. Ross PJ “Taguchi technique for quality engineering”, 2nd Edition. McGraw-Hill,
New York. (1989),
19. Montgomery D.C, “Design and analysis of experiments”, Wiley, New York, (2001).
20. Derringer G and Suich R (1980), “Simultaneous optimization of several response
variables”, J. Quality Techan.; 12: 214-219.