
Analysis and Measurement s r m n High Frequency Solid ... .S. ..-. * -. f AFRPL TR-86-010 AD:...
46
*=~ 4 S. . . . .-. * -. . . f AFRPL TR-86-010 AD: Interim Report Analysis and Measurement of for the periodMe s r m n 20 Sept 1982 to High Frequency Solid Propellant 30 October1 985 Responses July 1986 Author: Pennsylvania State University M. M. Micci Department of Aerospace Engineering 233 Hammond Building University Park, PA 16802 rN F04611-82-X-0063 46 Approved for Public Release Distribution Is unlimited. The AFRPL Technical Services Office has reviewed this report, and it is releasable to the National Technical Information Service, where it will be available to the general public, including foreign nationals. 0-i ELECTE C. _ SEP 2 3 1986 prepared for the: Air Force Rocket Propulsi n r..2 Laboratory 3Air Force Space Technology Center Space Division, Air Force Systems Command Edwards Air Force Base, California 93523-5000 86 9 27' 058 % %.VV - ~ ," ,!;
-
Upload
nguyenduong -
Category
Documents
-
view
213 -
download
0
Transcript of Analysis and Measurement s r m n High Frequency Solid ... .S. ..-. * -. f AFRPL TR-86-010 AD:...
*=~4
S. .. . .-. * -. . . f
AFRPL TR-86-010 AD:
Interim Report Analysis and Measurement offor the periodMe s r m n20 Sept 1982 to High Frequency Solid Propellant30 October1 985 Responses
July 1986 Author: Pennsylvania State UniversityM. M. Micci Department of Aerospace Engineering
233 Hammond BuildingUniversity Park, PA 16802
rN F04611-82-X-0063
46
Approved for Public Release
Distribution Is unlimited. The AFRPL Technical Services Office has reviewed this report, and it isreleasable to the National Technical Information Service, where it will be available to the generalpublic, including foreign nationals.
0-i ELECTE
C. _ SEP 2 3 1986
prepared for the: Air ForceRocket Propulsi n
r..2 Laboratory3Air Force Space Technology Center
Space Division, Air Force Systems CommandEdwards Air Force Base,California 93523-5000
86 9 27' 058% %.VV -~ ," ,!;
NOTICE
When U.S. Government drawings, specifications, or other data are used forany purpose other than a definitely related government procurement operation,the government thereby incurs no responsibility nor any obligation whatsoever,and the fact that the government may have formulated, furnished, or in any waysupplied the said drawings, specifications, or other data, is not to beregarded by implication or otherwise, or conveying any rights or permission tomanufacture, use, or sell any patented invention that may in any way berelated thereto.
FOREWORD
This interim report was submitted by the Pennsylvania State University,University Park, Pa, under Contract F04611-82-K-0063 with the Air Force RocketPropulsion Laboratory (AFRPL). The report includes all work performed from 20September 1982 to 30 October 1985. Principal Investigator was Michael M.Micci. AFRPL Project Manager was Mr Gary L. Vogt.
This technical report has been reviewed and is approved for publicationand distribution in 4ccordance with the distrib on -statement on the coverand on the DD Form 1473.
Ject Man, Chief, AerothermochdmistryBranch
FOR THE DIRECTOR
ROBERT L. GEISLER
Deputy Chief, Propulsion Analysis Division
r
S.
- ~ ~ . .~' -
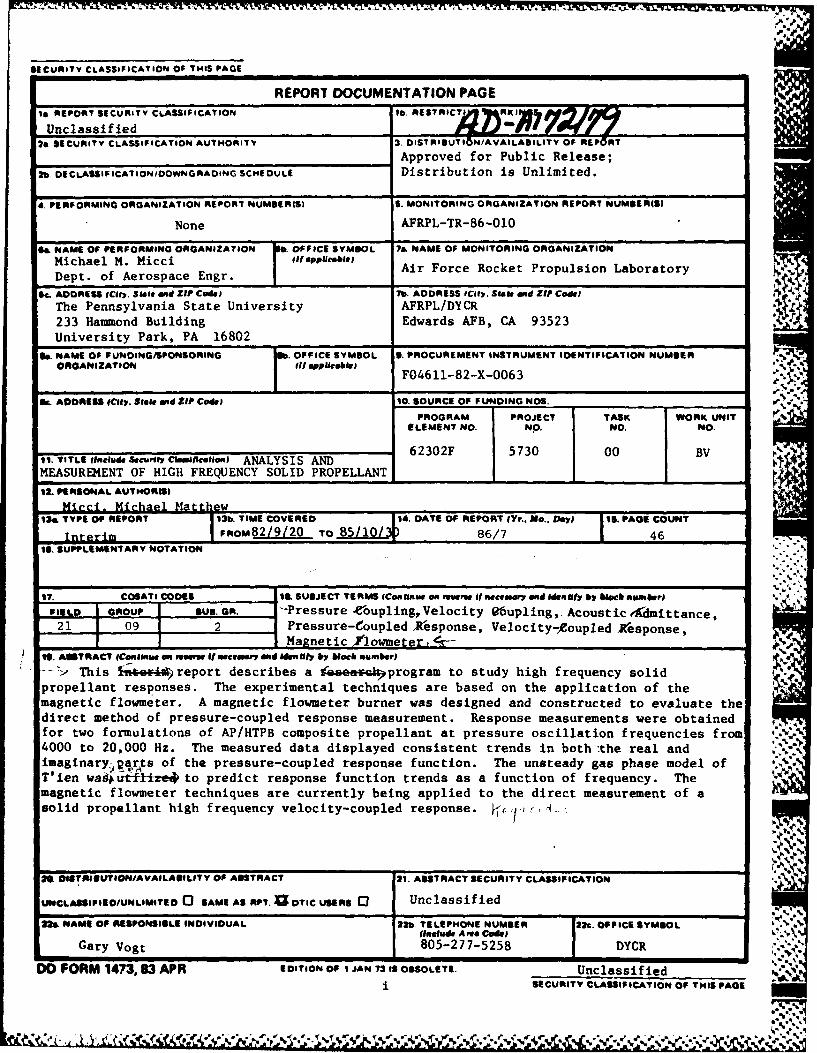
SECURITY CLASSIFICATION Of THIS PAGE
REPORT DOCUMENTATION PAGEIII REPORT SECURI11TY CLASSIFICATION Ib. RES7RICTf~~ 111144?/~ IUnclassif ied ;W1 N~Y
2. SECURITY CLASSIFICATION AUTHORITY 2. DISIRISUTI8NAILASLTOFRP__________________________________Approved for Public Release;
2b. DECLASSIFICATtONOOWNGRAOING SCHEDULE Distribution is Unlimited.
4. PERFORMING ORGANIZATION REPORT NUMBERIS) S. MONITORING ORGANIZATION REPORT NUMBER(S)
None AFRPL-TR-86 -010
Ge. NAME Of PERFORMING ORGANIZATION b. OFFICE SYMBOL la& NAME OF MONITORING ORGANIZATIONMichael M. Micci Air Fore ockt roulsonLabraorDept. of Aerospace Engr. IArFreRce rplinLbrtr
64L ADDRESS ICilY. Stot end ZIP Cod@) 7b. ADDRIESS 1170Y. Slott and ZIP Cod&)The Pennsylvania State University AFRPL/DYCR233 Hammond Building Edwards AFB, CA 93523University Park, PA 16802
U NAME OF FUNOING/SPONSORING 9Sb. OFFICE SYMBOL 9. PROCUREMENT INSTRUMENT IDENTIFICATION NUMBER4ORGANIZATION it opPlicUSU)
__________________________ JF04611-82-X-0063U.. ADDRESS IC0ly. State ond ZIP Code) 10. SOURCE OF FUNDING NOS.%
PROGRAM PROJECT TASK WORK UNITELEMENT NO. NO. No. NO.
11. TITLE fOmeled SeCi.'fty Cbitulltico,J ANALYSIS AND620F5300B
MEASUREM4ENT OF HIGH FREQUENCY SOLID PROPELLANT.12. PERSONAL AUTHORISI
Micci. Michael Matthew13&. TYPE OF REPORT 13b. TIME COVERED 14. DATE OF REPORT ( Yr.. Mo.. Day) T5 _PAGE COUNT
ItrmIFR1OMtV2/92 TO 85 1/3 86/7 4616. SUPPLEMEAN'TARY NOTATION
17. COSATI CODIES It. SUBJECT TERMS (Continue onl revers if necewinl and kdinity, by Muoch number) .
FIELD GROUP BUD. on. -Pressure .Coupling,Velocity etlupling,. Acoustic 4~dmittance,21 09 I 2 IPressure-45oupled ,Response, Velocity-,eoupled Xesponse,
In I Magnetic Y'lowmneter,,1;-IS9. ABSTRACT (Continue on .warv Of meinary And Mcnity by block number)
'This 1*e*4report describes a A -_ '-~program to study high frequency solidpropellant responses. The experimental techniques are based on the application of themagnetic flowmeter. A magnetic flowmeter burner was designed and constructed to evaluate thedirect method of pressure-coupled response measurement. Response measurements were obtainedfor two formulations of AP/HTPB composite propellant at pressure oscillation frequencies from *.~4000 to 20,000 Hz. The measured data displayed consistent trends in both-the real andimaginary,)Rrts of the pressure-coupled response function. The unsteady gas phase model ofT'ien wagitrft~e# to predict response function trends as a function of frequency. Themagnetic flowmeter techniques are currently being applied to the direct measurement of asolid propellant high frequency velocity-coupled response. H
Se DISTRIOUTION/A VAILADI LIT Y OF ASTRACT 21. ASSTRACT SECURITY CLASSIFICATION
UNCLASSIFIBD/UNLIMITEO 0 SAME1 AS PIP?. UOTIC USERS 0 Unclassified
r&NAME OF RESPONSIBLE INDIVIDUAL 22b. TELEPHONE NUMBER 22c. OFFICE SYMBOL
Gary Vogt8027-58DC
DO FORM 1473,83 APR EDITION OF I JAN 73 IS OBSOLETE. Unlsiied Ii SECURITY CLASSIFICATION OF THIS PAE
%::~

SECURITrY CLASSIFICATION OF THIS PAGE
11. (cont.) RESPONSES (U)
SECURITY CLASSIFICATION OF THIS PAGE
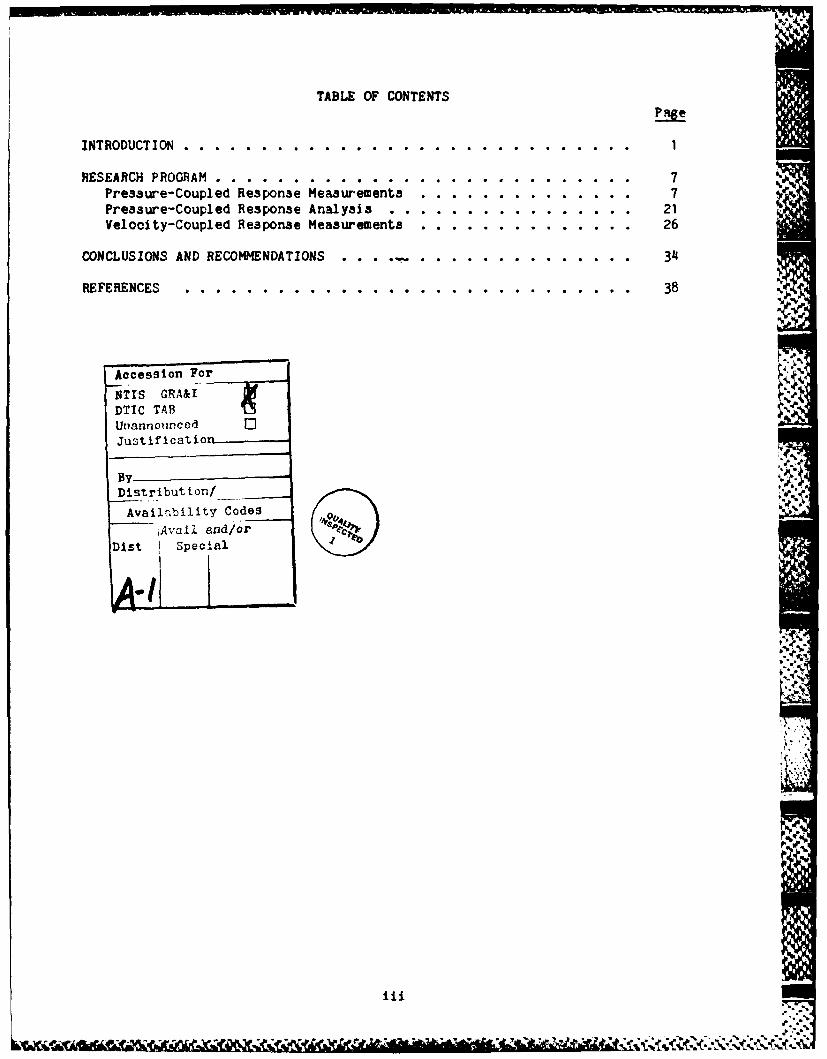
TABLE OF CONTENTS
P ~ge
INTRODUCTION .............................. 1
RESEARCH PROGRAM ...... ...... ........................... 7 _Pressure-Coupled Response Measurements ....... .............. 7Pressure-Coupled Response Analysis .... ................ .... 21Velocity-Coupled Response Measurements .... .............. ... 26
CONCLUSIONS AND RECOMMENDATIONS . . . ...... ............ 3
REFERENCES ..... ...... ............................. .... 38
Accession For
NTIS GRA&IDTIC TABUnannon ced 0justification
ByDistribution/ _
Avail7bility Codes
Dist Special
iii
LIST OF FIGURES
f r Lae
Fig. I Principle of operation of a magnetic flowmeter. Inducedelectric field is proportional to both flow velocity andmagnetic field strength .................................... 5
Fig. 2 Isometric view of magnetic flowmeter burner assembly showingpropellant burni ng past pressure and veloci ty measurementstation .................................................... 8
Fig. 3 Data acquisition flowchart ................................. 10
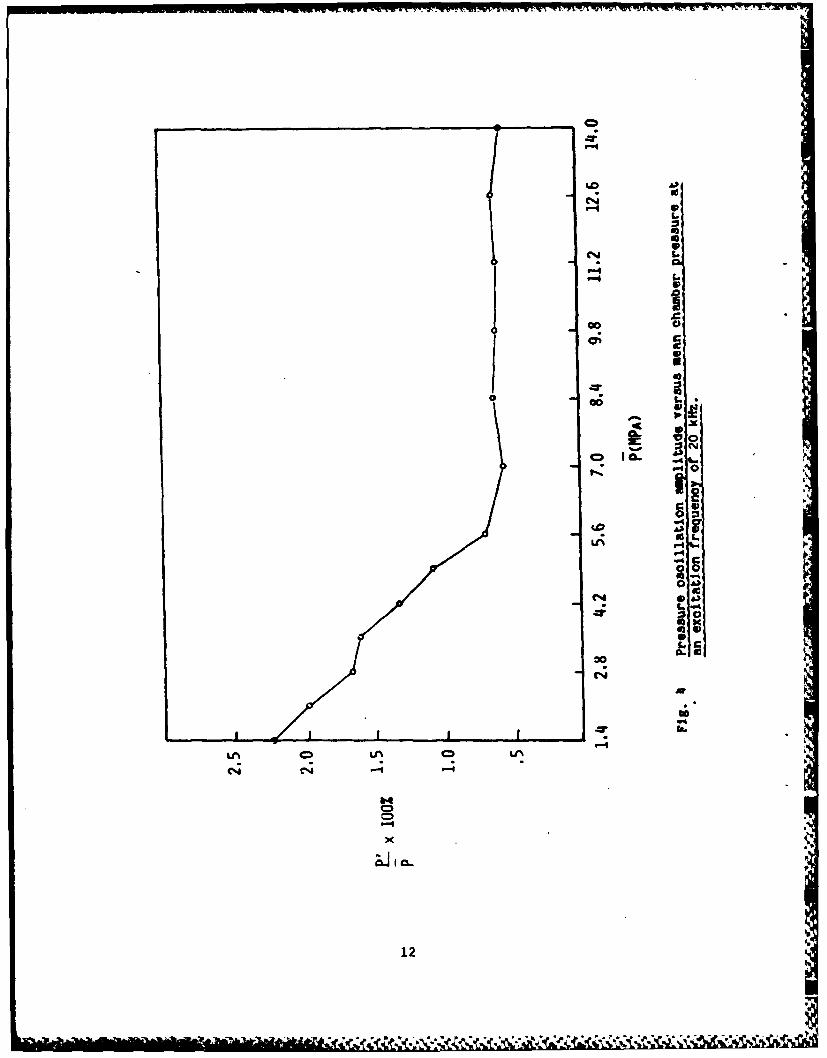
Fig. 4 Pressure oscillation amplitude versus mean chamber pressure atan excitation fr'equency of 20 kHz .......................... 12
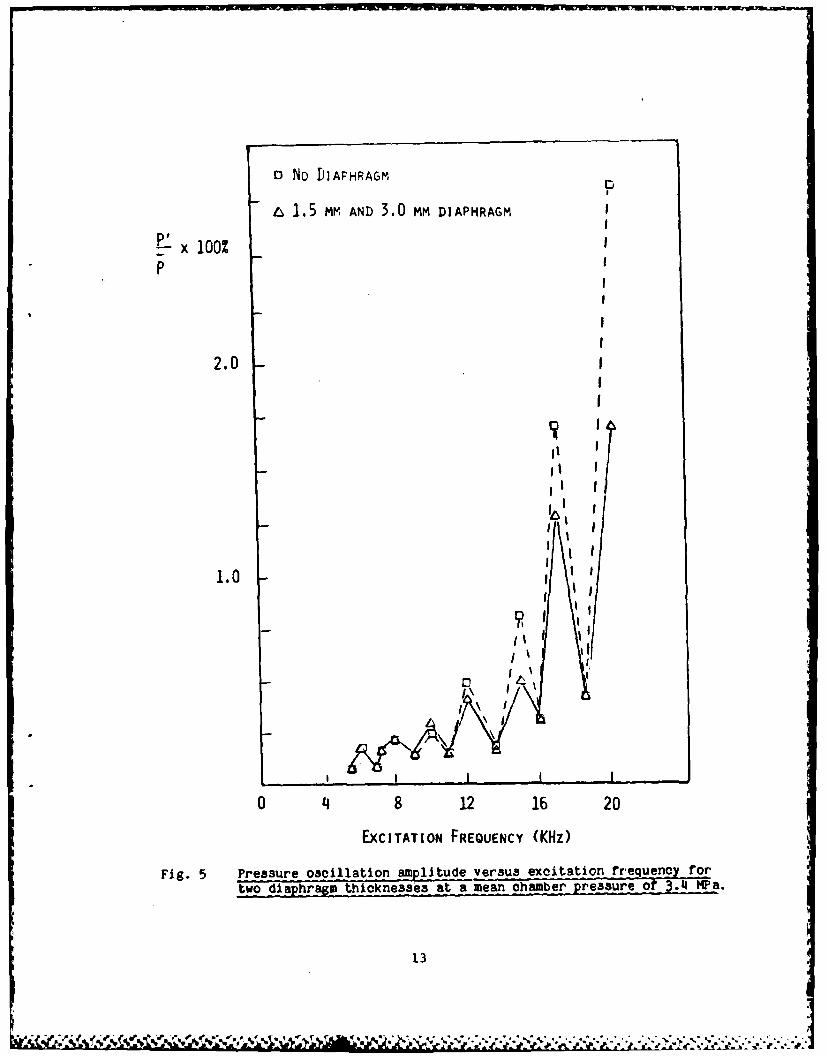
Fig. 5 Pressure oscillation amplitude versus excitation frequency fortwo dj aphragm thicknesses at a mean chamber pressure of3.4 MPa .................................................... 13
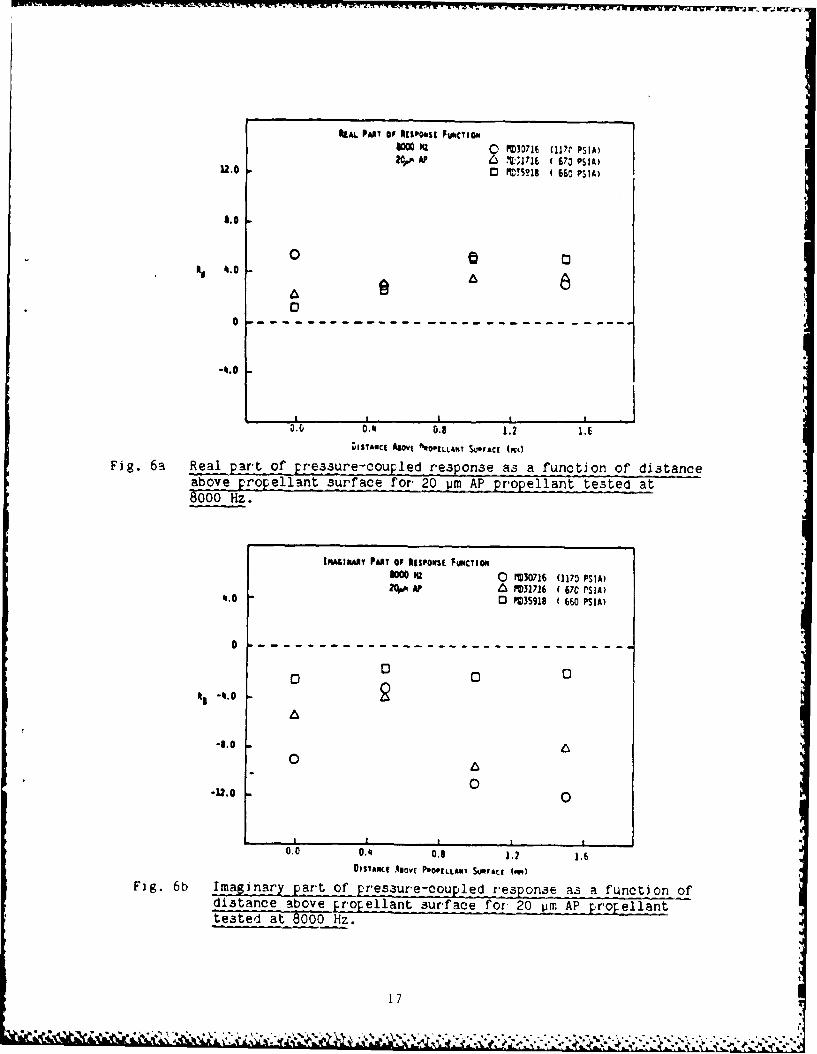
Fig. 6a Real part of pressure-coupled response as a function of distanceabove propellant surface for 20 um AP propellant tested at8000 Hz .................................................... 17
Fig. 6b Imaginary part of preasure-ooupled response as a function ofdistance above propellant surface for 20 om AP propellanttested at 8000 Hz .......................................... 17
Fig. 7a Real part of pressure-coupled response as a function ofdistance above propellant surface for 200 um AP propellanttested at 4000 Hz .......................................... 18
Fig. 7b Imaginary part of pressure-coupled response as a function ofdistance above propellant surface for 200 jim AP propellanttested at 4000 Hz ........................................... 18
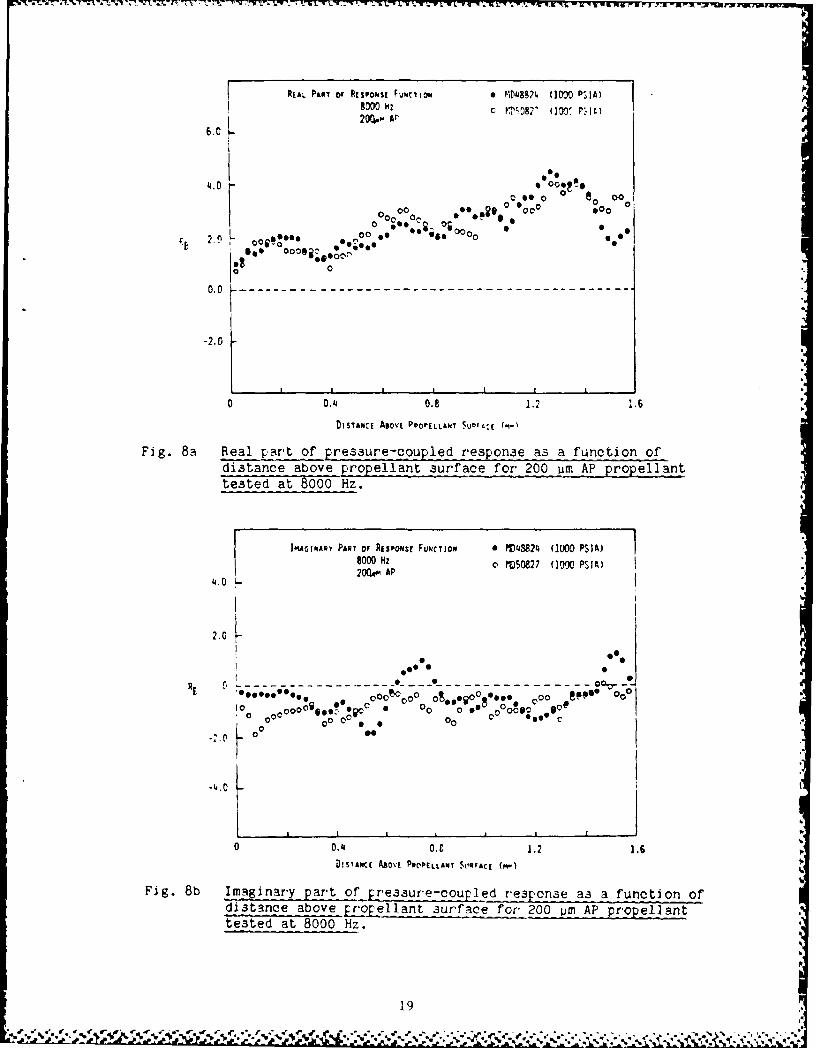
Fig. 8a Real part of pressure-coupled response as a function ofdistance above propellant surface for' 200 jim AP propel]anttested at 8000 Hz ........................................... 19
Fig. 8b Imaginary part of pressure-coupled response as a function ofdistance above propellant surface for 200 um AP propellanttested at 8000 Hz ........................................... 19
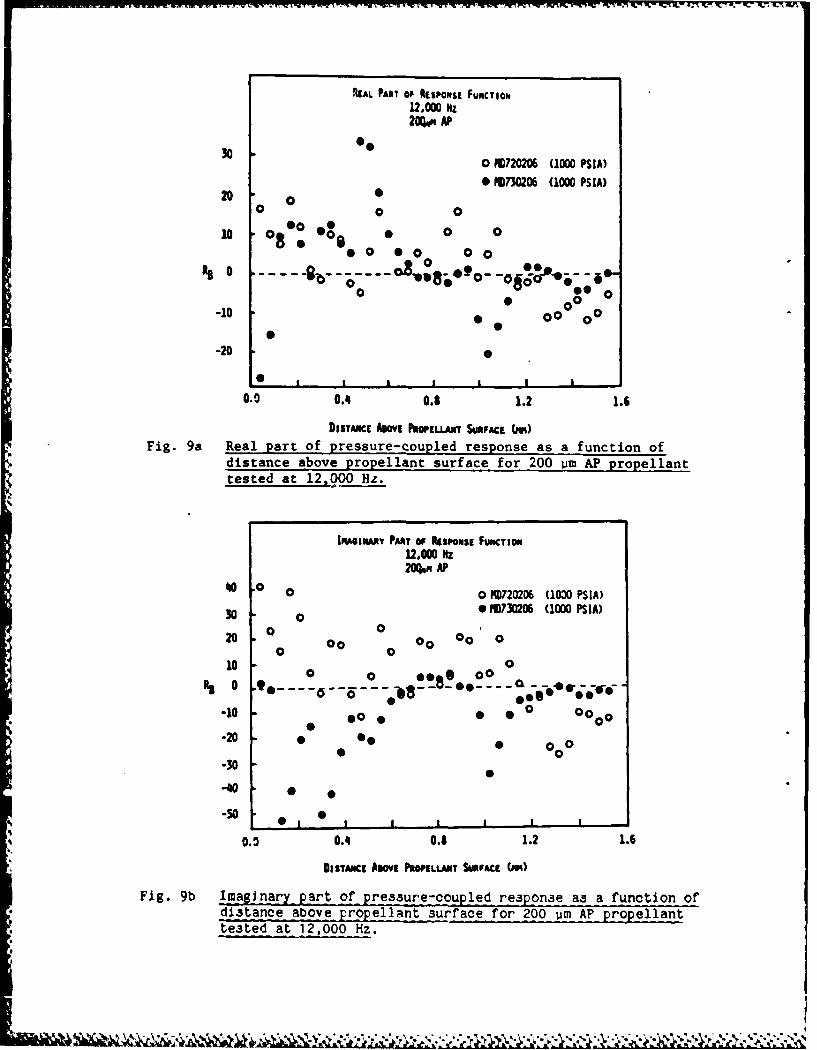
Fig. 9a Real part of pressure-coupled response as a function ofdistance above pr'opellant surface for 200 um AP propellanttested at 12,000 Hz ......................................... 20
Fig. 9b Imagin.ry part of pressure-coupled response as a function ofdistance above propellant surface for' 200 um AP pr'opellanttested at 12,000 Hz ......................................... 20
iv
' v Vf W ', , -' - ,L L $~,-.~..;Lm. "f u ak m -~l
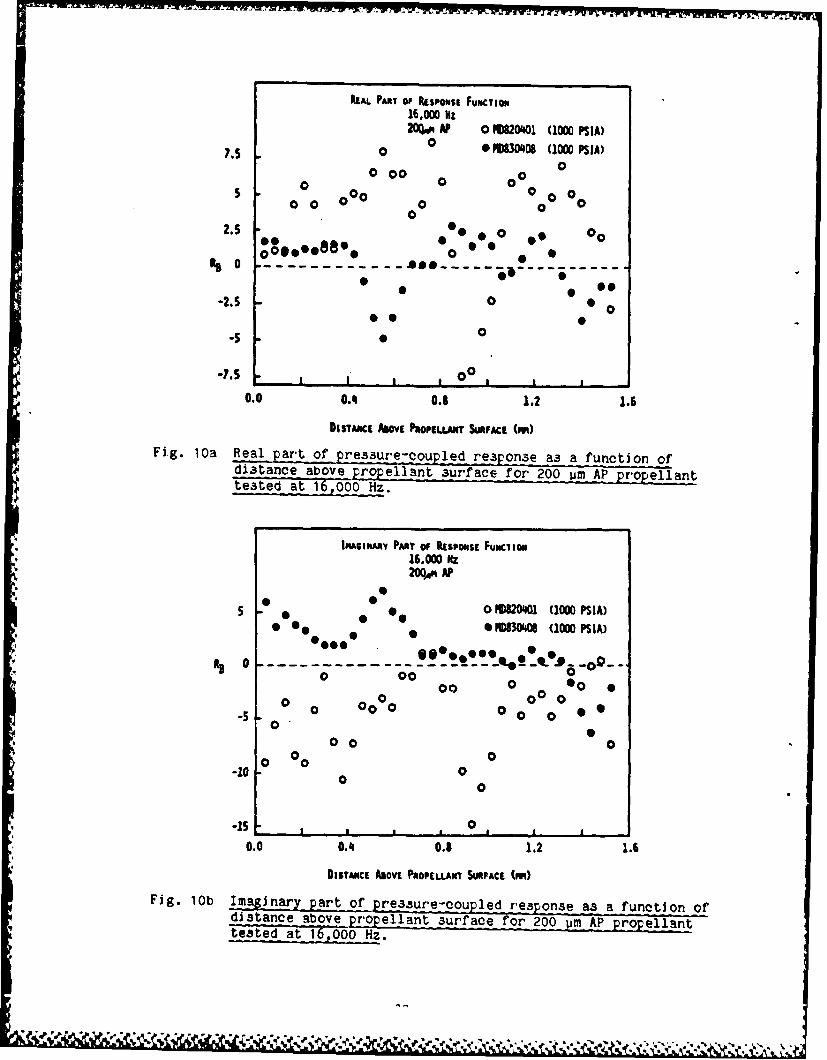
Fig. 10a Real part of pressure-coupled response as a function ofdistance above propellant surface for 200 urm AP propellanttested at 16,000 Hz .......................... ............... 22
Fig. lob Imaginary part of pressure-coupled response as a function ofdistance above propellant surface for 200 um AP propellanttested at 16,000 Hz ......................................... 22
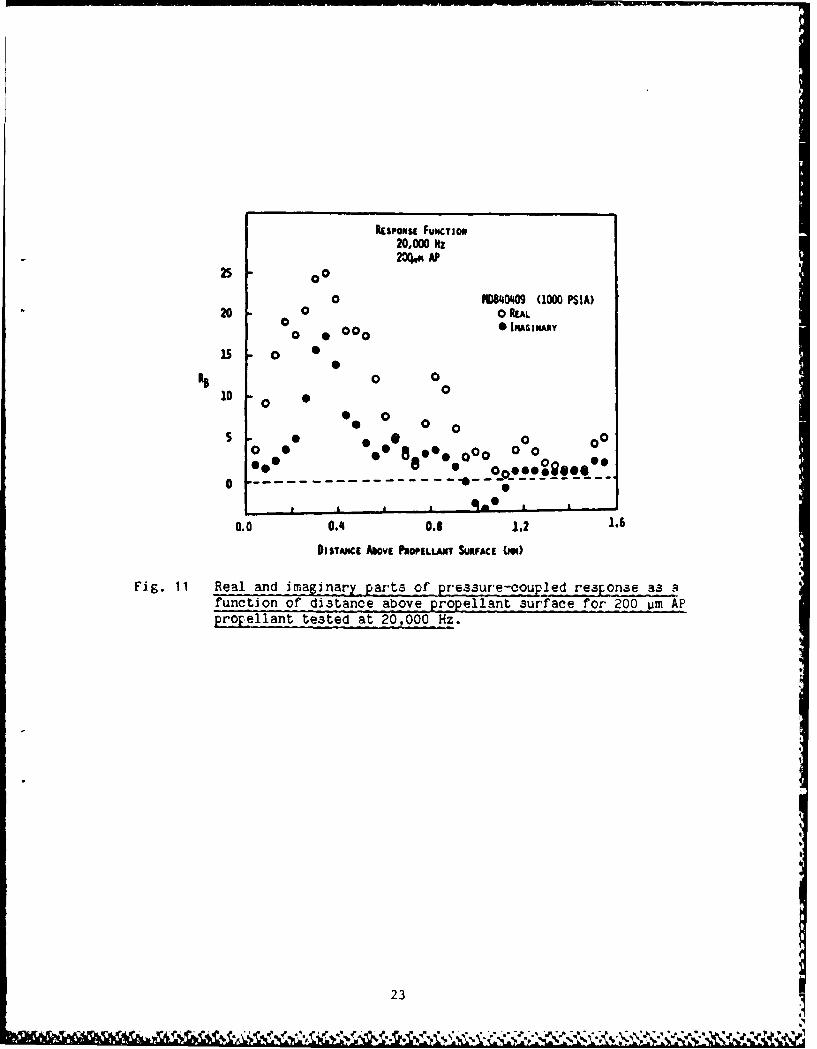
Fig. 11 Real and imaginary parts of pressur-e-coupled response as afunction of distance above propellant surface for 200 pm APpropellant tested at 20,000 Hz ............................. 23
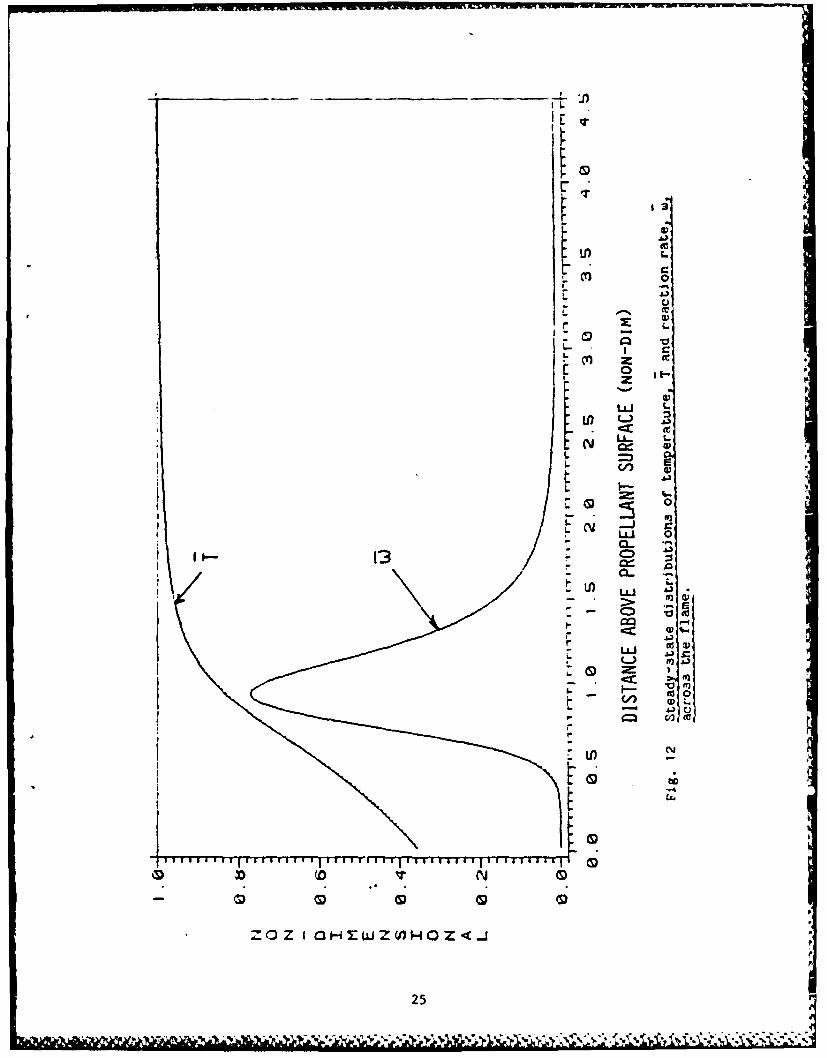
Fig. 12 Steady-state distributions of temperature, T and reactionrate, Z, across the flame .................................. 25
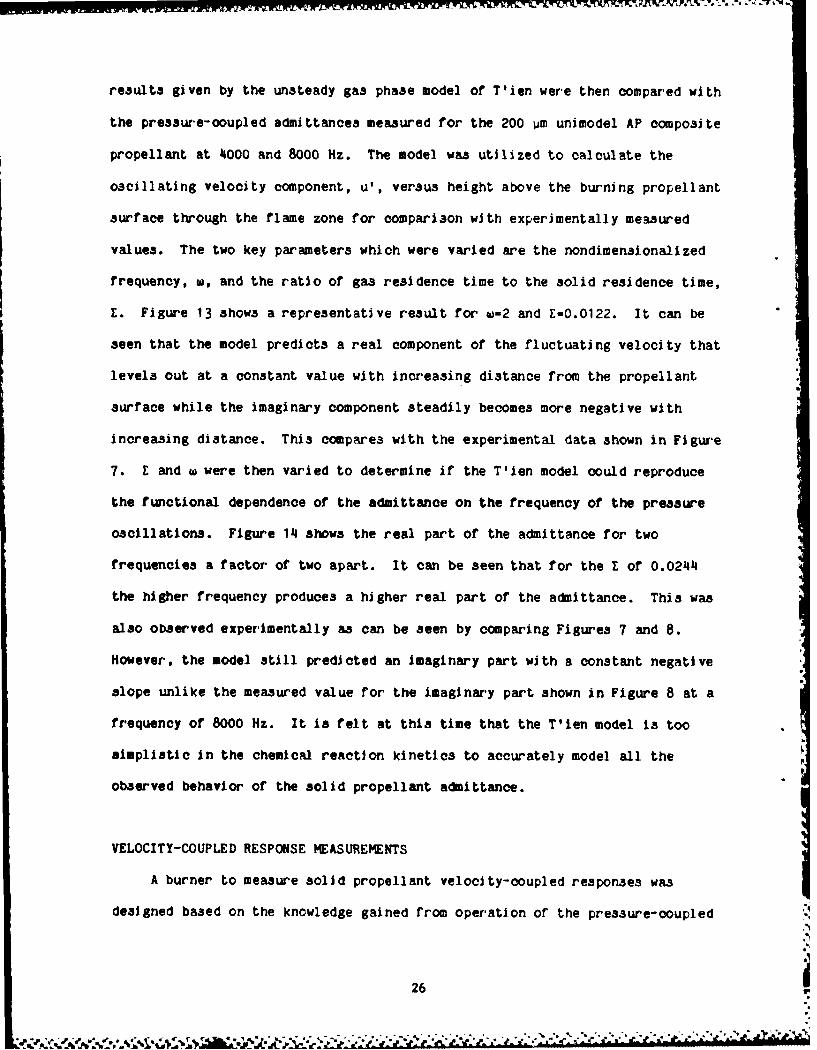
Fig. 13 Real and imaginary parts of the admittance as a function ofnondimensional distance above the burning propellant surface(E= 0.012, w - 2) .......................................... 27 .W.
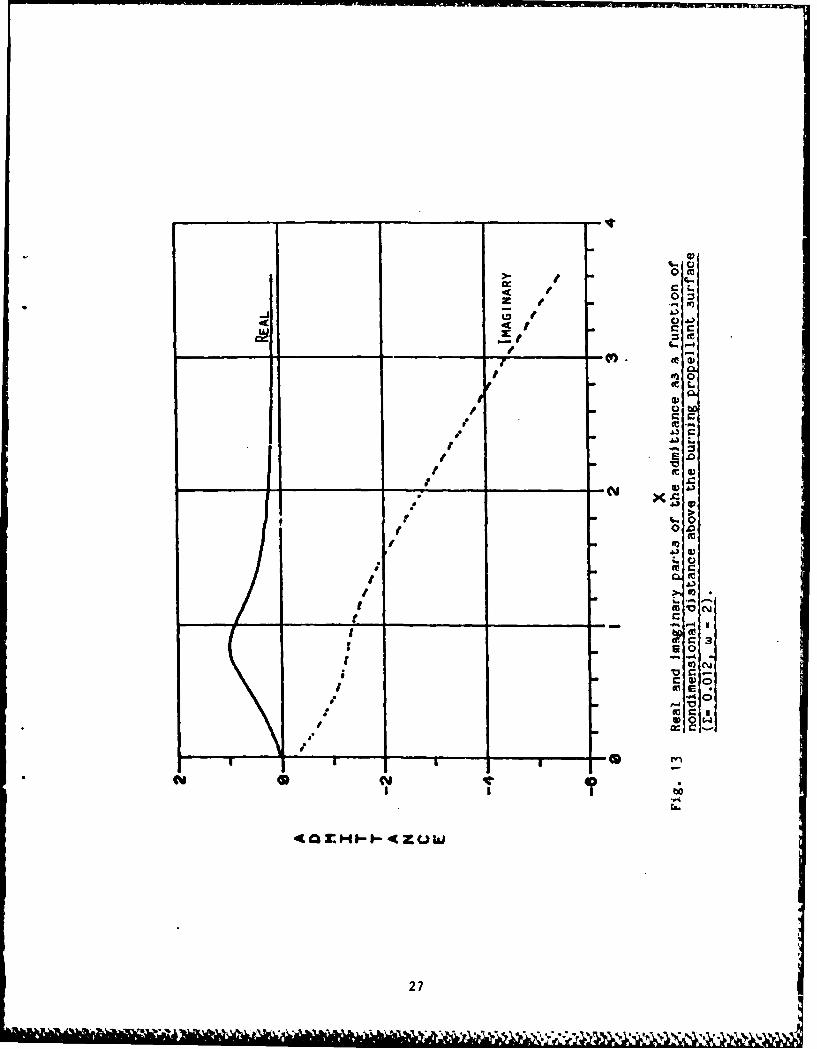
Fig. 14 Real part of the admittance as a function of nondimensjonaldistance above the burning surface for two values of thefrequency, w ............................................... 28
Fig. 15 Slab propellant geometry and orientation of electrodes andmagnetic field for the simultaneous measurement of theoscillatory cross-flow velocity, V' and the oscillatoryvelocity of the gas leaving the propellant surface, Ub'.... 30
Fig. 16 Velocity-coupled magnetic flowmeter burner used to makesimultaneous measurement of oscillatory cross-flow velocity,V', and oscillatory velocity of gas normal to propellantsurface, Ub'. Components: A-burner assembly, B-permanentmagnet, C-cutaway view of propellant slabs and velocityelectrodes, D-rotating toothed gear........................ 31
Fig. 17 Velocity-Coupled MagnetJc Flowmeter Burner................... 32
.. *. ,*
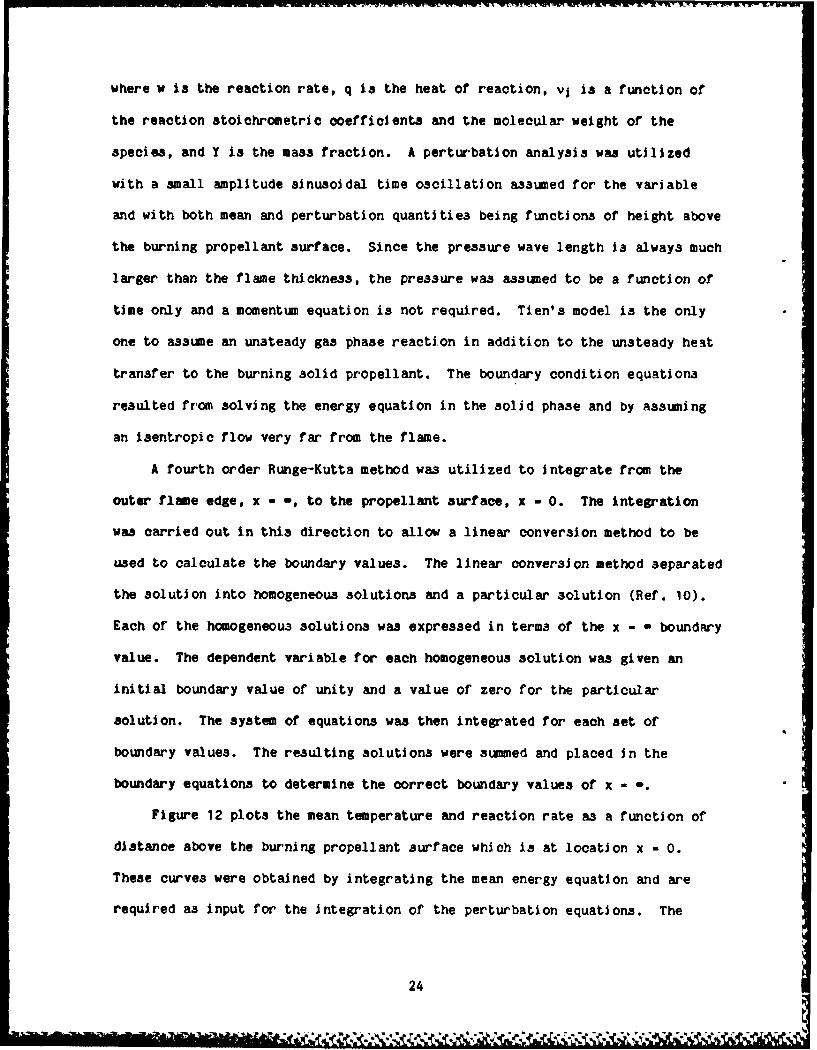
INTRODUCTION
A quantitative knowledge of solid propellant response functions, both
pr-essure-couFled and veloci ty-coup] ed, is a critical input parameter' for,
rocket motor, stability analyses. There have been several experimental
techniques developed to measure propellant pressure-coupled response functions
(Refs. 1 & 2). The most widely accepted method for propellant response
measurement is the T-burner method. The T-burner has solid propellant placed
at the opposing endfaces of a center-vented tube. Pressure oscillations
develop between the two propellant surfaces at the fundamental longitudinal
frequency of the tube. Pressure-coupled response data is derived by comparing
the measured rate of growth and decay of the pressure oscillations. The
T-burner is limited to one pressure oscillation frequency for each chamber,
geometry. A complete investigation over a large range of frequencies requires Vmany different tube lengths. Other methods of measuring the propellant
pressure-coupled response incorporate externally driven pressure oscillations
in order to examine an entire frequency range with a single burner geometry.
One such method utilizes the rotating valve burner. This burner produces N
pressure oscillations by using a rotating valve to periodically modulate the
exit area of the exhaust nozzle. The pressure oscillations within the chamber
are a function of the propellant response function and the gas dynamics of the
combustion chamber. The magnitude of the pressure oscillations within the
combustion chamber is recorded along with the phase angle difference between
the pressure and exit area oscillations. The chamber gas dynamics are
predicted by an analytical model allowing the solution of the remaining
unknown, i.e., the propellant pressure-coupled response.
Another externally driven system employs a traditional acoustic
measurement device, the impedance tube. Impedance tube burners use acoustic -.
*+w,, .,,." l -tj. . :..'.... ., ,,+. ... ,, • -. ' ++ * .* . "** :* .
drives to generate a standing wave in a combustion tube. The structure of the
standing wave Js measured by pressure transducers mounted at various points
along the length of the impedance tube. The equation that describes the
standing wave is derived from the conservation equations applied within the
impedance tube and is a function of the propellant admittance. The admittance
is deduced by incorporating the pressure measurements into the wave equation.
All of the aforementioned methods result in an indirect measurement of
the propellant response function. The pressure-coupled response is derived
from a combustion analysis in conjunction with oscillatory pressure
measurements. The indirect measurements are only as accurate as the analyse.3
on which they are based. A direct measurement of propellant pressure-coupled
response does not require analytical modeling to produce r'esults. One
technique utilizing direct measurement is the microwave burner method. Thi~s
method measures the transient burning rate of solid rocket propellants by
reflecting a microwave signal from the burning propellant surface. The
oscillatory burning rate can produce the pressure-coupled response when
combined with the simultaneous oscillatory pressure measurement. A major
drawback to all of the experimental techni ques is that they are unable to
produce accurate response function measurements at high frequencies (>10 kHz).
The problem of high frequency combustion instability has previously been
3verted by the use of metallic powders which provide excellent high frequency
damping. However-, in the move toward smokeless propellants, it has become
necessary to remove the metal particulates and the problem of propellant
response at high frequencies has reappeared.
A magnetic flowmeter is theoretically capable of obtaining a direct
measurement of the gas velocity above a burning solid propellant surface with
3 frequency response greater, than 20 kHz. The operation of a magnetic flow
2
meter is based on the principle first discovered by Faraday in which a
conducting gas (or any medium) moving through a magnetic field will generate
an electrical potential which is normal to both the magnetic field and the
flow velocity. The potential which can be measured as a voltage will be
proportional to the magnitude of the flow velocity and to the magnetic field
strength. The measurement of the oscillatory gas velocity above a burning
solid propellant surface subjected to pressure oscillations constitutes a
direct measurement of the propellant pressure-coupled admittance and is the
basis of the experimental portion of this program.
The admittance function is defined as the nondimensional ratio of the
combustion gas velocity to the oscillatory pressure,
UI/aAb = b- (1)b
p'/p
where primes denote fluctuating quantities and super-script bars denote a mean
quantity. The oscillatory velocity, Ub', is nondimensionalized by the sonic
velocity within the combustion chamber, a. The presaure-coupled response is
the nondimensional ratio of the mass flow oscillation to the oscillatory
pressure.
M,/MRb = - (2)
P'/P
The response and admittance functions are related by the equation,
Ab + Mb = Y Mb Rb (3)
Where Mb is the Mach number of the product gases as they leave the propellant
surface and Y is the ratio of specific hets. A mgnetic flowmeter is c3pable
3
of directly measuring the oscillatory velocity, Ub', which in conjunction with
the oscillatory pressure, p', simultaneously measured by a pressure transducer
produces the direct measurement of the propellant admittance.
The magnetic fiowmeter operates according to Faraday's law which states
that an electromotive force, emf, induced in a conductor moving relative to a
magnetic field is proportional to the rate at which the magnetic field lines
are being passed (Ref. 3). The average emf is defined in equation form as:
emf - -At
where A is the change of magnetic flux relative to the moving conductor in a
time interval At. In the case of a flowmeter, the moving conductor is either
a gas or a liquid and the change of magnetic flux is
S= BLUAt (5)
where B is the magnetic flux density (Telsa), U is the flow velocity (m/s),
and L is the distance (m) the emf is being measured across. Therefore, the
induced emf expressed in volts becomes
V = UBL (6)
A calibrating constant is required to account for losses due to nonuniform
magnetic fields and other inherent loss mechanisms encountered in the actual
application of the magnetic flowmeter.
V - aUL (7)
The calibration factor, a, is nondimensional and can be determined either
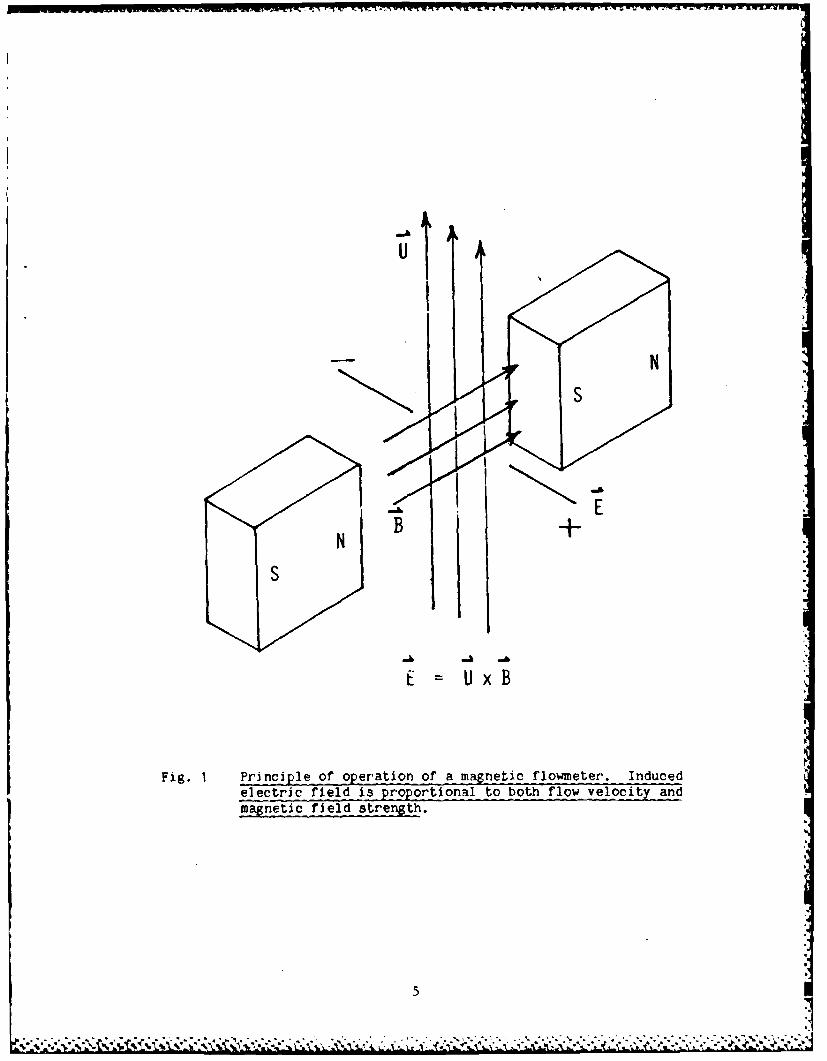
theoretically or experimentally. The operating principle of the magnetic
flowmeter is presented schematically in Figure 1. Although Equation 7 shows
that the potential is independent of flow conductivity, there exist
conductivity limits for which the equation holds true. A highly ionized flow
could allow magnetohydrodynamic forces to distort the velocity profile. The
4
,.% %
Nh N
Fig. 1 Principle of' o eration of' a magnetic flowmeter. Induced
5
lower limit for conductivity is approximately 1o-3 mhos/m, below which the
resistance of the conductor becomes as large as the voltage measuring device.
Experimental measurements of conductivity in the product gases of solid
propellants have been documented for various propellant formulations (Refs. 4
and 5). All of the formulations displayed conductivity levels exceeding the
magnetic flowmeter lower limit of 1o- 3 mhos/m.
Both the mean and unsteady interior gas velocities of solid propellant
rocket motors were measured by Micci and Caveny (Refs. 6 and 7) using a
magnetic flowmeter. The magnetic flowmeter produced well-defined velocity
measurements for an AP/HTPB composite propellant in a subscale rocket motor.
Longitudinal acoustic waves were generated in the rocket motor by the
modulation of the exhaust nozzle area. The oscillatory velocity data
permitted the deduction of the propellant pressure-coupled response from a
linear analysis of the wave structure. Holme (Ref. 8) investigated the
possibility of using magnetic velocimetry for in-flight measurement of rocket
exhaust velocity. The magnetic flowmeter technique was tested in this study
for several liquid pr'opellant combinations using an alternating magnetic field
to eliminate the d.c. effects of chemical polarization.
6
a'r% . % % %. ..

RESEARCH PROGRAM
PRESSURE COUPLED RESPONSE MEASUREMENTS
The magnetic flowmeter assembly Js schematically depicted in Figure 2.
This figure presents the major components necessary to measure surface
admittances. Pressure oscillations are produced by the pressure modulation
system (A) which is located at the converging nozzle orifice. The pressure
oscillations and the oscillatory velocity are simultaneously measured as the
propellant strand burns by the measurement station shown in the cut-away
section (B). The large external magnet (C) provides a large d.c. magnetic
field for the velocity measurement obtained by the voltage electrodes at the
measurement station. The combustion chamber (D) was designed to consume small
amounts of propellant (4.0 cm3) for each run. The propellant samples were
formed into cylindrical strands with a diameter of 1.2 cm and a length of 3.5
cm. The small propellant requirement makes the burner very economical to
investigate a wide variety of propellants.
Although commercial magnetic flowmetera use an alternating field in order
to separate the flowmeter potential from chemical polarization potentials, a
permanent magnet was chosen for the magnetic flowmeter burner. A permanent
magnet is well suited for the measurement of an alternating velocity field
because any polarization effects (which are low frequency) can be filtered out.
The use of a permanent magnet also reduced the complexity of the burner by not
requiring additional circuitry to produce a magnetic field. The magnet was an
ALNICO 5 permanent magnet which created a magnetic field with a gap density of
approximately 2100 gauss. The burner was constructed out of 304 stainless
steel which permits the magnetic field to pass through with very little
distortion.
The sonic nozzle orifice was modulated by a small toothed gear mounted on
7
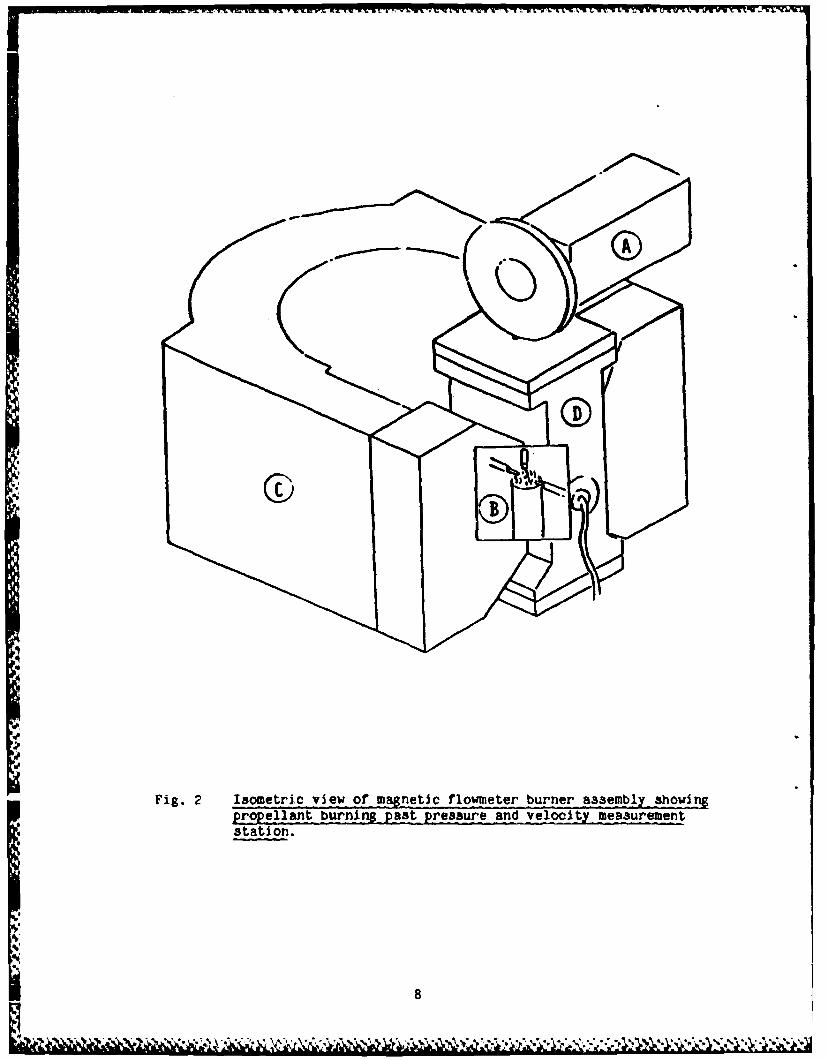
Fig. 2 Isometric v Jew_ of netJ c f lowmeter burner assembiy 3howi npropellantj burning past pressure and velocit;y measurementstation.
8
a permanent magnet d.c. motor. The motor speed was controlled by a Variac
adjustable autotransformer on an a.c. power line. The a.c. output of the
autotransformer was converted to a d.c. voltage for operating the motor. This
arrangement permitted steady performance at frequencies ranging from 2000 to
20,000 Hz.
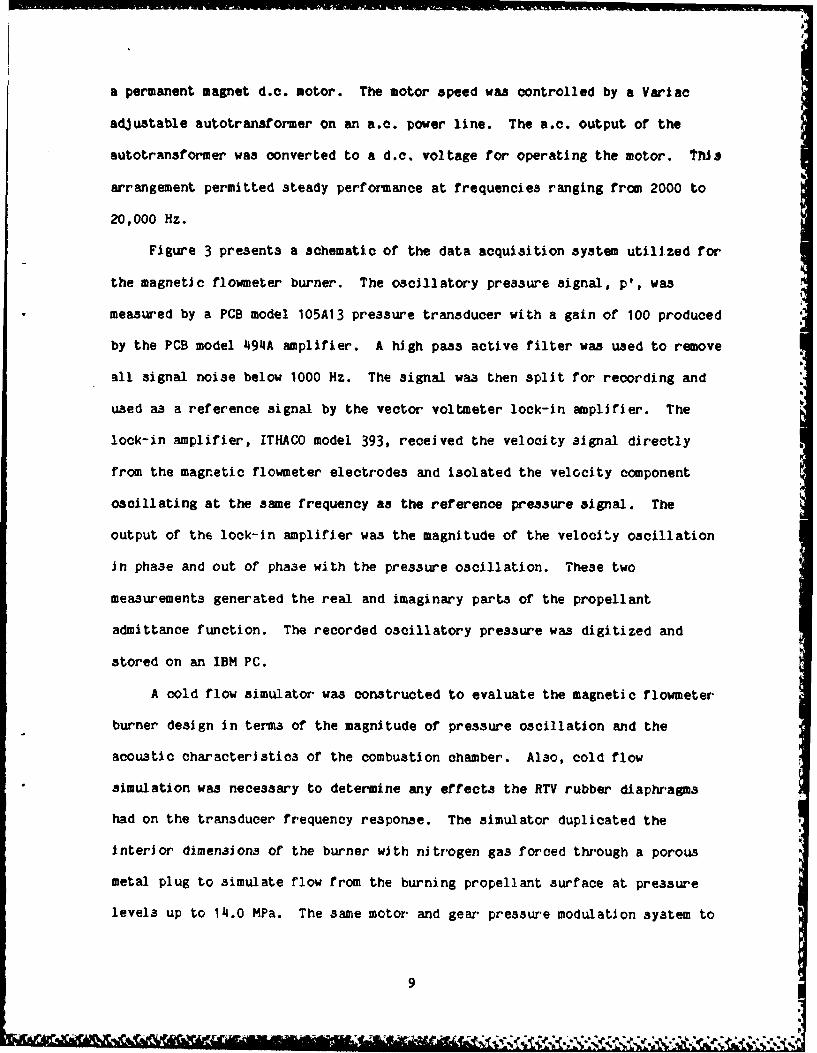
Figure 3 presents a schematic of the data acquisition system utilized for
the magnetic flowmeter burner. The oscillatory pressure signal, p', was
measured by a PCB model 105A13 pressure transducer with a gain of 100 produced
by the PCB model 494A amplifier. A high pass active filter was used to remove
all signal noise below 1000 Hz. The signal was then split for recording and
used as a reference signal by the vector voltmeter lock-in amplifier. The
lock-in amplifier, ITHACO model 393, received the velocity signal directly
from the magnetic flowmeter electrodes and isolated the velocity component
oscillating at the same frequency as the reference pressure signal. The
output of the lock-in amplifier was the magnitude of the velocity oscillation
in phase and out of phase with the pressure oscillation. These two
measurements generated the real and imaginary parts of the propellant
admittance function. The recorded oscillatory pressure was digitized and
stored on an IBM PC.
A cold flow simulator was constructed to evaluate the magnetic flowmeter
burner design in terms of the magnitude of pressure oscillation and the
acoustic characteristics of the combustion chamber. Also, cold flow
simulation was necessary to determine any effects the RTV rubber diaphragms
had on the transducer frequency response. The simulator duplicated the
interior dimensions of the burner with nitrogen gas forced through a porous
metal plug to simulate flow from the burning propellant surface at pressure
levels up to 14.0 MPa. The same motor and gear pressure modulation system to
9
I-I
z ID.I
u zr.x
w Z
x th L.S
LLI U acLL
CkC)m3
44)
10*
be used on the burner was applied in the cold flow simulation to determine
whether It could produce pressure oscillations of sufficient amplitudes at
frequencies up to 20 kHz. The theoretical acoustic characteristics were
determined by approximating the chamber as a close ended cylinder.
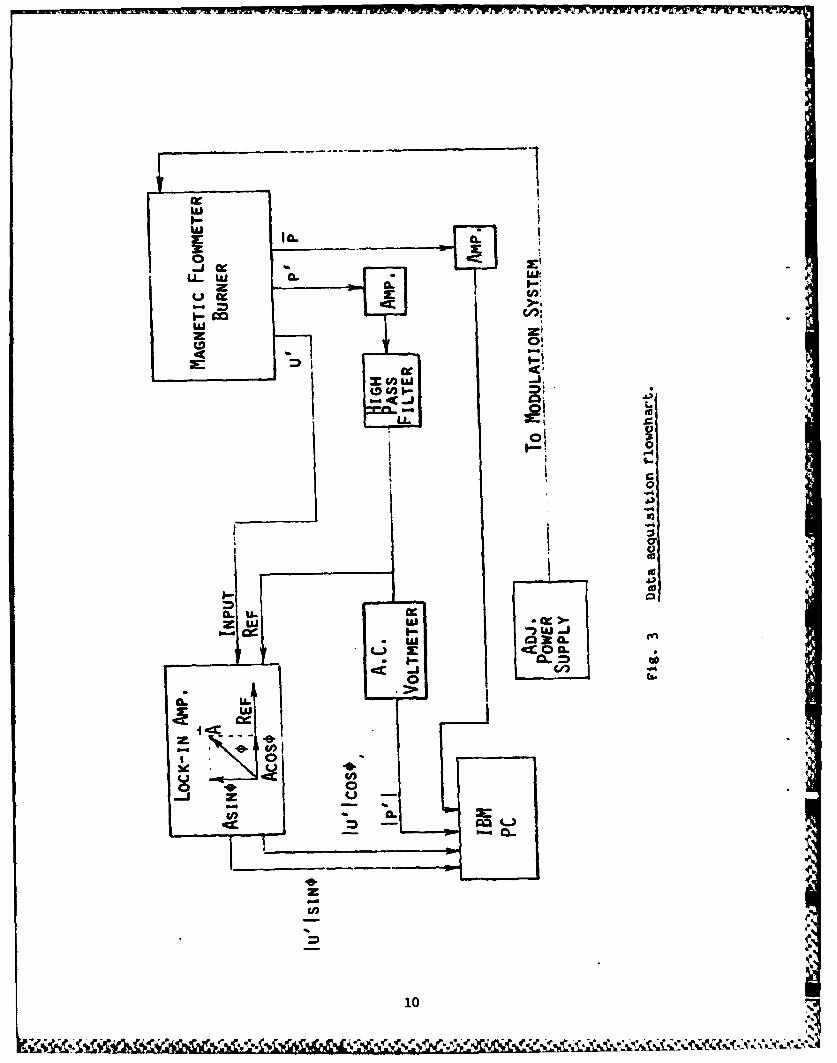
The performance of the pressure modulation system during cold flow
simulation is presented in Figure 14. The pressure oscillation amplitudes
produced in the cold flow simulator are plotted as a percentage of mean
chamber pressure, P, at an excitation frequency of 20 kI~z. The effectiveness
of the exit area modulation declined initially as the mean chamber pressure
rose from 1.38 MPa to 6.9 MPa. This behavior Is illustrated by the decline in
the oscillatory to mean pressure ratio in Figure 14. The pressure ratio
remained essentially constant from 6.9 MPa to 13.8 Mpa at a value of
approximately 0.7%. The amplitude of pressure oscillation was dependent on
the mean chamber pressure and the gap between the nozzle exit plane and the
teeth of the rotating gear. The optimum gap distance was found to be
approximately 3.0 millimeters. A slight increase in this distance resulted In
a large reduction in the oscillation amplitude.
The cold flow simulator was also used to test the effectiveness of RTV
rubber diaphragms of different thicknesses. These diaphragms were necessary
to protect the pressure transducer during the combustion of the propellant.
The results of these tests are plotted in Figure 5. The diaphragm thicknesses
were 1.5 mm and 3.0 mm, and they were compared to an unprotected transducer
over a frequency range of 41,000 Hz to 20,000 Hz. The mean chamber pressure
was held constant at 3.41 MPa. The diaphragms caused an amplitude loss which
was dependent on the excitation frequency, but the phase angle between the
* protected and the unprotected transducers remained zero. Identical results
were obtained for the two thicknesses at every frequency. Based on these
-A 11
50;ia&&in-eli. .
00
LA 4
- V-4
- -A
I0 00 00
4
12~
D NO DIAPHRAGM
1.5 MM AND 3.0 MM DIAPHRAGM I
x 100%p
2.0I
i t I
1.0 I
I iII
'II'I
0 4 8 12 16 20
EXCITATION FREQUENCY (KHz)
Fig. 5 Pressure oscillation amplitude versus excitation frequengy fortwo diphr m thicknesses at a mean chamber pressure of 14 MPa.
13

WK V, V. --
experimental results and design factors, the smaller diaphragm thickness was
selected for use in the magnetic flowmeter burner. Figure 5 also displays the
cold flow resonant modes. The observed amplitude peaks at frequencies less
than 16,000 Hz correspond to the predicted harmonic resonant frequencies for
longitudinal mode oscillation. The fir-at Observed amplitude peak occurred
near the second harmonic frequency for longitudinal mode oscillations with
additional peaks occurring near each consecutive resonant frequency up to the
sixth longitudinal harmonic of 15,720 Hz. Tangential mode oscillation
occurred at frequenci es above 16000 Hz creating resonant modes which were
combinations of tangential and longitudinal oscillations. These ccmbmnation
modes were observed at two predicted resonant frequencies of 17,098 Hz and
19,885 Hz.
The validity of the response function measurements relies on the accurate
calibration of the magnetic flowmeter for both velocity signal amplitude and
phase. The amplitude calibration consisted of determining the calibration
constant, a, in Equation 4. This was achieved by a device designed to
simulate the velocity measurement in the magnetic flowmeter burner. The
conducting gas flow in the burner was replaced by a solid copper rod with a
di meter of 6.0 mm. The conductivity independence of the magnetic flowmeter
equation permitted this replacement as long as the gas flow conductivity was
above the limi~t of 10-3 mhos/m. An electromagnetic shaker oscillated the
copper rod in the magnetic field produced by the ALNICO 5 permanent magnet.
Two graphite brushes picked up the potential across the rod induced by the
conductor moving through the magnetic field. The amplitude of the a.c.
potential was measured by the lock-in amplifier which used a reference signal
provided by the shaker- power supply. The velocity of the rod was derived by
integrating the acceleration measurement of a PCB model 305A05 accelerometer
14
mounted on the top of the copper rod. The calibration data was recorded as
flowmeter voltage versus oscillatory velocity of the calibration device. This
data was very consistent over a wide range of velocity amplitudes. The ratio
between velocity and voltage was inserted into Equation 4 along with the
measured magnetic field strength, B, and the electrode separation, L, yielding
a calibration constant of 2.1.
The velocity phase calibr'ation was required to correct the phase shift
induced by the inherent capacitance of the measuring circuit combined with the
high gas resistance. The capacitance induces an appreciable phase shift in
the velocity signal if the resistance of the combustion gas products is large.
To quantatively determine the phase shift that occurred in the course of the
experiments, the combustion gas resistance had to be measured. Direct
measurement of the gas resistance using an ohmmeter created polarization of
the el ectrodes, therefore, an indirect method was employed to determine the
gas resistance. In this method the resistance was experimentally determined
by measuring the phase shift induced on an oscillatory signal passed through
the combustion gas products. The advantages of this arr'Rngement are that i t
utilized the same equipment configuration as the magnetic flowmeter burner and
did not require the replacement or alteration of the existing combustion
chamber. Excellent run to run agreement was achieved for, the gas resistance
measurements obtained at several frequencies of oscillation, with the mean
value of gas resistance being 40,000 ohms. The value for the gas resistance
produced a maximum phase shift in the velocity measurement of 35.6 degrees at
a measurement frequency of 20,000 Hz.
All propellant tested was of 80% AP and 20% HTPB composition. The first
response function data was obtained for a 20 jim unimodel AP particle size at a
modulation frequency of 8000 Hz. Figures 6a and 6b plot the real and
15
imaginary parts respectively of the pressure-coupled response for this
propellant formulation. The data is plotted as a function of distance above
the burning propellant surface. The maximum distance plotted, 1.6 mm,
corresponds to the diameter of the velocity measurement electrode. Mean
pressures for the tests ranged from 4.5 to 8 MPa and are listed for' each test
on Figures 6 through 11. At the pressures shown in Figures 6a and 6b, the
propellant burn rate was 0.58 cm/s. The r~al part of the response in Figure
6a displays excellent reproducibility. The sampling rate was increased to
obtain better spatial resolution for testing of a 200 Um AP particle size
propellant. Figures 7a and 7b show the real and imaginary parts respectively
of the pressure-coupled response at a modulation frequency of 4000 Hz. The
value for the real part remains fairly constant while the imaginary part
displays a change in value through the flame zone. Figures 8a and 8b show the
real and imaginary parts at a modulation frequency of 8000 Hz. For these
tests the sampling rate was increased to its then maximum obtainable value of
250 Hz. At this frequency, the real part of the response increases with
distance above the propellant surface while the imaginary part remains
constant at a slight negative value. At the chamber pressures shown in
Figures 7 and 8 the 200 um AP propellant burn rate was approximately 0.7 cm/s.
Additional pressure-coupled measurements were made by two undergraduate
students for their senior thesis project. Measurements were made at
modulation frequencies of 12, 16, and 20 kHz for the 200 Um unimodal AP
propellant. Difficulties were encountered obtaining a sufficiently high
signal-to-noise ratio and the data exhibited greater scatter than at the lower
modulation frequencies. Figures 9a and 9b plot the real and imaginary parts
respectively of the pressure-coupled response at a modulation frequency of
12,000 Hz. The data for the two runs at this frequency show agreement for the
16
IAL PAP, OF Ail0l smt IUNCTIONww FT3071TJ (117r PSIA)
0 I !5.91S ( 660 PSIA)
1.0 APl D. PT M 1 60 PS A
00-
I i , I !0.0 0.4 0.8 1.2 1.A
&,ISrAUCf Aaovt NO'ILLA I S4. fAct (19)
Fig. 6a Real part of pressure-couEled response as a function of distanceabove propellant surface for 20 um AP propellant tested at8000 Hz.
IMGAIIT PanT Or AIspoNSi FUNCTIONmm NZ 0 r30716 (1170 PSIA)2,A A & MD31726 ( 67C rSIA)
4.0 0 MD35918 ( 660 PSIA)
0 0
A
-. 0
0 .A0
-1.0 0
i II .0.0 0.4 0.8 1.2 1.6
DSi 1St cI AOvt P*OPILLASII StR IAf (W)
Fig. 6b ImaginarZ part of presaure-coupled response as a function ofdistance above propellant surface for 20 pm AP propellanttested at 8000 Hz.
17
' , ,i'%,. - " , ".V. - ..

REAL FAAT Or RfSPCINS1 rL1:',1o. c TS-J92' (MIS5 P.jo)UDOID H: 7 PSt
2 I - 20 '4,% Ar
0
1.6
0 * 0 .. 0 0 0 0~ 0 0: 0eo o0 0 0
00
0 0 -- - - - -- - - - -- - - -
0 0.11 0.8 1.2 1.6D!~w !'r'CkW PRO&ELLhICI St'vc&Cc("
Fig. 7a Real part of pressure-coupled response as a function ofdistance above propellant 3urface for 200 Lim AP propellanttested at 4000 Hz.
IMAGINARY PART Of RESPONSE FUNCTION o M61927 (1025 PSIA)'1000 HZ * W-3927 97 ISA200e'e AP
-.- I
* 0 0. ,
.9 0 0 0 0 0 @ * 0 0 0 0 0 i
te~te 0 4000Hz
IFFrl~~ P-1er 0~ R 'ON ! 0 :U 0 0 12 ( 0 I)
00 0 0 0 "20,.,,,0 00
0O
0 0
-3.2 o
0 0.11 0.8 1.2 1.6Disanct Aro-.t PRCIIELLA4I SUIFACE (Mq-1
Fig. 7b Imainariar-tof presure-coupled response as_ a function ofdistance Rbove propellant surface for 200 jjrn AP propellanttested at 4000 Hz.
REAL P RT of RESPONSE FV,,ID, 9 1ID4488 4 (I3o0 PSIA)I+8000 Hz C P, OS O T D P$,I
| 20Q.- Ar
6.0 00
00 00 0 0 00 0 * 00 c.
& oo go o
6~ 0,069*C
0.1
-2.10
of ', I 0969I .
0 0.4 0.8 1.2 11.6
DISTAcE ABOVE POfrELL&NT SUOVCE[ (M-
Fig. 8a Real par't of pressure-coupled response as a function ofdistance above propellant surface for 200 ui AP propellanttested at 8000 Hz.
IMAG4A PAR? oF REspofsi FuNcTION & ?U)238?4 (VOD PSIA)
8000 Hz 0 MD50927 (1000 PSIA)
200 AP
2.0
I
RE a 0*00000000 00 C0050000 ot. 0F'6 0
00 0000~~~ O
•*roo0'°o°°°°°°09
6 60 000* 00 0 * ~a° e O 0 O
II
-0
00.4 0.C 1.2 1.6
DISIAN¢t Ajov.t PROELLANT1 StVerACE (M-)
Fig. 8b Imaginary part of Fr'essur'e-coupled response as 3 function ofdistance above propellant surface for 200 m APpr'opellanttested at 8000 Hz.
19
% .~ * ~ 'r( E~ 4~5
a* r 'pJ ~ '~'~ %. *%
!EAL PART OF kspowsE Fumctmok12,000 Hz204o AP
30 D720206 (1000 PSIA)
0 M3730206 (1000 PSIA)20 0
0 0 0
10 0 0 o0 0
0 a 0
-10 0 0 0 o0
-20
0.0 0.4 0.8 1.2 1.6
DISTAJCE Aeoy PnoPELLANT SURFACE (m)
Fig. 9a Real part of pressure-coupled response as a function ofdistance above propellant surface for 200 um AP propellanttested at 12,000 Hz.
IASIMNAV PART OF RSPONSE FNCTION12,000 Hz200, AP
40 .0 0 0 M720206 (1030 PSIA)
so 0 0 I)730206 (1000 PSIA)20 o c 0 Co 0 0 ° °
10 0 0 90 9 00 0
0 0 • • -10 0
-10 0 0 00
-20 - 0 so 0 00 00
-30
-.10 * I
Op a a a L, I
0.) 0.4 0.8 1.2 1.6
DISTAXC AIov PROPELLANT SORFACE (m)
Fig. 9b Imaginarypart of pressure-coupled response as a function ofdistance above propellant surface for 200 um APpropellanttested at 12,000 Hz.
real part, however, agreement cannot be claimed for the imaginary part.
Figures 10a and 1ob show the real and imaginary parts respectively of the
pressure-coupled response at a modulation frequency of 16,000 Hz. Agreement
between the two runs made at this frequency was not obtained for either the
real or imaginary parts. Figure 11 plots both the real and imaginary parts of
the pressure-coupled response for the one run made at a modulation frequency
of 20,000 Hz. Depletion of the supply of 200 pm unimodal AP propellant
prevented additional testing at these high frequencies. At the chamber'
pressures shown in Figures 9 through 11, the propellant burn rate was
approximately 0.7 cm/s.
PRESSURE-COUPLED RESPONSE ANALYSIS
The effort to obtain an analytical model for predicting the high
frequency solid propellant response functions follows the method used by Tien
(Ref. 9). This method numerically integrates a fifth order system of ordinary
differential equations. The flame is assumed to be one-dimensional, premixed,
laminar, and a one-step forward chemical reaction is taking place. The
specific heats, molecular weights, and coefficient of heat conduction are
taken to be constant, and the Lewis number is equal to unity. The governing
equations for the reacting flow above the solid propellant surface are
continuity, energy, and specie conservation given by
ap * -0 (8)at ax
aT aT a_ _ -_ 1 wq (9)p apu x 2 y at
ax
ayi ay a 2 y.P - + PU - - - v.w
at ax ax
i - f,o,p (10)
"-ll i ' ' " ;21. ."'"21
REAL PART OF RisPoust FuNcTIo
16,000 Hz20ro AP 0 820H01 Q1W PSIA)
0p 0 OD830108 (1000 PSIA)0. 0 00'O 00 0 0 I04 (0 0 0 0SA
0
2.S 0*00 0 0 000 000 0 00 0 0
00
.s 0
Z.S
00
-2.5 0
0.0 0.- 0.8 1.2 1.6
DisTsci AbOvg POPnIANT SuRFAct (m)
Fig. 10a Real part of preur'e-oupled response as a function ofdiatance above propellant surface for 200 .m AP propellant
Im.GiRwv PART OF Rspoms FuNwcyO16,000 Hz
a 20q4 AP
0 0°° 0 M2040M (1000 PSIA)* °o 0103008 (1000 PSIA)
90o09,6o9 0 %0 0.. 00- - -O-
0 0 0 0 0 0 0 0000 00 0 oOO-5 00 o o
0 o 00 0 0-00 0 0
0-15 t , , . . , 0
0.0 0.4 0.8 1.2 1.6
DisT€c Asov PROPELLANT SURFACE (M)
Fig. 10b Imag).nary_ part of Presure-oupled responae a a function ofdistance above ro ellant sur'face for 200 lim AP proellanttested at 16,000 Hz.
RLSPONSE FUnCTIO20,000 fz234,A AP
25 -00
0 MD8409 (1000 PSIA)20 0 0 kAL
0 S 00 a i, NAGINARY
15 o
000 0 0
00 000
0 0
0 tt o00 0 Hz0•° o o oo 00o
p p p p gq*O , ,
0.0 OAq 0.6 .,2 1.6
DISTANCE Movi PRoPELLANT SURFACE (, )
Fig. 11 Real and imaginary parts of pressure-coupled response as afunction of distance abOVe r[o ellant surface _for _20 0 urn APp ro~ellant tea3ted at 20,000 Hz.
p
23
where w is the reaction rate, q is the heat of reaction, vj is a function of
the reaction stoichrometric coeffici ents and the molecular weight of the
species, and Y is the Mass traction. A perturbation analysis Was utilized
with a small amplitude 31nusoidal time oscillation assumed for the variable
and with both mean and perturbation quantities being functions of height above
the burning propellant surface. Since the pressure wave length is always much
larger than the flame thickness, the pressure was assumned to be a function of
time only and a momentum equation is not required. Tien's model is the only
one to assume an unsteady gas phase reaction in addition to the unsteady heat
transfer to the burning solid propellant. The boundary condition equations
resulted from solving the energy equation in the solid phase and by assuming
an isentropic flow very far from the flame.
A fourth order Runge-Kutta method was utilized to integrate from the
outer flame edge, x - -, to the propellant surface, x - 0. The Integration
was carried out in this direction to allow a linear conversion method to be
used to calculate the boundary values. The linear conversion method separated
the solution into homogeneous solutions and a particular solution (Ref. 10).
Each of the homogeneous solutions was expressed in terms of the x - - boundary
value. The dependent variable for each homogeneous solution was given an
initial boundary value of unity and a value of zero for the particular
solution. The system of equations was then integrated for each set of
boundary values. The resulting solutions were summed and placed in the
boundary equations to determine the correct boundary values Of X
Figure 12 Plots the mean temperature and reaction rate as a function of
distance above the burning propellant surface which is at location x - 0.
These curves were obtained by integrating the mean energy equation and are
required as input for the integration of the perturbation equations. The
24
L
0
En C-)
L C)1*I 0
13 CD .
tr U1
tL C/) 9
I. I-T-Y
ZOZIHEW-J Z~
25Li
results given by the unsteady gas phase model of T'ien were then compared with
the pressure-ooupled admittances measured for the 200 um unimodel AP composite
propellant at 4000 and 8000 Hz. The model was utilized to calculate the
oscillating velocity component, u', versus height above the burning propellant
surface through the flame zone for comparison with experimentally measured
values. The two key parameters which were varied are the nondimensionalized
frequency, w, and the ratio of gas residence time to the solid residence time,
1. Figure 13 shows a representative result for w=2 and E-0.0122. It can be
seen that the model predicts a real component of the fluctuating velocity that
levels out at a constant value with increasing distance from the propellant
surface while the imaginary component steadily becomes more negative with
increasing distance. This compares with the experimental data shown in Figure
7. E and w were then varied to determine if the T'ien model could reproduce
the functional dependence of the admittance on the frequency of the pressure
oscillations. Figure 14 shows the real part of the admittance for two
frequencies a factor of two apart. It can be seen that for the I of 0.0244
the higher frequency produces a higher real part of the admittance. This was
also observed experimentally as can be seen by comparing Figures 7 and 8.
However-, the model still predicted an imaginary part with a constant negative
slope unlike the measured value for the imaginary part shown in Figure 8 at a
frequency of 8000 Hz. It is felt at this time that the T'ien model is too
simplistic in the chemical reaction kinetics to accurately model all the
observed behavior of the solid propellant admittance.
VELOCITY-COUPLED RESPONSE MEASUREMENTS
A burner to measure solid propellant velocity-coupled responses was
designed based on the knowledge gained from operation of the pressure-ooupled
26
0-t
U i
c r.
(Ca
1 11)0
E 0
*~
cc
0 03 W
wcco
I4
27I,
ohm&&.
)
00i.
1.0
00
0
3
% 0
28~
burner. Here the velocity-ooupled response is defined to be the response of
the propellant burning rate to an oscillatory cross-flow velocity adjacent to
the propellant surface. Figure 15 shows the propellant geometry and the
orientation of the electrodes and magnetic field to permit the simultaneous
meaurement of the cross-flow oscillating velocity, V', and the oscillatory
velocity of the gas leaving the propellant surface, Ub'. It is a 2-D slab
motor with two pairs of velocity measuring electrodes embedded in two facing
propellant slabs. Three of the electrodes penetrate one propellant slab with
the fourth electrode in the opposing slab. One pair of electrodes will
measure the cross-flow velocity above the propellant surface (V') and the
other pair will measure the velocity of the hot combustion gasses leaving the
propellant surface (Ub'). Corr-elating the two measurements will give the
velocity-coupled response. Figure 16 shows the velocity-coupled magnetic
flowmeter burner. A is the burner assembly, B is the permanent magnet, C is a
cutaway view of the propellant slabs and velocity electrodes and D is the
rotating toothed gear used to modulate the burner orifice and generate a
standing wave in the combustion chamber. The velocity measurement station is
located at the midpoint of the chamber where a velocity antinode and a
pressure node would be si tuated for a standing wave at or near the chamber
fundamental longitudinal frequency. This was done in order to maximize the
oscillatory cross-flow velocity to obtain a high signal-to-noise ratio and to
minimize pressure oscillations which would generate a pressure-coupled
response. The electrodes are rigidly mounted and the height of the
measurement station above the burning propellant surface increases as the
propellant regresses, ranging during a burn from 0 to 9 mm at burnout. Figure
17 is a detailed drawing of the velocity-coupled magnetic flowmeter burner
showing the locations of the mean chamber pre3sure transducer, the electric
29
Wee d

PROPELLANT
ELECTRODES
ELECTRODES
I - - POTENTIAL
V -pPOTENTIAL 4
PROPELLANT$LAS
Fig. 15 Slab_ proellant z-~eeryand orientation of electrodes and magneticfield for the simultaneous measurement of the oscillatory-cross-flow
yeocy, an eos try ye oJity oF the gas leaving thepr!opegllant surface, Uhl.
30

Fig. 16 Velocity-coupled magnetic floumeter burner used to make 3imultaneou3measurement of oscillatory cr033-f low_ velocity V' _and osci~llator p
velocity otgas normal topropellant surface, Ub. Components:A-burner assembly_,_ B-permanent magnet, _C-cutaway view of propellantslabs and velocity electr-oes_,_D-rotating_ toothed gear.
31
ALM&~
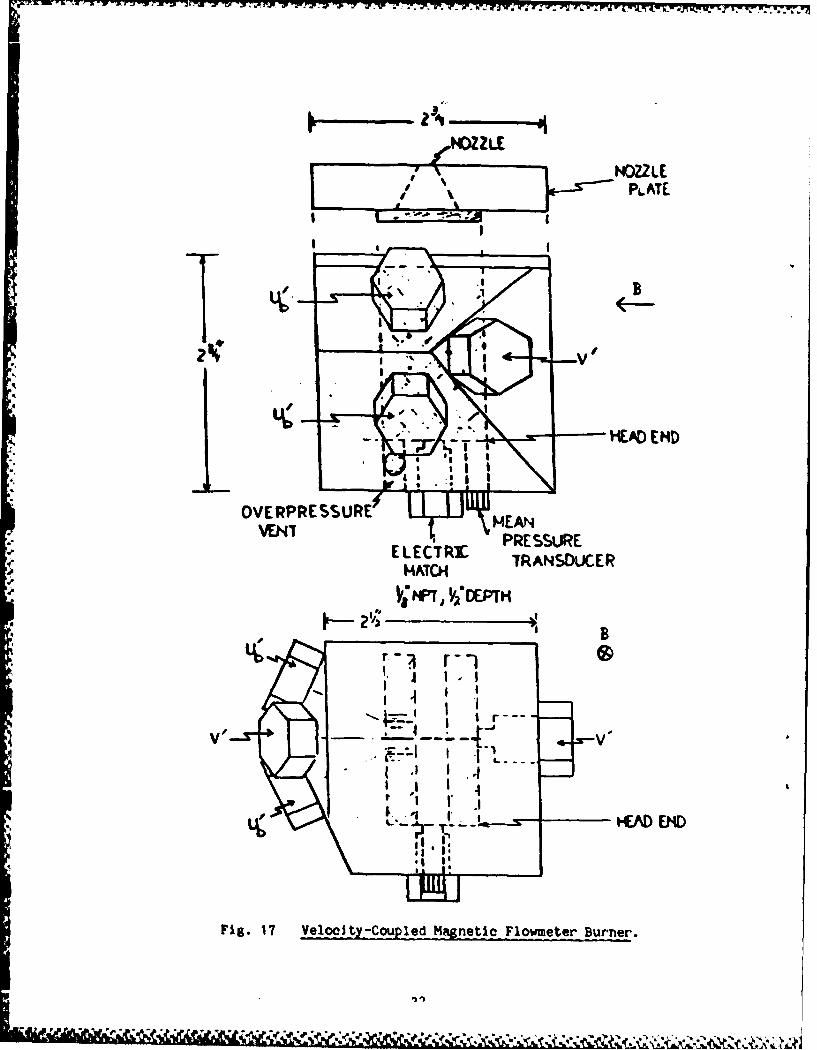
*v -V 7 7
-.- -
tOZLE
% FNDYZ 2 LT
"LAD EMD
OVE RPRE SSUREfVENT MA
MATCH TRANSDUCERW~NT, V;DEPKh
~ B
F . 17 vl -o
o i. jle !tnei Flwe unr

match used for ignition and the overpresaurization vent at the head end of the
chamber and the sonic nozzle at the opposite end. Velocity-coupled response
data is currently being obtained with this device.
33
bJ
CONCLUSIONS AND RECOMMENDATIONS
There are two major shortcomings for the methods presently used to
measure solid propellant pressure-coupled response functions. They are unable
to produce reliable results at high frequencies (> 10 kHz) and the majority of
the methods rely on an indirect means of response function measurement. One
of the objectives of this study was to develop an apparatus that utilizes a
magnetic flowmeter to obtain direct measurements of the pressure-coupled
response functions for solid propellants. The device was required to perform
these measurements over a frequency range up to 20,000 Hz while consuming
small amount of propellant. A burner apparatus was designed and constructed
to meet these specifications. A magnetic flowmeter was incorporated in the
apparatus in order to measure the velocity fluctuations of the combustion gas
products occurring during unsteady combustion of solid propellant samples.
This velocity measurement was the essential feature of the magnetic flowmeter
burner because i t permits the pressure-coupled response function to be
obtained directly from the experimental data.
The magnetic flowmeter, burner provided pressure-coupled response
measurements for two formulations of AP/HTPB composite propellant at selected
frequencies. The AP particle size differed between the two formulations, 20
um AP and 200 um AP. The magnetic flowmeter provided oscillatory velocity
measurements as the electrodes were exposed to the combustion gas products.
Mean and oscillatory pressure measurements were recorded simultaneously with
the oscillatory velocity measurements. These measurements produced the
surface admittance function for the burning propellant samples. A simple
relationship produced the pressure-ooupled response function from the
admittance function. Repeatable behavior was noted in the real and imaginary
parts of the pressure-coupled response for the 20 um AP and 200 um AP
34

propellant samples.
The validity of the response function measurements relies on the accurate
calibration of the magnetic flowmeter. The magnitude of the oscillatory
velocity signal was readily calibrated by the data generated by the velocity
calibration device. This data was consistent over a wide range of velocity
amplitudes. The velocity phase shift correction was found to be dependent on
the combustion gas resistance. The resistance was experimentally determined
by measuring the phase shift induced on an oscillatory signal passed through
the combustion gas products. The advantages of this arrangement are that it
utilizes the same equipment configuration as the magnetic flowmeter burner and
did not require the replacement or alteration of the existing combustion
chamber. Excellent run to run agr'eement was achieved for the gas resistance
measurements obtained at several frequencies of oscillation.
The magnetic flowmeter burner satisfied the objective of this
experimental study by producing direct pressure-coupled response function
measurements. The burner proved capable of measuring pressure-coupled
response at frequencies beyond the limits imposed on other methods. The small
amount of propellant consumed by the magnetic flowmeter burner for each run
makes the technique very economical for extensive testing of various solid
propellants. Some difficulty was experienced with obtaining the measurement
of the oscillatory velocity at a frequency other than the resonant frequency.
This problem did not seriously hamper the effectiveness of the magnetic
flowmeter burner and can most likely be remedied by minor design
modifications.
The external method of inducing pressure oscillations within the
combustion chamber of the burner produced smaller than expected amplitudes and
the oscillatory pressure signal was subjected to d.c. shifts due to
35
A! ... . . . . . ... . . .- .. . . . ." ... .. .., . ; . - ..--',.- ;. ". ,,"'

temperature effects and partial exhaust nozzle blockage. A high pass filter
and an 100 gain amplifier was incorporated into the circuit to condition the
oscillatory pressure signal. The improved pressure signal was inadequate for
the lock-in reference signal. The small pressure oscillations resulted in
velocity measurements with a low signal-to-noise ratio. Measurements at an
excitation frequency of 8000 Hz were of sufficient amplitude to be readily
distinguished from background noise. This was due to the excitation frequency
being near the first longitudinal resonant frequency of the combustion chamber.
Cold flow simulation has shown that the oscillation amplitude is much larger
at the chamber resonant frequencies. However, the velocity signal was of the
same order of magnitude as the noise at frequencies other than resonant
frequencies. The velocity signal was harder to discern for the burner tests
at other frequencies. The test had to be repeated several times to verify the
* data. A method to increase the velocity signal or reduce the amount of
background noise is needed before effective measurements can be taken at
other frequencies.
Magnetic flowmeter burner effectiveness can be improved by modifying the
chamber design to allow a larger diameter propellant strand. Additional
propellant consumption would be offset by the benefits. A larger exit nozzle
orifice size would accomodate the larger diameter propellant strands tested
over the same range of mean chamber pressures. Nozzle blockages by combustion
residue will decrease and mass flow through the nozzle will increase. The
greater mass flow permits higher amplitude pressure oscillations generated by
the pressure modulation system. In addition to an improved reference signal
for the lock-in amplifier, the larger oscillations within the combustion
chamber wi11 increase the velocity measurements by the magnetic flowmeter.
Another, benefit of the larger diameter propellant strands involves the
36
effect of the velocity electrodes embedded in the strands. The propellant
burning surface deforms around the electrodes as they are exposed by the
receding propellant. The calibration of the flowmeter velocity measurements
assumes an uniform flow vector from a planer' burning surface. This as3umption
is rendered invalid if large deformities alter, the average propellant surface
level. The effect of the deformi ties caused by the electrodes would be less
significant on a larger burning surface area.
The unsteady gas phase analysis of T'ien has been used to successfully
predict the trends of the pressure-coupled response as a function of frequency.
The model numerically integrates the governing equations, continuity, energy
and specie conservation, to predict the mean and oscillating components of the
flow variables: velocity, temperature, and specie mass fractions. Numerical
results and experimentally measured pressure-coupled response values are
compared. However a more accurate combustion process model is necessary to
quantitatively predict the propellant high frequency pressure-coupled
response.
Techniques validated in the pressure-coupled magnetic flowmeter burner
were applied to design and construct a hi gh frequency velocity-coupled
magnetic flowmeter burner. Two pairs of velocity electrodes simultaneously
measure oscillatory cross-flow velocity and oscillatory gas flow velocity
normal to the propellant surface. The geometry utilized was a two-dimensional
slab motor. The sonic nozzle is modulated to generate a fundamental mode
standing wave in the chamber wi th the measurements station located at the
velocity antinode. Experimental data is currently being taken to determine
the ability of the magnetic flowmeter technique to measure a velocity-coupled
response.
37

REFERENCES
1. Brown, R. S., Click, F. E. C., and Zinn, B. T., "Experimental Methods for
Combustion Admittance Measurements," Progress in Astronautics and
Aeronautics: Experimental Diagnostics in Combustion of Solids, Vol. 63,
AIAA, New York, N.Y., 1978, pp. 191-220.
2. Levine, J. N., and Andrepont, W. C., "Measurement Methods of Transient
Combustion Response Characteristic3 of Solid Propellant - An Assessment,"
AIAA Paper 79-1209, June 1979. 6
3. Semat, H., Fundamentals of Physics, 4th ed., Holt, Rinehart and Winston,
Inc., New York, N.Y., 1966.
4. Capener, E. L., Chown, J. B., Dickinson, L. A., and Nanevicy, J. E.,
"Studies on Ionization Phenomena Associated with Solid-Propellant
Rockets," AIAA Journal, Vol. 4, No. 8, August 1966, pp. 1349-1354.
5. Bestgen, ft. F., A Study of the Effects of Electrical Fields on Solid
Propellant Burning Rates, AFRPL-TR-71-87, Air Force Rocket Propulsion
Laboratory, Edwards AFB, CA, July 1971.
6. Micci, M. M., and Caveny, L. H., "NHD Measurement of Acoustic Velocities
in Rocket Motor Chambers," AIAA Journal, Vol. 20, No. 4, April 1982, pp.
516-521.
7. Micci, M. M., "Solid Propellant Response Functions Deduced by Means of
Forced Longitudinal Waves in Rocket Motors," Ph.D. Thesis, Dept. of
Mechanical and Aerospace Engineering, Princeton University, 1981.
8. Holme, J. C., Investigation of an Electromagnetic Technique for the
Independent Measurement of Chemical Rocket Exhaust and Vector,
AFRPL-TR-65-98, Astrosystems International, Inc., Fairfield, NJ, June
1965.
38
.. . . . . .. . . . . .. . . . . .. . . . . .. . . . . .. . . . .r~....................I~ ~~~**.<.
9. Tien, J. S., "Oscillator Burning of Solid Propellantas Including Gas PhaseTime Lag," Combuation Science and Technology, Vol. 5, 19T2, pp. 4I7-54~.
10. Na, T. Y., Computational Methods Jn Engineering Boundary Value Problems,
Academic Press, New York, N.Y., 1979.
39