Analysis and estimation of MIMO-SAR for multi-antenna ...
7
Analysis and estimation of MIMO-SAR for multi-antenna mobile handsets Li, Hui; Tsiaras, Apostolos; Lau, Buon Kiong Published in: IEEE Transactions on Antennas and Propagation DOI: 10.1109/TAP.2016.2647708 2017 Document Version: Peer reviewed version (aka post-print) Link to publication Citation for published version (APA): Li, H., Tsiaras, A., & Lau, B. K. (2017). Analysis and estimation of MIMO-SAR for multi-antenna mobile handsets. IEEE Transactions on Antennas and Propagation, 1522 - 1527. https://doi.org/10.1109/TAP.2016.2647708 Total number of authors: 3 General rights Unless other specific re-use rights are stated the following general rights apply: Copyright and moral rights for the publications made accessible in the public portal are retained by the authors and/or other copyright owners and it is a condition of accessing publications that users recognise and abide by the legal requirements associated with these rights. • Users may download and print one copy of any publication from the public portal for the purpose of private study or research. • You may not further distribute the material or use it for any profit-making activity or commercial gain • You may freely distribute the URL identifying the publication in the public portal Read more about Creative commons licenses: https://creativecommons.org/licenses/ Take down policy If you believe that this document breaches copyright please contact us providing details, and we will remove access to the work immediately and investigate your claim.
Transcript of Analysis and estimation of MIMO-SAR for multi-antenna ...

LUND UNIVERSITY
PO Box 117221 00 Lund+46 46-222 00 00
Analysis and estimation of MIMO-SAR for multi-antenna mobile handsets
Li, Hui; Tsiaras, Apostolos; Lau, Buon Kiong
Published in:IEEE Transactions on Antennas and Propagation
DOI:10.1109/TAP.2016.2647708
2017
Document Version:Peer reviewed version (aka post-print)
Link to publication
Citation for published version (APA):Li, H., Tsiaras, A., & Lau, B. K. (2017). Analysis and estimation of MIMO-SAR for multi-antenna mobilehandsets. IEEE Transactions on Antennas and Propagation, 1522 - 1527.https://doi.org/10.1109/TAP.2016.2647708
Total number of authors:3
General rightsUnless other specific re-use rights are stated the following general rights apply:Copyright and moral rights for the publications made accessible in the public portal are retained by the authorsand/or other copyright owners and it is a condition of accessing publications that users recognise and abide by thelegal requirements associated with these rights. • Users may download and print one copy of any publication from the public portal for the purpose of private studyor research. • You may not further distribute the material or use it for any profit-making activity or commercial gain • You may freely distribute the URL identifying the publication in the public portal
Read more about Creative commons licenses: https://creativecommons.org/licenses/Take down policyIf you believe that this document breaches copyright please contact us providing details, and we will removeaccess to the work immediately and investigate your claim.

Accepted version for publication in IEEE Transactions on Antennas and Propagation
1
Abstract—Measuring MIMO-SAR is an important part of
mobile handset evaluation, following the introduction of uplink
MIMO transmission schemes in LTE-Advanced. However, the
measurement of MIMO-SAR is complex and time-consuming. In
this paper, 6 unique dual-antenna mobile handsets, including both
typical and novel designs, are analyzed to determine the
dependence of MIMO-SAR on antenna configuration and
correlation. It is found that, for certain antenna configurations,
the location of the maximum MIMO-SAR and the corresponding
relative phase between the ports can be predicted. This can be
applied to drastically reduce measurement time. In addition,
dual-antennas with low envelope correlation coefficients in the
radiation patterns also offer near-orthogonal electric near-fields.
This leads to smaller MIMO-SAR than stand-alone SAR (S-SAR)
over all relative phases, making MIMO-SAR measurement
unnecessary. The results also provide guidelines for designing
multi-antenna handsets with low SARs. For verification, the S-
SAR and MIMO-SAR at relative phase of 0° were measured for
several prototypes. The measured SAR distributions showed good
agreement with the simulated ones.
Index Terms—Mobile antenna; multiple-input multiple-output
(MIMO); multi-antennas; specific absorption rate (SAR).
I. INTRODUCTION
MULTI-ANTENNA mobile prototypes have become a norm
in wireless communications due to mandatory downlink MIMO
capability in Long Term Evolution (LTE) systems. In addition,
the newly deployed LTE-Advanced systems also include
uplink MIMO transmissions, which require multiple antennas
to be simultaneously excited. This means that the multi-antenna
mobile prototypes must comply with international standards for
limiting human exposure to radio-frequency (RF) fields. RF
exposure is specified by Specific Absorption Rate (SAR),
which is defined for a given point in space by [1]-[3]
2SAR
E , (1)
where σ and ρ denote the electric conductivity and density of
the tissue, respectively. E is the total electric field (E-field) at
that point in the tissue. For single-antenna or multi-antennas in
selection diversity scheme, E is simply the E-field from the
excited antenna. In contrast, for multi-antenna schemes in
Manuscript received May 31, 2016. This work was This research is funded
by: (1) National natural science foundation of China (no. 61601079); (2) the
Fundamental Research Funds for the Central Universities (no.
DUT15RC(3)063) ; (3) the Swedish Research Council under grant no.
2010-468.
H. Li is with School of Information and Communication Engineering, Dalian University of Technology, Dalian, 116024, China. E-mail:
A. Tsiaras is with nok9 AB, Malmo, S-211 28, Sweden. E-mail: [email protected];
B. K. Lau is with the Department of Electrical and Information Technology,
Lund University, SE-221 00 Lund, Sweden. E-mail: [email protected].
general (e.g., maximum ratio combining and spatial
multiplexing), more than one antenna is excited. Hence, E is the
vector summation of the individual E-fields from the multi-
antennas. Thus, the amplitudes and phases of the
complex-valued E-fields depend on the MIMO precoding used.
For clarity, SAR in the case of multi-antenna excitation is also
named MIMO-SAR. It has been shown in [4] that the maximum
MIMO-SAR changes substantially (over 50%) over different
relative signal phases in the head phantom case. However,
exhaustive measurement of MIMO-SAR is time-consuming
and impractical. Even if there are only two antennas and the
transmit power of the two antennas is set to maximum, the
relative phase needs to be varied from 0 to 360 .
Several recent studies focused on evaluating and estimating
SAR for multi-antennas [5]-[11]. In [5], Wang et al. provided a
tighter upper bound of MIMO-SAR than one based only on
electric field magnitudes, improving SAR estimation accuracy.
Similarly, [6] presented three alternative schemes for
combining fields from multi-antenna elements to estimate
exposure levels. In [7], it was found that the relative phase
difference that gives the maximum SAR only changes by a few
degrees over different measurement planes, which will not
change the position of the maximum local SAR. Thus, in the
area scan, only the measurement plane near the inner surface of
the phantom is needed. In addition, methods of determining
MIMO-SAR in measurement using vector E-field probes and
scalar E-field probes were proposed in [8] and [9], respectively.
Moreover, studies were also carried out from the antenna
perspective. The influence of the ground plane on the SAR for
several dual-antenna mobile prototypes was evaluated in [10],
mainly for the stand-alone SAR (S-SAR). Average
MIMO-SAR (over all relative phases) was studied for 5
dual-antenna prototypes in [11], focusing on the impact of
antenna type on SAR.
This paper analyzes the influence of antenna configuration
and correlation on MIMO-SAR distribution for 6 dual-antenna
prototypes, with the aims to reduce measurement time and to
provide guidelines for low-SAR multi-antenna designs.
II. ANTENNA CONFIGURATIONS AND SYSTEM SETUPN
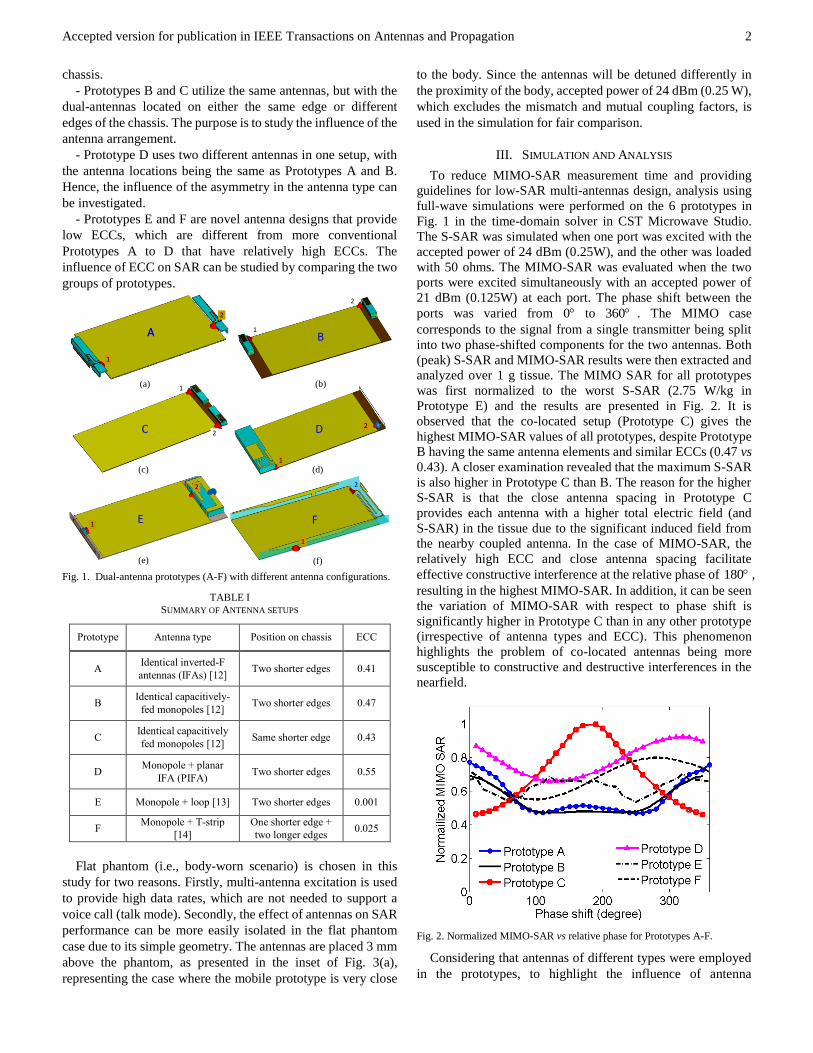
Figure 1 shows the 6 dual-antenna mobile prototypes used
in this study. They include both conventional and novel designs.
The dual antenna elements on each prototype are mounted on a
130 mm × 65 mm chassis. The small red arrows in Fig. 1
indicate the location of the antenna ports. Lumped ports were
used in the simulation. All the antennas are multi-band (i.e.,
dual- or triple-band). At the higher band(s), due to the electrical
distance between the antenna elements being larger, the
interaction between antennas is weaker and MIMO-SAR is
expected to be less severe. Thus, we focus on the SAR behavior
at the lowest band, with the center frequency of 0.859 GHz. As
indicated in Table I, the 6 prototypes were designed to provide
antennas of different types, positions, and envelope correlation
coefficients (ECCs) on a flat phantom (to be described later):
- Prototypes A and B are of different antenna types, with
antennas symmetrically located at two shorter edges of the
Analysis and Estimation of MIMO-SAR for
Multi-antenna Mobile Handsets
Hui Li, Apostolos Tsiaras and Buon Kiong Lau
Accepted version for publication in IEEE Transactions on Antennas and Propagation
2
chassis.
- Prototypes B and C utilize the same antennas, but with the
dual-antennas located on either the same edge or different
edges of the chassis. The purpose is to study the influence of the
antenna arrangement.
- Prototype D uses two different antennas in one setup, with
the antenna locations being the same as Prototypes A and B.
Hence, the influence of the asymmetry in the antenna type can
be investigated.
- Prototypes E and F are novel antenna designs that provide
low ECCs, which are different from more conventional
Prototypes A to D that have relatively high ECCs. The
influence of ECC on SAR can be studied by comparing the two
groups of prototypes.
(a) (b)
(c) (d)
(e) (f)
AA B
C
E F
D
1
1
1
1
1
1
2
2
22
2
2
Fig. 1. Dual-antenna prototypes (A-F) with different antenna configurations.
TABLE I
SUMMARY OF ANTENNA SETUPS
Prototype Antenna type Position on chassis ECC
A Identical inverted-F
antennas (IFAs) [12] Two shorter edges 0.41
B Identical capacitively-
fed monopoles [12] Two shorter edges 0.47
C Identical capacitively
fed monopoles [12] Same shorter edge 0.43
D Monopole + planar
IFA (PIFA) Two shorter edges 0.55
E Monopole + loop [13] Two shorter edges 0.001
F Monopole + T-strip
[14]
One shorter edge +
two longer edges 0.025
Flat phantom (i.e., body-worn scenario) is chosen in this
study for two reasons. Firstly, multi-antenna excitation is used
to provide high data rates, which are not needed to support a
voice call (talk mode). Secondly, the effect of antennas on SAR
performance can be more easily isolated in the flat phantom
case due to its simple geometry. The antennas are placed 3 mm
above the phantom, as presented in the inset of Fig. 3(a),
representing the case where the mobile prototype is very close
to the body. Since the antennas will be detuned differently in
the proximity of the body, accepted power of 24 dBm (0.25 W),
which excludes the mismatch and mutual coupling factors, is
used in the simulation for fair comparison.
III. SIMULATION AND ANALYSIS
To reduce MIMO-SAR measurement time and providing
guidelines for low-SAR multi-antennas design, analysis using
full-wave simulations were performed on the 6 prototypes in
Fig. 1 in the time-domain solver in CST Microwave Studio.
The S-SAR was simulated when one port was excited with the
accepted power of 24 dBm (0.25W), and the other was loaded
with 50 ohms. The MIMO-SAR was evaluated when the two
ports were excited simultaneously with an accepted power of
21 dBm (0.125W) at each port. The phase shift between the
ports was varied from 0 to 360 . The MIMO case
corresponds to the signal from a single transmitter being split
into two phase-shifted components for the two antennas. Both
(peak) S-SAR and MIMO-SAR results were then extracted and
analyzed over 1 g tissue. The MIMO SAR for all prototypes
was first normalized to the worst S-SAR (2.75 W/kg in
Prototype E) and the results are presented in Fig. 2. It is
observed that the co-located setup (Prototype C) gives the
highest MIMO-SAR values of all prototypes, despite Prototype
B having the same antenna elements and similar ECCs (0.47 vs
0.43). A closer examination revealed that the maximum S-SAR
is also higher in Prototype C than B. The reason for the higher
S-SAR is that the close antenna spacing in Prototype C
provides each antenna with a higher total electric field (and
S-SAR) in the tissue due to the significant induced field from
the nearby coupled antenna. In the case of MIMO-SAR, the
relatively high ECC and close antenna spacing facilitate
effective constructive interference at the relative phase of 180 ,
resulting in the highest MIMO-SAR. In addition, it can be seen
the variation of MIMO-SAR with respect to phase shift is
significantly higher in Prototype C than in any other prototype
(irrespective of antenna types and ECC). This phenomenon
highlights the problem of co-located antennas being more
susceptible to constructive and destructive interferences in the
nearfield.
Fig. 2. Normalized MIMO-SAR vs relative phase for Prototypes A-F.
Considering that antennas of different types were employed
in the prototypes, to highlight the influence of antenna

Accepted version for publication in IEEE Transactions on Antennas and Propagation
3
configuration and ECC, the MIMO-SAR result for each
prototype was normalized to its individual maximum S-SAR
value.
A. Dependence of SAR on Antenna Configurations
The normalized MIMO-SAR for Prototypes A-D is shown in
Fig. 3, with the absolute values of the peak S-SAR for each
antenna noted in the legend. From Fig. 3(a) and 3(b), it is
observed that the maximum MIMO-SAR values are obtained at
the relative phase of 0 for identical antennas located on the
two shorter edges of the chassis, which is a typical setup for
MIMO antennas.
To illustrate the phenomenon, the electric near fields of the
antennas were simulated. Figure 4 gives the two-dimensional
cut of the E-field along the length of Prototype A, with one port
excited at a time. It can be seen that the E-fields are strong at the
two edges of the chassis and present similar field distributions
regardless of the excited antenna. This is because when electric
antennas (e.g., monopoles, IFAs, PIFAs) are placed at a shorter
edge of the chassis, the entire chassis becomes the main radiator
[15]. The in-phase E-fields around both ports in Fig. 4 also
illustrate the constructive summation of MIMO-SAR at 0 in
Fig. 3(a) and 3(b).
3 m
m
Flat Phantom
(a) (b)
(c) (d)
Fig. 3. Individually normalized MIMO-SAR vs relative phase and absolute S-SAR for Prototype A-D, illustrated in subplots (a)-(d), respectively.
The maximum SAR of Prototype A locates near the shorter
edges of the chassis (see the SAR distributions in Table II).
Prototype B and in general identical electric antennas placed in
mirror symmetry along the chassis length offer similar field
distributions and MIMO-SAR trends. This has been verified by
antennas of various types in the simulation. The maximum
MIMO-SAR for Prototype D occurs slightly away from 0
relative phase, since the antennas are not identical. The
excitation of the chassis by both electric antennas in Prototype
A to D also leads to relatively higher ECC, as shown in Table I.
(a) Port 1 excited
(b) Port 2 excited
Fig. 4. E-fields along the length of the chassis for Prototype A.
For antennas placed on the same edge of the chassis, as for
Prototype C, the MIMO-SAR result shows a different trend
(see Fig. 3(c)). The E-field cut along the width of the chassis (at
the antenna location) is provided in Fig. 5. As the antennas are
in proximity of each other, a capacitance effect is formed when
voltage (excitation) is applied to one antenna, with the other
antenna loaded with 50 ohms. The field distribution around the
gap is similar to that of a capacitor formed by parallel plates.
The fields are out of phase when different antennas are excited.
Thus, the maximum MIMO-SAR will be achieved at a relative
phase of 180 , as verified by Fig. 3(c). The maximum
MIMO-SAR was found to be slightly higher than the S-SAR.
Reducing the distance between the antennas will lead to an
even higher MIMO-SAR. However, the relative phase that
gives the maximum SAR remained unchanged with the smaller
antenna spacing.
From the above analysis, it can be concluded that the relative
phase for maximum MIMO-SAR can be predicted for different
symmetric antenna configurations. Thus, for symmetric
configurations, it is possible to save MIMO-SAR measurement
time by using a-priori knowledge to avoid measuring over
different relative phases.
(a) Port 1 excited
(b) Port 2 excited
Fig. 5. E-fields along the width of the chassis for Prototype C

Accepted version for publication in IEEE Transactions on Antennas and Propagation
4
In practice, many factors, such as components on the chassis
and power handling, can cause the antenna setup to deviate
from being symmetric. To study the influence of asymmetrical
chassis, a speaker and a battery (modeled by full-metal
structures) were added to the chassis, as shown in Fig. 6.
Furthermore, the structures were intentionally placed very close
(3 mm) to the antennas. It was found that the symmetrical SAR
distribution vs relative phase is almost unchanged. Thus, the
effect of those disturbances on the chassis is limited.
Fig. 6. Configuration of Prototypes A with speaker and battery
Different power handling was also investigated for Prototype
A. Rather than dividing the power equally, the power fed into
port 1 was set to be half of the power fed into port 2, with the
total accepted power kept the same. The absolute MIMO-SAR
values with different relative phases are presented in Fig. 7. It
can be seen that the curve is not as symmetrical as before.
However, the maximum MIMO-SAR is still obtained at a
relative phase of 0 . This indicates that moderate power
imbalance may only have limited impact on the relative phase
for maximum MIMO-SAR.
Fig. 7. Absolute MIMO-SAR values vs relative phase for Prototype A with
power distribution of 1:2 over the ports.
B. Dependence of SAR on ECC
Due to shared chassis excitation by both antenna elements,
the ECCs for Prototypes A to D are above 0.4 (see Table I),
regardless of the antenna types and positions. To reduce the
ECC, different strategies were proposed: 1) Prototype E
employs a capacitively fed loop at one shorter edge to form a
magnetic antenna that has orthogonal pattern to the monopole
antenna [13]; 2) Prototype F uses a T-strip antenna to excite the
transversal dipole mode along the chassis width, which is not
correlated to the longitude dipole mode excited by the
monopole [14]. The ECCs for both prototypes are below 0.03 at
the center frequency.
Similar as Prototypes A to D, the normalized MIMO-SAR
for Prototypes E and F are shown in Fig. 8. The normalized
MIMO-SAR in Fig. 8(a) shows that its maximum SAR value is
only 70% of the maximum S-SAR, owing to the fully
de-correlated radiation patterns. The E-field of the loop antenna
in Prototype E is presented in Fig. 9, which is pointing into the
paper. The field distribution of the monopole is not shown as it
is similar to Fig. 4(b), i.e., the field vector is along the paper
plane. Thus, the E-field vectors of the two antennas are always
perpendicular to each other regardless of their relative phase,
and hence the total field is far smaller than the summation of
their field magnitudes. Similarly, the low ECC for Prototype F
is reflected in the orthogonal E-field distributions of the two
antennas, resulting in MIMO-SAR to be smaller than S-SAR.
Hence, designing MIMO antennas with low correlation not
only provides better system performance (e.g. capacity), but it
can also provide lower MIMO-SAR values. Moreover, since
S-SAR is found to be always higher than MIMO-SAR, only
S-SAR needs to be measured for SAR evaluation.
(a) (b)
Fig. 8. Normalized MIMO-SAR vs relative phase and absolute S-SAR for
Prototypes E and F, illustrated in subplots (a) and (b), respectively.
Fig. 9. E-field along the length of the chassis for the loop antenna in Prototype
E.
IV. PROTOTYPES AND EXPERIMENTS
The antenna prototypes in the simulations were fabricated to
verify the SAR distributions. The measurement setup of the flat
phantom is presented in Fig. 10. A signal is first generated and
amplified, and then transmitted through a directional coupler.
To ensure that the accepted power by the antenna is kept at
0.25W, a power monitor is used at P3. For the S-SAR
measurement, the signal from P2 is directly connected to one
port of the antenna, with the other port loaded with 50 ohms.
For MIMO-SAR measurements, a splitter is used to transmit
equal power to the two ports through cables of the same length,
representing the case of 0 relative phase.

Accepted version for publication in IEEE Transactions on Antennas and Propagation
5
The simulated and measured results of SAR distribution are
shown in Tables II and III, with Prototypes A and F as
representative cases. In general, the measurement results agree
well with the simulated ones. For Prototype A, the measured
maximum S-SAR and MIMO-SAR ( 0 relative phase) are
1.96 W/kg and 1.68 W/kg, respectively, which are lower than
the simulated values shown in Fig. 2 (a). The difference
between SAR distributions could be due to the probe not being
exactly positioned in the plane with the maximum SAR values.
Other factors, such as tolerance of tissue-simulating liquid
properties, prototype fabrication and cable effects, could also
contribute to the discrepancy. It is observed that simulated and
measured MIMO-SAR have larger discrepancies than the
S-SAR counterpart. This is partly attributed to the 0 phase
difference not being easy to obtain in the measurement. A more
sophisticated way to obtain an accurate relative phase is
provided in [16]. In addition, a slight asymmetry in the
measured SAR distribution is observed for Prototype A (see
Table II). However, it was shown in Section III-A that some
asymmetries in the antenna setup (that can lead to the
asymmetric SAR distribution) have limited impact on
maximum MIMO-SAR being obtained at 0º relative phase for
symmetrically placed electric antennas on the chassis.
(a)
(b)
Fig. 10. (a) Block diagram and (b) photo of SAR measurement setup.
The measured MIMO-SAR ( 0 relative phase) for Prototype
F is 2.03 W/kg, which is slightly higher than the simulated
value. This is because in the simulation, the accepted power
could be perfectly controlled to exclude impedance matching
and mutual coupling effects. However, in the measurement, the
input power was estimated from the measured impedance
matching, coupling and the required accepted power, which
introduced some errors. Therefore, some discrepancies can be
expected between the actual accepted power by each antenna
and the targeted power. Moreover, the fabricated prototypes are
not exactly the same as those simulated due to tolerances in
fabrication, material properties as well as cable effects, as
illustrated in [12] and [14] for Prototypes A and F, respectively.
All of these factors can contribute to either larger or smaller
measured peak SAR relative to the simulated value. TABLE II
SIMULATED AND MEASURED SAR DISTRIBUTIONS FOR PROTOTYPE A
Prototype A S-SAR
MIMO-
SAR
Port 1 Port 2 Δφ=0o
Simulation
Maximum SAR(W/kg) 2.12 2.12 2.01
Measurement
1.961.761.561.361.160.960.760.560.360.16
0
Maximum SAR(W/kg) 1.89 1.96 1.75
TABLE III
SIMULATED AND MEASURED SAR DISTRIBUTIONS FOR PROTOTYPE F
Prototype F MIMO-SAR (Δφ=0o)
Simulation Measurement
2.031.821.621.421.221.020.820.620.420.220.02
Maximum SAR(W/kg) 1.89 2.03
V. CONCLUSION
The MIMO-SAR performances of 6 different dual-antenna
prototypes were analyzed for a body-worn scenario. Antenna
configurations and correlation were the key parameters of this
study. Several conclusions can be drawn from the results:
Antennas co-located on the same chassis edge give higher
SAR values than non-collocated ones, for both S-SAR
and MIMO-SAR. The variation of MIMO-SAR over
different relative phase for co-located set-ups is larger due
to stronger constructive and destructive effects.
As long as the antenna belongs to electric antennas (most
of the antennas used in mobile phones are electric
antennas, such as PIFA, dipole and monopole), and they

Accepted version for publication in IEEE Transactions on Antennas and Propagation
6
are symmetrically placed on the chassis, maximum
MIMO-SAR is achieved at 0 relative phase for identical
antennas positioned on the two shorter edges of the
chassis, whereas it is obtained at 180 relative phase for
those collocated on the same edge of the chassis.
For symmetric antenna configurations where the dual-
antennas are either placed on the two shorter edges of the
chassis or collocated at one shorter edge, the measurement
of maximum MIMO-SAR is only needed near a shorter
edge of the chassis for a certain phase shift that can be
predicted a-priori.
Dual-antennas with low correlation give lower
MIMO-SAR than S-SAR, implying that only S-SAR
needs to be measured for these dual-antenna prototypes.
This applies to both beamforming and spatial
multiplexing scenarios.
These findings can be applied to simplify the MIMO-SAR
measurement and to design antennas that can offer lower
MIMO-SAR.
REFERENCES
[1] IEC/TR 62630, “Guidance for Evaluating Exposure from Multiple Electromagnetic Sources”, Ed. 1.0, 2010.
[2] IEC 62209-2, “Human exposure to radio frequency fields from hand-held
and body-mounted wireless communication devices: Human models, instrumentation, and procedures Part 2: Procedure to determine the specific
absorption rate (SAR) for wireless communication devices used in close
proximity to the human body (frequency range of 30 MHz to 6 GHz)”, Ed. 1.0, 2010.
[3] IEEE 1528, “IEEE Recommended Practice for Determining the Peak
Spatial-Average Specific Absorption Rate (SAR) in the Human Head from Wireless Communications Devices: Measurement Techniques”, Ed. 2013.
[4] K.-C. Chim, K. C. L. Chan, and R. D. Murch, “Investigating The Impact of
Smart Antennas on SAR”, IEEE Trans. Antennas Propag., vol. 52, no. 5, 1370-1374, May 2004.
[5] M. S. Wang, L. Lin, J. Chen, D. Jackson, W. Kainz, Y. H. Qi, and P.
Jarmuszewski, “Evaluation and optimization of the Specific Absorption Rate for multiantenna systems,” IEEE Trans. Electromagn. Compat., vol.
53, pp. 628-637, Aug. 2011.
[6] N. Perentos, S. Iskra, A. Faraone, R. J. McKenzie, G. Bit-Babik, and V. Anderson, “Exposure compliance methodologies for Multiple Input
Multiple Output (MIMO) enabled networks and terminals,” IEEE Trans.
Antennas Propag., vol. 60, pp. 644-653, Feb. 2012. [7] D. T. Le and V. H. Chu, “Analyses on the maximum local specific
absorption rate of multiple antenna devices in different measurement
planes,” in Proc. IEEE Conf. Advanced Technol. Commun. (ATC’2015), Ho Chi Minh, Vietnam, Oct. 14-16, 2015, pp. 496-500.
[8] D. T. Le, L. Hamada, S. Watanabe, and T. Onishi, “An Estimation Method
for Vector Probes Used in Determination SAR of Multiple-Antenna Transmission Systems” in Proc. Int. Symp. On Electromagnetic
Compatibility (EMC14), Tokyo, Japan, May. 2014
[9] D. T. Le, L. Hamada, S. Watanabe, and T. Onishi, “Measurement
Procedure to Determine SAR of Multiple Antenna Transmitters Using
Scalar Electric Field Probes”, in Proc. of the IEEE Conf. Advanced
Technol. Commun. (ATC’2014), Hanoi, Vietnam, Oct., 2014. [10] K. Zhao, S. Zhang, Z. Ying, T. Bolin, and S. He, “SAR study of different
MIMO antena designs for LTE application in smart mobile prototypes,” IEEE Trans. Antennas Propag., vol. 61, pp. 3270-3279, Jun. 2013.
[11] H. Li, A. Tsiaras, B. Derat, and B. K. Lau, “Analysis of SAR on flat
phantom for different multi-antenna mobile terminals,” in Proc. 8th Europ.
Conf. Antennas Propag. (EuCAP’2014), The Hague, The Netherlands, Apr. 6-10, 2014, pp. 1989-1993.
[12] I. Vasilev, V. Plicanic, and B. K. Lau, “Impact of antenna design on MIMO
performance for compact terminals with adaptive impedance matching” IEEE Trans. Antennas Propag., vol. 64, no. 4, pp. 1454-1465, Apr. 2016.
[13] H. Li, B. K. Lau, Z. Ying and S, He, “Decoupling of multiple antennas in terminals with chassis excitation using polarization diversity, angle
diversity and current control,” IEEE Trans. Antennas Propag., vol. 60, no.
12, pp. 490-502, Dec. 2012. [14] Z. Miers, H. Li, and B. K. Lau, “Design of bandwidth enhanced and
multiband MIMO antennas using characteristic modes,” IEEE Antennas
Wireless Propag. Lett., vol. 12, pp. 1696-1699, 2013. [15] H. Li, Y. Tan, B. K. Lau, Z. Ying and S, He, "Characteristic mode based
tradeoff analysis of antenna- chassis interactions for multiple antenna
terminals," IEEE Trans. Antennas Propag., vol. 60, pp. 490-502, Feb. 2012.
[16] D. T. Le, L. Hamada, S. Watanabe, and T. Onishi, “A Method in
Determination of the Specific Absorption Rate of Multi-Antenna Devices” in Proc. IEEE Int. Symp. Antennas Propag.(APS 2014),
Memphis, US, Jul., 2014