ANALYSIS 3 - RASTER What kinds of analysis can we do with GIS? 1.Measurements 2.Layer statistics...
15
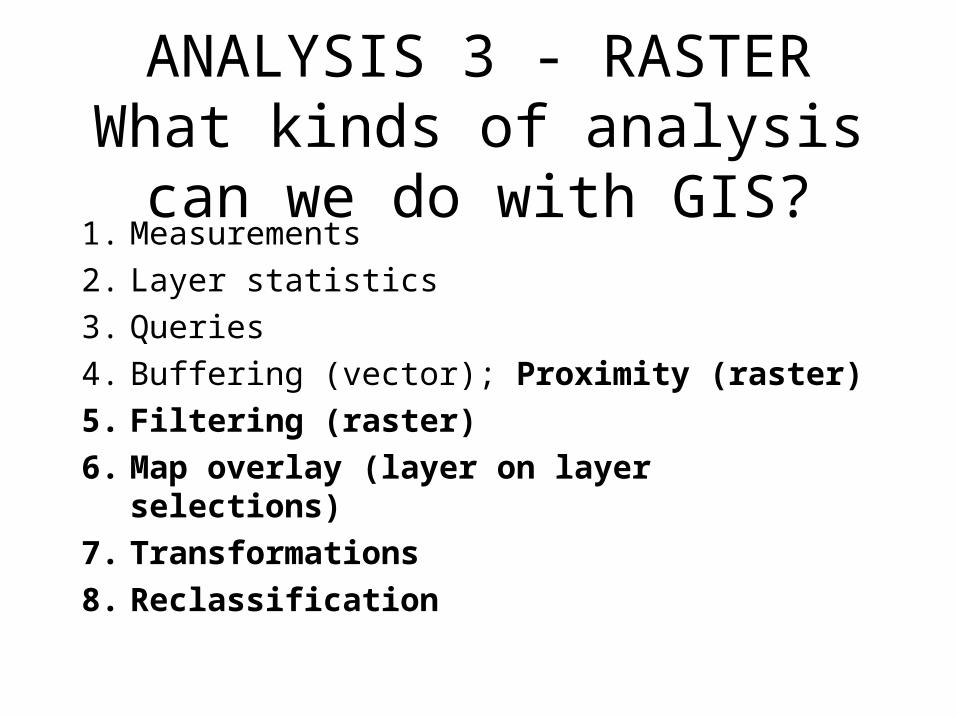
ANALYSIS 3 - RASTER What kinds of analysis can we do with GIS? 1. Measurements 2. Layer statistics 3. Queries 4. Buffering (vector); Proximity (raster) 5. Filtering (raster) 6. Map overlay (layer on layer selections) 7. Transformations 8. Reclassification
-
date post
19-Dec-2015 -
Category
Documents
-
view
230 -
download
0
Transcript of ANALYSIS 3 - RASTER What kinds of analysis can we do with GIS? 1.Measurements 2.Layer statistics...
ANALYSIS 3 - RASTERWhat kinds of analysis can we do
with GIS?1. Measurements
2. Layer statistics
3. Queries
4. Buffering (vector); Proximity (raster)
5. Filtering (raster)
6. Map overlay (layer on layer selections)
7. Transformations
8. Reclassification

What kinds of analysis can we do with GIS?
9. Network analysis
10. Spatial interpolation
11. Grid (raster) analysis
12. Surface analysis
13. Analytic modeling (Appendix)

Proximity map for hotels in Happy Valley: (a) distance surface; (b) 125 m buffer zones
4b. Proximity - Raster
• Concentric equidistant zones established around a starting point• Uses one raster layer, result is another raster layer where the attribute
of each cell is a measure of distance.• In ArcMap – Spatial Analyst extension, distance, allocation (ArcMap refers to this as “straight line allocation”)

Raster GIS filter operations
5. Filtering (raster)• Value of a cell are changed based on attribute values of other cells• Example: recalculating a valuefor cell c4• Different approaches:min value, max, mean, modal• Often used to “smooth” noisy data (e.g., seams between two digital elevation models)- WE WILL DO THIS TODAY• For seams, in ArcMap, Spatial Analyst, Raster calculator, “mosaic”

6e. Raster Overlay
• “Map Algebra” or “Mapematics” (p. 268 Bolstad)• Chapter 10 of Bolstad
• Two raster layers with same cell size
• Can add, subtract, multiply, divide them to produce a new layer
• In ArcMap: Spatial Analyst extension, “Raster Calculator”
• We will do this today

Raster overlays: (a) point-in-polygon (using add); (b) line-in-polygon (using add); (c) polygon-on-polygon (using add)

Raster overlays: (d) polygon-on-polygon (Boolean alternatives)
7. Transformations• Raster to vector conversion
– In ArcMap, 3-D analyst extension, convert, raster to feature
• Vector to raster conversion – In ArcMap, 3-D analyst extension
• Raster to Triangular Irregular Network (TIN)– In ArcGIS, 3-D analyst extension
• Resampling a raster grid – convert one cell size to another cell size – shown on page 172 of coursepack

8. Reclassification
• Converting attribute table field values to some new field and values (p. 236 Bolstad)– Example: Converting a landuse layer with 21 different landuse
categories to a layer that is just “forest (1) or no forest (0).” Polygons with value of 10 (forest) should get a value of 1 (yes); otherwise 0 (no).
– Example: Satellite image classification
• Can be done in vector or raster• In ArcMap:
– “Reclassification” in ArcMap help refers to raster…– Vector – Open table, edit, field calculator– Raster – either in Spatial analyst, reclassify (or using raster
calculator) or in 3-D analyst
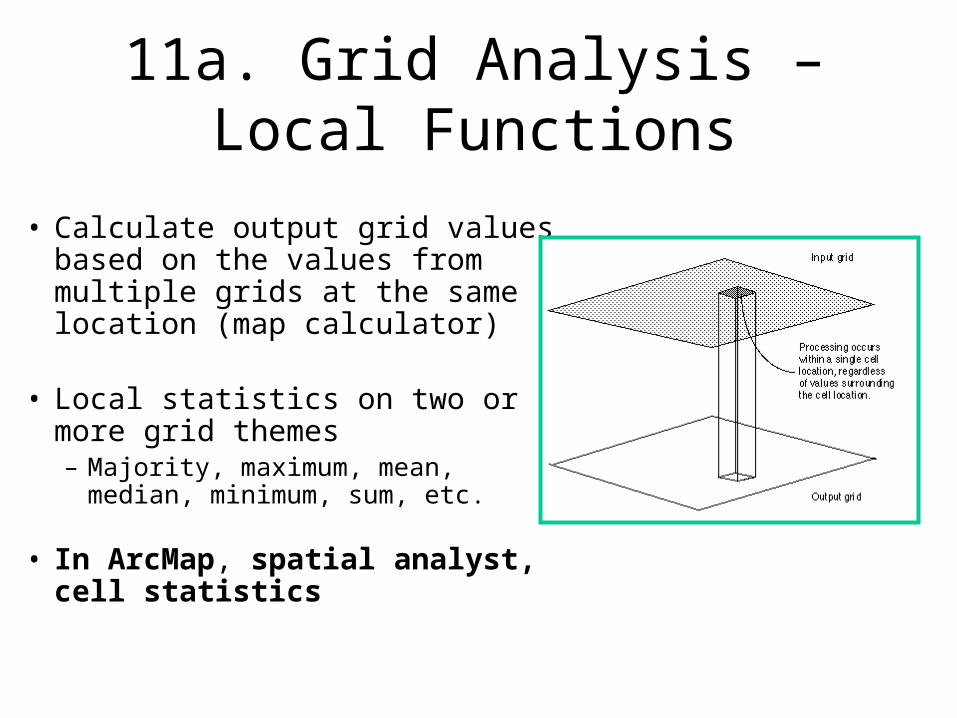
11a. Grid Analysis – Local Functions
• Calculate output grid values based on the values from multiple grids at the same location (map calculator)
• Local statistics on two or more grid themes– Majority, maximum, mean, median,
minimum, sum, etc.
• In ArcMap, spatial analyst, cell statistics

11b. Grid Analysis – Neighborhood Functions
• Can also calculate statistics on cells that are found within a neighborhood. Neighborhood shapes:
– Rectangle– Circle– Doughnut– Wedge– Irregular
• Statistics produced: – Majority, maximum, mean, median, minimum, sum, etc.
• In ArcMap, spatial analyst, neighborhood statistics

12. Surface Analysis(Ch. 11 Bolstad)
• Contour• Slope • Aspect • Hillshade• Visibility analysis… (“Viewshed” in ArcMap)• Good table on p. 290 Bolstad on commonly used
terrain variables and their importance.
• In ArcMap, Spatial Analyst extension, “Surface analysis” - TODAY; Also in 3-D analyst.

Slope over DEM

Ray tracing for visibility analysis
Visibility Analysis
In ArcMap: 3-D Analyst, surface analysis, viewshed

Some ways to get data into Raster format
• They are already in a raster format (e.g., Internet files)– DEMs– Orthophotos– Landsat images– ESRI “Grid” format
• You convert vector data to raster in Spatial Analyst extension– Creates a Grid
• You create a new raster in a raster software– ERDAS Imagine; Idrissi; ENVI; ER Mapper; Multispec,
others…