Estimating a living wage - International Labour Organization
Upload
trinhquynhCategory
view
216download
0
Analysing Wage Formation in the South African Labour Market: The Role of Bargaining Councils
September 2007
Haroon Bhorat
Carlene van der Westhuizen
Sumayya Goga
School of Economics, University of Cape Town
Private Bag, Rondebosch, 7701
http: //www.commerce.uct.ac.za/dpru/

1
1. Introduction
Bargaining councils (know as industrial councils before 1995) are the key institutions involved in the statutory system of collective bargaining and wage determination in the South African labour market. A bargaining council can be established by one or more registered trade unions and one or more registered employer organisations for a specific sector and area. Worker interests are therefore represented at a bargaining council by the party trade unions. Both trade unions and bargaining councils have been claimed to be contributing to labour market inflexibility, and specifically wage inflexibility. The extensions of wage agreements to non-bargaining council members and non-union members are deemed to be particularly problematic and it has been have argued that these extensions place unnecessary burdens on small and new businesses and contributes to the high unemployment rate in the country (see for example Butcher & Rouse, 2001: 349, 350; Michaud & Vencatachellum, 2001: 3). Ultimately however, the role played by bargaining councils, their forerunners the industrial councils and of course trade unions, in wage formation – is a key component of the broader ongoing debate around South Africa’s labour regulatory environment.
A number of past studies have explored the wage premium associated with union membership in the South African labour market. Depending on the data sets used, dependent variable (hourly, weekly, monthly or annual wages) and the methodology used, the size of the estimated union premium differs widely.1 These studies generally found a positive and significant wage premium associated with union membership. Not many studies have, however, investigated the role of bargaining councils in setting minimum wages in the South African labour market. The only noteworthy study was that conducted by Butcher and Rouse in 2001. Using data from 1995, they found that African workers who belonged to an industrial council, but not a union, earned about 10 percent more than those workers not covered by an industrial council agreement. When these workers belonged to a union too, the wage premium increased to more than 30 percent.
The main objective of this study is to evaluate the role of bargaining councils in wage formation in the South African labour market. Specifically, the study aims to determine what premium is associated with Bargaining Council membership as distinct from Union membership, for employees in the South African labour market.
Section 2 provides a brief overview of the development of institutionalised wage formation in the South African labour market, focusing on the establishment of industrial councils, the development of a dual system of industrial relations in the country and the shift from industrial councils to bargaining councils in post-apartheid South Africa. Different forms of wage formation are then explored in Section 3. The various data sources used in our analysis and the estimation of industrial and bargaining council coverage are discussed in the Section 4.1,
1 See Michaud & Vencatachellum (2001: 20) for a comparison of some of the reported wage premia in the literature.

2
while Section 4.2 provides a descriptive overview of the estimated coverage in terms of the numbers of workers as well as their associated earnings. Section 5 provides a multivariate analysis of earnings, which allows us to account for the simultaneous impact of a range of relevant variables on earnings, in particular, isolating the impact of industrial/bargaining council and union membership on earnings. Section 6 concludes.

3
2. Institutionalised Wage Formation: A Brief Overview
Industrial councils were established in response to the need to resolve disputes such as those between mining companies and miners in the early 1920s as well as the Rand Rebellion of the 1922 when workers embarked on strike action against employers. As such, then, industrial councils represented the first institutionalised representation of collective bargaining in the South African labour market. In 1924, the Industrial Conciliation Act was introduced with the specific aim of establishing a system of collective bargaining (SALDRU, 1990: 3). The Act provided the legislative framework for the establishment of industrial councils as well as the framework for the regulation of collective bargaining and industrial conflict. According to Godfrey (1992: 1) the central aim of the Act was to create a system of national industry-wide councils that would allow industrial sectors to govern themselves by representative employer organisations and trade unions. Agricultural workers, domestic workers and government employees, however, fell outside the ambit of the Act (SALDRU, 1990: 3).
In practice an industrial council was formed when an employer, employers’ organisation or a group of employers’ organisations together with a registered trade union group of registered trade unions came together and agreed on the constitution for the council – and then proceeded to register the council in terms of the Act. Once registered, an industrial council became a permanent bargaining institution (Godfrey, 1992: 5). The establishment of an industrial council was voluntary and no provision was made for majority or proportional representation in the legislation, which meant that councils could accommodate a wide variety of trade unions of varying sizes and interests (Godfrey, 1992: 7). The geographical and industrial scope (which constituted the jurisdiction of the council) was also left for the parties to be determined. Finally, the issues that these councils chose to negotiate on, were left to the discretion of the parties to the council, but generally included wages, social welfare benefit funds, and conditions of employment such as working hours.
The Industrial Conciliation Act did require that the parties be representative of the jurisdiction for which the council was seeking registration. The issue of representation was left to the discretion of the Minister of Manpower, but generally meant that the parties represented the majority of employers or employees in a geographical area, industry, occupation or trade (Butcher & Rouse, 2001: 351). Once an industrial council was registered, it could request the Minister of Manpower to publish their agreements in the Government Gazette and to extend the agreements to all employers and employees within the jurisdiction of the council. The Minister could use his discretion both in the publication of agreements and the extension of agreements and had to be satisfied that the parties to the Industrial Council were sufficiently representative of the employers and employees within the jurisdiction of the Council. For an agreement to be extended to non-parties, the Minister had to be satisfied that non-extension would result in unfair competition from employers not subject to the agreement. The publication of an agreement in the Government Gazette was legally binding and offenders

4
could be prosecuted by the state in a criminal court. The onus, however, was on an industrial council to enforce its agreements.
One of the most important features of the Act, however, was that it excluded pass-bearing Africans from the definition of an ‘employee’, meaning that these workers were excluded from representation on industrial councils and also excluded from the agreements reached by industrial councils. This essentially resulted in the development of a dual system of industrial relations defined by race (Godfrey, 1992: 14).
The voluntary nature of the industrial council system meant that industrial councils developed in diverse and uneven ways. The envisaged system of national industrial councils did not materialise due to a variety of factors such as the exclusion of African workers, low levels of trade union organisation, the geographic patterns of industrial development and deep racial and skills divisions between trade unions. As a result, many local and regional industrial councils developed, with a limited number of national councils. Many of the councils were dominated by employer organizations due to weak trade union organisation, while on the trade union side representation was dominated by artisan and pseudo-artisan unions, especially white craft unions (Godfrey & Macun, 1991: 7). These trade unions used the councils for the exclusive benefit of their members and to the detriment of unorganised or poorly organised sectors of the labour market.
The Wage Act was introduced in 1925 as a companion to the Industrial Conciliation Act. The Act established a Wage Board to make recommendations on minimum wages and working conditions. The Board was appointed by the Minister of Manpower for a specific period and undertook investigations and made recommendations to the Minister before a wage determination was made for a specific area, sector of categories of employees. The Minister was under no obligation to make a wage determination based on the recommendations of the Board. In addition, the Board advised the Minister on exemptions and extensions to a wage determination (Standing et al., 1996: 143,144). The Wage Act essentially sought to provide minimum wages for white workers that did not fall within the industrial council system (Republic of South Africa, 1996: 63).
Wages were also regulated through so-called ‘labour orders’ which were introduced as an amendment to the LRA in 1981. These were designed to regulate wages mostly at the bottom end of the labour market. In those industries that were not governed by industrial councils, any group of employers could approach the Minister of Manpower with a proposal on wages and other conditions of employment for the workers they employed, and they could request that such proposals be made binding on all employers and employees in the industry, area or trade concerned. After consultation with the Wage Board and consideration of representation, the Minister could issue a labour order to implement the proposals. The order was published in a Government Gazette in a manner similar to which wage determinations were published and remained applicable until superceded by any other wage regulating measure that was determined to be binding (Standing et al., 1996: 144).

5
In the absence of an industrial council agreement, a wage determination or a labour order, the provisions of the Basic Conditions of Employment Act (BCEA) of 1983 applied (Standing et al., 1996: 133). Wages could be determined through enterprise or company level bargaining. In non-unionised sectors and firms, however, employment conditions, including wages, were often determined unilaterally by management and took the form of individual contracts. In higher-level occupations and for higher skilled workers, employment conditions also took the form of individual contracts (RSA, 1996: 54). Industrial Council agreements superceded both the BCEA and Wage Act in terms of matters covered by the agreement (Standing et al., 1996: 147).
Functions and Powers of the Industrial Councils
The legislation only provided a skeletal framework and the details were left to the individual councils themselves to negotiate and agree upon, with the result that councils had different degrees of scope. Councils could negotiate on any matter of mutual interest to employers and employees. Most industrial councils, however, negotiated on matters related to wages, working conditions and benefit funds. A council also established procedures for dealing with disputes arising within its jurisdiction.
An equal number of persons from the employer and trade union organisations had to be appointed to represent the two parties in the council, and these representatives constituted the bargaining forum that conducted the actual negotiations. The forum met periodically according to its constitutional requirements to attend to its business, as well annually or biannually to negotiate on its main agreement (Godfrey, 1992: 8). The main agreement of an industrial council referred to the agreement that prescribed minimum wage rates and conditions of work. Once the main agreement was published, the full agreement was generally never renegotiated. Trade unions could submit proposals for amendments to the main agreement. Negotiation would then take place between the unions and employer parties. After successful conclusion of the negotiations, the new set of agreements was presented to the Minister of Manpower, who published a notice renewing and amending the main agreement (including the period of the renewal). An entirely new agreement was usually only published after a number or years (Godfrey, 1992: 9).
The councils appointed full-time officials to staff the council in order to attend to its day-to-day operations. These usually included a secretary, a number of designated agents, and administrative personnel. The majority of the councils were financed by a levy (usually prescribed in the main agreement) imposed on all employers and employees within the council’s jurisdiction (Godfrey, 1992: 8).
Some councils established benefit funds (e.g. pension funds and sick pay funds) in the main agreement or in separate agreements. Benefit fund agreements were generally not renegotiated very often and remained in place much longer than the main agreement. Councils usually established sub-committees to oversee the operation of the benefit fund (Godfrey, 1992: 10).

6
A sub-committee within the council was usually set up to deal with disputes within its jurisdiction. The idea of self-governance meant that it was the task of the council to maintain industrial peace within their area of jurisdiction as well as to provide a forum through which disputes in their area of their jurisdiction could be settled (Godfrey 1992: 7).
The low level of registered trade union organisation and diversity of trade unions meant that employers generally had the balance of power in industrial councils. They dictated the levels at which bargaining took place in the councils and this, for example, resulted in relatively low levels of stipulated wage minima, particularly for less skilled employees (Godfrey & Macun, 1991: 7). The fact that pass-bearing Africans were not defined as employees and, therefore, not included in the system of industrial councils, only served to reinforce the weak bargaining power of African employees. Internalised management of industrial relations within the workplace, the initial aim of the industrial council system, implied adequate representation for all concerned. However, unskilled workers were poorly represented, as the majority of them were African. The exclusion of pass-bearing Africans also led to the replacement of white workers by African workers in the semi and unskilled work categories, because they could be paid less than the wage prescribed for white workers in the agreement. In 1930, however, the Act was amended to allow the Minister of Manpower to extend the wage and maximum hours of work clauses to pass-bearing African workers that fell within the jurisdiction of the relevant industrial council. African workers were, however, still excluded from representation on the councils (Godfrey, 1992: 17).
Development of a Dual Industrial Relations System
The Industrial Conciliations Act was successful in reducing strike action compared to pre-1924 levels and in boosting trade union as well industrial council participation. It also had some less satisfactory consequences and these were highlighted by the Industrial Legislation Commission’s review (the first notable one) of the industrial council system in 1935 (Godfrey, 1992: 14, 15). One of the main concerns raised by the commission was the huge gap between skilled and unskilled wages in South Africa, and the way in which craft unions had used the Industrial Council system to entrench this gap. The commission also noted that in many cases trade unions did not negotiate for less-skilled workers and, therefore, these workers were not covered by industrial council agreements. Another identified failure of the industrial council system was the limited number of national industry-wide councils that were created, which was mostly the result of the domination by craft councils (Godfrey, 1992: 18, 19).
As a result of the findings of the commission, the Industrial Conciliation Act of 1924 was repealed and replaced by the Industrial Conciliation Act No 36 of 1937. This new act sought to improve the protection of the interests of workers not party to industrial councils. The act provided for an inspector to attend industrial council meetings to represent the interests of workers not represented by trade unions. It also provided for the extension of all of the provisions of an agreement to pass-bearing African workers, and not just those pertaining to working hours and wages (Godfrey, 1992: 20).

7
In 1941, the formation of the Congress of Non-European Trade Unions (CNETU) constituted a milestone, and by 1945 there were about 158 000 workers represented in 119 unions (SALDRU, 1990: 3). Though these African unions represented a substantial number of people, they did not fall within the legal system and remained vulnerable. In 1946, the state crushed a historic 75 000 strong, African migrant mineworker strike, but it was clear that African workers were gaining organisational strength. This was, in turn, used by the National Party to fuel White fears.
In 1948, the National Party came into power in South Africa and appointed another Industrial Legislation Commission with the intention to revise industrial regulation and bring it in line with the apartheid policy (Godfrey, 1992: 20, 21). The commission found that the wage gap between the skilled and unskilled workers persisted after the introduction of the new Industrial Conciliation Act in 1937 and continued to reflect racial discrimination (Godfrey, 1992: 21). In addition, the commission found that inspectors representing African workers’ interests at industrial councils were ineffective as they were not familiar with the needs of African workers and found it difficult to handle competing demands of employers and employees. The commission called for the establishment of a co-ordinating body to co-ordinate wages and other conditions of employment (Godfrey, 1992: 22).
The government did not, however, adopt the proposal of a co-ordinating body, but did make changes to labour legislation that would impact on the development of the industrial council system. First, the Native Labour (Settlement of Disputes) Act of 1953 excluded Africans from registered unions and prohibited them from taking part in strike action. The foundation for a dual system of industrial relations was laid with the Act providing for the representation of African workers by liaison and works committees to negotiate conditions of employment with employers (Van der Berg & Bhorat, 1999: 7). In addition, the pass laws were amended to include African women, who were now forced to resign from registered trade unions and were no longer eligible to be represented on industrial councils (Godfrey, 1992: 25).
In 1956 the Industrial Conciliation Act of 1937 was repealed and replaced by the Industrial Conciliation Act, 28 of 1956. The key change was the separation of trade unions along racial lines, meaning that White workers were separated from Coloured and Asian workers. African workers were still excluded from registered trade unions. If the numbers by race group were too small to create separate unions, separate branches by race could be created in the same union. However, only White members were allowed seats on trade unions’ executive bodies. As a result, trade unions became weaker as they now competed against each other at negotiations rather than collectively negotiating with employers (Godfrey, 1992: 25).
Massive strikes by African workers occurred in 1973 and signalled the failure of the dual industrial relations system. In response to this, the government amended the Native Labour (Settlement of Disputes) Act to restrict African trade union organisation and the name of the act was changed to the Black Labour Relations Act of 1973 (Godfrey, 1992: 26). Government’s measures proved inadequate and the system of liaison and work-committees was rejected by the majority of African workers in favour of independent trade unions.

8
In the seventies, the power of African workers grew considerably and by 1979 there were 34 unregistered African unions. As these unions were not recognised legally, their activities increasingly emphasised the shortcomings of the existing dual system of labour regulations as in some instances the industrial regulations were being bypassed as employers recognised and bargained with African unions (SALDRU, 1990: 5).
In 1977, the Wiehahn Commission of Inquiry into Labour Legislation as appointed. They recommended that African workers be allowed to join registered trade unions, while unions should be allowed to admit members from any race group. This implied that African workers would be allowed direct representation on industrial councils. In 1979 the government adopted the recommendation of the Wiehahn Commission and amended the Industrial Conciliation Act to change the definition of an “employee” to include African workers with permanent urban residency. Following much criticism, the Act was amended a second time in 1979 to include African contract workers and commuters in the definition. Participation in an industrial council was, however, conditional on trade union registration in terms of the Act. African trade unions were reluctant to register and increasingly pursued plant-level bargaining outside the industrial council system (Godfrey, 1992: 27).
In 1981 the Industrial Conciliation Act was once again amended and the administrative controls imposed on registered trade unions were extended to unregistered trade unions, including African trade unions. The amendment also repealed the Black Labour Relations Regulation Act and effectively ended the dual system of industrial relations. In addition, this amendment changed the name of the Industrial Conciliation Act to the Labour Relations Act (LRA)2 (Godfrey, 1992: 27).
The unregistered trade unions remained reluctant to participate in the industrial council system and perceived plant-level bargaining as best suited to their own structural requirements and democratic goals as well as the best way to bargain. In addition, these unions felt that the industrial council system was best suited to the needs of craft unions and unions that represented racial minorities. The need for national, regional or industry-wide agreements was acknowledged to provide for unorganised workers, but as complementary to plant-level bargaining (Godfrey, 1992: 28, 29).
During the 1980s the African trade union movement grew and with this came greater support for participation in central bargaining. In 1982 at the Second Congress of African unions, some of the larger unions called for greater participation in centralised bargaining, claiming that it would be more effective than plant level bargaining. The Federation of South African Trade Unions (FOSATU), the largest federation of independent trade unions at the time, agreed to participate in the industrial council system on the condition that workers could join a union of their choice and that bargaining at industrial council level would not preclude plant-level bargaining (Butcher & Rouse, 2001: 352).
2 Now referred to as the Labour Relations Act (LRS) of 1956.

9
The rapid growth of trade unions placed a strain on the organisational and human resources of these unions and created pressure on unions to centralise bargaining arrangements. Industrial councils provided a forum through which this could be done. The Metal and Allied Workers Union (MAWU), an affiliate of FOSATU, was the first to apply for permission to join an industrial council and subsequently joined the Iron, Steel, Engineering and Metallurgical Industry industrial Council (SALDRU, 1990: 7).
The formation of the Congress of South African Trade Unions (COSATU) in 1985 led to a series of mergers as affiliates sought to comply with COSATU’s policy of one union in one industry. However, the established industrial councils were not adequately prepared to deal with the interests of these unions, which conflicted sharply with their own. The unions’ attempts to gain membership to councils and restructure the councils to suit their own needs led rising instability within the industrial council system (Godfrey, 1992: 31).
In addition, plant level bargaining had seen progressive trade unions securing wage increases far in excess of the minimum levels set at industrial councils. While the unions participated in the industrial council system, many continued to pursue plant-level bargaining. The essence of the industrial council system was to bargain at one level only and many of the employer parties to the councils were opposed to continuing or entering into dual level bargaining to accommodate the emerging trade unions, contributing to further instability within the system (Godfrey, 1992: 31).
As noted above, there were other avenues of wage determination, including the Wage Board. The Wage Board, however, became less active in the years leading up to 1994. Its coverage had declined and its determinations were not updated regularly. It was also found that the determinations were rarely enforced (RSA, 1996: 63).
2.1 Bargaining Councils in the Labour Relations Environment since 1994
The incoherent and inconsistent, and in many cases, still racist, system of industrial relations which characterised the pre-1994 era was clearly in need of significant overhaul with the advent of democratic rule. Within the labour market policy environment, the immediate period following the election of the majority government was characterised by a frantic process of recasting the country’s labour regulatory environment. The outcome of these negotiations between employers and employees and the significant rewriting of laws, was manifest in four key pieces of legislation. These were the Labour Relations Act (LRA) of 1995, the Basic Conditions of Employment Act (BCEA) of 1997, the Employment Equity Act (EEA) of 1998 and the Skills Development Act (SDA) of 1999. The LRA and BCEA were amended in 2002, while the Employment Equity Act was amended in 2006.
The LRA and the BCEA are the two key pieces of regulation governing bargaining councils and wage determination and are therefore discussed in more detail here.

10
Bargaining Councils and the Legislative Environment
The purpose of the LRA is to “advance economic development, social justice, labour peace and the democratisation of the workplace by fulfilling the primary objectives of the Act” (RSA, 1995: 8). The LRA regulates the organisational rights for trade unions, entrenches the right to strike, regulates collective bargaining, as well as regulates dispute resolution and dismissal procedures (Bhorat et al. 2002: 43)
The LRA provides the legislative framework for the establishment of bargaining councils. In terms of the legislation, one or more registered trade unions and one or more registered employers’ organisations may establish a bargaining council for a sector and area. The Act also provides for the State to be a party to any bargaining council if it is an employer in the sector and area in which the bargaining council is established (RSA, 1995: 22).
Section 29 of the LRA regulates the process and requirements for the registration of a bargaining council (RSA, 1995: 22-24). In terms of this section, parties wishing to establish a bargaining council have to apply to the registrar of labour relations for registration of the bargaining council. After receiving the application the registrar is required to publish a notice in the Government Gazette, allowing the general public the opportunity to object to the application. The LRA sets out the steps to be followed by the person who objects as well as the applicant. The registrar is also required to send a copy of the notice to the National Economic and Development Council (NEDLAC).3 It is NEDLAC’s responsibility to evaluate the appropriateness of the sector and area in respect of which the bargaining council is proposed and provide the registrar with a written report. If NEDLAC cannot make a decision on the demarcation, the Minister of Labour has to advise the registrar. When considering the application the registrar has to determine, amongst other things, whether the constitution of the proposed bargaining council complies with the requirements set out in Section 30 of the LRA; if it has made adequate provision for the representation of small and medium enterprises on the council; and if the parties to the council are sufficiently representative of the sector and area as determined by NEDLAC or the Minister of Labour. If the registrar is satisfied that the applicant meets all the requirements for registration, the bargaining council is registered by entering the council’s name in the register of councils. If the requirements are not met, the applicant is allowed 30 days to comply with the requirements.
Section 30 (RSA, 1995: 24, 25) of the LRA, lists the requirements applicable to the constitution of a bargaining council. It covers representation (half of the representatives must be appointed by party trade unions, while the other half must be appointed by the party employers’ organisations), processes of meetings and procedures for decision making, as well as the procedures to be followed if disputes arise. In addition, this section prescribes that the constitution should include the procedure for exemption from collective agreements.
3 Nedlac was launched in 1995 as a forum where Government, organised business, organised labour and organised community
groupings meet on a national level to discuss and reach consensus on issues of social and economic policy (see www.nedlac.org.za).

11
Section 31 (RSA, 1995: 25, 26) explains the binding nature of collective agreements concluded in a bargaining council, with regard to the parties of the agreement.
Section 32 (RSA, 1995: 26, 27) regulates the extension of collective agreements concluded in a bargaining council. In terms of the LRA, a bargaining council can request the Minister of Labour in writing to extend a collective agreement to non-parties which fall within its jurisdiction. A number of provisions (See Section 32) have to be satisfied in order for the Minister to agree to extend a collective agreement. This includes that the trade unions whose members constitute the majority of the members of the party trade unions and the party employee organisations that employ the majority of workers must vote in favour of the extension. If the Minister is satisfied that all requirements have been met, the collective agreement is extended by publishing it in the Government Gazette.
Section 33 makes provision for the appointment and powers of designated agents of bargaining councils, who can promote, monitor and enforce compliance with any of the council’s collective agreements. Section 33A regulates the enforcement of collective agreements by bargaining councils, while Section 34 provides for the amalgamation of bargaining councils (RSA, 1995: 27-29).
Part D of the LRA (RSA, 1995: 29-30) specifically provides for the establishment of bargaining councils in the public service. The Act prescribes the establishment of the Public Service Co-ordinating Bargaining Council for the public service as a whole. Section 37 gives the Public Service Co-ordinating Bargaining Council the authority to designate a particular sector of the public service for the establishment of a bargaining council or to change the designation of, amalgamate or dissolve existing public sector bargaining councils. Section 38 provides for the resolution of disputes between bargaining councils in the public sector.
The second important piece of legislation in terms of bargaining councils is the Basic Conditions of Employment Act (BCEA) of 1997. The BCEA and its amendments establish, enforce and regulate the basic conditions of employment. This includes the regulation of working time and hours of work (including overtime), different categories of leave (annual, sick and maternity), particulars of employment and remuneration, termination of employment; prohibition of employment of children and forced labour (RSA, 1997).
Chapter 7 of the BCEA regulates the variation of the basic conditions of employment. Section 49 of Chapter 7 specifically allows for a collective agreement that has been negotiated in a bargaining council to alter, replace or exclude any basic condition of employment if the collective agreement is consistent with the purpose of the BCEA and does not infringe on employees’ entitlement and rights as set out in the BCEA (RSA, 1997: 21). It is in this sense, therefore, that the BCEA sets the minimum floor of rights for all employed individuals in the South African labour market.
Chapter 9 of the BCEA makes provision of the establishment of an Employment Conditions Commission (ECC). The functions of the ECC include advising the Minister of Labour on the appropriate level for minimum wages set by sectoral determinations as well as on trends in

12
collective bargaining and whether these trends undermine the purpose of the BCEA (Bhorat, et al., 2002: 48; RSA, 1997: 25). The ECC is the post-apartheid successor to the Wage Board. While we turn to this in greater detail below, the ECC serves as a regulator of last resort. In the event therefore that no bargaining councils exist and/or no representative trade union is present in a sector, the ECC has a regulatory function.
Functions and Powers of Bargaining Covariates
• To conclude and enforce collective agreements
• To prevent and resolve labour disputes
• To perform certain dispute resolution functions
• To establish and administer a fund to be used for dispute resolution
• To promote and establish education and training schemes
• To establish and administer pension, provident, medical aid, sick pay, holiday, unemployment and training schemes or funds or any similar schemes or funds for the benefit of one or more of the parties to the bargaining council or their members
• To develop proposals for submission to NEDLAC or any other appropriate forum on policy and legislation that may affect the sector and area of jurisdiction of the bargaining council
• To determine by collective agreement the matters which may not be an issue in dispute for the purposes of a strike or a lock-out at the workplace
• To confer on workplace forums additional matters for consultation
• To provide industrial support services within the sector
• To extend the services and functions of the bargaining council to workers in the informal sector and home workers
Source: RSA, 1995: 22, 23
Bargaining Councils in Practice
All the existing industrial councils established under the “old” LRA were deemed to be bargaining councils under the new LRA (Bhorat et al. 2002: 48). Currently, bargaining councils range from very large national councils to small regional or local councils (see Godfrey et al., 2006: 6). Bargaining councils potentially cover employees in the private sector who are classified as semi-skilled or unskilled and working for employees. This means that when we look at the classifications in the Labour Force Survey, the occupation categories four to nine are included (Godfrey et al., 2006). Managers, Professionals and Technicians and Associate Professionals are generally excluded from bargaining council membership. These

13
exclusions are not prescribed by law, but rather a historical artefact. This, however, only applies to the private sector. In the public sector, the situation is different, with Professionals and even certain levels of management covered by the public sector bargaining councils.
As note above, the LRA (1995) called for the establishment of a bargaining council for the public services as a whole, called the Public Service Co-ordinating Bargaining Council (PSCBC). The LRA gave the PSCBC the authority to designate a sector of the public service for the establishment of a sectoral bargaining council.
Before 1994, remuneration in the public sector was set by a commission. No formal negotiations took place, but staff associations representing White workers in the public service were consulted. Unions representing African workers were excluded from consultation (Hassan, 2003).
In 1997, the constitution of the PSCBC was registered. In line with provisions in the LRS, the PSCBC designated four sectors for the establishment of sectoral public service bargaining councils (PSCBC, 2005). The councils and their scope are the following (note that in all cases the employer is the State):
• Education Labour Relations Council (ELRC): “educators” employed in the national and provincial departments of education
• Public Health and Welfare Sectoral Bargaining Council (PHWSBC): employees in national and provincial departments of health and social development as well as health professionals in other departments.
• Safety and Security Sectoral Bargaining Council (SSSBC): employees in the South African Police Service and the national department of safety and security.
• General Public Service Sectoral Bargaining Council (GPSSBC): all national and provincial public service employees that falls within the scope of the PSCBC, but outside the scope of the other three sectoral councils.
As the name suggests, the PSCBC fulfils a co-ordinating function. It is also responsible for overall policy formation on dispute resolution. Importantly, wages are negotiated in the PSCBC. A collective agreement signed in the PSCBC is automatically binding on sectoral councils, unless a sectoral council has an agreement in place on the same issue (PSCBC, 2005). Only senior managers fall outside the scope of public sector bargaining councils. Certain levels of management and all professional staff are therefore covered by collective bargaining in the public sector (Personal communication with Hassan, 2007). As we note in greater , nuanced and analytical detail below, the PSBC remains central to the understanding of the determinants of wages and wage formation in the post-apartheid South Africa labour market.
One addition to the above public sector bargaining councils is that of local government employees. The local government sector falls under the jurisdiction of the South African Local Government Bargaining Council (SALGBC). The Interim SALGBC was established in 1997,

14
followed by the registration of the SALGBC in 2001 (see SALGBC website). Its powers and functions include the negotiation of minimum wages and conditions of employment in the local government sector. Again, professional staff are included in the collective agreements, with only Municipal Managers and managers reporting to those Municipal Managers excluded from the bargaining council (SALGBC, 2003: 3).

15
3. The Nature of Wage Formation in the South African Labour Market
In addition to bargaining councils, wages can also be set or negotiated in a number of other ways, either as part of the statutory system of wage determination or outside the statutory system. This section sheds more light on the other avenues of wage formation in the South African labour market.
Sectoral Determinations
Along with bargaining councils, sectoral determinations fall under the statutory system of collective bargaining and wage determination. The Minister of Labour can make a sectoral determination that establishes basic conditions of employment for employees in a specific sector and area. A sectoral determination has to be made in accordance with the provisions in Chapter 8 of the BCEA and by publishing a notice in the Government Gazette (RSA, 1997: 23). A sectoral determination arises in essence out of a process of research and consultation between the relevant employers and employees in the sector, DoL officials and the advisory board, the ECC, reporting to the Minister of Labour.
A sectoral determination, as noted above, may set minimum terms and conditions of employment, including minimum wages. It may also provide for the adjustment of minimum wages, regulate the manner, timing and other conditions of payment of remuneration as well as prohibit or regulate payment of remuneration in kind (RSA, 1997: 25). The Minister of Labour may not publish a sectoral determination covering employees and employers who are already covered by a collective agreement concluded at a bargaining council. If a collective agreement is concluded in an area covered by a sectoral determination, the provisions of the sectoral determination will no longer be applicable to the parties covered by the bargaining council agreement (RSA, 1997: 25).
Currently (September 2007) the following areas of economic activity (not easily reduced to formal sectors and sub-sectors) have sectoral determinations in place (DoL, 2007):
• Forestry
• Agriculture
• Contract Cleaning
• Children in the Performance of Advertising, Artistic and Cultural Activities (applicable to children under 15 years).
• Taxi Operators
• Civil Engineering
• Learnerships
• Private Security

16
• Domestic Workers
• Wholesale and Retail
• Hospitality
These SD’s are regularly updated for inflation through a formal gazetting process.
Non-Statutory Collective Bargaining and Wage Determination
Outside the statutory system of wage determination, collective bargaining takes place in non-statutory centralised bargaining fora as well as at a company and plant level (Godfrey, 2007: 3).
Currently, centralised non-statutory bargaining takes place in mining, automobile manufacturing and the pelagic fishing sector.4 In the mining sector, centralised bargaining takes place only in the gold mining and the coal mining industries. The Chamber of Mines is the employers’ organisation which bargains on behalf of its gold and coal mining members with the relevant unions, dominated by the National Union of Mineworkers (NUM). It has been estimated that the centralised bargaining agreement covered about 69 percent of employees in the gold mining industry in 2002. Coverage in the coal mining industry is much lower, estimated at about 36 percent in 2002. Most of the members of the Chamber of Mines in these two industries are covered by the collective agreements. Gold and coal mines which are not members of the Chamber are covered by firm-level or mine-level collective bargaining agreements (See Godfrey, 2007 for more detail). For example, while the majority of platinum producers are members of the Chamber, the industry is mostly covered by company specific agreements. The main employers in the diamond mining industry are also Chamber members, but again they are party to company-specific agreements (Chamber of Mines, 2007).
The National Bargaining Forum (NBF) for the automobile industry was established in 1990. The parties to the NBF are the National Union of Metal Workers of South Africa (NUMSA) and the seven Original Equipment Manufacturers in the country.5 The NBF produces three-year agreements, with the main focus on setting wages and conditions of employment.
In the centralised bargaining forum for the pelagic fishing sector, employers are represented by the South African Pelagic Fish Processors Association and employees by the Food and Allies Workers Union (FAWU). The forum meets once a year to bargain over wages and conditions of employment, while other issues are dealt with as they arise. The collective agreement covers about 5 000 workers.
Apart from non-statutory centralised collective bargaining, non-statutory bargaining also takes place at a decentralised or single-employer level, with examples found in retail and food
4 This section on non-statutory centralised bargaining draws on Godfrey, 2007 5 These are Toyota, VWSA, General Motors, Nissan, BMW, Ford and Daimler Chrysler.

17
manufacturing. For example, in the case of the Wholesale and Retail Trade sector, collective bargaining only covers a small fraction of the sector, with the remainder covered by the sectoral determination. The South African Commercial, Catering and Allied Workers Union (SACCAWU) is the major union in the sector and bargains with national groups, medium-sized firms as well as small firms. The national firms include the major food, retail and furniture chains. Most of the firms bargain at a national level for the entire chain. If they have independent operations or franchise stores as part of the group, the bargaining unit does not cover these. There are exceptions, however, where the bargaining has been decentralised to each individual store. In the food manufacturing sector, bargaining takes place at different levels depending on the core business of the firms. Certain companies negotiate at a central level for different sub-sectors, while others negotiate at plant level.
Ultimately, though, it should be clear that wage formation in South Africa is characterised by a number of features which run the gamut from firm-level bargaining to state-mandated wages for organised workers. In all cases, however, these wages are determined and negotiated through representation from employers and employees.
Extensions of and Exemptions from Bargaining Council Agreements
As noted above, the LRA sets out the procedures that have to be followed in order to have a collective agreement extended to non-parities. This includes that the Minister of Labour has to be satisfied that the trade unions whose members constitute the majority of the members of the party trade unions and the party employer organisations that employ the majority of workers voted in favour of the extension. A collective agreement is extended by publishing it in the Government Gazette.
One of the main criticisms levelled against the extension of bargaining council agreements is that large firms dominate the employer party bargaining during negotiations. These agreements (via the extensions) are then imposed on parties that did not take part in the negotiations, particularly affecting non-party SMMEs. The aim of the requirements in the LRA is therefore to ensure that representivity thresholds are met before an agreement can be extended and that SMMEs are adequately represented on councils (Godfrey et al., 2006: 1). The extension to non-parties was the subject of fierce debate in the mid-1990’s in terms of the unintended consequence it ostensibly had in increasing regulatory oversight and labour costs for SMMEs. While it is generally difficult to accurately estimate the share of workers covered by extensions of bargaining council agreements, Godfrey et al. (2006: 24) has found that of the estimated 32,6 percent of formally employed workers (with the total excluding all Managers and Professionals in the private sector) covered by bargaining councils, only 4,6 percent were covered by extensions to agreements. In other words, extended bargaining council agreements covered a very small share of the labour force. This initial evidence does suggest that the extension to non-parties as a source of potential rigidity in the labour market, may be overstated. Put differently, the evidence that non-parties to the main bargaining council agreement suffered as a consequence of the automatic extension clause is not particularly strong.

18
The LRA, in addition, however, also requires the constitution of a bargaining council to describe the procedures to be followed for a company to obtain exemption from some or all the clauses of an agreement. In order to comply with this, most councils have developed criteria for evaluating requests for exemptions as well as established independent bodies to hear appeals when an exemption has been denied. The criteria are usually published in their collective agreements. The agreements can include up to eight or nine criteria without any indication, though, of the weight of the criteria when an application for exemption is considered (Godfrey et al., 2006). This exemption system is the most important way in which the legislation accommodates SMMEs who may not be able to comply with the requirements of bargaining council agreements. Both employer parties and employers who are not parties (and therefore covered by the extension of an agreement) can apply for exemptions (Godfrey et al., 2006: 65).
Godfrey et al, (2006: 71-79) examined the data on exemptions from 17 bargaining councils for 2000, 2002 and 2004. They found that for those years between 72 percent and 78 percent of applications for exemptions were granted, either in full, partially or conditionally. The majority of applications were granted in full. They compared these results with data obtained from the DoL for 2003 and 2004. The DoL data covers 44 councils in 2003 and 37 councils in 2004 and shows a slightly higher success rate of about 80 percent. The evidence here is that almost 80 percent exemptions are granted. This reinforces the view that the notion that the extensions-exemptions clauses within the regulatory environment cannot legitimately be viewed as a source for rigidity in the domestic labour market.
The remainder of the paper will attempt to evaluate the impact of industrial councils in 1995 and bargaining councils in 2005 on wage formation in the South African labour market. Specific issues will be addressed, including the extent of industrial/bargaining council agreements in terms of the estimated share of workers covered by agreements. Another important issue is whether membership of a bargaining council affords a wage premium to those workers covered by the agreements.
19
4. Data and Descriptive Overview
4.1 Data Sources and the Construction of Industrial and Bargaining Council Coverage
In order to be able evaluate the wage premium (if any) associated with membership of an industrial or bargaining council, we first had to estimate the number of workers covered by industrial council agreements in 1995 and bargaining council agreements in 2005.
The two sources of aggregate employment and wage data were the 1995 October Household Survey (OHS) and the September 2005 Labour Force Survey (LFS), both of which are nationally representative household surveys. The OHS was conducted annually between 1994 and 1999. The LFS is a biannual survey introduced in 2000 to replace the OHS, with its first useable round conducted in September 2000. The 1995 OHS has been weighted using the 1996 Census weights, while the LFS has been weighted using the 2001 Census. These surveys, however, did not capture any information on workers belonging to industrial or bargaining councils and coverage had to be estimated using complementary sources of information.
Industrial council coverage for 1995 was estimated using the Industrial Council Digest (Godfrey, 1992) and the 1995 OHS. The Industrial Council Digest contains key information on the industrial councils that operated in the South African labour market in 1992. It provides the name of the industrial council; the trade union and employer organisations that were party to the council; the scope of the council; the geographical area the council covered, and in some instances the number of employees covered by the council. The Digest also indicates whether the council had become inactive. The information on the scope of the councils was used to identify which sectors and occupations industrial councils covered. The Digest was therefore the source of the occupation, industry and geographical area covered by an industrial council.
The 1995 OHS contains information on the occupation, industry and the work district of workers. These are captured by the three digit International Standard Classification of Occupations (ISCO 88) codes, two digit Compact Economic Sector Codes and three digit district code. The occupation categories in the OHS are broad and do not include specific job titles as in the LFS. The industry categories in the OHS are also broader than those in the LFS, as it is recorded by a two digit code and not the more detailed three digit code. This meant that the occupations and industries used to estimate industrial council coverage in 1995 may have included occupations and sub-sectors which fell outside the industrial council system in 1995. Our estimation of the number of workers covered by industrial councils in 1995 is therefore likely to be an over-estimation of the actual coverage. It should also be noted that the district code matched was the work district recorded in the OHS and not the district of residence.
20
Although the Digest only covers industrial councils and agreements operating in 1992, following the example of Butcher & Rouse (2001) it was assumed that agreements were renewed annually and that these councils were still in operation in 1995. The Digest was the only reliable source available of industrial council coverage in the early nineties.6
The Digest does contain information on Municipality and Local Authority Industrial Councils, but according to the Digest none of these councils published Main Agreements that prescribed wages. They were therefore excluded from the analysis. Single company industrial councils were also excluded from the analysis, as the workers concerned were impossible to identify in the OHS. The analysis was restricted to 62 private sector industrial councils, listed in Appendix A. The assumptions made in terms of calculation of the coverage of individual councils can be found in the Technical Notes in Appendix C.
Bargaining council coverage for 2005 was calculated in a manner similar to the industrial council coverage for 1995. The most recent list of Bargaining Councils obtained from the Department of Labour (DoL) website is dated 1 July 2006. This list was used as the starting point for the estimation of bargaining council coverage using the 2005 LFS. The DoL list was compared with information from the CASE database (reference???) as well as the list of bargaining councils in Godfrey et al. (2006: 101,102). Forty-eight bargaining councils were included in the analysis for 2005 and these are listed in Appendix B.
Similar to the OHS, the LFS records information on the occupation and industry of workers. The LFS contains a more detailed level of information than the OHS, with industry captured by the three digit Standard Industrial Classification (SIC) code and occupation captured by the four digit South African Standard Classification of Occupations (SASCO) code. In addition, the area of residence of the worker is captured, but not the work district.
As noted above, the scope of a bargaining council is defined by sector, area and/or occupation groups. Using this information for each bargaining council we were able to estimate bargaining council coverage for the workforce in the LFS. In terms of obtaining the scope of each bargaining council, three main sources of data were utilised, namely the Award database from the Labour Research Service7, the Government Gazette notices of the extension of bargaining council agreements and the websites of bargaining councils where available.
As was the case with the 1995 data, certain assumptions had to be made. It was not possible to accurately match all job titles listed in the agreements to the occupation titles in the code list of the LFS. If a job title could not be matched with an appropriate occupational title (either exactly the same title or where certain key words were the same) they were not included in
6 It was impossible to find information on the extensions of, and exemptions from, industrial council agreements. Given the
broadness of the estimated coverage, we can assume that any extensions of agreements have automatically been included in our estimation.
7 The Actual Wage Rates Database (AWARD) is managed by the Labour Research Service and contains information on wage and conditions of employment in the formal economy. It also contains information of some of the wage agreements concluded in bargaining councils. For more information see http://award.lrs.org.za/home.php

21
the coverage. Fortunately this only happened in a very small number of cases (more information can be found in the Technical Notes in Appendix D). Where a bargaining council is regional in scope, the area is defined in terms of magisterial districts. In the LFS, area of residence is captured as a metro council or district council, which are generally larger areas than municipal districts, meaning that in terms of geographical area, the coverage of certain regional bargaining councils may have been slightly over-estimated. The LFS does not capture work district, therefore the area of residence had to be used.
Finally, there are the two issues of exemptions from bargaining council agreements, and extensions of agreements to non-parties. Again, it was impossible to capture the exemptions granted from provisions of the bargaining councils. In terms of the extensions of agreements, we are fairly confident that most of these were included in the estimation of coverage. For the majority of bargaining councils we were able to obtain Government Gazette Notices. A bargaining council agreement is only published in a Government Gazette if the Minister has given permission that it can be extended to non-parties, meaning that all employers and employees in that industry, area or occupation group are covered by the agreement.
Ultimately, though, through the above, we were able to derive a uniquely coded representation of Bargaining Councils and its8 membership for all workers employed in 1995 and 2005. In doing so, this constructed dataset provides for a crucial pint of departure into our ability to analyse the nature and influence of this particular labour market institution.
4.2 Bargaining Council Membership, Employment and Earnings: A Descriptive Overview
Table 1 provides a snapshot of the changes in the labour market between 1995 and 2005. Over the period, the broad labour force9 increased by 46 percent. Although almost 3 million net new jobs were created between 1995 and 2005 (an increase of about 30 percent) it was not enough to absorb all the additional entrants to the labour market and broad unemployment increased by 84 percent.
8 In the remainder of this document, the term bargaining council will be used to refer to both industrial councils and bargaining
councils. 9 Those between 15 and 65 years of age that are willing and able to work (including discouraged workseekers).

22
Table 1: Descriptive Overview of the Labour Market, 1995 and 2005
1995 (‘000)
2005 (‘000)
Change (‘000)
Change (%)
Av. Annual Growth Rate (%)
Broad Labour Force 13,754 20,100 6,346 46.14 3.9 Employment 9,515 12,301 2,786 29.28 2.6 Broad Unemployment 4,239 7,800 3,561 84.01 6.3 Employed: Formal 8,120 8,039 -81 -1 -0.1 Non-formal (incl. self-employed) 1,394 4,261 2,867 205.67 11.8
Source: OHS 1995, LFS 2005: 2 (Statistics SA); Own Calculations
For the purposes of our analysis it is important to distinguish between those employed in the formal and non-formal sectors as bargaining council agreements potentially cover only formal sector workers working for an employer. We have therefore separated the number of employed into those in the formal sector and those in the non-formal sector. Our definition of non-formal sector employment includes all workers that are either in the informal sector10, self-employed or domestic workers. This definition is not strictly accurate in terms of conventional labour market analysis as it includes the (formally) self-employed in the non-formal sector, but it allows us to group together all those workers that fall outside the coverage of the bargaining council system. However, it should be noted that the OHS 1995 did not adequately capture informal sector employment, and therefore it is not possible to identify the informally employed in this survey. Therefore, the non-formal employment figure for 1995 only includes domestic workers11 and the self-employed.
Though the figures are not directly comparable due to the data issues highlighted above, we can see that the number of workers in formal employment remained relatively stable between 1995 and 2005, at just over 8 million. The large increase in the non-formal sector can be attributed to a much better collection of data on the informally employed in the LFS and a rapid rise in informal employment.
Bargaining Council Coverage by Sector, Occupation and Union Status
According to our estimates, in 1995, 15 percent of those in formal employment (almost 1,2 million workers) were covered by bargaining council agreements. This more than doubled to 2,5 million workers or 32 percent of the formally employed in 2005. The 2005 aggregate coverage estimate, however, masks the fact that more than half of those covered by bargaining council agreements in 2005 were employed in national, provincial and local government departments. Excluding the three spheres of government, 13 percent of those in formal employment were covered by bargaining council agreements in 2005. This translates
10 The LFS defines the informal sector as businesses that are not registered in any way. They are generally small in nature and
seldom run from business premises. They are instead run from homes, street pavements or other informal arrangements (Statistics SA, 2006: xxiv).
11 There is also some confusion over the definition of domestic workers in this survey. In our case only domestic workers in private households have been considered to be actual domestic workers.
23
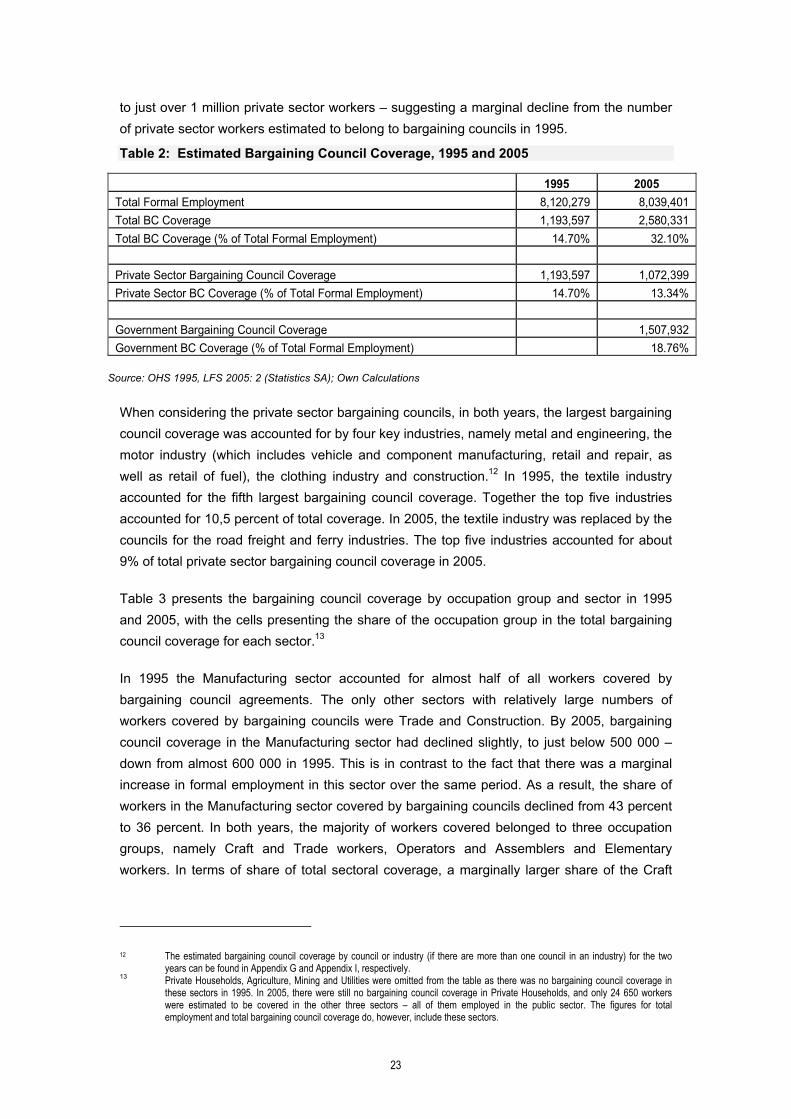
to just over 1 million private sector workers – suggesting a marginal decline from the number of private sector workers estimated to belong to bargaining councils in 1995.
Table 2: Estimated Bargaining Council Coverage, 1995 and 2005
1995 2005 Total Formal Employment 8,120,279 8,039,401 Total BC Coverage 1,193,597 2,580,331 Total BC Coverage (% of Total Formal Employment) 14.70% 32.10% Private Sector Bargaining Council Coverage 1,193,597 1,072,399 Private Sector BC Coverage (% of Total Formal Employment) 14.70% 13.34% Government Bargaining Council Coverage 1,507,932 Government BC Coverage (% of Total Formal Employment) 18.76%
Source: OHS 1995, LFS 2005: 2 (Statistics SA); Own Calculations
When considering the private sector bargaining councils, in both years, the largest bargaining council coverage was accounted for by four key industries, namely metal and engineering, the motor industry (which includes vehicle and component manufacturing, retail and repair, as well as retail of fuel), the clothing industry and construction.12 In 1995, the textile industry accounted for the fifth largest bargaining council coverage. Together the top five industries accounted for 10,5 percent of total coverage. In 2005, the textile industry was replaced by the councils for the road freight and ferry industries. The top five industries accounted for about 9% of total private sector bargaining council coverage in 2005.
Table 3 presents the bargaining council coverage by occupation group and sector in 1995 and 2005, with the cells presenting the share of the occupation group in the total bargaining council coverage for each sector.13
In 1995 the Manufacturing sector accounted for almost half of all workers covered by bargaining council agreements. The only other sectors with relatively large numbers of workers covered by bargaining councils were Trade and Construction. By 2005, bargaining council coverage in the Manufacturing sector had declined slightly, to just below 500 000 – down from almost 600 000 in 1995. This is in contrast to the fact that there was a marginal increase in formal employment in this sector over the same period. As a result, the share of workers in the Manufacturing sector covered by bargaining councils declined from 43 percent to 36 percent. In both years, the majority of workers covered belonged to three occupation groups, namely Craft and Trade workers, Operators and Assemblers and Elementary workers. In terms of share of total sectoral coverage, a marginally larger share of the Craft
12 The estimated bargaining council coverage by council or industry (if there are more than one council in an industry) for the two
years can be found in Appendix G and Appendix I, respectively. 13 Private Households, Agriculture, Mining and Utilities were omitted from the table as there was no bargaining council coverage in
these sectors in 1995. In 2005, there were still no bargaining council coverage in Private Households, and only 24 650 workers were estimated to be covered in the other three sectors – all of them employed in the public sector. The figures for total employment and total bargaining council coverage do, however, include these sectors.
24
Workers and the Elementary Workers were covered in 2005, with a decline in the share of Operators.
The number of Construction workers belonging to bargaining councils almost halved between 1995 and 2005, from 230 000 to just more than 114 000. This again, is in stark contrast to the more than 40 percent increase in formal sector employment in this industry. Overall, bargaining council coverage in this sector declined from 62 percent to 31 percent. In both years the majority (70 percent) of bargaining council members in this sector were Craft and Trade workers, with the second largest share being Elementary workers. In 2005, about a third of Construction workers belonged to bargaining councils were members of the public sector councils, meaning that the number of private sector workers that belonged to bargaining councils actually declined to about 84 000 – about a third of the number in 1995.
There was a slight increase in the number of workers covered by bargaining councils in the Wholesale and Retail Trade sector. Bargaining council coverage increased from about 20 percent to 24 percent of total employment in the sector. Looking at the breakdown of coverage by occupation in this sector, marginally fewer Clerks and Service workers belonged to bargaining councils in 2005, with a slight increase in the share of Professionals, Craft and Trade workers as well as Operators and Elementary Workers. Bargaining council coverage in the Transport sector more than doubled between 1995 and 2005, with the increase partly driven by the 50 000 workers belonging to the Transnet bargaining council. The share of workers in this sector covered by councils increased from about 18 percent to almost 42 percent. Membership of the State Owned Enterprise’s bargaining council significantly changed the occupational composition in this sector. In 1995, the majority of bargaining council members in this sector were Operators and Assemblers, with a 96 percent share. By 2005, this share has declined to 62 percent, while the share of Elementary workers covered more than doubled – from 4 percent to 11.5 percent. In addition, the Transnet bargaining council accounted for most of the Professionals, Clerical workers and Service Workers covered by Transport bargaining councils in 2005.
In 2005, total bargaining council coverage is dominated by the large number of bargaining council members in the Commercial, Social and Personal Services Sector, which in turn is dominated by members of the public sector bargaining councils. In fact, 1.3 million of the 1.5 million public sector bargaining council members (from three levels of government) were employed in this sector. This also accounts for the increased share and number of Professionals covered by bargaining councils in this sector. In 1995, 42 percent of the workers in the CSPS sector covered by bargaining councils were Professionals. In absolute terms this amounted to only 10 000 workers. By 2005, Professionals accounted for 52 percent of coverage in this sector, which is an increase of ten percentage points. In absolute numbers, however, the increase was huge, with more than 700 000 Professionals covered by bargaining councils in 2005. Overall, Professionals increased their share in total bargaining council coverage from 2 percent to 30 percent – driven largely by the increase in the number of Professionals covered in the CSPS sector. The second sector that benefited significantly from the increase in the bargaining council membership of public sector Professionals, was

25
the Financial and Business Services Sector, with the share of Professionals in total sectoral coverage jumping from zero to 30 percent. Again, membership of the public sector bargaining councils accounted for the bulk of the increase in bargaining council coverage in Finance in 2005, with both Clerks and Elementary Workers seeing huge increases in their share of sectoral coverage.14
14 These are workers that indicated in the LFS that they work in Finance in one of the three spheres of government.

26
Table 3: Bargaining Council Coverage by Occupation Group and Sector – % share of sector
Manufacturing Construction Wholesale & Retail Trade Transport
Financial Services
Commercial Services Total
1995 0.0 0.0 0.9 0.0 0.0 0.0 0.2 Managers 2005 0.0 0.0 1.1 0.0 0.0 0.0 0.1
1995 0.3 4.9 0.0 0.0 0.0 42.1 1.9 Professionals 2005 1.0 0.1 2.1 3.4 26.9 51.9 28.9
1995 4.4 0.0 10.5 0.0 0.0 0.0 4.6 Clerical Workers 2005 4.9 2.0 7.4 9.3 28.3 12.5 10.2
1995 0.0 0.0 55.5 0.0 0.0 43.9 13.5 Service & Sales Workers 2005 1.1 0.6 41.1 5.3 7.6 16.7 15.0
1995 0.0 0.0 0.0 0.0 0.0 0.0 0.0 Skilled Agriculture & Fishing Workers 2005 0.0 0.0 0.0 0.0 0.0 0.3 0.3
1995 28.0 70.6 32.6 0.0 0.0 0.0 34.9 Craft & Trade Workers 2005 37.0 70.4 37.4 8.4 1.9 2.7 17.2
1995 51.7 4.7 0.5 96.0 0.0 2.7 32.8 Operators & Assemblers 2005 36.6 3.5 3.3 62.0 2.6 2.4 13.3
1995 15.6 19.8 0.0 4.0 0.0 0.0 11.8 Elementary Workers 2005 19.4 23.4 7.7 11.5 32.7 13.6 15.0
1995 591,321 230,279 271,370 76,188 1,192 23,248 1,193,597 BC members 2005 486,583 114,228 332,664 179,200 84,124 1,358,171 2,580,331
1995 1,362,063 374,420 1,367,718 431,020 530,455 2,117,455 8,120,279 Formal Employment 2005 1,394,240 536,160 1,630,919 429,091 1,087,271 1,901,858 8,039,401
1995 43.41 61.50 19.84 17.68 0.22 1.10 14.70 BC as share of Formal Employment 2005 35.72 30.51 24.32 41.58 15.86 64.14 31.78
1995 100.0 100.0 100.0 100.0 100.0 100.0 100.0 Private Sector BC (%) 2005 96.5 73.8 94.8 89.7 19.6 1.9 41.6
1995 0.0 0.0 0.0 0.0 0.0 0.0 0.0 Public Sector BC (%) 2005 3.5 26.2 5.2 10.3 80.4 98.1 58.5
Source: OHS 1995, LFS 2005: 2 (Statistics SA); Own Calculations Notes: Private Households, Agriculture, Mining and Utilities were omitted from the table, but included in figures for total employment and total bargaining council coverage. A small number of Domestic Workers were recorded as working in Financial and Commercial Services in 1995. The occupation category was omitted from the table, but these workers were included in the total employment figure.

27
Table 4 again presents that breakdown of bargaining council membership by occupation group and sector for both years. In this case, the cells present the share of each sector in total bargaining council coverage by occupation group.
The increase in bargaining council membership by occupation group between 1995 and 2005 was dominated by the huge increase in the number of Professionals belonging to bargaining councils, from just over 20 000 in 1995 to more than three-quarters of a million in 2005. This is a consequence of the establishment of the public sector bargaining councils. In 1995, almost half of Professionals belonging to bargaining councils were employed in the Construction industry, while 43 percent were employed in the CSPS sector. A further seven percent belonged to bargaining councils in the Manufacturing sector. By 2005, more than 94 percent of Professional bargaining council members were employed in the CSPS sector. This translates into an increase of more than 7 000 percent or almost 700 000 workers. Overall, almost 98 percent of Professional bargaining council members were employed in the public sector in 2005. The majority of these workers were teachers and nurses employed by government.
The number of Clerical Workers covered by bargaining councils increased almost five-fold between 1995 and 2005. Again this increase was driven by the establishment of the pubic sector bargaining councils, with public sector workers accounting for 79 percent of all Clerks covered by bargaining councils in 2005. The share of Clerks covered by bargaining councils in the Manufacturing industry decreased from 48 percent to 9 percent, while the share of Clerks that belonged to bargaining councils in the Trade sector declined from 52 percent to 9 percent. Over the same period, the share of Clerks employed in the CSPS increased from zero to 65 percent. This share is dominated by Clerks working in the public sector. Overall, bargaining council coverage in this occupation group increased from almost 5 percent of total employment to more than 23 percent.
The number of Service and Sales Workers belonging to bargaining councils more than doubled from about 161 000 in 1995 to almost 387 000 in 2005. In 2005, almost 58 percent of these workers were public sector bargaining councils. Most of the Services Workers covered by bargaining councils in 1995 were employed in the Wholesale and Retail Trade industry. This share declined to 35 percent in 2005, with the share of Service Workers employed in the CSPS increasing from 6 percent to 59 percent. This is dominated by police officers and to lesser extent prison warders.15 The small number of skilled Agricultural and Fishing Workers within a bargaining council in 2005, were all employed in the public service.
Craft and Trade worker bargaining council membership remained relatively stable between 1995 and 2005, with about 40 percent employed in the Manufacturing sector in both years. The share of this occupation group in the Construction industry declined, with small increases
15 Our estimates suggest that the 83 226 police officers and 28 048 wardens belonged to the public sector bargaining council in 2005.

28
in the other sector. Only 13 percent of covered Craft and Trade Workers were part of public sector councils.

29
Table 4: Bargaining Council Coverage by Occupation Group and Sector – % Share of Occupation Group
Manuf Constr Trade Transport Fin Serv Comm S BC Mem Form Emp BC share of Form Empl Priv BC Pub BC
1995 0.0 0.0 100.0 0.0 0.0 0.0 2,554 266,381 0.96 100.0 0.0
Managerial 2005 0.0 0.0 100.0 0.0 0.0 0.0 3,577 507,143 0.71 100.0 0.0 1995 7.2 49.8 0.0 0.0 0.0 43.0 22,808 1,307,344 1.74 100.0 0.0
Professional 2005 0.7 0.0 1.0 0.8 3.0 94.4 746,317 1,532,638 48.69 2.2 97.8 1995 47.9 0.0 52.1 0.0 0.0 0.0 54,713 1,129,365 4.84 100.0 0.0
Clerical 2005 9.1 0.9 9.3 6.3 9.0 64.6 263,308 1,137,558 23.15 21.2 78.8 1995 0.0 0.0 93.7 0.0 0.0 6.4 160,871 1,055,038 15.25 100.0 0.0
Service 2005 1.3 0.2 35.3 2.5 1.7 58.8 386,599 1,133,774 34.10 42.5 57.5 1995 51,268 0.0
Agr & Fishing 2005 0.0 0.0 0.0 0.0 0.0 50.6 7,769 53,135 14.62 0.0 100.0 1995 39.8 39.0 21.2 0.0 0.0 0.0 416,652 959,351 43.43 100.0 0.0
Craft & Trade 2005 40.7 18.2 28.1 3.4 0.4 8.3 442,737 1,128,258 39.24 86.9 13.1 1995 78.1 2.8 0.3 18.7 0.0 0.2 391,315 1,108,349 35.31 100.0 0.0
Operators 2005 52. 1.2 3.2 32.5 0.6 9.4 341,949 988,149 34.60 83.9 16.1 1995 65.5 32.3 0.0 2.2 0.0 0.0 140,894 1,778,378 7.92 100.0 0.0
Elementary 2005 24.3 6.9 6.6 5.3 7.1 47.4 388,074 1,556,937 24.93 41.3 58.7 1995 49.5 19.3 22.7 6.4 0.1 2.0 1,193,597 8,120,279 14.70 100.0 0.0
Total 2005 18.9 4.4 12.9 6.9 3.3 52.6 2,580,331 8,039,401 32.10 41.6 58.4
Source: OHS 1995, LFS 2005: 2 (Statistics SA); Own Calculations Notes: Private Households, Agriculture, Mining and Utilities were omitted from the table, but included in figures for total employment and total bargaining council coverage. A small number of Domestic Workers were recorded as working in Financial and Commercial Services in 1995. The occupation category was omitted from the table, but these workers were included in the total employment figure.

30
There was a slight decline between 1995 and 2005 in the number of covered Operators and Assemblers. In 1995, the majority of these workers were employed in the Manufacturing sector with the share of Operators in this sector declining to 52 percent in 2005. The largest share increase was in the Transport sector, driven by increased membership in the motor ferry and passenger transport bargaining councils, as well as the establishment of the Transnet bargaining council.
The majority of unskilled Elementary workers in a bargaining council in 1995 were employed in the Manufacturing sector. While the total number of Elementary workers council-covered increased from 141 000 to 388 000, the share of Elementary workers within Manufacturing, declined to 24 percent. There was a similar decline in the share of covered Elementary workers in the Construction industry. While no Elementary workers belonged to bargaining councils in CSPS in 1995, a decade later, 48 percent of all Elementary workers belonging to bargaining councils were employed in the CSPS sector.
Table 5 shows the union membership inside and outside the bargaining council environment in 1995 and 2005.16
Table 5: Bargaining Council Status and Union Membership, 1995 and 2005
Bargaining Council Non-Bargaining Council Formal Employment Union Non-Union Total Union Non-Union Total Union Non-Union Total 1995 466,827 726,770 1,193,597 2,274,483 4,652,199 6,926,682 2,741,311 5,378,968 8,120,279 39.11% 60.89% 100% 32.84% 67.16% 100% 33.76% 66.24% 100% 2005 1,407,344 1,172,987 2,580,331 1,609,057 3,850,012 5,459,070 3,016,401 5,023,000 8,039,401 54.54% 45.46% 100% 29.47% 70.53% 100% 37.52% 62.48% 100%
Source: OHS 1995, LFS 2005: 2 (Statistics SA); Own Calculations
In 1995, about 40 percent of workers (just fewer than half a million employees) estimated to be covered by a bargaining council, were also members of a trade union. This means that the majority of the workers that belonged to bargaining councils were not members of a union. By 2005 this share has increased to almost 55%, with the actual number of workers belonging to both a bargaining council and union increasing threefold to almost 1,5 million. This increase was primarily driven by the large number of public sector workers belonging to both a bargaining council and a union, with almost 70 percent of the public sector bargaining council members also unionised.17 It has to be noted that this rapid bargaining council-union membership also took place astride a very modest growth in trade union membership as a whole.
16 Note that while the bargaining council membership was estimated for both years, the union membership is based on the responses
to very specific questions in the 1995 OHS and the 2005 LFS. 17 The key public sector trade unions are the National, Education, Health and Allied Workers’ Union (NEHAWU), Democratic Nursing
Organisation of SA (DENOSA), Health and Other Service Personnel Trade Union of SA (HOSPERSA), National Professional Teachers’ Organisation of SA (NAPTOSA), Police and Prisons Civil Rights Union (POPCRU), Public Servants Association of SA (PSA), South African Democratic Teachers’ Union (SADTU) and South African Police Union (SAPU) (PSCBC website, www.pscbc.org.za).

31
From the above descriptive overview, a number of key conclusions emerge around the patterns of institutionalised wage formation in post-apartheid South Africa. In the first instance the level of institutionalised wage bargaining, outside of union membership, only covered 15 percent of workers in 1995. A decade later this figure, although more than doubling, stood only at 32 percent. Put differently, the system of bargaining councils in South Africa designed to formalise the relationship between organised workers and employers with regard to wages; benefits; dispute resolution and other aspects of labour market regulation, remains relatively weak and unrepresentative at the national level. That being said, a second key conclusion from the above is that, the 1995-2005 period reflects a rapid rise in the bargaining council system for the public sector. Driven by the formalisation of teachers, nurses and other public sector Professionals into the Public Sector Coordinating Bargaining Council – this sector is now the bedrock for institutionalised bargaining in the labour market. In turn, however, bargaining councils within the private sector have at best stagnated and at worst are in secular decline. Hence, despite aggregate employment growth in sectors such as Construction and Wholesale and Retail Trade, bargaining council membership has not expanded accordingly. Where there has been significant growth, it has notably been within State Owned Enterprise-related sectors. Finally, this poor performance within the private sector alludes to an additional worrying trend; that of the failure to resort to established practices of institutionalised bargaining and dispute resolution within new or fast-growing sectors. This is particularly important when those sectors or industries have low levels of unionisation and employers’ organisation – as it often provides the seedbed for a fractious industrial relations environment.18
Earnings in the Bargaining Council System
As noted earlier, domestic workers, the self-employed and the informal sector (in 2005) were excluded from the estimation of bargaining council coverage. In the following tables the earnings19 of employees that belonged to bargaining councils in the two years (as per our estimation of coverage) are compared to the earnings of those workers that were employed in the formal sector but did not belong to a bargaining council.
Table 6 provides a comparison of the real20 mean monthly earnings of all formal sector employees by their bargaining council status in 1995 and 2005. In addition, the ratio of bargained to non-bargained wages is given, as well as the growth in earnings over the period – both for workers that belonged to a bargaining council and those that did not.
18 While this point is a strong reference to the security and taxi industries, it represents a general concern around other
sectors whose future growth may result in deleterious industrial relations outcomes. 19 The earnings figures reported here are monetary earnings. Where respondents in the OHS and LFS chose an income bracket
instead of indicating an actual income figure, the midpoint value of that bracket was given to them. In both years, however, the majority of respondents provided an actual income estimate. Looking at formal employment only, in 2005 62 percent of respondents provided point estimates, with less than 1 percent unspecified (missing). In 1995 2,48 percent of the values were missing, while 78 percent of respondents provided point estimates.
20 Nominal earnings were converted into real earnings (expressed in 2000 prices) using the Consumer Price Index (StatsSA, 2006).

32
In both 1995 and 2005, the aggregate estimates indicate that membership of a bargaining council was not associated with higher mean earnings. In both years, the difference in the mean earnings of employees inside and outside the bargaining council environment is not statistically significant. In 1995, the only statistically significant difference in earnings are for Asian workers, with employees not belonging to a bargaining council actually earning almost one and a half times more than their counterparts who were members of a bargaining council.
Table 6: Real Mean Monthly Earnings by Race, Gender and Bargaining Council Membership, 1995 and 2005
1995 2005 % change
Rands BC Non-BC
Ratio (BC to Non-BC) BC Non-BC
Ratio (BC to Non-BC) BC Non-BC
African 2043.32 2076.94 1:1.02 2996.83 2158.82 1:0.72* 46.66** 3.94 Coloured 2312.64 2070.22 1:0.90 3225.45 2794.53 1:0.87 39.47** 34.99** Asian 2842.48 4001.30 1:1.41* 3908.88 3427.78 1:0.88 37.52 -14.33 White 5680.86 6221.95 1:1.10 5618.87 6961.31 1:1.24* -1.09 11.88 Male 2953.47 3142.55 1:1.06 3396.83 3398.64 1:1.00 15.01** 8.15 Female 1842.82 2695.76 1:1.46* 3499.99 3038.92 1:0.87 89.93** 12.73 Total 2674.38 2982.25 1:1.12 3438.74 3271.79 1:0.95 28.58** 9.71
Source: OHS 1995, LFS 2005: 2 (Statistics SA) Notes: * Difference between mean wages significant at the 5 percent level ** Changes significant at the 5 percent level
In 2005, however, African employees covered by a bargaining council agreement earned significantly more than those workers not belonging to a bargaining council, driven by a statistically significant increase of 47 percent in real earnings between 1995 and 2005. The differences in the earnings of Coloured and Asian workers inside and outside the bargaining council environment are not statistically significant. It is interesting to note that White workers who did not belong to a bargaining council earned more than those that were covered by a bargaining council agreement, with the difference statistically significant. This is probably a reflection of the relatively large share of White workers in highly skilled occupations falling outside the bargaining council system.
In 1995 there was no statistically significant difference in Male earnings between those that belonged to bargaining councils and those that did not. Females, however, who did not belong to a bargaining council earned on average almost 50 percent more than females that were members of a bargaining council, with the difference statistically significant. In 2005 the earnings of Males and Females belonging to bargaining councils were not statistically different from those not covered by a bargaining council agreement. However, female bargaining council members saw a statistically significant increase of almost 90 percent in their mean earnings between 1995 and 2005. This reflects the large number of nurses and female teachers covered by bargaining council agreements in 2005 due to their membership of the PSCBC.
Table 7, however, shows that when the earnings of public sector bargaining members are compared to those of bargaining council members in the private sector as well as those not
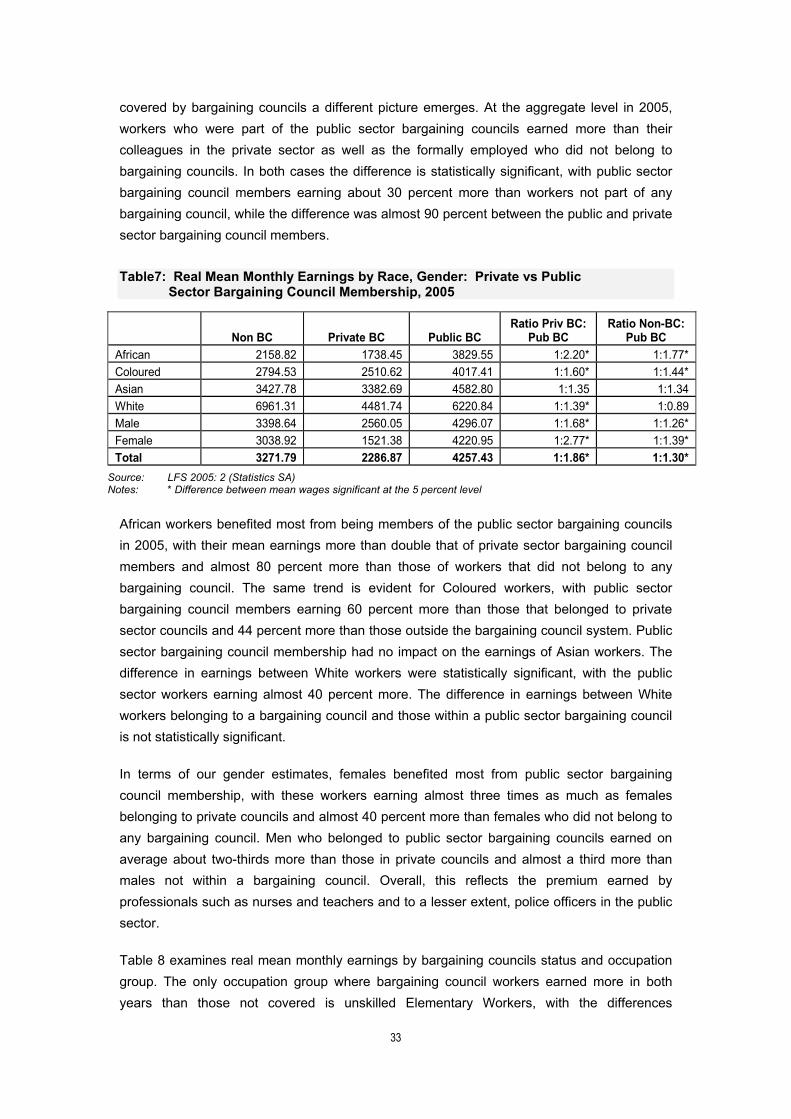
33
covered by bargaining councils a different picture emerges. At the aggregate level in 2005, workers who were part of the public sector bargaining councils earned more than their colleagues in the private sector as well as the formally employed who did not belong to bargaining councils. In both cases the difference is statistically significant, with public sector bargaining council members earning about 30 percent more than workers not part of any bargaining council, while the difference was almost 90 percent between the public and private sector bargaining council members.
Table7: Real Mean Monthly Earnings by Race, Gender: Private vs Public
Sector Bargaining Council Membership, 2005
Non BC Private BC Public BC Ratio Priv BC:
Pub BC Ratio Non-BC:
Pub BC African 2158.82 1738.45 3829.55 1:2.20* 1:1.77* Coloured 2794.53 2510.62 4017.41 1:1.60* 1:1.44* Asian 3427.78 3382.69 4582.80 1:1.35 1:1.34 White 6961.31 4481.74 6220.84 1:1.39* 1:0.89 Male 3398.64 2560.05 4296.07 1:1.68* 1:1.26* Female 3038.92 1521.38 4220.95 1:2.77* 1:1.39* Total 3271.79 2286.87 4257.43 1:1.86* 1:1.30*
Source: LFS 2005: 2 (Statistics SA) Notes: * Difference between mean wages significant at the 5 percent level
African workers benefited most from being members of the public sector bargaining councils in 2005, with their mean earnings more than double that of private sector bargaining council members and almost 80 percent more than those of workers that did not belong to any bargaining council. The same trend is evident for Coloured workers, with public sector bargaining council members earning 60 percent more than those that belonged to private sector councils and 44 percent more than those outside the bargaining council system. Public sector bargaining council membership had no impact on the earnings of Asian workers. The difference in earnings between White workers were statistically significant, with the public sector workers earning almost 40 percent more. The difference in earnings between White workers belonging to a bargaining council and those within a public sector bargaining council is not statistically significant.
In terms of our gender estimates, females benefited most from public sector bargaining council membership, with these workers earning almost three times as much as females belonging to private councils and almost 40 percent more than females who did not belong to any bargaining council. Men who belonged to public sector bargaining councils earned on average about two-thirds more than those in private councils and almost a third more than males not within a bargaining council. Overall, this reflects the premium earned by professionals such as nurses and teachers and to a lesser extent, police officers in the public sector.
Table 8 examines real mean monthly earnings by bargaining councils status and occupation group. The only occupation group where bargaining council workers earned more in both years than those not covered is unskilled Elementary Workers, with the differences

34
statistically significant. Elementary Workers not part of a bargaining council earned about 60 percent of the average wage of a bargaining council member in 1995, and about 56 percent of the average wage of a bargaining council member in 2005.
In 2005, the only other occupation category that benefited from being covered by a bargaining council agreement were Service and Sales Workers, whose earnings were almost double those of non-bargaining council service workers. This can be attributed to the fact that police officers and correctional services workers (who fall in this category), were covered by the new public sector bargaining councils in 2005 but uncovered in 1995.
Table 8: Real Mean Monthly Earnings by Occupation and Bargaining Council Membership, 1995 and 2005
1995 2005 % Change
Rands BC Non-BC
Ratio (BC to Non-
BC) BC Non-BC
Ratio (BC to Non-
BC) BC Non-BC Managers 5737.10 8854.87 1:1.54* 3444.90 9578.95 1:2.78* -39.95 8.18 Professionals 7827.58 5505.90 1:0.70* 5345.21 6553.86 1:1.23* -31.71** 19.03 Clerks 2941.33 3029.92 1:1.03 3868.12 3273.02 1:0.85 31.51** 8.02 Service Workers 2239.59 2479.59 1:1.11 3006.73 1597.00 1:0.53* 34.25 -35.59** Skilled Agr. Workers 2521.79 2120.47 2750.13 1:1.30 9.05 Craft & Trade Workers 3091.59 3267.50 1:1.06 2452.81 2219.72 1:0.90 -20.66 -32.07** Operators & Assemblers 2436.65 2082.94 1:0.85* 2379.27 2121.28 1:0.89 -2.35 1.84 Elementary Workers 1665.31 993.96 1:0.60* 2042.01 1149.60 1:0.56* 22.62 15.66** Total 2674.38 2982.25 1:1.12 3438.74 3271.79 1:0.95 28.58** 9.71
Source: OHS 1995, LFS 2005: 2 (Statistics SA) Notes: * Difference between mean wages significant at the 5 percent level ** Changes significant at the 5 percent level
Operators and Assemblers covered by a bargaining council agreement earned more than those outside bargaining councils in 1995, with the difference no longer statistically significant in 2005. In 1995, the very small number of Professionals who belonged to a bargaining council earned more than those outside the system. By 2005, Professionals outside the bargaining council system earned more than those covered by agreements. Finally, in both years Managers not covered by agreement earned more than those who belonged to bargaining councils. This is not surprising given the very small number of managers who actually belonged to councils. For Clerks and Craft and Trade workers in both years, Service Workers in 1995, and for Agricultural Workers in 2005, the differences in the levels of earnings are not statistically significant.
In Table 9 we again compare the earnings of workers part of the public sector bargaining councils with the earnings of those who were members of private sector bargaining councils in 2005. Professionals in the public sector bargaining council earned on average almost 50 percent more than their counterparts that belonged to the private sector councils. However, Professionals who did not belong to any bargaining council still earned more than the public sector Professionals. Nurses and teachers belong to the public sector bargaining councils,

35
and this could account for the earnings gap between the private and public sector bargaining councils. However, high earning Professionals such as chartered accountants, actuaries and lawyers in the private sector do not belong to bargaining councils, hence, suggesting why Professionals outside the bargaining council environment have the highest mean earnings.
Table 9: Real Mean Monthly Earnings by Occupation Group: Private versus Public Sector Bargaining Council Membership, 2005
Non-BC Private BC Public BC Ratio
Priv BC: Pub BC Ratio
Non-BC: Pub BC Managers 9578.95 3444.90 Professionals 6553.86 3484.41 5382.01 1:1.54* 1:0.82* Clerks 3273.02 3010.72 4103.71 1:1.36 1:1.25* Service Workers 1597.00 1904.62 3799.76 1:2.00* 1:2.38* Skilled Agr Workers 2750.13 2120.47 1:0.77 Craft & Trade Workers 2219.72 2458.70 2412.40 1:0.98 1:1.09 Operators & Assemblers 2121.28 2218.76 3189.78 1:1.44 1:1.50 Elementary Workers 1149.60 1968.76 2091.25 1:1.06 1:1.82* Total 3271.79 2286.87 4257.43 1:1.86* 1:1.30*
Source: LFS 2005: 2 (Statistics SA) Notes: * Difference between mean wages significant at the 5 percent level
The mean earnings of Service Workers in the public sector were double that of Service Workers that belonged to private sector bargaining councils and almost two-and-a-half times more than that of their colleagues outside the council system. This reflects the wage premium earned by police officers and prison wardens in the public sector.
When earnings are differentiated by industry, it is clear that in most cases differences in earnings between workers covered by bargaining councils and those outside the system are not statistically significant. There are, however, some exceptions. In Transport and Manufacturing, workers not covered by bargaining councils earned more in both years. For both sectors, these workers earned around 50 percent more than their colleagues, with differential widening slightly in 2005.

36
Table 10: Real Mean Monthly Earnings by Industry and Bargaining Council Status, 1995 and 2005
1995 2005 % Change
BC Non-BC
Ratio (BC to Non-BC BC Non-BC
Ratio (BC to Non-BC BC Non-BC
Agriculture 789.32 1707.75 950.03 1:0.56* 20.36 Mining & Quarrying 3176.01 2820.05 3310.10 1:1.17 4.22 Manufacturing 2680.99 3870.90 1:1.44* 2298.83 3819.50 1:1.66* -14.25 -1.33 Utilities 4384.73 2956.54 4585.29 1:1.55 4.57 Construction 2658.29 2531.11 1:0.95 2319.21 2066.21 1:0.89 -12.76 -18.37 Wholesale & Retail Trade 2612.20 2457.50 1:0.94 2235.11 2377.66 1:1.06 -14.44 -3.25 Transport 2529.67 4045.35 1:1.60* 2603.98 4587.15 1:1.76* 2.94 13.39 Financial & Business Services 1153.98 4570.14 1:3.96* 4070.34 4689.15 1:1.15 252.72** 2.60 Commercial, Social & Prof Services 3953.48 3628.25 1:0.92 4317.75 4602.46 1:1.07 9.21 26.85** Total 2674.38 2982.25 1:1.12 3438.74 3271.79 1:0.95 28.58** 9.71
Source: OHS 1995, LFS 2005: 2 (Statistics SA) Notes: * Difference between mean wages significant at the 5 percent level ** Changes significant at the 5 percent level
Bargaining council members in the Financial Services sector experienced a huge increase in their mean earnings between 1995 and 2005, driven again by public sector workers in this sector who joined the PSCBC. The only sector wherein bargaining council members earned more than non-members (and the difference is statistically significant), was Agriculture, Forestry & Fishing in 2005 – driven by public sector employees who indicated that they belong to this sector.
Our descriptive analysis has shown that an estimated 15 percent of formal sector workers were covered by bargaining council agreements in 1995, with these limited to private sector councils. By 2005, this had increased to about 30 percent of total formal employment, with the increase driven almost entirely by membership of the newly formed public sector bargaining councils. The number of private sector workers covered by bargaining council agreements remained relatively stable at around 1 million workers. Ultimately then, there has been a stagnation in growth of bargaining council representation for private sector employees, with aggregate growth in bargaining council membership a function entirely of the PSBC’s formation. The descriptive analysis of earnings, in turn, suggests firstly that at the mean, there was no significant remunerative advantage offered to being associated with a bargaining council. Closer inspection of the mean earnings of bargaining council members, however, revealed significant premia associated with membership of public sector bargaining councils. Hence, the aggregate level, public sector bargaining council members not only earned more than their private sector counterparts, but also on average more than workers who did not belong to a bargaining council at all. This result holds true for males and females, as well as Africans and Coloureds. The same trend emerges when examining average earnings by occupation group.

37
While mean earnings were presented by a range of covariates, noted above, these are of course not the only factors impacting on a worker’s earnings. A wide range of variables, including the highest level of education and experience also influence earnings. In addition, these variables interact simultaneously to impact on earnings. In the following section, therefore, we estimate a range of earnings functions in an attempt to account for the simultaneous impact of relevant variables on the level of earnings. In addition, it will allow us to isolate the impact of bargaining council and union membership on earnings.
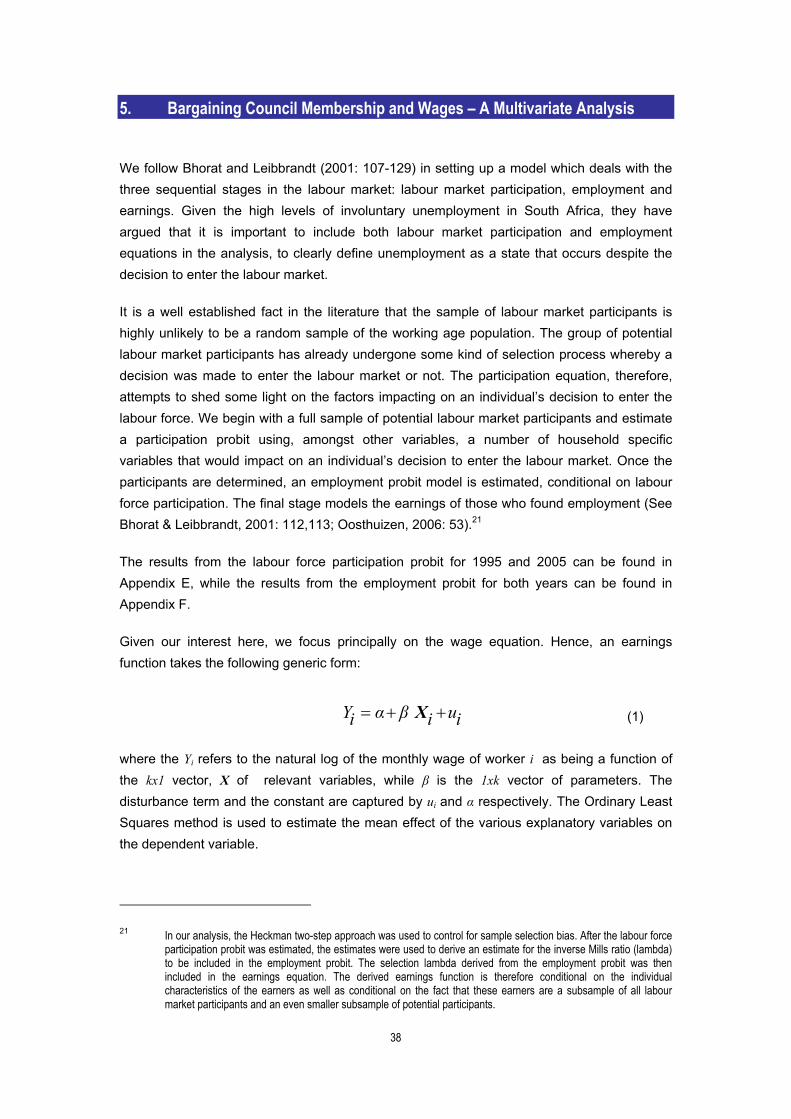
38
5. Bargaining Council Membership and Wages – A Multivariate Analysis
We follow Bhorat and Leibbrandt (2001: 107-129) in setting up a model which deals with the three sequential stages in the labour market: labour market participation, employment and earnings. Given the high levels of involuntary unemployment in South Africa, they have argued that it is important to include both labour market participation and employment equations in the analysis, to clearly define unemployment as a state that occurs despite the decision to enter the labour market.
It is a well established fact in the literature that the sample of labour market participants is highly unlikely to be a random sample of the working age population. The group of potential labour market participants has already undergone some kind of selection process whereby a decision was made to enter the labour market or not. The participation equation, therefore, attempts to shed some light on the factors impacting on an individual’s decision to enter the labour force. We begin with a full sample of potential labour market participants and estimate a participation probit using, amongst other variables, a number of household specific variables that would impact on an individual’s decision to enter the labour market. Once the participants are determined, an employment probit model is estimated, conditional on labour force participation. The final stage models the earnings of those who found employment (See Bhorat & Leibbrandt, 2001: 112,113; Oosthuizen, 2006: 53).21
The results from the labour force participation probit for 1995 and 2005 can be found in Appendix E, while the results from the employment probit for both years can be found in Appendix F.
Given our interest here, we focus principally on the wage equation. Hence, an earnings function takes the following generic form:
iuiβαiY ++= X (1)
where the Yi refers to the natural log of the monthly wage of worker i as being a function of the kx1 vector, X of relevant variables, while β is the 1xk vector of parameters. The disturbance term and the constant are captured by ui and α respectively. The Ordinary Least Squares method is used to estimate the mean effect of the various explanatory variables on the dependent variable.
21 In our analysis, the Heckman two-step approach was used to control for sample selection bias. After the labour force
participation probit was estimated, the estimates were used to derive an estimate for the inverse Mills ratio (lambda) to be included in the employment probit. The selection lambda derived from the employment probit was then included in the earnings equation. The derived earnings function is therefore conditional on the individual characteristics of the earners as well as conditional on the fact that these earners are a subsample of all labour market participants and an even smaller subsample of potential participants.

39
While there are well-known advantages to the OLS approach, this paper also attempts to understand the impact of different covariates – particularly that of union and bargaining council membership - at different points on the conditional wage distribution. Put differently, whether bargaining council membership is significant in shaping earnings at the 10th, as opposed to the 75th or the 90th percentile of the wage distribution is of substantive interest here.
Hence, in order to estimate the impact of the explanatory variables at particular points in the wage distribution, the method of quantile regressions is utilised. First proposed in Koenker and Bassett (1978), quantile regressions refer to the generalised case of the least absolute deviations (LAD) estimator. Hence, while through ordinary least squared estimation, we derive a sample mean through minimising the sum of squared residuals, the sample median can be derived through minimising the sum of absolute residuals (Koenker & Hallock, 2001; Koenker & Bassett, 1978). If we take a general statement of this approach, across all points, or quantiles, in the distribution we have the estimation for the regression quantile as minimising the equation below:
( )
∑<∈
−−+∑≥∈
−ℜ∈
β
βθ
β
βθβ iXiyii
iXiY
iXiyiiiXiYMin
k :1
: (2)
The above then provides the solution for the θth quantile, where 0<θ<1, allowing for estimation at any given point in the distribution of the outcome variable. In the above Yi is the dependent variable, xi is the kx1 vector of independent variables and β is coefficient vector (Koenker & Bassett, 1978). One particular case of the quantile regression is the median regression, which is obtained in the above by setting θ=0.5. Alternative values of θ therefore provide us with different quantile estimates. Ultimately, while the OLS approach estimates the mean effect of the explanatory variable on the dependent variable, the quantile regression approach enables an estimation at any number of different points in the conditional distribution of the dependent variable.
In the application of this technique we were therefore able to specifically estimate the impact of bargaining council membership and union membership at particular points in the conditional wage distribution. This allowed us to evaluate the impact of institutional wage formation at different points in the wage distribution.
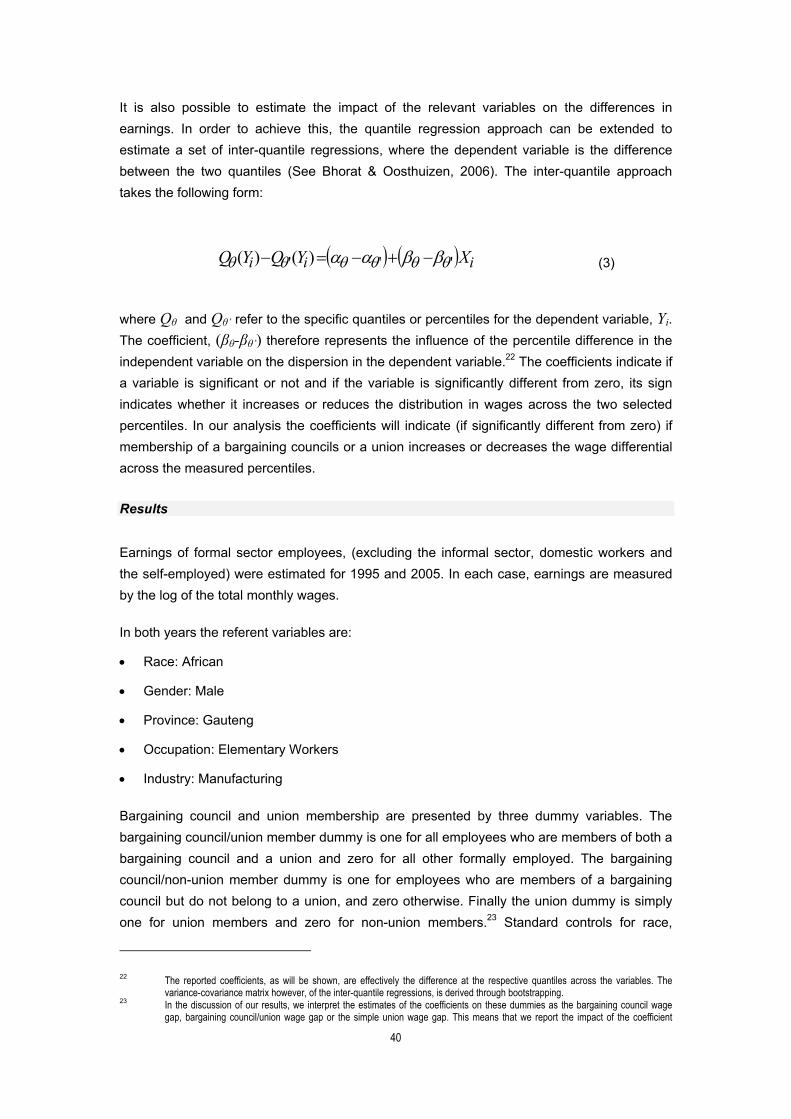
40
It is also possible to estimate the impact of the relevant variables on the differences in earnings. In order to achieve this, the quantile regression approach can be extended to estimate a set of inter-quantile regressions, where the dependent variable is the difference between the two quantiles (See Bhorat & Oosthuizen, 2006). The inter-quantile approach takes the following form:
( ) ( ) iii XYQYQ ''' )()( θθθθθθ ββαα −+−=− (3)
where Qθ and Qθ’ refer to the specific quantiles or percentiles for the dependent variable, Yi. The coefficient, (βθ-βθ’) therefore represents the influence of the percentile difference in the independent variable on the dispersion in the dependent variable.22 The coefficients indicate if a variable is significant or not and if the variable is significantly different from zero, its sign indicates whether it increases or reduces the distribution in wages across the two selected percentiles. In our analysis the coefficients will indicate (if significantly different from zero) if membership of a bargaining councils or a union increases or decreases the wage differential across the measured percentiles.
Results
Earnings of formal sector employees, (excluding the informal sector, domestic workers and the self-employed) were estimated for 1995 and 2005. In each case, earnings are measured by the log of the total monthly wages.
In both years the referent variables are:
• Race: African
• Gender: Male
• Province: Gauteng
• Occupation: Elementary Workers
• Industry: Manufacturing
Bargaining council and union membership are presented by three dummy variables. The bargaining council/union member dummy is one for all employees who are members of both a bargaining council and a union and zero for all other formally employed. The bargaining council/non-union member dummy is one for employees who are members of a bargaining council but do not belong to a union, and zero otherwise. Finally the union dummy is simply one for union members and zero for non-union members.23 Standard controls for race,
22 The reported coefficients, as will be shown, are effectively the difference at the respective quantiles across the variables. The
variance-covariance matrix however, of the inter-quantile regressions, is derived through bootstrapping. 23 In the discussion of our results, we interpret the estimates of the coefficients on these dummies as the bargaining council wage
gap, bargaining council/union wage gap or the simple union wage gap. This means that we report the impact of the coefficient
41
gender, education, location, industry, occupation, experience and hours worked per month are included in the equation. For 2005 only, in order to capture the effect of public sector versus private sector employment and, therefore, the impact of the public sector bargaining councils, two dummies are included for the Commercial, Social and Personal Services (CSPS) sector. This was done, given that 88 percent of people who worked in the three spheres of government and estimated as belonging to the public sector bargaining councils were coded as employees in that sector. Two separate dummies were therefore created, for public sector workers in the CSPS sector and for people employed in the private CSPS sector respectively. This serves as the first specification for the earnings function for 2005. The second specification retains a single dummy representing the CSPS sector. In order to capture the impact of the private and the public sector bargaining councils separately, two dummies are included in this earnings function, representing private sector bargaining council membership and public sector bargaining council membership respectively.
Table 11 presents the earnings function for all those in formal employment in 1995. Looking at the second last variable first, the coefficient for the inverse Mills ratio (empl_lambda) is negative and statistically significant, suggesting the presence of sample selection bias, which was corrected for. In other words, the sample of earners was not a random selection drawn from the pool of potential labour market participants in 1995.
Statistically significant coefficients for all three race groups indicate that African workers in the formal economy were likely to earn less than workers from the other race groups in 1995, with the differential particularly large when their average earnings are compared to those of White workers. Being female, as opposed to male, reduced earnings by about 23 percent for those in formal employment. The education splines show that higher levels of education were associated with higher earnings in 1995. As expected, those formally employed in urban areas earned more than their rural counterparts, by about 13 percent.
estimate as a percentage change in the log monthly wage. We do this because the estimates of our coefficients are relatively small. For coefficient estimates (of dummy variables) of larger magnitudes the effect on the dependent variable should be calculated as (еβ - 1), with β the coefficient estimate (Halvorsen & Palmquist, 1980: 474-475).

42
Table 11: Earnings Equation 1995 (Formal Employment)
Dependent Variable: Log of Mean Monthly Earnings Coefficients Coloured 0.1957* Asian 0.2601* White 0.5562* Female -0.2298* No education to Incomplete GET (None to Grade 8) 0.0376* Complete GET (Grade 9 to 11) 0.0966* Matric (Grade 12) 0.1903* Diploma 0.1531* Degree 0.1166* Urban 0.1319* Managers 0.7258* Professionals 0.5368* Clerks 0.2771* Service Workers 0.1753* Skilled Agricultural 0.4733* Craft and Trade Workers 0.2498* Operators and Assemblers 0.1702* Agriculture -0.6970* Mining -0.0046 Utilities 0.1574* Construction -0.1486* Wholesale and Retail Trade -0.1667* Transport 0.0708* Finance 0.0034 Commercial, Social and Personal Services 0.0207 Private Households -0.7124* Experience 0.0344* Experience squared -0.0005* Log of hours worked per month 0.1331* Bargaining council/union member 0.0236 Bargaining council/non-union member 0.0694* Union 0.1959* Emp_lambda -0.1148* Constant 5.3735* Number Observed 24479 F 1066.86* Adjusted R2 0.6519
Source: OHS 1995 (Statistics SA); Own Calculations Notes: * Significant at the one percent level ** Significant at the five percent level Other and unspecified categories were omitted from the table
A set of provincial dummies were included in the equation, but are not presented in Table 11. With the exception of Limpopo, for which the coefficient is statistically insignificant, those residing in the other provinces in 1995 earned less than those formally employed in Gauteng.
Belonging to any other occupation group than an Elementary Worker was associated with higher average earnings. The results show that those in skilled occupations (Managers and

43
Professionals) enjoyed the largest differentials, followed by Skilled Agriculture and Fishery Workers and Craft Workers. Operators and Assemblers and Service Workers were likely to earn on average 17 percent more than Elementary Workers in 1995.
Only formal sector workers in Utilities, Transport, Finance and Commercial, Social & Personal Services earned more than those employed in the Manufacturing sector, with the largest differential for the Utilities sector. Workers in Agriculture, Construction, Trade and Private Households were earning less than workers in the Manufacturing sector, with the differential of 0.70 particularly large for workers in the Agricultural sector.
The positive and significant coefficient for experience indicate that an additional year of experience generated a return to earnings of about 3,4 percent in 1995. As expected the coefficient for experience squared was negative and significant indicating diminishing returns to experience.
Of particular interest for this analysis is the impact of being a member of a bargaining council or a union on earnings. The coefficient of the bargaining council/union membership dummy is statistically insignificant, implying that in 1995 a formal sector worker who was a member of both a bargaining council and a union did not enjoy any wage premium as a consequence of his/her membership of the two institutions. However, workers within a bargaining council but not union members did enjoy a wage premium relative to those not covered by a wage agreement. The statistically significant coefficient of this dummy implies that bargaining council members were likely to earn almost seven percent more than those not covered by a wage agreement. Membership of a union in 1995 provided a much larger wage premium, with workers that belonged to a union, but not a bargaining council, enjoying a union wage premium of almost 20 percent.24
Ultimately, this result for 1995 suggests that bargaining councils impacted significantly on an individual’s mean wages only in the absence of union membership. Institutionalised wage formation in 1995 therefore was characterised by a strong union-wage effect and a significant (albeit lower) bargaining council effect. The latter, importantly, was only true for those bargaining council members who were not unionised.
Table 12 presents the earnings function for the formally employed in 2005. For 2005, two specifications of the earnings function were estimated. In tems of the first specification, the coefficient of the inverse Mills ratio (empl_lambda) is again negative and statistically significant, confirming that there was sample selection bias which was corrected for.
Again, the positive and statistically significant coefficients for the race dummies indicate that African workers were likely to earn less than workers from the other three race groups in 2005. The differentials for Coloured and White workers are slightly smaller than in 1995, with
24 Past studies analysing the impact of institutional wage formation on earnings have concentrated mainly on estimating the union
wage gap. The results vary widely, party as a result of different methodologies and of the samples being limited by gender or race. Our union wage gap for 1995 of almost 20 percent compares well with the estimates from Bhorat and Leibbrandt (2001: 125). They estimated a union wage gap of 20 percent for African males and 21 percent for African females, using the 1995 OHS.

44
the differential for Asian workers larger. This suggests that by 2005, African workers in the formal sector have seen the gap between their earnings and that of Coloured and White workers begin to decrease. The average earnings of females remained less that those of men, with the differential slightly smaller than in 1995.
Table 12: Earnings Equation 2005 (Formal Employment)
Dependent Variable: Log of Mean Monthly Earnings Coefficients Specification 1 Specification 2 Coloured 0.1438* 0.1419* Asian 0.3440* 0.3440* White 0.4499* 0.4437* Female -0.2067* -0.2086* No education to Incomplete GET (None to Grade 8) 0.0274* 0.0280* Complete GET (Grade 9 to 11) 0.0543* 0.0551* Matric (Grade 12) 0.2618* 0.2646* Diploma 0.1662* 0.1765* Degree 0.2277* 0.2282* Metro 0.0685* 0.0659* Managers 0.8688* 0.8966* Professionals 0.5661* 0.5648* Clerks 0.3989* 0.3953* Service Workers 0.0615* 0.0608* Skilled Agricultural 0.3969* 0.3821* Craft and Trade Workers 0.1536* 0.1617* Operators and Assemblers 0.1632* 0.1638* Agriculture -0.4293* -0.4214* Mining 0.3496* 0.3137* Utilities 0.1282** 0.0735 Construction -0.1604* -0.1682* Wholesale and Retail Trade -0.2490* -0.2535* Transport 0.0397 0.0389 Finance -0.0124 -0.0277 Commercial, Social and Personal Services – Private Sector -0.2155* Commercial, Social and Personal Services – Public Sector 0.0512** Commercial, Social and Personal Services (1 dummy) -0.1601* Private Households -0.7253* -0.7083* Experience 0.0236* 0.0236* Experience squared -0.0002* -0.0002* Log of hours worked per month 0.1700* 0.1709* Bargaining council/union member 0.1580* Bargaining council/non-union member -0.0061 Private Sector Bargaining Council Member 0.0304 Public Sector Bargaining Council Member 0.2802* Union 0.1726* 0.2349* Emp_lambda -0.1888* -0.1837* Constant 6.0183* 5.9866* Number Observed 14746 14746 F 401.76* 408.54* Adjusted R2 0.5446 0.5431
Source: LFS 2005: 2 (Statistics SA); Own Calculations Notes: * Significant at the one percent level ** Significant at the five percent level Other and unspecified categories were omitted from the table
The positive returns to education are also again evident, with additional years of education (presented by the education splines) impacting positively on earnings. The greatest additional positive impact on average earnings is associated with Matric or a degree in 2005. The LFS no longer records information by urban-rural classification, but by district and metropolitan council. The metro dummy is one for all workers living in metropolitan municipalities and zero

45
for those living outside these areas (in areas run by district municipalities). The positive and significant coefficient for this dummy indicates that in 2005 workers living in metropolitan municipalities earned more than those residing in the district municipalities.
Not surprising, all occupations groups were associated with higher earnings relative to Elementary Workers, with large differentials for skilled workers. Turning to the sectoral dummies, the coefficients for the Transport and the Financial Services sectors are not statistically significant. Formal employees in Agriculture, Construction, Wholesale & Retail Trade, as well as Private Households earned less relative to formal sector employees in Manufacturing. Workers in Mining and Utilities, on the other hand, earned more than those working in Manufacturing. The statistically significant and positive coefficient for the public sector CSPS dummy captures the wage premium enjoyed by workers in the public sector. The coefficient for the private sector is negative and statistically significant, implying that private sector workers in that sector earned less that those employed in the Manufacturing sector. The positive and significant coefficient for experience indicates that an additional year of experience generated a return to earnings of about 2,4 percent in 2005. Again the negative and significant coefficient for experience squared indicates diminishing returns to experience.
A set of provincial dummies were included in the equation, but are not presented in the table above. With the exception of the Western Cape (for which the coefficient is statistically insignificant), the results indicated that in 2005 the formally employed living in any of the other seven provinces earned less than their counterparts living in the referent province, Gauteng.
We now turn to the three dummies that capture the effect of institutionalised wage setting in South Africa in the first specification. The coefficient for the bargaining council/non-union member dummy is statistically insignificant, indicating that a formal sector worker covered by bargaining council agreement but not a member of a union, did not enjoy a wage premium in 2005. Both the coefficients for the union membership dummy and the bargaining council/union member dummy are positive and statistically significant. Union membership on its own is associated with an earnings premium of about 17 percent. The coefficient for the bargaining council/union member dummy translates into a return to earnings of almost 16 percent.
The aim of including two dummies for the CSPS sector was to capture the impact of private sector and public sector employment separately. In 2005, almost 95 percent of workers in the public sector were covered by bargaining council agreements. The positive and significant coefficient for the CSPS public sector dummy does suggest that being a public sector worker is associated with an earnings premium relative to a worker in the Manufacturing sector. It does not, however, sufficiently capture the impact of public sector bargaining council membership. The above earnings equation was estimated with the two CSPS dummies replaced by a single sectoral dummy, and the dummies related to union and bargaining council membership replaced by two dummies, for private sector bargaining council membership and public sector bargaining council membership respectively. Table 12 also shows the results of this second specification. The magnitudes and signs of the coefficients

46
for the control variables are almost identical to those in the first specification. The estimated coefficient for the CSPS dummy, however, is negative and significant, which was expected given the results from specification (1). This implies that that the average earnings of CSPS workers lagged those found within Manufacturing. The coefficient for the private sector bargaining dummy is insignificant, again implying that if you worked in the private sector, membership of a bargaining council did not award you a wage premium in 2005. Both the public sector dummy and the union dummy are positive and significant. This means that public sector workers did enjoy a wage premium due to their membership of the public sector bargaining councils, of about 28 percent. The union wage premium for 2005 according to this estimation is about 23 percent.
Figure 1 presents a summary of the wage premia associated with institutional wage formation in 1995 and 2005. It only shows the coefficients which were statistically significant. The union wage gap is significant in 1995 and for both specifications in 2005, with the size of the coefficient varying from 17 percent to 23 percent. This implies that in both years, workers enjoyed a wage premium associated with their union membership, irrespective of bargaining council membership.
Figure 1: Mean Bargaining Council and Union Wage Premia, 1995 and 2005
0
0.05
0.1
0.15
0.2
0.25
0.3
BC_Union BC_Nonunion BC_Public Union
19952005 (1)2005 (2)
Source: LFS 2005: 2 (Statistics SA); Own Calculations
In 1995, workers not belonging to a union but part of a bargaining council, enjoyed a wage premium of about seven percent. In that year, union membership in combination with membership with a bargaining council did not yield any significant wage premium. A decade later, however, the bargaining council system did not offer individuals who were not unionised any premium. In contrast, workers part of both a union and bargaining council enjoyed a wage premium of more than 15 percent in 2005. This result was primarily driven by the fact that all non-managers in the public sector now belonged to the public service bargaining councils, with a large share of these individuals unionised. The impact of this new public service bargaining council system is illustrated even more clearly by the results from the second

47
specification. While system membership of a private sector bargaining council did not yield any premium, membership of the public sector bargaining councils was associated with a wage premium of 28 percent.
The results from our multivariate analysis confirm the tentative conclusions from our descriptive overview. Firstly, the wage premium associated with union membership remained strong between 1995 and 2005. Indeed, the estimates re-affirm many previous union-wage premia derived in older datasets. They, therefore, confirm the strong effect union membership continues to have in shaping and determining mean wages in the South African labour market. In turn, however, our more nuanced representation of institutionalised wage formation suggests the Bargaining Council membership was also critical. In particular, it is evident that public employees who were members of PSBC ensured a high and significant return to their earnings in 2005. The importance of both unions and bargain councils in determining wages is clear when we consider that a joint premium of as high as 51 percent may be present through these institutions of the labour market, Finally, though, this strength in unions and the PSBC, should not mask the fact that the private sector bargaining council system has in contrast been in marked decline over the 1995-2005 period.
Results from Quantile Regressions
Table 13 compares the OLS (mean estimate) results with those at the 10th, 25th, 50th, 75th and the 90th percentile of the log wage distribution in 1995. This allows us to evaluate the impact of the explanatory variables on the earnings of formal sector workers at these points of the log wage distribution.
At all five points (and at the mean) of the earnings distribution being African, resulted in lower earnings relative to the other three race groups. The magnitudes of the coefficients vary slightly across the quantiles, but at all points Whites enjoyed the largest wage differential, followed by Asians and Coloureds. The negative and statistically significant coefficients for the female dummy suggest gender discrimination across the wage distribution. The magnitude of these coefficients increases across the distribution, implying that the earnings differential between males and females increased at higher points in the wage distribution in 1995.
Positive returns to education are evident at all percentiles under consideration. Living in an urban area as opposed to a rural area was associated with a higher level of earnings, but became less important as we moved towards the top of the wage distribution.
Again, provincial dummies were included in the equations, but now shown here. Workers living in provinces other than Gauteng generally earned less across the wage distribution. There are a few exceptions, with the coefficient of the dummy for KwaZulu-Natal not significant at the 90th percentile, while the coefficients for the Limpopo dummy are insignificant at the 25th and the 50th percentile. For Limpopo, the coefficients at the 75th and

48
the 90th percentile are positive and significant; implying these workers at the top of the wage distribution earned more than their colleagues in Gauteng.
For Managers, Professionals and Clerks the coefficients are positive and significant across the wage distribution, with the differentials remaining relatively stable across the distribution. Skilled Agricultural workers enjoyed a steady increase in their wages relative to Elementary Workers from the 25th percentile onwards. Craft and Trade workers experienced a similar trend, with workers at the 95th percentile benefiting from a much larger differential than those at the bottom. Operators and Assemblers did not see much variation across the different points of the wage distribution, but earned more than Elementary workers at every percentile under consideration. Earnings by sector varied substantially relative to the referent sector, Manufacturing, as well as across the distributions in each sector. The coefficients for experience and experience squared are very similar to the coefficients estimated at the mean at the different points of the distribution.

49
Table 13: Earnings Functions Estimates, 1995
Quantile (θ) = Dependent Variable: Log of monthly earnings OLS 0.10 0.25 0.5 0.75 0.9 Coloured 0.196* 0.161* 0.173* 0.149* 0.185* 0.215* Asian 0.260* 0.272* 0.252* 0.224* 0.254* 0.282* White 0.556* 0.518* 0.527* 0.535* 0.579* 0.573* Female -0.230* -0.165* -0.182* -0.205* -0.233* -0.234* None to Incomplete GET (None - Grade 8) 0.038* 0.047* 0.046* 0.035* 0.033* 0.031* Complete GET (Grade 9 - 11) 0.097* 0.084* 0.081* 0.089* 0.100* 0.100* Matric (Grade 12) 0.190* 0.199* 0.178* 0.175* 0.174* 0.194* Diploma 0.153* 0.089** 0.121* 0.168* 0.169* 0.152* Degree 0.117* 0.090* 0.116* 0.115* 0.140* 0.196* Urban 0.132* 0.169* 0.146* 0.131* 0.108* 0.086* Managers 0.726* 0.654* 0.704* 0.705* 0.771* 0.749* Professionals 0.537* 0.546* 0.564* 0.525* 0.557* 0.554* Clerks 0.277* 0.305* 0.299* 0.279* 0.267* 0.266* Service Workers 0.175* 0.091* 0.139* 0.187* 0.244* 0.281* Skilled Agricultural 0.473* -0.027 0.385* 0.574* 0.679* 0.705* Craft & Trade Workers 0.250* 0.216* 0.255* 0.252* 0.289* 0.362* Operators & Assemblers 0.170* 0.190* 0.171* 0.159* 0.165* 0.196* Agriculture -0.697* -0.661* -0.751* -0.771* -0.752* -0.654* Mining -0.005 -0.034 -0.046 -0.038 -0.073* -0.038 Utilities 0.157* 0.157** 0.206* 0.157* 0.089 0.115 Construction -0.149* -0.170* -0.196* -0.188* -0.155* -0.139* Wholesale & Retail Trade -0.167* -0.133* -0.164* -0.188* -0.201* -0.173* Transport 0.071* 0.173* 0.101* 0.030 0.004 -0.002 Finance 0.003 0.062 0.017 -0.013 -0.037 -0.023 CSPS 0.021 0.091* 0.035 0.000 -0.049** -0.068* Private Households -0.712* -0.752* -0.827* -0.785* -0.697* -0.551* Experience 0.034* 0.032* 0.032* 0.032* 0.033* 0.036* Experience squared -0.001* 0.000* 0.000* 0.000* 0.000* 0.000* Log of hours (per month) 0.133* 0.243* 0.155* 0.093* 0.079* 0.049** BC/union member 0.024 0.061 0.030 0.027 -0.022 -0.016 BC/non-union member 0.069* 0.061 0.043** 0.055* 0.059* 0.067** Union 0.196* 0.301* 0.240* 0.166* 0.144* 0.091* Emp_lambda -0.115* -0.320* -0.269* -0.208* -0.035 -0.037 Constant 5.374* 4.179* 5.036* 5.762* 6.032* 6.419* Number Observed 24479 24479 24479 24479 24479 24479 Pseudo R2 0.652 0.4322 0.4543 0.4401 0.4273 0.4026
Source: OHS 1995 (Statistics SA); Own Calculations Notes: * Significant at the one percent level ** Significant at the five percent level Other and unspecified categories were omitted from the table
Turning to the coefficients of the dummies that capture bargaining council and union membership, the coefficient of the dummy presenting bargaining council membership together with union membership remain insignificant across the distribution. This means that membership of both a bargaining council and a union at the same time did not have any impact on a formally employed worker’s earnings at any point of the wage distribution in 1995. The coefficient of the dummy capturing bargaining council membership without union membership is not statistically significant at the 10th percentile. It is, however significant at the 25th, 50th, 75th and 90th percentile, with the magnitude increasing towards the top of the

50
distribution. This implies that at the very bottom of the wage distribution, workers did not benefit from being a member of a bargaining council in 1995. Thus the bargaining council premium for non-union members is significant for most of the wage distribution and, notably, remains so even at the 90th percentile. Hence, while the OLS estimates confirmed a significant bargaining council/non-union impact at the mean, we suggest here that this impact holds true across the entire wage distribution, barring those individuals at the 10th percentile. In addition, the coefficients of the union membership dummy are positive and significant across the entire distribution. The fact that the size of the coefficients decline across the wage distribution suggests, as would be expected, that the magnitude of the premia in 1995 was highest amongst those workers in the bottom half of the wage distribution.
Given the focus of the paper, the derived coefficients (if statistically significant) for the bargaining council/union, bargaining council/non-union and union variables at different points in the wage distribution in 1995 are shown in Figure 2. In addition, we also display the mean OLS estimates. In all cases these OLS coefficients are presented by the relevant horizontal lines. The coefficient for bargaining council membership in combination with union membership is insignificant at all points of the wage distribution, and at the mean as discussed above and are therefore not included in the Figure 2.
Figure 2: Estimates of Bargaining Council and Union Membership Impact on Earnings by Percentiles, 1995
-0.1
00.
000.
100.
200.
300.
400.
50C
oeffi
cien
t
0 .05 .1 .15 .2 .25 .3 .35 .4 .45 .5 .55 .6 .65 .7 .75 .8 .85 .9 .95Logwage percentile
bc_nonunion bc_nonunion meanunion union mean
Source: OHS 1995 (Statistics SA); Own Calculations
The coefficient on bargaining council-nonunion is significant at the mean, but not at the very bottom (5th and 10th percentile) or at the very top (95th percentile) of the distribution. This implies that belonging to a bargaining council did not have any impact on these workers’ earnings. The coefficients are significant either at the one percent or the five percent level for
51
the remaining points of the wage distribution. Note, however, that this bargaining council premium is relatively stable across the entire distribution, varying between four percent and eight percent suggesting, therefore, that the impact of bargaining council membership was distribution-neutral.
The coefficients for the dummy representing union membership are positive and statistically significant across the distribution with the exception of the 95th percentile. The estimated coefficients indicate, of course, that union members earned more that their non-unionised counterparts. In addition, the downward trend implies that in 1995, relatively low-earning (and disproportionately unskilled) workers at the bottom end of the distribution benefited more from belonging to a union than better-earning, higher skilled workers.
Table 14 compares the OLS results with those at the 10th, 25th, 50th, 75th and the 90th percentile of the log wage distribution in 2005. The three dummies capturing institutionalised wage formation are private sector bargaining council member; public sector bargaining council member and union member, which is our preferred specification (2) from Table 12. The results are very similar to those estimated in 1995. One main difference is that the White wage premium has declined at that bottom of the distribution, with Asians actually earning more than Whites relative to Africans at the 10th percentile. Again, females were likely to earn less than their male colleagues, but in comparison with 1995 the differential has declined at the very top of the distribution.
Higher earnings were, as expected, associated with a higher level of education across the wage distribution in 2005. Living in a metro area as opposed to a non-metro area was associated with higher earnings. This premium declined over the distribution and is not significant at the very top of the distribution. The results by provinces are not displayed in Table14. With the exception of the Western Cape at the 10th, 25th, 50th and 90th percentile, and the Eastern Cape at the 10th percentile, all coefficients for all provinces are negative and statistically significant, meaning that workers living outside Gauteng earned less than those that resided in the province.

52
Table 14: Earnings Function Estimates, 2005
Quantile (θ) = Dependent Variable: Log of monthly earnings OLS 0.10 0.25 0.50 0.75 0.90 Coloured 0.1419* 0.068 0.184* 0.221* 0.222* 0.140* Asian 0.3440* 0.315* 0.335* 0.383* 0.354* 0.307* White 0.4437* 0.306* 0.472* 0.570* 0.584* 0.537* Female -0.2086* -0.166* -0.252* -0.228* -0.217* -0.175* No education to Incomplete GET (None to Grade 8)
0.0280* 0.016 0.032* 0.029* 0.037* 0.022*
Complete GET (Grade 9 to 11) 0.0551* 0.047** 0.039* 0.043* 0.049* 0.082* Matric (Grade 12) 0.2646* 0.157* 0.259* 0.285* 0.306* 0.361* Diploma 0.1765* 0.113 0.271* 0.262* 0.225* 0.171* Degree 0.2282* 0.237* 0.177* 0.178* 0.247* 0.286* Metro 0.0659* 0.079** 0.144* 0.104* 0.075* 0.013 Managers 0.8966* 0.803* 0.788* 0.882* 0.898* 1.009* Professionals 0.5648* 0.541* 0.511* 0.576* 0.496* 0.477* Clerks 0.3953* 0.358* 0.375* 0.435* 0.383* 0.402* Service Workers 0.0608* 0.003 0.047 0.093* 0.075* 0.115* Skilled Agricultural 0.3821* 0.087 0.174* 0.342* 0.459* 1.437* Craft and Trade Workers 0.1617* 0.046 0.176* 0.205* 0.198* 0.220* Operators and Assemblers 0.1638* 0.135* 0.144* 0.174* 0.141* 0.157* Agriculture -0.4214* -0.253* -0.291* -0.410* -0.548* -0.645* Mining 0.3137* 0.417* 0.340* 0.322* 0.266* 0.108* Utilities 0.0735 -0.032 0.198* 0.183* 0.106** 0.051 Construction -0.1682* -0.099 -0.155* -0.132* -0.205* -0.260* Wholesale and Retail Trade -0.2535* -0.285* -0.203* -0.210* -0.226* -0.276* Transport 0.0389 -0.110 0.058 0.044 0.067** 0.040 Finance -0.0277 -0.001 -0.040 -0.069** -0.007 -0.014 CSPS -0.1601* -0.216* -0.174* -0.096* -0.107* -0.146* Private Households -0.7083* -0.347 -0.345** -0.554* -0.941* -1.019* Experience 0.0236* 0.015* 0.024* 0.025* 0.029* 0.033* Experience squared -0.0002* 0.000** 0.000* 0.000* 0.000* 0.000* Log of hours worked per month 0.1709* 0.247* 0.162* 0.114* 0.089* 0.129* Private Sector BC Member 0.0304 0.048 0.010 0.021 0.021 -0.011 Public Sector BC Member 0.2802* 0.317* 0.326* 0.257* 0.256* 0.191* Union 0.2349* 0.351* 0.306* 0.274* 0.212* 0.147* Emp_lambda -0.1837* -0.385* -0.100 -0.065 -0.112** -0.135 Constant 5.9866* 5.317* 5.543* 6.096* 6.574* 6.800* Number Observed 14746 14746 14746 14746 14746 14746 Adjusted R2 0.5431 0.2301 0.3320 0.3933 0.4064 0.3936
Source: LFS 2005: 2 (Statistics SA); Own Calculations Notes: * Significant at the one percent level ** Significant at the five percent level Other and unspecified categories were omitted from the table
As in 1995, the coefficients for the Managers, Professionals and Clerks are positive and significant across the distribution, with the magnitudes relatively stable. This means that, as expected, workers in these occupation groups earned more that Elementary Workers across the distribution. The coefficient of the dummy for Service Workers only becomes significant at the 50th percentile. The positive coefficients at the 50th, 75th and 90th percentile mean that Service Workers in the top half of the wage distribution earned more than Elementary Workers. The coefficient for agricultural workers is not significant at the 10th percentile. It becomes significant at the 25th percentile and the magnitude increases across the distribution. With the exception of Craft and Trade workers at the 10th percentile, workers from this occupation group and Operators and Assemblers across the distribution earned more than Elementary Workers in 2005.

53
The coefficients of the dummies that capture private sector bargaining council membership are statistically insignificant at all estimated percentiles of the distribution. In other words, workers in the private sector did not enjoy any wage premium associated with membership of private sector bargaining council in 2005, thus, reinforcing the OLS estimate. The coefficients for the public sector bargaining council membership are positive and significant across the wage distribution. The size of the coefficient increases slightly from the 10th to the 25th percentile, before declining towards the top of the distribution. Again, this suggests that workers in the bottom half of the distribution benefited more from being covered by public sector bargaining council wage agreements. The coefficients of the union membership dummy are also again positive and significant across the wage distribution. As expected the magnitude of coefficients declines across the distribution, capturing the relatively higher union wage premia enjoyed by workers in the bottom half of the distribution. The result at the 10th percentile is very interesting, with the union wage premium in fact exceeding the wage premium associated with public sector bargaining council membership.
Figure 3 graphically presents the impact of institutional wage formation across the wage distribution in 2005.
The coefficient for the private bargaining council dummy is statistically insignificant at the mean as well as across the wage distribution, with the notable exception (although not shown in Table 14) of the 5th percentile. The fact that the coefficient is significant at the 5th percentile implies that the only workers in the private sector who benefited from belonging to a bargaining council in 2005 were those at the very bottom end of the distribution. Closer inspection of the data reveals these workers were predominantly Operators and Assemblers in the Clothing sector, semi- and unskilled workers belonging to the Metal and Engineering Bargaining Council as well as semi- and unskilled workers in the motor industry.
The situation looks completely different for public sector employees who were members of the nascent public service bargaining councils. The coefficient for the dummy is, thus, positive and significant at the mean as well as at all points in the earnings distribution. In 2005, membership of a public service bargaining council offered a wage premium of between 18 percent and 34 percent. This public service bargaining council wage gap increased from the 5th percentile to the 35th percentile, before declining to the lowest point at the 95th percentile (apart from a spike around the 60th and 65th percentile).

54
Figure 3: Estimates of Bargaining Council and Union Membership Impact on Earnings by Percentiles, 2005
-0.0
50.
050.
150.
250.
35C
oeffi
cien
t
0 .05 .1 .15 .2 .25 .3 .35 .4 .45 .5 .55 .6 .65 .7 .75 .8 .85 .9 .95Logwage percentile
bc_pub bc_pub_meanunion union_mean
Source: LFS 2005: 2 (Statistics SA); Own Calculations
Similar to the previous graph, the coefficient for the union membership dummy is positive and statistically significant at the mean as well as across the distribution. The union wage premium declined across the wage distribution; with the wage gap for unionised workers at the 5th percentile almost double the gap for the unionised workers at the very top of the distribution.
It is important to note in 1995, the values of the union wage premia were higher than the bargaining council wage premia at all points of the wage distribution. This is no longer the case in 2005, as illustrated above. At the 20th, 25th, 35th and 40th percentiles as well as from the 60th percentile onwards, the public sector bargaining council wage premia is, in fact, higher than the union wage premia. This represents an additional feature of our institutionalised industrial system, namely that not only has there been the establishment of a highly organised public sector bargaining council system, this new labour market institution has also crucially, been able to extract returns for their workers as high, or in some cases higher, than those who are members of a union. This is distinctly a new feature into our understanding of wage levels, wage formation of the role of labour markets in the former. The rise of the PSBC system must, therefore, be noted as a distinctly new development in our understanding of the post-apartheid labour market in South Africa.
55
Determinants of Wage Inequality: Inter-Quantile Regression Estimates
For both years, we estimated the impact of the explanatory variables on the differences in earnings, specifically between the 90th and the 10th percentiles, the 90th and the 50th percentiles and finally the 50th and the 10th percentiles, based on equation (3) above. The results for 1995 can be found in Appendix I, with those for 2005 in Appendix J.
We are particularly interested in the impact of wage setting in bargaining councils and unions on the earnings inequality. This may provide some evidence on the extent to which institutional wage formation contributes to the increase or decline in wage inequality. The coefficients for the dummy representing membership of a bargaining council only are insignificant for all three inter-quantile estimates in 1995. This means that in 1995 wage agreements negotiated in bargaining councils did not contribute to altering earnings inequality between the 90th-10th, 90th-50th and the 50th-10th percentiles. This means that there is no significant difference in the wage premium associated with a non-union bargaining council member at the chosen interquantiles. This is consistent with the fact that at the quantiles, the coefficients did not vary much from each other and from the mean.
The coefficient for the dummy capturing bargaining council – union membership is significant (at the five percent level) only for the 90th-10th percentile difference. This result is interesting because the coefficient was insignificant at the mean (as estimated by the OLS regression) and at all points of the wage distribution. It does suggest that bargaining council membership in tandem with union membership may have served to narrow the wage gap between the workers at the very bottom and at the top of the distribution.
The union coefficient is significant at the one percent level for all three percentile differentials. The negative coefficient implies that in 1995, membership of a union reduced wage inequality between the 90th and 10th percentile, the 90th and 50th percentile as well as the 50th and 10th percentile. The impact was largest for the 50th to 10th percentile, implying that union membership served mostly to reduce wage inequality in the bottom half of the wage distribution. The results though reinforce the importance of union membership to not only increase wage premia to workers, but also as a contribution to decreasing wage inequality.
In 2005, the coefficient for union membership is again significant (at the five percent level) for all three percentile differentials. The coefficient is largest for the 50th-10th percentile, again showing that the reduction in overall wage inequality was driven by the reduction in wage inequality in the bottom half of the distribution. The dummies representing membership of a private and public sector bargaining council were both statistically significant only for the 90th-50th percentile difference. This means that membership of any bargaining council decreased wage inequality in the top half of the wage distribution.
Ultimately then, in both years union membership not only awarded wage premia across the wage distribution, it also served to reduced wage inequality and particularly so in the bottom half of the wage distribution. In 1995, (private sector) bargaining council membership awarded a relatively stable premium to all wage earners, with no impact on wage inequality. In 2005,

56
only membership of a public sector bargaining council awarded a wage premium, with no wage benefits associated with being a member of a private sector bargaining council. Interestingly, both private and public sector bargaining council membership served to reduce inequality in the top half of the wage distribution.

57
6. Conclusion
The main objective of the study was to estimate the wage premium (if any) associated with industrial or bargaining council membership in the South African labour market. As this was done for both 1995 and 2005, it also enabled us to comment on the changing patterns of institutionalised wage formation in the post-apartheid South Africa.
The descriptive overview showed that only about 15 percent of formally employed workers were members of bargaining councils in 1995. Although, this figure had doubled to 32 percent in 2005, this still meant that less than a third of the formally employed were covered by bargaining councils. Closer inspection of the increase in bargaining council membership between 1995 and 2005 revealed that is was almost entirely driven by the rapid rise in the bargaining council system for the public sector. The establishment of the Private Sector Coordinating Bargaining Council (PSCBC) meant that all non-managers (and even some levels of management) in the public sector were covered by wage agreements concluded in the PSCBC. In the private sector, however, bargaining councils have at best stagnated and at worse declined between 1995 and 2005. Despite aggregate employment growth in sectors such as Construction and Trade, bargaining council membership has not expanded accordingly. The only notable growth in bargaining council coverage was in the State Owned Enterprise-related sectors. Overall, the number of private sector workers covered by bargaining council agreements remained relatively stable at around 1 million. Simply put, bargaining council membership in the first decade of democracy is characterised by an erosion of private sector bargaining council membership on the one hand and the rapid rise of this system of bargaining in the public sector.
At first glance, there did not appear to have been any significant remunerative advantage associated with bargaining council membership in either 1995 or 2005. Closer inspection of the mean earnings of bargaining council members in 2005, however, revealed significant premia associated with membership of the PSCBC. At the aggregate level, public sector bargaining council members not only earned more than the private sector bargaining council members, but also on average more than workers outside the bargaining council system. This trend was observed for males and females, African and Coloured workers, as well as when controlling for occupations.
Our multivariate analysis, in turn, allowed us to isolate the specific impact of the membership of a bargaining council, union or both on earnings.
The results from this analysis confirmed the tentative conclusions from the descriptive overview. Hence, in 1995, workers in the bargaining council-nonunion cohort only enjoyed a small wage premium relative to workers who were not covered by any institutional wage agreement. Workers in the union-bargaining council cohort did not enjoy any significant benefit in terms of average earnings. The establishment of the PSCBC, however, resulted in significant wage premia being associated with public sector bargaining council membership in
58
2005. The decline of the private sector bargaining council system, in turn, resulted in the membership of these councils not offering any wage premium to their members who were not unionised – a contrast from a decade earlier. Workers who belonged to both a union and bargaining council in 2005 did, however, enjoy a wage premia. The wage premium associated with union membership, however, remains very strong between 1995 and 2005.
We also estimated the impact of bargaining council and union membership at different points of the wage distributions as well their impact on differences in earnings. In 1995 and 2005, union membership not only awarded wage premia across the wage distribution, it also served to reduced wage inequality (by reducing the differences in earnings) and particularly so at the bottom half of the wage distribution. Private sector bargaining council membership awarded a relatively stable premium to all wage earners in 1995, with no impact on wage inequality. In 2005, only membership of a public sector bargaining council awarded a wage premium, with no wage benefits associated with being a member of a private sector bargaining council. Interestingly, both private and public sector bargaining council membership served to reduce inequality in the top half of the wage distribution in 2005.
The above, therefore, has attempted a detailed overview of the nature of the wage formation and determination in the South African labour market. It is clear that, while the role of trade unions is made plain and is evident – the often under-appreciated importance of bargaining councils in this arena has been analysed in detail. Indeed, it could be argued that any debate and the regulatory regime in South Africa should not and cannot ignore the centrality of bargaining councils to resolving and understanding many of these vexed issues.
59
7. References Altman, M. 2006. Wage determination in South Africa: What do we know? Transformation, No
60. pp. 58-89. Azam, J. & Rospabe, S. 2005. Trade Unions v. Statistical Discrimination: Theory and
Application to Post-Apartheid South Africa. Bargaining Council for the Entertainment Industry of South Africa. 2005. Agreements.
Available from http://www.bcei.co.za/ Bhorat, H. & Leibbrandt, M. 2001. Modelling Vulnerability and Low Earnings in the South
African Labour Market. In Bhorat, H. et al. (eds.), Fighting Poverty Labour Markets and Inequality in South Africa. Landsdowne: UCT Press.
Bhorat, H., Lundall, P. & Rospabe, S. 2002. The South African Labour Market in a Globalizing
World: Economic and Legislative Considerations. IOL Employment Paper 2002/32 Bhorat, H. & Oosthuizen, M. 2006. Determinants of Grade 12 Pass Rates in the Post-
Apartheid South African Schooling System. SISERA Working Paper Series. 2006/6. Butcher, K.F. & Rouse, C.E. 2001. Wage Effects of Unions and Industrial Councils in South
Africa. Industrial and Labour Relations Review, Vol. 54. No 2. January 2001, pp. 349-374.
Case Database Chamber of Mines of SA. 2007. Industrial Relations Services (IRS): Collective Bargaining.
Available from http://www.bullion.org.za/Departments/Industrial/Industrial.htm Department of Labour. 2006. Basic Guide to Bargaining Councils. Available from
www.labour.gov.za Department of Labour. 2007. All About Sectoral Determinations. Available from
www.labour.gov.za Godfrey, S. 1992. Industrial Council Digest: Statutory Institutions for Collective Bargaining in
South Africa, 1979-1992. Cape Town: Industrial Relations Project, Department of Sociology, University of Cape Town.
Godfrey, S. 2007. The State of Collective Bargaining in South Africa. An Empirical and
Conceptual Study of Collective Bargaining Now and in the Future. Unpublished Mimeo.
60
Godfrey, S & Macun, I. 1991. The politics of centralized bargaining: issues concerning
Industrial Councils in South Africa’s bargaining structure. University of Cape Town: African Studies Library Pamphlet
Godfrey, S., Maree, J. & Theron, J. 2006. Conditions of Employment and Small Business:
Coverage, Compliance and Exemptions. Development Policy Research Unit Working Paper No 06/106, March 2006. Cape Town: University of Cape Town.
Halvorsen, R. & Palmquist, R. 1980. The Interpretation of Dummy Variables in
Semilogarithmic Equations. The American Economic Review, Vol. 70. No. 3. (June 1980). pp. 474-475.
Hassan, E. 2003. The Power behind the Desk: Democracy, Collective Bargaining and the
Public Service in South Africa. In G. Mhone & O. Edigheji (eds.), Governance in the New South Africa: The Challenges of Globalisation. University of Cape Town Press: Cape Town.
Hassan, E. 2007. Personal communication Koenker, R. & Basset, G. 1978. Regression Quantiles. Econometrica, Vol. 46(1), pp. 33-50. Koenker, R and Hallok, K.F. 2001. Quantile Regression. Journal of Economic Perspectives,
Vol. 15(4), Fall, pp. 143-156. Labour Research Service. 2005. Annual Report 2004/05. July 2005. Cape Town: Labour
Research Service. Available from www.lrs.org.za Labour Research Service. 2006. Actual Wage Rates Database (AWARD). Online database.
http://award.lrs.org.za/home.php Metal and Engineering Industries Bargaining Council (MEIBC). 2007. Metal and Engineering
Industries Bargaining Council Consolidated Main Agreement. 2005/2007. As amended on 2 February 2007. Available from http://www.meibc.co.za/
Michaud, P-C. & Vencatachellum, D. 2001. The Union Wage Premium for Blacks in South
Africa. Paper presented at the DPRU/FES Conference. Labour Markets and Poverty in South Africa. 15-16 November 2001, Misty Hills Country Hotel, Johannesburg.
Motor Industry Bargaining Council (MIBCO). 2006. Motor Industry Bargaining Council Main
Agreement. December 2006. Available from http://www.mibco.org.za/

61
National Bargaining Council for the Chemical Industry. 2003. The Constitution of the National Bargaining Council for the Chemical Industry. May 2003. Available from http://www.nbcci.org.za/
National Bargaining Council for the Chemical Industry. 2005. Industrial Chemicals Sector.
Substantive Agreement for 2005/2006. Available from http://www.nbcci.org.za/ National Economic Development & Labour Council (Nedlac). 2007. www.nedlac.org.za National Textile Bargaining Council (NTBC). 2003. Transitional Agreement: National Textile
Bargaining Council. Available from http://www.ntbc.co.za/constitution.htm Oosthuizen, M. 2006. The Post-Apartheid Labour Market: 1995-2003. Development Policy
Research Unit Working Paper No 06/103. Cape Town: University of Cape Town. Public Sector Coordination Bargaining Council (PSCBS). 2005. Background. Available from
http://www.pscbc.org.za/content.aspx?PageID=57 Republic of South Africa. 1995. Labour Relations Act. No 66 of 1995. Available at
www.labour.gov.za Republic of South Africa. 1996. Restructuring the South African Labour Market. Report of the
Presidential Commission to Investigate Labour Market Policy. June 1996. Republic of South Africa. 1997. The Basic Conditions of Employment Act. Republic of South Africa. 1998. Employment Equity Act. No 55 of 1998. Available at
www.labour.gov.za Republic of South Africa. 1999. Diamond Cutting Industry: Extension of Main Collective
Agreement to Non-Parties. Government Gazette. 23 July 1999. No 20288. Government Printer: Pretoria. Available from http://www.sabinet.co.za
Republic of South Africa. 2000. Bargaining Council for the Furniture Manufacturing Industry of
the South Western Districts: Extension of Main Collective Amending Agreement to Non-Parties. Government Gazette. 25 August 2000. No 21486. Government Printer: Pretoria. Available from http://www.sabinet.co.za
Republic of South Africa. 2000. Furniture Manufacturing Industry of the Western Cape:
Extension of Consolidated Main Collective Agreement to Non-Parties. Government Gazette. 19 May 2000. No 21187. Government Printer: Pretoria. Available from http://www.sabinet.co.za

62
Republic of South Africa. 2000. Labour Relations Act, 1995: Bargaining Council for the Furniture Trade, Free State: Extension of Main Collective Agreement (A-Agreement) to Non-Parties. Government Gazette. 29 December 2000. No 21293. Government Printer: Pretoria. Available from http://www.sabinet.co.za
Republic of South Africa. 2004. Bargaining Council for the Building Industry (Bloemfontein):
Extension of Collective Agreement to Non-Parties. 9 July 2004. No 26524. Government Printer: Pretoria. Available from http://www.sabinet.co.za
Republic of South Africa. 2004. Bargaining Council for the Building Industry (Cape of Good
Hope): Extension of Collective Agreement to Non-Parties. 22 October 2004. No 26909. Government Printer: Pretoria. Available from http://www.sabinet.co.za
Republic of South Africa. 2004. Bargaining Council for the Building Industry, Kimberley:
Extension of Collective Agreement to Non-Parties. 23 July 2004. No 26577. Government Printer: Pretoria. Available from http://www.sabinet.co.za
Republic of South Africa. 2004. Bargaining Council for the Building Industry, North and West
Boland: Extension of Collective Agreement to Non-Parties. 22 October 2004. No 26910. Government Printer: Pretoria. Available from http://www.sabinet.co.za
Republic of South Africa. 2004. Bargaining Council for the Canvas Goods Industry,
Witwatersrand and Pretoria: Extension of Main Collective Agreement to Non-Parties. Government Gazette. 15 October 2004. No 26878. Government Printer: Pretoria. Available from http://www.sabinet.co.za
Republic of South Africa. 2004. Commercial Distributive Trade Bargaining Council, Kimberley:
Extension of Main Collective Agreement to Non-parties. 2 April 2004. No 26181. Government Printer: Pretoria. Available from http://www.sabinet.co.za
Republic of South Africa. 2004. Furniture, Bedding and Upholstery Industry Bargaining
Council, Greater Northern Region: Extension of Main Amending Collective Agreement to Non-Parties. 9 July 2004. No 26524. Government Printer: Pretoria. Available from http://www.sabinet.co.za
Republic of South Africa. 2004. Jewellery and Precious Metal Industry (Cape): Extension of
Amendment of Main Collective Agreement to Non-Parties. 13 August 2004. No 26650. Government Printer: Pretoria. Available from http://www.sabinet.co.za
Republic of South Africa. 2004. Meat Trade, Gauteng: Extension of Re-enactment and
Amendment of Main Collective Agreement to Non-Parties. 23 April 2004. No 26264. Government Printer: Pretoria. Available from http://www.sabinet.co.za
63
Republic of South Africa. 2005. Bargaining Council for the Electrical Industry of South Africa: Extension of Main Collective Amending Agreement to Non-Parties. 01 April 2005. No 27418. Government Printer: Pretoria. Available from http://www.sabinet.co.za
Republic of South Africa. 2005. Metal and Engineering Industries Bargaining Council:
Extension of Re-enacting and Amending Collective Agreement to Non-Parties. 9 September 2005. No 27992. Government Printer: Pretoria. Available from http://www.sabinet.co.za
Republic of South Africa. 2004. Motor Industry Bargaining Council-MIBCO: Extension to Non-
parties of Main Collective Agreement Re-enacting and Amending Agreement. 26 November 2004. No 27007. Government Printer: Pretoria. Available from http://www.sabinet.co.za
Republic of South Africa. 2005. Bargaining Council for the Contract Cleaning Industry (Natal):
Extension of Amendment of Main and Provident Fund Collective Agreement to Non-Parties. 22 July 2005. No 27788. Government Printer: Pretoria. Available from http://www.sabinet.co.za
Republic of South Africa. 2005. Bargaining Council for the Fishing Industry: Extension of
Period of Operation of Main Collective Agreement. Government Gazette. 1 July 2005. No 27713. Government Printer: Pretoria. Available from http://www.sabinet.co.za
Republic of South Africa. 2005. Bargaining Council for the Furniture Manufacturing Industry of
the Eastern Cape: Extension of Amendment of Collective Agreement. Government Gazette. 9 September 2005. No 27992. Government Printer: Pretoria. Available from http://www.sabinet.co.za
Republic of South Africa. 2005. Bargaining Council for the Hairdressing and Cosmetology
Trade (Pretoria): Extension to Non-parties of Main Collective Amending Agreement. 18 March 2005. No 27371. Government Printer: Pretoria. Available from http://www.sabinet.co.za
Republic of South Africa. 2005. Bargaining Council for the Laundry, Cleaning and Dyeing
Industry (Cape): Extension of Amendment of Main Collective Agreement to Non-parties. 1 July 2005. No 27731. Government Printer: Pretoria. Available from http://www.sabinet.co.za
Republic of South Africa. 2005. Bargaining Council for the Laundry, Cleaning and Dyeing
Industry (Natal): Extension of Amendment of Collective Agreement to Non-Parties. 5 August 2005. No 27847. Government Printer: Pretoria. Available from http://www.sabinet.co.za
64
Republic of South Africa. 2005. Bargaining Council for the Restaurant, Catering and Allied Trades: Extension of Re-enactment and Amendment of Main Collective Agreement to Non-Parties. 2 September 2005. No 27947. Government Printer: Pretoria. Available from http://www.sabinet.co.za
Republic of South Africa. 2005. Bargaining Council for the Tearoom, Restaurant and Catering
Trade, Pretoria: Extension of Re-enactment and Amendment of Main Collective Agreement to Non-Parties. 12 August 2005. No 27868. Government Printer: Pretoria. Available from http://www.sabinet.co.za
Republic of South Africa. 2005. Hairdressing and Cosmetology Services Bargaining Council
(Semi National): Extension to Non-parties of Main Collective Amending Agreement. 24 March 2005. No 27397. Government Printer: Pretoria. Available from http://www.sabinet.co.za
Republic of South Africa. 2005. National Bargaining Council for the Clothing Manufacturing
Industry: Extension to Non-parties of National Main Collective Agreement. Government Gazette. 15 December 2005. No 28280. Government Printer: Pretoria. Available from http://www.sabinet.co.za
Republic of South Africa. 2005. National Bargaining Council of the Leather Industry of South
Africa: Extension to Non-Parties of the Footwear Section. 16 September 2005. No 28012. Government Printer: Pretoria. Available from http://www.sabinet.co.za
Republic of South Africa. 2005. National Bargaining Council of the Leather Industry of South
Africa: Extension to Non-Parties of the General Goods and Handbag Section Collective Amending Agreement. 9 September 2005. No 27992. Government Printer: Pretoria. Available from http://www.sabinet.co.za
Republic of South Africa. 2005. National Bargaining Council for the Leather Industry of South
Africa: Extension to Non-Parties of the Tanning Section Collective Amending Agreement. 24 June 2005. No 27686. Government Printer: Pretoria. Available from http://www.sabinet.co.za
Republic of South Africa. 2006. Hairdressing and Cosmetology Bargaining Council, KwaZulu-
Natal: Extension to Non-Parties of Main Collective Amending Agreement. 24 February 2006. No 28520. Government Printer: Pretoria. Available from http://www.sabinet.co.za
Republic of South Africa. 2007. National Textile Bargaining Council: Extension of New Main
Collective Agreement to Non-Parties. 9 February 2007. No 29578. Government Printer: Pretoria. Available from http://www.sabinet.co.za

65
South African Local Government Bargaining Council (SALGBC). 1997. South African Local Government Bargaining Council. Establishment Agreement. 2 September 1997. Available from http://www.salgbc.org.za/
South African Local Government Bargaining Council (SALGBC). 2001. Constitution of the
South African Local Government Bargaining Council. 19 February 2001. Available from http://www.salgbc.org.za/
South African Local Government Bargaining Council (SALGBC). 2003. Wage Collective
Agreement. February 2003. Available from http://www.salgbc.org.za Southern Africa Labour and Development Research Unit (SALDRU). 1990. Industrial Council
Wage Rates in South Africa (1978-1988). SALDRU: Cape Town Standing, G., Sender, J. & Weeks, J. 1996. Restructuring the Labour Market: The South
African Challenge. An ILO Country Review. International Labour Office: Geneva Statistics South Africa, 2006. CPI History: Metropolitan Areas – All Items. P0141.1. Available
from http://www.statssa.gov.za/keyindicators/CPI/CPIHistory.pdf Statistics South Africa. 2006. Labour Force Survey September 2005. P0210. Transnet Bargaining Council (TBC). 2005. Transnet Bargaining Council: Collective
Agreement. 23 August 2005. Available from http://www.tbc.co.za/ Van der Berg, S. & Bhorat, H. 1999. The Present as Legacy of the Past: The Labour Market,
Inequality and Poverty in South Africa. Development Policy Research Unit Working Paper. No 01/29. University of Cape Town: Cape Town.

66
Appendix A: List of Industrial Councils – 1995 Industrial Council for the Cinematograph and Theatre Industry Industrial Council for the Diamond Cutting Industry Industrial Council for the Iron, Steel, Engineering and Metallurgical Industry Industrial Council for the Leather Industry Industrial Council for the Motor Industry Industrial Council for the Textile Manufacturing Industry Industrial Council for the Building Industry (East London) Industrial Council for the Building Industry (Eastern Cape) Industrial Council for the Building Industry (Kimberley) Industrial Council for the Building Industry (Kroonstad) Industrial Council for the Building Industry (PMB and Northern Areas) Industrial Council for the Building Industry (Port Natal) Industrial Council for the Building Industry (Western Province) Industrial Council for the Building and Monumental Masonry Industry (Bloemfontein) Industrial Council for the Building and Monumental Masonry Industry (Transvaal) Industrial Council for the Clothing Industry (Cape) Industrial Council for the Clothing Industry (Eastern Province) Industrial Council for the Clothing Industry (Natal) Industrial Council for the Clothing Industry (Orange Free State and Northern Cape) Industrial Council for the Knitting Industry (Transvaal) Industrial Council for the Electrical Contracting and Servicing Industry (Cape) Industrial Council for the Electrical Contracting Industry (Transvaal) Industrial Council for the Electrical Industry (East London) Industrial Council for the Electrical Industry – Electrical Contracting Section (Natal) Industrial Council for the Furniture Manufacturing Industry (Border) Industrial Council for the Furniture Manufacturing Industry (Eastern Cape Province) Industrial Council for the Furniture Manufacturing Industry (Natal) Industrial Council for the Furniture Manufacturing Industry (Orange Free State) Industrial Council for the Furniture Manufacturing Industry (South Western Districts) Industrial Council for the Furniture Manufacturing Industry (Western Cape) Industrial Council for the Furniture and Bedding Manufacturing Industry (Transvaal) Industrial Council for the Hairdressing Trade (Border) Industrial Council for the Hairdressing Trade (Cape Peninsula) Industrial Council for the Hairdressing Trade (Natal) Industrial Council for the Hairdressings Trade (Pretoria) Industrial Council for the Hairdressing Trade (Port Elizabeth) Industrial Council for the Hairdressing Trade (Southern and Western Transvaal) Industrial Council for the Laundry, Cleaning and Dyeing Industry (Cape) Industrial Council for the Laundry, Cleaning and Dyeing Industry (Natal) Industrial Council for the Laundry, Cleaning and Dyeing Industry (Transvaal) Industrial Council for the Liquor and Catering Trade (Cape)

67
Industrial Council for the Liquor and Catering Trade (South Coast, Natal) Industrial Council for the Liquor, Catering and Accommodation Trade (Border) Industrial Council for the Motor Transport Undertaking (Goods) Industrial Council for the Grain Co-operative Trade Industrial Council for the Contract Cleaning Industry Industrial Council for the Canvas and Ropemaking Industry Industrial Council for the Canvas Goods Industry Industrial Council for the Chemical Industry Industrial Council for the Commercial Distributive Trade Industrial Council for the Jewellery and Precious Metal Industry Industrial Council for the Meat Trade (Wholesale & Retail – East London) Industrial Council for the Millinery Industry (Cape) Industrial Council for the Millinery Industry (Transvaal) Industrial Council for the New Tyre Manufacturing Industry Industrial Council for the Passenger Transportation Trade Industrial Council for the Retail Meat Trade (Witwatersrand) Industrial Council for the Retail Meat Trade (Pretoria) Industrial Council for the Road Passenger Transport Industry (PE) Industrial Council for the Tearoom, Restaurant, and Catering Trade (Pretoria) Industrial Council for the Tearoom, Restaurant and Catering Trade (Witwatersrand) Industrial Council for the Worsted Textile Manufacturing Industry

68
Appendix B: List of Bargaining Councils – 2005 Bargaining Council for the Fishing Industry Bargaining Council for the Canvas Good Industry (Witwatersrand and Pretoria) Bargaining Council For The Canvas & Ropeworking Industry (Cape) National Bargaining Council for the Chemical Industry National Bargaining Council for the Clothing Manufacturing Industry Diamond Cutting Industry of SA Bargaining Council Furniture Manufacturing Industry BC (EC) Furniture Manufacturing Industry BC (FS) Furniture Manufacturing Industry BC (KZN) Furniture Manufacturing Industry BC (South Western Districts) Furniture Manufacturing Industry BC (WC) Furniture Industry Bargaining Council (Northern Region) Grain Cooperative Industry Bargaining Council (Nat) Jewellery and Precious Metal Industry BC (Cape) National Bargaining Council for the Leather Industry Metal and Engineering Industries Bargaining Council Bargaining Council for the New Tyre Manufacturing Industry National Bargaining Council for the Sugar Manufacturing and Refining Industry National Textile Bargaining Council Bargaining Council for the Building Industry (Boland) Bargaining Council for the Building Industry (Southern & Eastern Cape) Bargaining Council for the Building Industry (Cape of Good Hope) Bargaining Council for the Building Industry (Bloemfontein) Bargaining Council for the Building Industry (Kimberley) National Bargaining Council for the Electrical Industry Commercial Distributive Trade Bargaining Council Kimberley Bargaining Council for the Meat Trade, Gauteng Motor Industry Bargaining Council Bargaining Council for the Tearoom, Restaurant and Catering Trade Pretoria Bargaining Council for the Restaurant, Catering and Allied Trades Motor Ferry Industry Bargaining Council of SA National Bargaining Council for the Road Freight Industry South African Road Passenger Bargaining Council Bargaining Council for the Contract Cleaning Industry (Natal) Bargaining Council for the Entertainment Industry of SA Hairdressing and Cosmetology Services Bargaining Council (Semi -National) Bargaining Council for the Hairdressing and Cosmetology Services (Pretoria) Hairdressing Trade Bargaining Council(Cape Peninsula) Hairdressing and Cosmetology Bargaining Council (KZN)

69
Bargaining Council for the Laundry, Cleaning and Dyeing Industry (Cape) Bargaining Council for the Laundry, Cleaning and Dyeing Industry (KZN) Transnet Bargaining Council (Nat) Public Service Coordinating Bargaining Council (Nat) General Public Service Sector Bargaining Council (Nat) Public Health and Welfare Sectoral Bargaining Council (Nat) Safety and Security Sectoral Bargaining Council (Nat) Education Labour Relations Council (National) South African Local Government Bargaining Council

70
Appendix C: Technical Notes: Creation of IC Coverage for 1995 Coverage was constructed using the Industrial Council Digest and the OHS. Some of the assumptions are noted below: Areas / Districts The Digest identified areas which were covered in 1992. Some provinces / areas were since renamed. The following are some of the districts / areas used to match the two. The Witwatersrand was assumed to be what is now called the Gauteng province. Cape Peninsula was assumed to be the following districts: Bellville Goodwood Cape Town Kuilsrivier Mitchells Plain Somerset West Strand Wynberg The Boland included the following districts: Ceres Hopefield Montagu Mooreesberg Piketberg Robertson Swellendam Tulbagh Vredenberg Worcestor Paarl Stellenbosch Wellington The Transvaal includes what is now called the North-West, Gauteng, Mpumalanga, and Northern Province.

71
Agreements The Grain Co-operative was only registered in 1990, but it had unpublished agreements. The Contract Cleaning Industry was registered in April 1992. These were included in the analysis, with the assumption that they had agreements by 1995. Councils
• Since the industry and occupation codes for clothing and textiles are the same, in practice they actually cover the same workers.
• Where different industrial councils existed for different areas, the workers were aggregated into a single ‘council’. This is true for the building, clothing, electrical, furniture, hairdressing, laundry cleaning and dyeing, and liquor and catering industrial councils. The millinery as well as worsted textile manufacturing industrial councils were included under textiles.
Scope The scope from the Digest was used to identify occupations and sectors. These were not explicitly stated, therefore there could be a degree of mismatch.

72
Appendix D: Technical Notes: Creation of BC Coverage 2005 Fishing Industry Bargaining Council
• Wages of skipper (fisherman) not prescribed in the BC Agreement and this occupation group is therefore not included in the estimated coverage
• Only 91 workers estimated to be covered by the BC agreement in the 2005 LFS, which is a significant underestimation
Bargaining Councils for the Canvas Goods Industry
• No information could be obtained on the Cape Canvas Goods & Ropeworking Industry Bargaining Council and it was therefore not included in the analysis
• Matching the information from the Government Gazette Notice on the main agreement for the Canvas Goods Industry (Witwatersrand and Pretoria) to the LFS was unsuccessful and no workers were identified in the LFS as possibly belonging to the BC
Chemical Industry
• Separate agreements exists for the sub-sectors
• It was difficult to get sufficient occupational information from these agreements and it was predominantly operators and assemblers that could be identified in the LFS
• In addition, labourers (manufacturing) were also included in the coverage
National Bargaining Council for the Clothing Industry
• Individual provisions have been made for different parts of the country (corresponding to the “old” regional bargaining councils), but for the purposes of the analysis, country-wide coverage was assumed
• It was assumed that the same occupations are covered in all the individual provisions
National Bargaining Council for the Diamond Cutting Industry
• The Government Gazette from 1999 was used to calculated coverage in terms of occupation groups. In the Government Gazette the industry activity was referred to as the cutting of gem diamonds. Industrial diamond cutting was therefore not included in the estimate of the coverage.

73
Furniture Manufacturing Industry
• The furniture manufacturing industry was covered by six regional councils
• In the main agreement for the Eastern Cape council, no occupation information was provided, and it was decided to only include trade workers and operators that are related to furniture manufacturing.
• For the Free State, the most recent information was from 2000, and this was used to calculate coverage
• There was no occupation information in the agreement for the South Western Districts – the same occupation codes was used as for the Eastern Cape
• There was also no occupation information in the Western Cape and the KwaZulu Natal agreements. Again the same codes as for the Eastern Cape were used
• For the Northern Region, occupation information from the Government Gazette was used – which was the same as that for the Free State
Grain Cooperative Industry Bargaining Council
• The Award database was the only source for occupation information – according to this only unskilled workers are covered by the agreement, these workers were, however, all coded as informal sector employees, therefore no workers covered by this council could be estimated using the LFS
Jewellery and Precious Metal Industry (Cape)
• After matching according to industry, occupation code and area, only elementary workers were identified in the LFS
National Bargaining Council of the Leather Industry of SA
• For the footwear section, the LFS occupation codes were matched to the occupations listed in the gazetted main agreement
• The tanning section and the general goods and handbags section fall under the same industry code in the LFS, therefore these two sections were grouped together and the job descriptions from both the agreements were used to estimate coverage

74
Metal and Engineering Industries Bargaining Council
• Main source of occupational information was the Consolidated Main Agreement as well as the Government Gazette
• There will be overestimation of coverage as it is impossible to extract the sub-sectors not covered by the agreements (see GG for subsectors covered)
• In addition certain sub-sectors were excluded by region – it was also impossible to isolate these in the LFS
• The manufacturing of basic iron and steel was excluded – as per the Government Gazette
• The manufacturing of agricultural implements was also excluded as it is grouped together with a range of unrelated activities in the LFS.
New Tyre Manufacturing
• No agreement has been published for this bargaining council
• The Award database only listed labourer and machine operator as occupations covered
• Only machine operator – tyre production was identified in the LFS
Sugar Manufacturing and Refining Industry
• No recently published information
• Only machine operator, refining sugar was included
National Textile Manufacturing Bargaining Council
• This bargaining council was registered in January 2004 after an amalgamation of the SA Carpet Manufacturing Industry BC, SA Cotton Textile Processing & Manufacturing BC, SA Manufactured Fibres BC, National BC for the Textile Manufacturing Industry of the RSA, BC for the Worsted Textile Manufacturing Industry, SA Wool & Mohair BC
• Transitional Agreement was used to obtain industry coverage and the Government Gazette was used for occupation information
Building Industry
• Separate agreements by region
• Boland: Government Gazette for occupation information
• Bloemfontein: No occupation information in Government Gazette – same codes used as for Boland

75
• Cape of Good Hope: No occupation information in Government Gazette – same codes used as for Boland
• Kimberly: Limited occupation information in Government Gazette – same codes used as for Boland
• South/Eastern Cape; No main agreement since 2001, but still active according to Godfrey et al. (2006). Voluntary bargaining does take place between certain unions and employers with employers outside these groups implementing the same increases. Same codes as for above were used
Electrical Industry
• Covered in both trade and construction sub-sectors
Motor Industry Bargaining Council
• Occupation and industry coverage from Government Gazette and from agreement available on BC website
• It should be noted that there also exists a National Bargaining Forum for the automobile manufacturing industry, which covers the seven Original Equipment Manufacturers (Toyota, VWSA, General Motors, Nissan, BMW, Ford and Daimler Chrysler) (Godfrey, 2007:56). Some of the employees of these companies may have been included in our coverage as it is impossible to identify them in the LFS. The number of employees that are listed under motor vehicle manufacturing in our estimated coverage is only about 13 000 (about 5% of the bargaining council’s total estimated coverage).
Restaurant & Catering & Allied Trades
• Managers (retail shop) are covered by the agreement published in Government Gazette
Tearoom, Restaurant & Catering, Pretoria
• Caterers are covered by the agreement and in the LFS, a caterer is coded as Manager
Motor Ferry Industry
• No occupation information contained in the Government Gazette, but some in the Award database
• The motor ferry industry falls under the same industry code as the Road Freight Industry (see below) and has the same occupation codes – to avoid double-counting it was decided to only include the Road Freight Industry BC

76
Road Freight Industry
• Includes workers in the motor ferry industry
• The relevant industry code in the LFS includes a range of other activities, meaning that the coverage of the BC is significantly overestimated.
SA Road Passenger BC
• Very little information available – only bus drivers included in the estimated coverage
Transnet
• No extension published in a Government Gazette as it only covers one company, namely Transnet
• Assumed that all non-managers in the public enterprises in the relevant transport sectors are covered by the agreement
• Transnet is made up of several business units – for some of these units no public enterprise workers were coded in the LFS under the applicable industry codes (eg Petronet, Transworks, Propnet)
• So there may be underestimation
Contract Cleaning (Natal)
• No occupation information in the Government Gazette – only cleaners were included in the estimated coverage
Entertainment industry
• Agreements have only been published for theatrical productions, video industry & duplication industry, and the distribution and duplication industry
• Some managers and professionals are included here
Hairdressing and Cosmetology
• Four BCs in this industry (Semi-national, Pretoria, Cape Peninsula, KwaZulu-Natal)
• No Government Gazette could be found for the Cape Peninsula BC, but the same occupation codes were used to estimate coverage for all four councils

77
Laundry, Cleaning & Dyeing
• Two bargaining councils (Cape & KwaZulu Natal) with slightly different occupations covered
Public Sector Bargaining Councils
• For the Local Government Bargaining Council all non-managers (as stated in the Government Gazette) was assumed to be covered by the BC
• For National and Provincial Government all non-managers were assumed to be covered, as it is impossible to separate the senior management from those managers covered by the BC agreement

78
Appendix E: Estimated Industrial Council Coverage in the 1995 OHS
Industrial Council/Industry Number Percent IC for the Cinematography & Theatre Industry 9,801 0.12 IC for the Diamond Cutting Industry 762 0.01 IC for the Iron, Steel, Engineering & Metallurgical Industry 293,998 3.62 IC for the Leather Industry 11,039 0.14 IC for the Motor Industry 195,148 2.40 Textile Industry 79,355 0.98 Building Industry 176,839 2.18 Clothing & Knitting Industry 104,217 1.28 Electrical Contracting Industry 61,865 0.76 Furniture Manufacturing Industry 19,229 0.24 Hairdressing Trade 10,211 0.13 Laundry, Cleaning & Dyeing Industry 3,236 0.04 Liquor, Catering & Accommodation Trades 78,063 0.96 IC for the Motor Transport Undertaking 70,025 0.86 Canvas Goods & Ropemaking Industry 10,542 0.13 IC for the Grain Cooperative Trade 27,094 0.33 IC for the Contract Cleaning Industry 1,192 0.01 IC for the Commercial and Distributive Trade 1,065 0.01 IC for Jewellery and Precious Metal 1,557 0.02 IC for the Meat Trade (Wholesale & Retail – East London) 1,375 0.02 IC for the New Tyre Manufacturing Industry 384 0 Passenger Transport Trade 6,162 0.08 Retail Meat Trade 2,698 0.03 Tearoom, Restaurants, Catering Trade 23,919 0.29 IC for the Chemical Industry 3,819 0.05 Total Formal Employment 8,120,279 100 Total BC Coverage 1,193,597 Total BC Coverage (% of Total Formal Employment 15% Workers not covered by ICs 6,926,682 85.3

79
Appendix F: Estimated Bargaining Council Coverage in the 2005 LFS Bargaining Council/Industry Number Percent Fishing Industry BC 91 0 Clothing Industry 102,132 1.27 Diamond Cutting Industry of SA BC 963 0.01 Furniture Manufacturing Industry 41,143 0.50 Jewellery & Precious Metal Industry (Cape) BC 1,435 0.02 BC for the Leather Industry of SA 12,295 0.15 Metal & Engineering Industries BC 196,825 2.45 BC for the New Tyre Manufacturing Industry 6,225 0.08 National BC for the Sugar Manufacturing & Refining Industry 2,430 0.03 BC for the Textile Manufacturing Industry of SA 35,919 0.45 Building Industry 73,412 0.91 National BC for the Electrical Industry 32,428 0.4 Commercial Distributive Trade BC (Kimberley) 5,084 0.06 BC for the Meat Trade, Gauteng 24,177 0.3 BC for the Motor Industry 234,809 2.92 BC for the Restaurant, Catering & Allied Trades 48,274 0.6 BC for the Tearoom, Restaurant & Catering Trade, Pretoria 17,212 0.21 Road Freight & Motor Ferry Industries 89,662 1.12 SA Road Passenger BC 21,486 0.27 Transnet BC 49,530 0.62 BC for the Contract Cleaning Industry (Natal) 16,502 0.21 BC for the Entertainment Industry of SA 4,636 0.06 Hairdressing & Cosmetology Industries 18,099 0.23 BC for the Laundry, Cleaning & Dyeing Industry (Cape) 1,825 0.02 BC for the Laundry, Cleaning & Dyeing Industry (KZN) 1,469 0.02 BC for the Chemical Industry - Glass 5,605 0.07 BC for the Chemical Industry – Individual Consumer Goods, etc. 26,954 0.34 BC for the Chemical Industry –Petroleum 1,776 0.02 SA Local Government Bargaining Council 336,737 4.19 Public Service Bargaining Councils 1,171,195 14.57 Total Formal Employment 8,039,401 100 Total BC Coverage 2,580,331 Total BC Coverage (% of Formal Employment) 32% Total BC Coverage – Government (% of Formal Employment) 13% Workers not covered by BCs 5,459,070 67.9

80
Appendix G: Broad Labour Force Participation Equation, 1995 and 2005 1995 2005 Marginal Effects x-bar Marginal Effects x-bar Coloured -0.0246 * 0.1100 -0.0067 0.0894 Asian -0.1458 * 0.0335 -0.1590 * 0.0282 White -0.1702 * 0.1395 -0.1958 * 0.1038 Female -0.2283 * 0.5289 -0.1004 * 0.5187 25-34 years 0.1153 * 0.3232 0.3521 * 0.2687 35-44 years 0.1036 * 0.2459 0.3103 * 0.1772 45-55 years 0.0285 * 0.1471 0.2475 * 0.1326 55-65 years -0.2248 * 0.1030 0.0706 * 0.1005 No education to incomplete GET 0.0106 * 6.2797 0.0054 * 6.8834 Complete GET 0.0157 * 1.2661 0.0138 * 1.5510 Matric 0.0751 * 0.2752 0.1710 * 0.3078 Diploma 0.0852 * 0.0844 0.0378 0.0801 Degree 0.0089 0.0542 -0.0202 0.0646 Urban/Metro 0.0339 * 0.5891 0.0209 * 0.3755 Western Cape -0.0246 * 0.1230 -0.0295 0.1057 Eastern Cape -0.0950 * 0.1326 -0.0908 * 0.1346 Northern Cape -0.0744 * 0.0240 -0.0546 * 0.0191 Free State 0.0133 0.0685 -0.0708 * 0.0645 KwaZulu Natal -0.0920 * 0.2007 -0.0844 * 0.2046 North West -0.0607 * 0.0871 -0.0469 * 0.0810 Limpopo -0.0421 * 0.0647 -0.0943 * 0.1068 Mpumalanga -0.1370 * 0.0866 -0.0258 ** 0.0662 No of children under 7 years in hh -0.0051 * 0.8549 0.0092 * 0.8020 No of children aged 8-15 yrs in hh -0.0043 ** 0.7973 -0.0320 * 0.8759 No of adults over 60 years in hh -0.0743 * 0.3044 -0.0688 * 0.2650 Observed probability 0.7233 0.6766 Predicted probability (at x-bar) 0.7606 0.7276 Number of Observations 60223 67916 Chi2 8318.43 * 7853.16 * Pseudo R2 0.1764 0.2353
Source: OHS 1995; LFS 2005: 2 (StatisticsSA); Own calculations Notes: * Significant at one percent level ** Significant at five percent level

81
Appendix H: Formal Employment Equation, 1995 and 2005 1995 2005
Marginal Effects x-bar Marginal Effects x-bar
Coloured 0.1837 * 0.1131 0.2207 * 0.0948 Asian 0.2032 * 0.0310 0.2575 * 0.0279 White 0.2324 * 0.1403 0.2671 * 0.1074 Female -0.0549 * 0.4465 -0.1516 * 0.4888 25-34 years 0.0509 * 0.3648 -0.0355 0.3570 35-44 years 0.1465 * 0.2696 0.0388 0.2263 45-55 years 0.1907 * 0.1421 0.1166 * 0.1496 55-65 years 0.3433 * 0.0531 0.2469 * 0.0639 No education to incomplete GET -0.0089 * 6.6017 0.0039 7.0179 Complete GET 0.0076 1.4162 0.0145 * 1.7300 Matric 0.0333 * 0.3188 0.0600 * 0.3830 Diploma 0.1449 * 0.1030 0.2217 * 0.1034 Degree -0.0744 * 0.0669 -0.0112 0.0821 Urban/Metro -0.0260 * 0.6295 0.0268 * 0.4135 Western Cape 0.0065 0.1295 0.0531 * 0.1135 Eastern Cape -0.0848 * 0.1196 -0.0715 * 0.1191 Northern Cape -0.0561 * 0.0229 -0.0062 0.0191 Free State -0.0491 * 0.0751 0.0578 * 0.0638 KwaZulu Natal 0.0086 0.1869 -0.0004 0.1922 North West -0.0095 0.0868 -0.0176 0.0814 Limpopo -0.0313 * 0.0648 -0.0181 0.0660 Mpumalanga -0.0177 0.0734 -0.0732 * 0.0934 lambda -0.6635 * 0.3776 -0.3782 * 0.3999 Observed Probability 0.5947 0.3995 Predicted Probability(at x-bar 0.6078 0.3797 Number of Observations 42166 43631 Chi2 5140.6 * 3398.3 * Pseudo R2 0.143 0.167
Source: OHS 1995; LFS 2005: 2 (StatisticsSA); Own calculations Notes: * Significant at one percent level
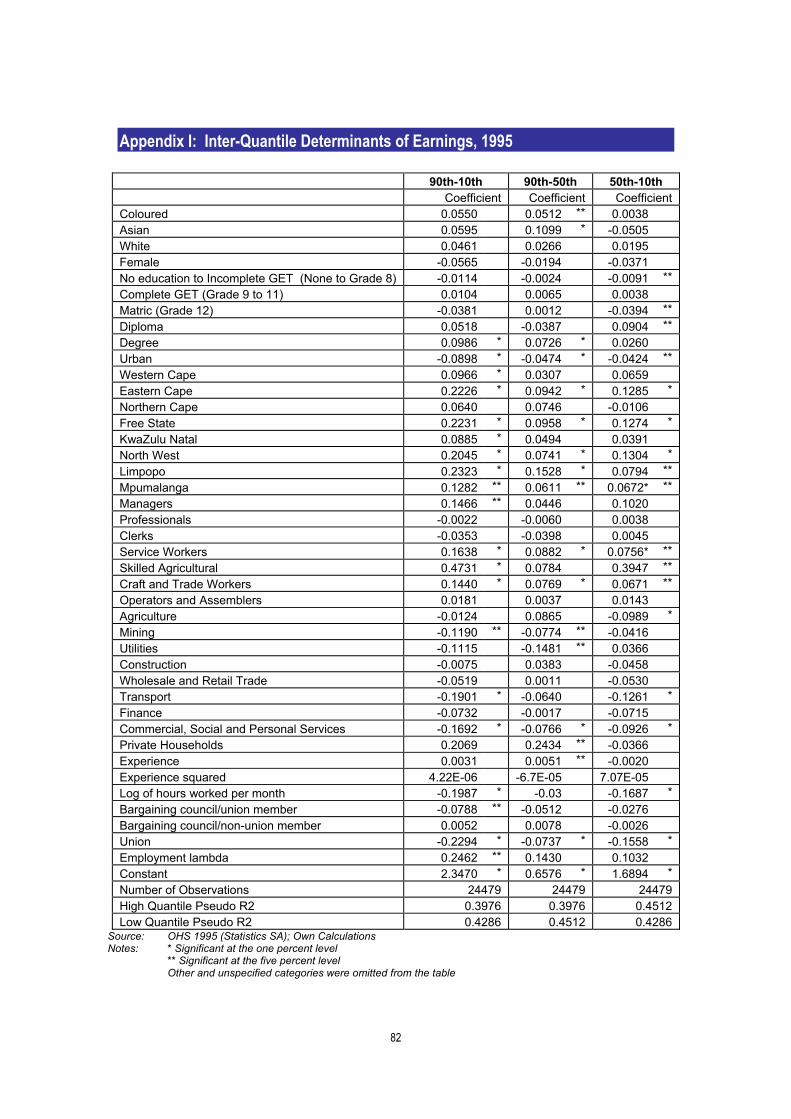
82
Appendix I: Inter-Quantile Determinants of Earnings, 1995 90th-10th 90th-50th 50th-10th Coefficient Coefficient Coefficient Coloured 0.0550 0.0512 ** 0.0038 Asian 0.0595 0.1099 * -0.0505 White 0.0461 0.0266 0.0195 Female -0.0565 -0.0194 -0.0371 No education to Incomplete GET (None to Grade 8) -0.0114 -0.0024 -0.0091 ** Complete GET (Grade 9 to 11) 0.0104 0.0065 0.0038 Matric (Grade 12) -0.0381 0.0012 -0.0394 ** Diploma 0.0518 -0.0387 0.0904 ** Degree 0.0986 * 0.0726 * 0.0260 Urban -0.0898 * -0.0474 * -0.0424 ** Western Cape 0.0966 * 0.0307 0.0659 Eastern Cape 0.2226 * 0.0942 * 0.1285 * Northern Cape 0.0640 0.0746 -0.0106 Free State 0.2231 * 0.0958 * 0.1274 * KwaZulu Natal 0.0885 * 0.0494 0.0391 North West 0.2045 * 0.0741 * 0.1304 * Limpopo 0.2323 * 0.1528 * 0.0794 ** Mpumalanga 0.1282 ** 0.0611 ** 0.0672* ** Managers 0.1466 ** 0.0446 0.1020 Professionals -0.0022 -0.0060 0.0038 Clerks -0.0353 -0.0398 0.0045 Service Workers 0.1638 * 0.0882 * 0.0756* ** Skilled Agricultural 0.4731 * 0.0784 0.3947 ** Craft and Trade Workers 0.1440 * 0.0769 * 0.0671 ** Operators and Assemblers 0.0181 0.0037 0.0143 Agriculture -0.0124 0.0865 -0.0989 * Mining -0.1190 ** -0.0774 ** -0.0416 Utilities -0.1115 -0.1481 ** 0.0366 Construction -0.0075 0.0383 -0.0458 Wholesale and Retail Trade -0.0519 0.0011 -0.0530 Transport -0.1901 * -0.0640 -0.1261 * Finance -0.0732 -0.0017 -0.0715 Commercial, Social and Personal Services -0.1692 * -0.0766 * -0.0926 * Private Households 0.2069 0.2434 ** -0.0366 Experience 0.0031 0.0051 ** -0.0020 Experience squared 4.22E-06 -6.7E-05 7.07E-05 Log of hours worked per month -0.1987 * -0.03 -0.1687 * Bargaining council/union member -0.0788 ** -0.0512 -0.0276 Bargaining council/non-union member 0.0052 0.0078 -0.0026 Union -0.2294 * -0.0737 * -0.1558 * Employment lambda 0.2462 ** 0.1430 0.1032 Constant 2.3470 * 0.6576 * 1.6894 * Number of Observations 24479 24479 24479 High Quantile Pseudo R2 0.3976 0.3976 0.4512 Low Quantile Pseudo R2 0.4286 0.4512 0.4286
Source: OHS 1995 (Statistics SA); Own Calculations Notes: * Significant at the one percent level ** Significant at the five percent level Other and unspecified categories were omitted from the table

83
Appendix J: Inter-Quantile Determinants of Earnings, 2005 90-10th 90th-50th 50th-10th Coefficient Coefficient Coefficient Coloured 0.066 -0.008 0.074 Asian 0.043 -0.042 0.085 White 0.257** 0.035 0.223* Female -0.036 0.000 -0.035 No education to Incomplete GET (None to Grade 8) 0.006 0.003 0.004 Complete GET (Grade 9 to 11) 0.054** 0.027* 0.027 Matric (Grade 12) 0.183* 0.104* 0.080 Diploma -0.093 -0.093 0.000 Degree 0.060 0.050** 0.010 Metro -0.026 -0.041 0.015 Western Cape -0.140** -0.074** -0.067 Eastern Cape -0.113** -0.024 -0.090 Northern Cape 0.004 -0.007 0.012 Free State 0.087 -0.006 0.094 KwaZulu Natal 0.058 -0.021 0.079 North West -0.040 -0.011 -0.029 Limpopo 0.100** 0.032 0.068 Mpumalanga -0.012 -0.003 -0.010 Managers 0.335* 0.162** 0.172* Professionals -0.023 -0.049 0.026 Clerks 0.076 -0.033 0.110* Service Workers 0.189* 0.044 0.145* Skilled Agricultural 0.299** 0.229** 0.070 Craft and Trade Workers 0.102 0.038 0.065 Operators and Assemblers 0.022 0.008 0.014 Agriculture -0.412* -0.247* -0.165* Mining -0.177* -0.203* 0.026 Utilities 0.277 0.046 0.232 Construction -0.103* -0.042 -0.061** Wholesale and Retail Trade -0.163* -0.104* -0.059 Transport 0.117 0.000 0.117 Finance -0.134** -0.077 -0.058 CSPS -0.040 -0.098* 0.058 Private Households -0.506* -0.410* -0.096 Experience 0.015* 0.006 0.009 Experience squared 0.000 0.000 0.000 Log of hours worked per month -0.102** 0.036 -0.137* Private Sector BC Member -0.058 -0.078* 0.020 Public Sector BC Member -0.045 -0.095* 0.050 Union -0.247* -0.112* -0.135* Emp_lambda 0.188 -0.030 0.218** Constant 1.494 0.496* 0.998* No of Observations 14746 14746 14746 High Quantile Pseudo R2 0.402 0.402 0.4122 Low Quantile Pseudo R2 0.238 0.4122 0.238
Source: LFS 2005(2) (Statistics SA); Own Calculations Notes: * Significant at the one percent level ** Significant at the five percent level Other and unspecified categories were omitted from the table