Analysing the trajectories of maize-based farming systems ...
63
Analysing the trajectories of maize-based farming systems using participatory methods in Hawassa area, Ethiopia Kassahun Lemi Woyessa August 2014 Farming Systems Ecology Group Droevendaalsesteeg 1 – 6708 PB Wageningen - The Netherlands _______________________________________________________________________
Transcript of Analysing the trajectories of maize-based farming systems ...

Analysing the trajectories of maize-based farming systems
using participatory methods in Hawassa area, Ethiopia
Kassahun Lemi Woyessa
August 2014
Farming Systems Ecology Group
Droevendaalsesteeg 1 – 6708 PB Wageningen - The Netherlands
_______________________________________________________________________

ii
Analysing the trajectories of maize-based farming systems
using participatory methods in Hawassa area, Ethiopia
Kassahun Lemi Woyessa
Reg. No: 840906975090
Credits: 36 ECTS
BFS-80436
MSc Thesis Farming System Ecology
January - August 2014
Supervisors: Examiner:
Dr. ir. Felix Bianchi Prof. Dr. ir. P. Tittonell
Ms. Yodit Kebede
Dr. ir. Sietze Vellema

Preface
This report is the result of my thesis research on which I have been working from January
2014 for the last 6 months. I learned and enjoyed a lot working on the topic. Many people
helped me and contributed to this work. Therefore, I would like to acknowledge the following
people.
First of all I would like to express my sincere gratitude to my supervisors: Dr. Ir. Felix
Bianchi, Ms. Yodit Kebede and Dr. Ir. Sietze Vellema for their inspiration, helpful
comments, intensive guidance and professional expertise, which made this work possible. In
addition, I am grateful for Ir. Erika Speelman and Ir. Stephanie Alvarez for their very
valuable contribution to the completion of my thesis.
I would like to use this opportunity to thank peoples of Wondo Genet, Tula and Hawassa
Zuria for their interest, patience and time to share their past and present farming history.
Moreover, I am thankful for agricultural extension officers of Hawassa Zuria, Tula and
Wondo Genet districts, particularly, to Mr. Amsal Worku agricultural development agent in
Hawassa Zuria district for his support by translating the local language and introducing me
with the culture of the region. That was an unforgettable time in my life that I enjoyed and
shared the culture of Sidama people during my stay with my family in Hawassa.
I owe special thanks to all my family for their constant and tremendous support and
encouragement for my success in this program and my life.
Last but not least, I would like to thank my study advisor Dr. Ir. Cor Langeveld for his
continuous encouragement in this study program. Furthermore, I would like to thank Farming
System Ecology Group at Wageningen University for funding this research and the
Netherland Government through Nuffic for awarding me a fellowship program to attend this
program.

ii
Table of Contents
Preface......................................................................................................................................... i
Table of Contents ....................................................................................................................... ii
List of tables .............................................................................................................................. iv
List of figures ............................................................................................................................. v
Acronyms .................................................................................................................................. vi
Abstarct .................................................................................................................................... vii
Executive summary ................................................................................................................ viii
1. Introduction ........................................................................................................................ 1
1.1. Background ................................................................................................................. 2
1.2. Objective ..................................................................................................................... 3
1.3. Research questions ...................................................................................................... 3
1.4. Hypotheses .................................................................................................................. 3
2. Review of the literature ...................................................................................................... 4
2.1. Geographic and historic description of the study area ................................................ 4
2.2. Access to agricultural resource ................................................................................... 4
2.3. Farm and household diversity ..................................................................................... 5
3. Methods and materials ........................................................................................................ 6
3.1. Theoretical framework ................................................................................................ 6
3.2. Description of the study area ....................................................................................... 6
3.3. Data collection............................................................................................................. 7
3.3.2. Focus group discussions ........................................................................................... 8
3.3.3. Life history interview ............................................................................................. 11
3.4. Description of variables to analyse trajectories of farming system changes............. 11
3.5. Data analysis ............................................................................................................. 13
4. Results .............................................................................................................................. 14
4.1. Informal discussions .................................................................................................. 14
4.2. Focus group discussions ............................................................................................ 14
4.2.1 Sketch of the study sites .......................................................................................... 14
4.2.2. Timeline of the study sites ...................................................................................... 18
4.3. Characterisation of farming systems of the area ....................................................... 20
4.3.1. Source of farm household income ..................................................................... 20
4.3.2. Crop production ................................................................................................. 21
4.3.3. Livestock production ......................................................................................... 24

iii
4.4. Analysis of farming systems trajectories .................................................................. 25
4.5. Description of farming system trajectory types ........................................................ 27
4.6. Drivers of farming system changes ........................................................................... 31
5. Discussions ....................................................................................................................... 33
6. Conclusions ...................................................................................................................... 36
7. References ........................................................................................................................ 37
Appendixs ................................................................................................................................ 42
Appendix 1: Average farmland holdings by landscape since 1970’s .................................. 42
Appendix2: Average dominant crop area by landscape since 1970’s ................................. 42
Appendix 3: Principal component analysis summary .......................................................... 43
Appendix 4: Informal discussion checklist .......................................................................... 43
Appendix 5: Focus group discussion checklist .................................................................... 43
Appendix 6: Creiteria used to categorise farms into typologies. ......................................... 44
Appendix 7: Semi-structured retrospective questionnaires for life history interview ......... 45
Appendix 8 ........................................................................................................................... 50

iv
List of tables
Table 3.1: Farmers ‘criteria to categories household based on months of food self-sufficiency,
resource endowment, farm management practice during FGD in Wondo Genet, Tula and
Hawassa Zuria. ......................................................................................................................... 10
Table 3.2: Description of farm indicators used to analyse farm trajectories ........................... 12
Table 4.1: Summary of focus group discussion participants in the study sites ....................... 14
Table 4.2: Timeline of the study sites since 1970’s ................................................................. 19
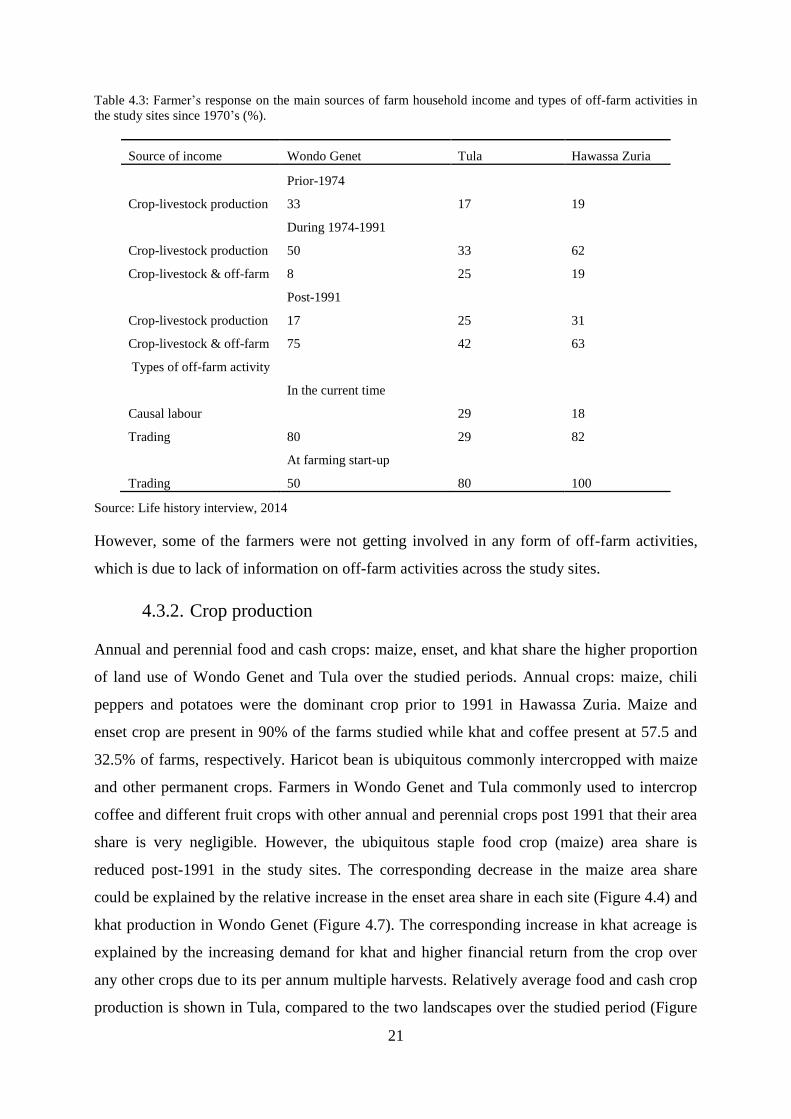
Table 4.3: Farmer’s response on the main sources of farm household income and types of off-
farm activities in the study sites since 1970’s (%). .................................................................. 21
Table 4.4: Factors limiting crop diversity in three districts of Hawassa area (% of farmer
response) .................................................................................................................................. 24
Table 4.5: Trends in average livestock holding in the study sites since 1970’s (Mean ±
standard deviation) ................................................................................................................... 24
Table 4.6: Farmer’s response to trends in livestock holding and factors accounted for the
change in herd size since 1970’s (%). ...................................................................................... 25
Table 4.7: Main changes in farm characteristics according to trajectories of changes since
1970.......................................................................................................................................... 30
Table 4.8: Trends observed in farming systems trajectories of evolution ............................... 31
v
List of figures
Figure 3.1: Location map of the study area ............................................................................... 7
Figure 3.2: Key informant participating in focus group discussion in Tula district .................. 8
Figure 3.3: Key informant participating in the mapping exercise in Hawassa Zuria district .... 9
Figure 3.4: Relation between average maize area and average farmland size in the study sites
in 2014. .................................................................................................................................... 13
Figure 4.1: Sketch of Hawassa Zuria district pre-1991 (a) and post-1991 (b) ........................ 15
Figure 4.2: Sketch of Tula district prior-1991 (ac) and post-1991 (bd) .................................. 16
Figure 4.3: Sketch of Wando Genet district prior-1991 (ace) and post-1991 (bdf) ................. 18
Figure 4.4: Trends in dominant crop production of the study sites since 1970’s .................... 22
Figure 4.5: Trends in dominant crop production in Hawassa Zuria since 1970’s ................... 22
Figure 4.6: Trends in dominant crop production in Tula since 1970’s .................................... 22
Figure 4.7: Trends in crop production in Wondo Genet since 1970’s ..................................... 23
Figure 4.8: Production orientation in the study sites since 1970’s .......................................... 23
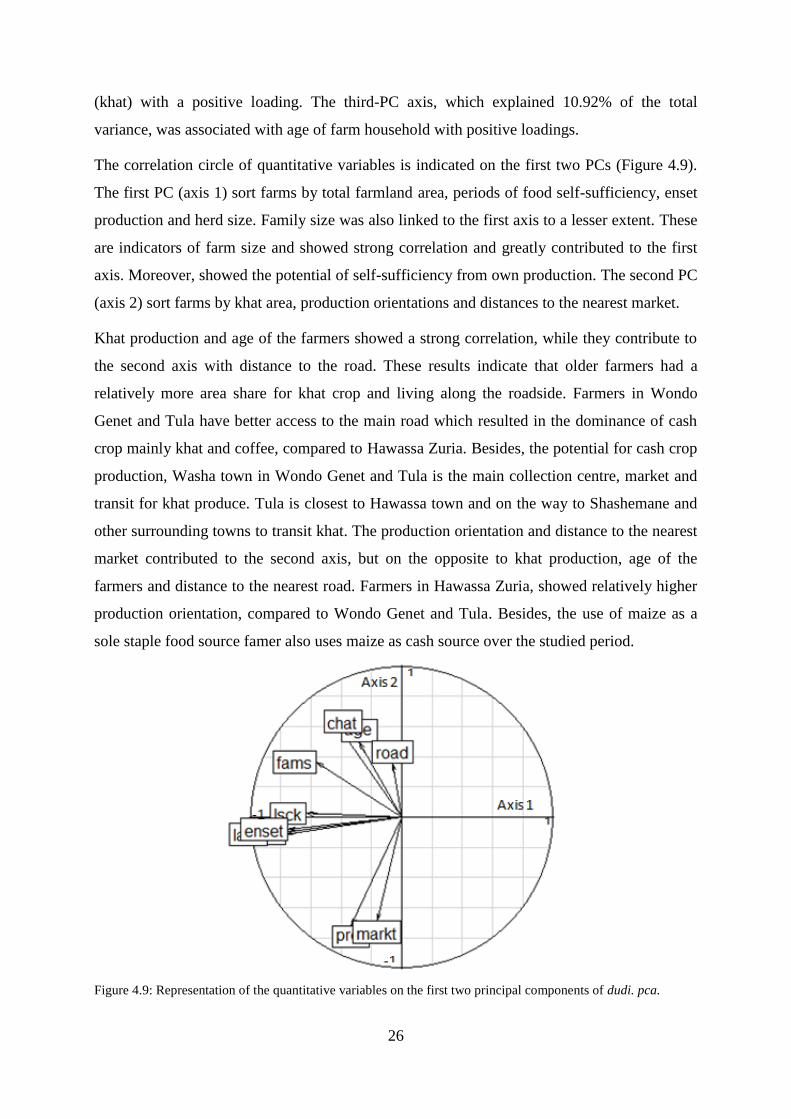
Figure 4.9: Representation of the quantitative variables on the first two principal components
of dudi. pca. ............................................................................................................................. 26
Figure 4.10: Positioning the farms on the first two principal components of the dudi.pca. .... 27

vi
Acronyms
ADLI Agricultural Development Led Industrialization
CSA Central Statistical Agency
DA Development Agents
Derg A military Junta that administered Ethiopia between 1974 and 1991
EPRDF Ethiopian People Revolutionary Democratic Front, A Political Party that has ruled
Ethiopia since 1991
FGD Focus Group Discussion
FTC Farmers Training Centre
PA Peasant Association (lower level government administrative structure)
PCA Principal Component Analysis
SNNPR Southern Nation Nationalities and Peoples Region
TLU Tropical Livestock Unit

vii
Abstarct
An understanding of the past and the current trajectories of farming systems are the base to
design more sustainable agro-ecosystem and better inform sustainable agricultural
intensification research. The aim of this study was to identify the trajectories of maize based
farming systems by assessing changes to farming system and identifying the drivers that are
accountable for these changes in Hawassa area, Ethiopia. Farming system trajectory analysis
was conducted using participatory methods in three districts in Hawassa area, characterised
by different level of landscape diversity gradients. Farming system changes were defined
using sketch maps drawn by key informants and life story interview of individual farmers
through informal and focus group discussions and life history interviews for three time
periods: (i) prior to 1974, (ii) 1975-1991 and (iii) post 1991. Principal component and cluster
analysis of socioeconomic and market access indicator variables was used to identify three-
broad groups of farming system trajectories that present in each landscape. The trajectories
constitute a group of farms with similar trends of change with regards to resource
endowment, production orientation and dominant crop production. The sketches revealed the
expansion of arable lands and residential areas, paralleled with eventual disappearance and
conversion of natural forest and grazing lands post-1991, resulting drastic decline in the
number of livestock in the area. Farm household income source ranges from crop-livestock
production to off-farm activities. The production orientation of the area was reduced in the
current time, which is attributed to decrease in the universal annual food crop area share and
increased perennial cash and food crop based production. Biophysical factors, household
socioeconomic conditions and easy market access are the drivers of change at the landscape
level, while regime change and market access are driver at the higher level.
Keywords: Farming systems trajectory, Hawassa area, Participatory method, Regime change
viii
Executive summary
This report presents the results of a maize-based farming systems trajectory analysis carried
out in 2014 in three districts of Hawassa area, Ethiopia: Wondo Genet, Tula and Hawassa
Zuria. The motivation for the study came from the recognition that significant changes have
taken place in the Hawassa area farming systems over the past time, which might have
resulted from increasing demand for cash crop and perennial food crop source. The general
objective of the study was to understand the trajectories of farming systems by assessing
changes in crop production and crop diversity, and identifying the factors and drivers that are
accountable for these changes in a three sites in Hawassa area, Ethiopia.
Three phases of primary data collection were employed: (i) informal discussion, (ii) focus
group discussion, and (iii) life history interviews. The informal discussions were conducted
with elderly peoples with the aim to get overview information of the area and determine the
starting point of trajectory analysis. The focus group discussion was conducted with key
informants in each landscape to understand their perceptions about the biophysical changes,
through simple sketching and a timeline of their villages. The life history interviews were
conducted on a stratified random sample of 40 households from the three landscapes using
semi-structured retrospective questionnaires. The sample was stratified by farm household
typologies (four types), defined by the criteria identified during focus group discussions.
These are (i) the number of months in which they are self-reliant for food, (ii) their livestock
size, (iii) their arable land area and (iv) their home garden crop diversity.
The quantitative data generated via retrospective questionnaires was analysed using principal
component and cluster analysis to classify to types of trajectories of farming systems. The
mean and standard deviations were calculated to present the results of each trajectory type.
The statistical software R version 3.1.0 (R Development core team) was used to run principal
component and cluster analysis.
An informal discussion with the elderly people showed three commonly recognized periods.
These are times related to regime changes that were common at national level. The prior-
1974, the period 1975-1991 and post-1991 are identified to have different characteristic of
agricultural systems. Thus, these periods were used for trajectory analysis. The focus group
discussion resulted in sketch map of prior-1991 and post-1991, timeline and criteria for
farmers’ self-categorisation in each landscape. The sketch reveals the expansion of arable

ix
lands and residential areas, paralleled with eventual disappearance and conversion of natural
forest and grazing lands post-1991.
Timeline of the area (Table 4.3) reveal historical events: limited access to agricultural lands
(prior to 1974), land reform (1975), drought (1985) and access to new forms of extension
service (since 1999) that were common at the national level. Historical events such as:
flooding and ice in [Hawassa Zuria (1995), Tula (2004) and Wondo Genet (2006)] resulted in
losses of crops in the area. Border conflicts between the Sidama and Oromo tribes [Hawassa
Zuria (1990), Wondo Genet (2011) also resulted in burning of houses and losses of resources
exposing farmers to emergency support. In 2013, maize stalk borer and wind resulted in
losses of the maize crop. The relative high intervention of development projects in Hawassa
Zuria could be attributed to drought vulnerability of the landscape that could contribute to
food insecurity and need for intervention in the district.
Farm households income comes from a range of crop-livestock production to off-farm
activities. In 2014, 60, 78 and 50% of household in Wondo Genet, Tula and Hawassa Zuria,
respectively have some kind of off-farm activities. The production orientation/ proportion of
food crop area to total farmland in the study sites 94, 85 and 56% prior to 1991, shows
decline to 89, 70 and 37% in 2014 at Hawassa Zuria, Tula and Wondo Genet, respectively
(Figure 4.8). Informal discussions with elderly people and FGD revealed that over the last
two to three decades, there has been an increasing demand for food and cash source in the
study sites. This resulted in an intense competition between the predominant traditional
farming systems and the more lucrative production systems. Currently, maize and enset crop
are present in 90% of the farms studied, while the khat and coffee are present at 57.5 and
32.5% of farms, respectively. Haricot bean is ubiquitous, commonly intercropped with maize
and other permanent crops. However, the universal staple food crop (maize) area share is
reduced post-1991 in the study sites. These could be attributed to the relative increase in the
enset area share in each site (Figure 4.4) and khat production in Wondo Genet (Figure 4.7).
Increase in khat acreage is explained by the higher financial return from the crop over any
other crops. Livestock production was recognized as a long tradition of farming communities
in the study sites over the studied period. However, since 1990’s, variation in the number of
livestock was observed across the study sites (Table 4.6).

x
Principal component analysis (PCA) identifies three PCs, which explained 59.59% of the
total variation of farms diversity. Cluster analysis of the first two PCs, which explained 48.77
% of total variance resulted in three-broard groups of farming system trajectories (Figure
4.10). Thus, Trajectory 1: characterised by a moderate increase in farmland area, decreased
maize area, increased enset and khat area and cash oriented production. The group constitutes
(n=10, 25%) farms. Farms from Wondo Genet (25%), Tula (33.33%) and Hawassa Zuria
(18.75%) belong to trajectory 1 and are characterized by relatively high resource endowment
and year round food self-reliance in 2014. The decreasing trends in production orientation,
livestock density and intense khat production were observed over the studied period in the
trajectory 1. Trajectory 2: characterised by maintaining farm land size (0.57 ha), reduced
maize area, minor increase in enset and khat area and self-subsistent food and cash oriented
production. The group constitute the greatest number of farms (n=21, 52.5%), and majority of
farms from Wondo Genet (75%), Tula (58.33%) and Hawassa Zuria (31.25%). Trajectory 3:
characterised by maintaining farm land size (0.85 ha), decreased maize area, introduction of
enset, self-subsistent food crop oriented and non-cash crop production. The group constitutes
small number of farms (n= 9, 22.5%), and farms from Hawassa Zuria (50%) and Tula
(8.34%) belongs to this group.
In this analysis three main farming system trajectories were distinguished constituting a
group of farms roughly with similar trends of change. These trajectories present in each
landscape regardless of the variation in percentage distribution of the farms in each
landscape. The observed changes were not only explained by the landscape itself. There are
other factors contributing to the changes and linking the landscapes with the trajectories like
easy market access and the political system or regime change are the driver of changes that
could be explained at region or national level.

1. Introduction
The demand to feed an increasing African population requires more food production, which
can lead to natural resource degradation (Valbuena et al., 2013; Pretty et al., 2011; Abate et
al., 2000). In sub-Saharan Africa, agriculture is a dominant source of income for many rural
populations (Carswell, 2000). The current agricultural production system is characterized by
smallholding, rain-fed subsistence-oriented production systems with low productivity.
Agriculture in Ethiopia contributes to 46% of the national GDP and 85% of the total
employment and means of living (World fact book, 2014). Agricultural production in the
country is diverse with its subsistence oriented, diverse and the risk-prone nature. However,
despite a good agricultural production potential of various Agro-ecosystem and a vast labour
pool in the agriculture sector, agricultural productivity remains low. The limited access to
agricultural inputs, demographic pressure, natural resource degradation, seasonal variability
of rainfall, yield losses from insect-pest and weed infestations are major reasons of low-crop
productivity (Taffesse et al., 2011; Abebe et al., 2010).
The struggle of farming communities across the country to feed themselves contributed to the
expansion of cropland, changes in land use and farming systems, an increase in the usage of
agricultural inputs and plant genetic materials movements. These could lead to the spread and
introduction of plant diseases and insect-pest. To improve agricultural productivity, farm
household may undergo agricultural intensification or extensification and farm or income
diversification (Valbuena et al., 2013; Bishaw et al., 2013; Malmberg and Tegenu, 2007).
Changes in farming systems and livelihood adaptation strategies may be different within and
across agro-ecologies, and determined by socioeconomic and institutional factors and agro
ecological properties. These suggest that farming system changes and their drivers are
heterogeneous and complex, varying between households, locations and time (Carswell,
2000). The aspect has to be taken into account when analysing trajectories of farming
systems and identifying the drivers of those changes. Trajectories, as used in this study, are
the pathways of agro-ecosystems resulting from ecological, socioeconomic, institutional
changes and farmers' livelihood strategies. These trajectories in terms of the diversity of
farming systems and livelihood strategies observed can be explained by recording changes in
crop selection, land allocation for different crops, change in livestock density, and
involvement in off/non-farm activities and the reasons for these changes. This analysis is
useful and necessary for understanding changes of the composition of the agricultural

2
landscapes which will enable to better understand the current challenges and propose
informed actions for future agricultural systems.
1.1. Background
Three districts in the Hawassa area, Wondo Genet, Tula and Hawassa Zuria, with contrasting
farming systems were selected to analyse historical farm and landscape level changes, which
ultimately resulted in the current situation. The need to produce more food crop impulse
farming system to become more intensive while better market access could favour cash crop
production. The need to increase food crop production and market-oriented cash crop
production is responsible for agro-ecosystem changes and the resultant changes in farming
practice. In Hawassa area, farmers were seen to replace enset (enset ventricosum) and coffee
with maize as a staple food crop and khat as a cash crop (Abebe, 2013, Abebe et al., 2010). In
a recent year, farmers in Hawassa Zuria were seen reintroducing the perennial food crop
(enset) for its drought resistance, use as food and fodder to their livestock and soil erosion
control. In the Wondo Genet the cash crop production (e.g. khat, sugar cane and pineapple)
increased due to expected higher economic returns and market accessibility (Abebe et al.,
2010; Abebe et al., 2006). The expansion of the khat in this district resulted in a 30% decline
of natural forest and associated forest fragmentation in major khat producing areas, a decline
in food crop production, and soil erosion from steep land cultivation (Dessie and Kinlund,
2008). This problem became worse in the last two decades as compared to the prior to 1991
(Abebe et al., 2010; Dessie and Kinlund, 2008).
The need to increase food production can result in changes in land use (e.g. expansion of
arable land) and farming practices (e.g. increased use of agricultural inputs) that may
aggravate pest problems and induce crop productivity loss (Oerke et al., 1999 cited in Abate
et al., 2000). The reduction of crop diversity and increase in maize mono-cropping favoured
an increase in maize stem borer infestation, compared to maize crop planted under khat
(Catha edulis) (Getahun, 2003 cited in CIMMYT, 2012) and with other crops like haricot
bean and cowpea (CIMMYT, 2012; and Emana, 2002a cited in CIMMYT, 2012). Analysis of
the drivers of these changes may improve understanding in the development of pest pressure
in Hawassa area, which is related to the current ongoing Ph.D. research project to design
appropriate maize stem borer control methods. The results of the understanding of past
trajectories of farming systems will be further combined with experimental results and be
used for building scenarios for future development of farming systems in Hawassa area.

3
The study was designed to better understand the trajectories of farming system, considering
the farm diversity at a local level which is responsible for diverse trajectories. The study
would also identify and document from the literature study the diversity and drivers of
farming systems in Hawassa area. These could be a base to understand the existing farming
system changes and better inform sustainable intensification research in the area. The study
also aims to identify the extent to what socioeconomic and institutional factors affect
trajectories of farming systems.
1.2. Objective
The general objective of the study was to identify the trajectories of farming systems by
assessing changes in crop production and crop diversity, and identifying the factors and
drivers that are accountable for these changes in three districts in the Hawassa area, Ethiopia.
1.3. Research questions
To address the main objective, the following research questions are asked:
1. What are the diversity of farms and household livelihood strategies observed in the
area?
2. What have been the changes in term of crop shifts explaining the current diversity of
farming systems of Hawassa area?
3. What are the drivers of the changes and what are the factors influencing the farmer's
decision to shift crops?
1.4. Hypotheses
1. The household socioeconomic situation could have affected farming system
changes.
2. Farmers with better access to market could have a better chance to shift and
diversify their crops.
3. Institutional conditions, as a result, of regime change could have influenced the
direction of farming system changes.

4
2. Review of the literature
2.1. Geographic and historic description of the study area
FAO (2012) defined farming system as “the population of individual farms that share typical
agro-ecological conditions, market access, and characterised by similar farm resource bases,
family activities and similar development interventions and strategies”. Among the 15
farming systems identified by the FAO in Sub-Saharan African countries, the diversified
agro-climatic conditions enable Ethiopia to adapt mixed crop-livestock production systems
(FAO, 2012). The perennial and horticulture-livestock farming systems are the dominant
farming system in the southern part of Ethiopia (FAO, 2012; Getahun, 1978). The traditional
enset-coffee home garden Agroforestry farming system is the predominant system in
Hawassa area.
Favourable agro-climatic conditions, agriculturally fertile and irrigation based agricultural
production coupled with market access enable farmers in Wondo Genet to produce a diverse
set of perennial and annual crops (Dessie and Kinlund, 2008). The smallholder perennial
crop-based farming system, owning about 0.6 ha arable land holding remains the only means
of life for 78% of the entire population (Dessie and Kinlund, 2008; Wondo Gent district
office of agriculture, 2013). Tula, once part of Hawassa Zuria district, is characterised by
semi-arid to sub-humid agro-climate, average biophysical and socioeconomic conditions
enabled the production of both food and cash crops. Being only at 13 km from Hawassa town
and easy market access, Tula is an important khat market from where it transit to the capital
(Tula district agricultural office, 2013).
Hawassa Zuria, in warm sub-humid lowlands (85%) and sub-humid (15%) agro-climatic
condition is characterised by adaptation of maize mono-crop based farming system. In the
period 1974-1991, some area of land used to be set of a state-owned farm in the area. In the
recent years, post 1991 farmers introduced enset for its drought resistance and use as food
and fodder source (Hawassa Zuria district office of agriculture, 2013; SNNP, 2005).
2.2. Access to agricultural resource
Belete et al. (1991) reported that the agricultural systems in Ethiopia prior to 1974 were
characterized by a feudal system in which agricultural resource is extracted by individual
groups of peoples (the landlords). The feudal system was recognized by exclusion of the

5
majorities of smallholder farmers from access to agricultural resource, primitive and
stagnated agricultural production system. Between 1974 and 1991 the country was governed
by a military junta (Derg). This period is characterized by the 1975 land reform (Land to the
tiller), which entitled farmers with land use-rights. Officially, all land came under the
ownership of the state, but distributed to farmers only on use- right basis (Headey et al.,
2014; Belete et al., 1991). During this period, commercial large-scale farmland was
distributed to the state farms (Headey et al., 2014; Zerihun, 2009). Following the land reform
in 1975, the agricultural production system did not evidence substantial changes due to
limited access to appropriate agricultural technologies, inputs and extension service in
Ethiopia (Belete et al., 1991). Political instability, drought and government price control
policy and free movement of agricultural products also contributed to inadequate
performance of agriculture during the Derg regime in Ethiopia (Wubne, 1991).
After the downfall of the Derg regime in 1991 the EPRDF (the current ruling party) gets into
power. The post-1991 period was thought to have the effects of changes in agricultural
production systems from its agricultural support policy, infrastructural development, and
access to agricultural technologies. During this period, the government adopted the
agricultural development lead industrialization (ADLI) with the main objectives to enhance
the productivity of smallholder’s agriculture and improve food security in the country.
However, the land still remains state property (Crewett, 2008; Belay and Manig, 2004).
The three mentioned time periods: (i) prior to 1974, (ii) between 1975 and 1991, and (iii) post
1991 were studied to understand the trajectories of farming systems in the area.
2.3. Farm and household diversity
Differences among farms in their resource endowment, access to agricultural technologies,
credits and extension services, market access and farming experiences are the main factors
for diversity among the farms (Browder et al., 2004). Tittonell (2013) indicated that in
developing countries farming systems change with the increasing diversity in the livelihood
of families. Thus, in the change farmers adapted to different farming systems as some of the
household undergoes contraction of resources like land and herd size. However, within the
same locality some group of farmers shows improvement in their farming system through
physical or capital intensification and changing their production orientation. Analysis of farm
and household diversity to understand the various responses of individuals to the change over
the course of time need to be analysed in the context the farm operates (Tittonell, 2014).

6
3. Methods and materials
3.1. Theoretical framework
The study framed analysis of the "farming system trajectory" succession of chronological
steps characterized by structural or organizational change in farming system (Capillon, 1993;
Moulin et al., 2008 cited in Rueff and Gibon, 2010). A farming system defined as a
population of individual farms sharing typical agro-ecological conditions and market access,
and characterized by similar farm resource bases, family activities, and constraints for which
similar development strategies and interventions can be appropriate (FAO, 2012). To
understand the trajectories of farming systems main socioeconomic, market and institutional
factors that are accountable for changes in farming systems were analysed considering three-
time period. Therefore, to acquire a better understanding of farm diversity farms were
categorized into typologies. Tittonell et al., (2005) demonstrated that categorizing households
using functional typologies on the basis of their wealth characteristics, production
orientations and their livelihood strategies are more relevant when examining diversity
among farm households.
3.2. Description of the study area
The study was conducted in Hawassa area, located in the south central Rift Valley (Figure
3.1). The area lies at 703'11"N latitude, 38
029'43"E longitude, located at 250 km to the south
of Addis Ababa, the capital city of Ethiopia. The area is characterized by moist to sub-humid
warm subtropical climate with an average temperature of 15 to 200C. Annual precipitation
ranges from 1000 to 1800 mm in a bimodal distribution pattern, expected in March to April
and June to August (Dessie and Kleman, 2007; SNNP livelihood zone report, 2005). The
subsistence-oriented smallholder farming system with an average of below one hectare arable
land holding characterize the agricultural production of the area (Dessie and Kleman, 2007;
Dessie and Kinlund, 2008). Three districts were chosen for this study, showing a gradient of
landscape diversity translated in different ratios of perennial/annual crops, field sizes and
proportion of non-crop habitat (e.g. Hedgerows). These landscapes also present differences in
socioeconomic characteristics. Wondo Genet characterized by a diversity of perennial and
annual cash crops based production. Hawassa Zuria chosen for its dominant annual food
crop-based production, which mainly consisting of maize, and Tula represents a landscape
with intermediate diversity composed of both food and cash crop production (Figure 3.1).

7
Figure 3.1: Location map of the study area
3.3. Data collection
Qualitative and quantitative data were collected from primary sources. Primary data included
(i) informal discussions, (ii) focus group discussions (FGD), and (iii) life history interviews
with elderly peoples, key informants and selected individual farm households, respectively.
3.3.1. Informal discussions
Informal discussions were conducted at the initial stage of data collection with 13 elderly
farmers: four farmers from Wondo Genet and Tula, and five farmers in Hawassa Zuria
district. Informal discussions were used to acquire information on the farming systems,
historical changes in access to agricultural resources and to determine the starting points for
the trajectory analysis. Farmers were asked to identify crucial periods that affected their
farming systems (appendix 4).

8
3.3.2. Focus group discussions
Focus group discussions (FGD) organized with key informants, those groups of peoples
expected to have a better understanding of changes in their local area (Figure 3.2).
Accordingly, participants were selected among influential farmers; community
representatives who have a better understanding of their local territories, and agricultural
development agents (DA) of respective study sites (Table 4.1). Participatory mapping and
timeline was employed to get a better understanding and perceptions of farmers in their local
areas by simple sketching. The FGD was also aimed to identify criteria for farmer's self-
categorization to build a typology of farms (appendix 5).
Figure 3.2: Key informant participating in focus group discussion in Tula district
The objective of the participatory mapping was to acquire an understanding on how
participants of the discussion perceive changes in their local areas; this information was
acquired by preparation of a timeline and sketch map with the assistance of development
agents in each location (Figure 3.3)

9
Figure 3.3: Key informant participating in the mapping exercise in Hawassa Zuria district
After the sketch, the same group of participants was asked to record a timeline in each
location facilitated by the development agents. The timeline mainly focuses on changes in
access to resources, technologies, and extreme weather conditions (e.g. flooding and
droughts) (Table 4.2). Accordingly, farmers were able to sketch two different sketch maps of
their localities, to show biophysical features of their landscapes in the three main periods
identified during the informal discussions (Figure 4.2).
Focus group discussion participants identified criteria for farmer self-categorization. The
periods of food self-sufficiency, livestock size, arable land holding, and farm management
practices are identified in the three sites, which relates to suggested criteria for farms in East
Africa (Tittonell et al., 2010) (Table 3.1).

10
Table 3.1: Farmers ‘criteria to categories household based on months of food self-sufficiency, resource
endowment, farm management practice during FGD in Wondo Genet, Tula and Hawassa Zuria.
Criteria Description
Selected by farmers in three localities
Food security (1) Fully feed family and produced for the market; (2) adequately feed family from own
production; (3) partially feed family and work off-farm activity, and (4) can't feed a
family, dependent
Livestock size More than ten cattle, small ruminants with transporting animals; pair of oxen, cows,
small ruminants; single or no oxen, cow with /out small ruminants; no livestock
Arable land size > 1ha; >0.5 ha; <0.5 ha; <0.25 ha or landless
Use of agricultural
technologies
Use a fertilizer and improved seeds regularly; using some inputs occasionally for some
crops
Selected by farmers in two of the three localities (Wondo Genet and Tula)
Home garden crop
diversity
Produce more diverse food and cash crops; produce different crops, focusing on food
crops (maize, enset)
Irrigation Own water pump or point and produce different crops three times per annum; hire or
borrow water pump and produce different crops; use farrow or hand spray; have no
access to irrigation water
Educating children Who can teach his children in private schools; able teach in government schools by
fulfilling all needs; able to teach in public schools, but lacks to fulfil their needs; unable
to teach his children.
Selected by farmers in one of the three localities (Tula)
Number of coffee
trees
>400-coffee tree; 30-40 coffee trees; 5-7 coffee trees; no coffee tree in his garden.
Maize productivity 60 quintals per ha; 15 quintals per ha; 10 quintals per ha;
Housing type Quality housing in urban area to rent out or live in;
Source: Own computation from FGD, 2014; Kebede, 2013 (unpublished data).
Household typologies: Farm diversity was stratified by using criteria identified during focus
group discussion (Table 3.1). The criteria selected by key informants in the three localities
were used to categorise farm households into four typologies, represented by type 1-4. These
are (i) the time of the year in which they are self-reliant for food, (ii) their livestock size, (iii)
their arable land area, and (iv) their home garden crop diversity. However, home garden crop
diversity was not used in household categorisation for Hawassa Zuria. The livestock holding
and arable land area are the criteria commonly used in SNNPR for household categorisation
based on wealth (USAID, 2005). Socioeconomic data: on period of food self-sufficiency,
arable land holdings, livestock size and types of crop were obtained from the baseline survey
(Kebede, 2013 unpublished data) to categories farms based on the criteria (appendix 6).

11
Thus, Type 1. Better off; Type 2: Medium; Type 3: Poor and Type 4: Very poor. The
typology also relates to the typologies identified in Sidama maize belt livelihood zone
(USAID, 2005).
3.3.3. Life history interview
Life history interview was conducted in April 2014. A stratified random sampling based on
criteria identified by key informants was used to select 40 farm households from an existing
list of 173 households (Kebede, 2013 unpublished data). The selection of farmers from the
unpublished data was also validating by the DAs and community representatives as the raw
data generated and the real situation of the same farmer sometimes mismatching. The
selected 40 farmers represented four-farm types and invited for an in-depth-life story
interview. Twelve-farm households selected from Wondo Genet and Tula, and 16 households
from Hawassa Zuria, respectively. Three households per farm type from Wondo Genet and
Tula and four households from Hawassa Zuria were selected. Semi-structured retrospective
questionnaires were designed to collect information on socioeconomic, institutional and
market access indicators, which would enable to understand the decision of individual
households towards shifting or diversifying their crops and levels of crop diversification
(appendix 7). Socioeconomic factors: age of farm household, source of income, types of crop,
livestock density and period of food self-sufficiency area included. Data on market access
include the distance to the nearest market and road, and data on institutional factors include
access to agricultural resources, access to credit, inputs, and extension service and irrigation
water.
3.4. Description of variables to analyse trajectories of farming system
changes
To determine the trajectories of farming system a principal component analysis was
conducted, which is aimed to reduce the weight of more discriminating variables (Choisis et
al., 2012; Ryschawy et al., 2012). Household socioeconomic and market access indicators
were analysed using PCA and principal components that explain substantial variation
identified. Major Principal Components from the analysis were used to construct a typology
of individual farms. Initially, eleven quantitative and six qualitative socioeconomic, market
and institutional variables were identified to study the trajectories of farming system changes.
However, by looking into the data the six qualitative and one quantitative variable were

12
excluded from the analysis and considered as supplementary variables. The qualitative
variables (access to agricultural extension, inputs and credit service and irrigation water)
were removed because they are common to the national level and answer the yes or no
questions, which did not show a visible difference between the households. Finally, ten
variables were selected to be used in PCA (Table 3.2).
Table 3.2: Description of farm indicators used to analyse farm trajectories
Indicator Criteria used Heading Data type
Farmland size (ha) Total farm land land Quantitative
Herd size (TLU) Livestock size lsck Quantitative
Family size (# of person) Family member living in the household fams Quantitative
Production orientation (%) Ratio of food crop area of total farmland prop Quantitative
Maize production (ha) Maize crop area/farm area maize Quantitative
Cash crop production (ha) Khat area /farm area khat Quantitative
Enset production (ha) Enset area/farm area enset Quantitative
Access to market (km) Distance to the closest market markt Quantitative
Access to road (km) Distance to the nearest road road Quantitative
Food self-sufficiency (# of months) Month of food self-sufficiency food Quantitative
Age Age of the household age Quantitative
Source: Adapted and modified from Choisis et al., 2012; Rueff et al., 2012, Tittonell et al., 2010.
The Bar plot was used to check for correlations between the attributes and select non-
correlated variables. Thus, maize area was excluded from the analysis, which showed strong
correlation r2=0. 57 with total farmland size (Figure 3.4). These show that when a farmland
size increase, the area of maize increase as well, which is non-discriminating (Pengelly et al.,
2001). These are attributed to the dependence of the farm households on maize as a staple
food crop source.

13
Figure 3.4: Relation between average maize area and average farmland size in the study sites in 2014.
3.5. Data analysis
A two-step method for assessing the diversity of farming system trajectories was used. The
selected variables were analysed using principal component and cluster analysis of individual
trajectories of farming systems. Cluster analysis was conducted using the hierarchical cluster
procedure and ward's aggregation method (Ryschawy et al., 2012; Rueff et al., 2012; Madry
et al., 2010; Landais, 1996 and Köbrich et al., 2003). The first two principal components
were used to build farming systems trajectory typology. The number of clusters was
determined on the “observed ‘jumps’ in the inertia inter-cluster on the bar plot: a high loss of
inertia means that the two associated clusters are far apart” (Choisis et al., 2012).
Principal component and cluster analysis were run using the dudi.pca within the routines of
ade4 packages from R 3.0.1 software (R Development team 2013). The mean and standard
deviation of the selected variables and the quantitative household socioeconomic data were
calculated to analyse changes for each trajectory using SPSS statistical software version 20
and excel sheet.
y = 0.46x + 0.016 R² = 0.57
0
0.2
0.4
0.6
0.8
1
1.2
0 0.5 1 1.5 2
Ave
rage
mai
ze a
rea
(ha)
Average farmland (ha)
maize
Linear (maize )

14
4. Results
4.1. Informal discussions
The informal discussions conducted with the 13 elderly people reveal three time periods.
These are the prior-1974, the period 1975-1991 and post-1991, which are identified to have
different characteristic of agricultural systems. These are times related to regime changes that
were common at national level. Focus group discussions
4.2. Focus group discussions
Three focus group discussions, one in each landscape, were carried out in Wondo Genet, Tula
and Hawassa Zuria. The key informants who are expected to deliver valuable information on
changes in their local area selected from different stakeholder groups. In total 46 FGD
participants were selected representing farmers, peasant association (PA) representatives and
development agents (DA) (Table 4.1).
Table 4.1: Summary of focus group discussion participants in the study sites
Key informants Wondo Genet Tula Hawassa Zuria
Male Female Male Female Male Female
Farmer 6 3 6 3 4 4
PA representative 3 3 4
DA 3 2 1 4
Total 15 15 16
Source: Own computation from FGD, 2014
During the FGD, which lasted 3-4 hours at each site, the participants were able to draw a
sketch map of their local areas and timelines since the 1970’s (Figure 4.1-4.3). The result
from the mapping exercise in each area illustrates the past and present land use system, crop
types, and infrastructure development.
4.2.1 Sketch of the study sites
Forest area was decreased, but the last five years forest restoration projects in a form of water
shade development are conducted at the region level and some areas are now under protection
to rehabilitate. There is almost no grazing area anymore in the study sites that farmers in

15
Wondo Genet and Tula bring their livestock to another district (Borecha), out the district
during the dry season (April-October) to search feed for their animal.
Hawassa Zuria: The sketch in Hawassa Zuria shows that the majority of farmland was used
for maize cultivation with some natural forest covers prior to 1991 (Figure 4.1a). During this
period, maize was the dominant crop in the area. However, post-1991 the residential area
expanded, infrastructure development and of enset and some vegetable crops around Lake
Hawassa were introduced (Figure 4.1b).
Figure 4.1: Sketch of Hawassa Zuria district pre-1991 (a) and post-1991 (b)
Tula: Sketch of two PAs representing Tula district shows natural forest, grazing land, and
enset dominated land use systems with some maize and one state-owned farm prior-1991
(Figure 4.2ac). However, post-1991 there was a rural infrastructure development; expanded
residential area and conversion of natural forest and grazing land into khat, coffee, enset,
maize, and introduction of vegetable crops along Lake Hawassa side (Figure 4.2bd).

16
Figure 4.2: Sketch of Tula district prior-1991 (ac) and post-1991 (bd)
Wondo Genet: The sketch of three PAs representing Wondo Genet shows that prior to 1991
the dominant land use systems were natural forest and pasture land, coffee, enset and maize
crops (Figure 4.3ace). However, post-1991 there was an expansion of rural roads; expanded
residential area and conversion of forest and grazing land into khat, coffee and maize area
with some marshy areas (Figure 4.3bdf).

17

18
Figure 4.3: Sketch of Wando Genet district prior-1991 (ace) and post-1991 (bdf)
4.2.2. Timeline of the study sites
During the timeline recording participants were asked to recall historical events related to
access to resources, adverse weather conditions and access to agricultural technologies (Table
4.2). Timeline of each site (Table 4.2) reveal events that happened at the national level: (i) the
prior to 1974 limited access to agricultural lands, (ii) the 1975 land reform, (iii) the 1985
drought, and (iv) access to a new form of extension service, training and agricultural
technologies since 1999. FGD participants indicated that they faced problems at the local
level from the attack of the maize stalk borer and wind resulting total loss of maize in 2013.
Whereas, flooding, Ice and border conflicts between the Sidama and Oromo tribes were
resulted burning of houses and losses resource in different time (Table 4.2).
Relativelly high intervention of development projects were observed in Hawassa Zuria,
which could be attributed to drought vulnerability of the landscape that could contribute to
food insecurity and need for intervention.

19
Table 4.2: Timeline of the study sites since 1970’s
Period Wondo Genet Tula Hawassa Zuria
Prior-1974 - Limited access to agricultural resource - Limited access to agricultural resource - Limited access to agricultural resource
1975 - Land reform-entitled land ownership - Land reform-entitled land ownership - Land reform-entitled land ownership
1985 - Shortage of rain - Shortage of rain - Shortage of rain- drought
- Famine
1990 - Conflict between Sidama and Oromo
tribes resulted in the loss of resources
1995 - Flooding and overflow of Lake Hawassa
resulted in the loss of resources
1999-2004 - Access to agricultural technologies, the FTC
established, new forms of extension service,
training
- Access to agricultural technologies, the FTC
established, new forms of extension service,
training
- Access to agricultural technologies, the
FTC established, new forms of extension
service, training
2002 - Safety net programs started
- Soil and water conservation
- Supplied livestock and equine
driven charts
2004 - Flooding and Ice resulted in the loss of crop and
resource
- Goal Ethiopia started development
intervention
- Supplied different vegetables
seed and enset seedlings
2006 - Flooding and Ice resulted in the loss of crop and
resource
2011 - Conflict between Sidama and Oromo tribes
resulted in the loss of resource and emergency
support
- Chili pepper production stopped due to
diseases
2013 - Maize crop losses
- Stalk borer and wind
- Introduction of improved varieties of
maize by Pioneer
- Maize crop losses
- Stalk borer and wind
- Introduction of improved varieties of
maize by Pioneer
- Maize crop losses
- Stalk borer and wind
- Introduction of improved
varieties of maize by Pioneer
Source: Owen computation from FGD, 2014

20
4.3. Characterisation of farming systems of the area
Smallholder subsistence-oriented crop-livestock mixed farming systems are the dominant
farming system in the studied sites. Perennial-annual food and cash crops based farming
systems characterise agricultural production in Wondo Genet and Tula. Maize and enset crops
are a major staple food crop source for almost all farm households in Wondo Genet and Tula
over the studied period. Maize remains the only staple food crop source in Hawassa Zuria.
However, in the past decade introduction of enset is contributing to the stable food crop
source to some of the farm households in Hawassa Zurai.
Perennial crops such as khat, coffee and fruits and vegetables are primarily produced for sale
in Wondo Genet and Tula. Perennial cash crop production is not common in Hawassa Zuria,
while maize is used as a cash source besides its use as a sole stable food. Crops like haricot
bean, sweet potato, potato and chili peppers were also produced as cash crops in Hawassa
Zuria. Informal discussions with elderly people and FGD reveal that over the last two to three
decades, there has been an increasing demand for food and cash source in the study sites.
These result an intense competition between the predominant traditional farming systems and
the more lucrative production systems.
4.3.1. Source of farm household income
In all the studied sites, the income of farm households comes from a range of crop-livestock
production to off-farm activities (Table 4.4). In 2014, 60, 78 and 50% of household in
Wondo Genet, Tula and Hawassa Zuria, respectively have some kind of off-farm activities.
Relatively higher involvement in off-farm activities in Tula is attributed to closeness to urban
area (Hawassa town) where farmers can have access to market information and temporary
employment. Farmers response, 30, 11 and 17% in Wondo Genet, Tula and Hawassa Zuria,
respectively shown that children also engaged in some kind of off-farm activities in 2014.
Petty trading and casual labour are a primary source of off-farm income in the study sites.
Thus, at the beginning of farming activity 50, 80 and 100% of the farmers depend on trade as
an additional source of income, respectively in Wondo Genet, Tula and Hawassa Zuria (Table
4.3). However, in 2014, 80, 29 and 82% of the farmers respectively in Wondo Genet, Tula
and Hawassa Zuria involve in trading of cereal grain (maize) and cash crop (khat and coffee).
21
Table 4.3: Farmer’s response on the main sources of farm household income and types of off-farm activities in
the study sites since 1970’s (%).
Source of income Wondo Genet Tula Hawassa Zuria
Prior-1974
Crop-livestock production 33 17 19
During 1974-1991
Crop-livestock production 50 33 62
Crop-livestock & off-farm 8 25 19
Post-1991
Crop-livestock production 17 25 31
Crop-livestock & off-farm 75 42 63
Types of off-farm activity
In the current time
Causal labour 29 18
Trading 80 29 82
At farming start-up
Trading 50 80 100
Source: Life history interview, 2014
However, some of the farmers were not getting involved in any form of off-farm activities,
which is due to lack of information on off-farm activities across the study sites.
4.3.2. Crop production
Annual and perennial food and cash crops: maize, enset, and khat share the higher proportion
of land use of Wondo Genet and Tula over the studied periods. Annual crops: maize, chili
peppers and potatoes were the dominant crop prior to 1991 in Hawassa Zuria. Maize and
enset crop are present in 90% of the farms studied while khat and coffee present at 57.5 and
32.5% of farms, respectively. Haricot bean is ubiquitous commonly intercropped with maize
and other permanent crops. Farmers in Wondo Genet and Tula commonly used to intercrop
coffee and different fruit crops with other annual and perennial crops post 1991 that their area
share is very negligible. However, the ubiquitous staple food crop (maize) area share is
reduced post-1991 in the study sites. The corresponding decrease in the maize area share
could be explained by the relative increase in the enset area share in each site (Figure 4.4) and
khat production in Wondo Genet (Figure 4.7). The corresponding increase in khat acreage is
explained by the increasing demand for khat and higher financial return from the crop over
any other crops due to its per annum multiple harvests. Relatively average food and cash crop
production is shown in Tula, compared to the two landscapes over the studied period (Figure

22
4.6). In Hawassa Zuria, enset was introduced over the last one decade with the aim of
permanent food and fodder source (Figure 4.5). However, few farmers that currently
immigrated into Hawassa Zuria in search of farmland are used to have enset prior to 1991 in
Borecha district.
Figure 4.4: Trends in dominant crop production of the study sites since 1970’s
Figure 4.5: Trends in dominant crop production in Hawassa Zuria since 1970’s
Figure 4.6: Trends in dominant crop production in Tula since 1970’s
0
0.1
0.2
0.3
0.4
0.5
0.6
Prior-1974 1975-1991 2014
Aver
age
crop a
rea
(ha)
Periods
Maize
Enset
Khat
Coffee
0.00
0.10
0.20
0.30
0.40
0.50
0.60
0.70
0.80
Prior to 1974 1975-1991 2014
Aver
age
cro
p a
rea
(ha)
Periods
Maize
Enset
Chili pepper
Potato
0.00
0.10
0.20
0.30
0.40
0.50
0.60
0.70
Prior to 1974 1975-1991 2014
Aver
age
cro
p a
rea
(ha)
Periods
Maize
Enset
Khat
Coffee

23
Figure 4.7: Trends in crop production in Wondo Genet since 1970’s
Production orientation: Production orientation in the context of this study defined as the
proportion of food crop area of the total cropland holdings. Production orientation of the study
sites in 1975-1991 shows 94, 85 and 56% in Hawassa Zuria, Tula and Wondo Genet,
respectively. However, the relative decline in production orientation to 89, 70 and 37% in
Hawassa Zuria, Tula and Wondo Genet respectively observed in 2014 (Figure 4.8). This
could be attributed to the increase in cash crop production and off-farm activities like petty
trading.
Figure 4.8: Production orientation in the study sites since 1970’s
Generic crop diversity: Sidama zone is thought to be home to a diverse home garden to field
crop diversity. However, difference among the landscapes and trends in the level of dominant
crop diversity gradients were observed in the area. Thus, level of crop diversity in Hawassa
Zuria showed a gradual increase from the introduction of enset and vegetables along side of
Lake Hawassa in 2014. However, shortage of farmland (81%), lack of irrigation water (69%)
and access to agricultural inputs and credit (31%) were identified to limit farmers to diversify
their crops in Hawassa Zuria (Table 4.4). Dominant crops (maize, enset, khat, and coffee)
diversity in Tula showed stability over the studied periods; these could be attributed to the
0.00
0.05
0.10
0.15
0.20
0.25
0.30
0.35
Prior to 1974 1975-1991 2014
Aver
age
cro
p a
rea
(ha)
Preiods
Maize
Enset
Khat
Coffee
0
20
40
60
80
100
Prior 1974 1975-1991 2014
Fo
od
cro
p a
rea
shar
e (%
)
Periods
Wondo Genet
Tula
Hawassa Zuria
Average

24
potential of the area for both food and cash crop production. Nevertheless, farmers in Tula
evidenced the shortage of farmland (67%), irrigation water (58%) and limited access to
agricultural extension service (25%) to further diversify crops (Table 4.4). The limited access
to agricultural extension service in Tula partly explained by being part of Hawassa district
(urban) resulted in less attention was given by agricultural office. Shortage of farmland (75%)
which is responsible for the selection of more valuable crops, lack of irrigation water (67%)
and limited access to inputs and credits service (33%) were identified as a limiting factor to
diversify crops in Wondo Genet (Table 4.4).
Table 4.4: Factors limiting crop diversity in three districts of Hawassa area (% of farmer response)
Limiting factors Wondo Genet Tula Hawassa Zuria
Land shortage 75 67 81
Lack of irrigation water 67 58 69
Limited access to inputs and credits 33 31
Limited access to extension 25
4.3.3. Livestock production
Livestock production was recognized as a long tradition of farming communities in the study
sites. Different species of livestock, such as cattle, goats, equines, chickens, and bee colonies
were identified constituting herd composition of the study sites since a long time. The farmers
kept local breeds of cattle, characterized by low productivity for milk production, power and
cash savings. Since 1990’s, variation in the number of livestock was observed across the
study sites. A relatively high density of livestock 10.76 and 7.22 TLU kept in Tula and
Wondo Genet, respectively, as compared to Hawassa Zuria (3.99 TLU) about 30 years ago
(Table 4.5). These could be explained in Wondo Genet and Tula by the availability of natural
pasture and forest-based grazing and temporally movement of some farmers with their
animals in Hawassa Zuria in search of feed. The lesser density of livestock in Hawassa Zuria
could be attributed to limited availability of natural pasture and forest-based grazing; maize
crop residue is the only feed source up to now.
Table 4.5: Trends in average livestock holding in the study sites since 1970’s (Mean ± standard deviation)
Periods Wondo Genet Tula Hawassa Zuria
Livestock size 30 years ago (TLU) 7.22±13.35 10.76±12.67 3.99±4.35
Livestock size currently (TLU) 1.96±1.95 2.58±2.42 2.41±2.96

25
Tropical Livestock Units (TLU) is livestock numbers converted to a standard unit. One TLU is equivalent to one
cattle with a body weight of 250 kg. Conversion factors are: cattle = 0.7, sheep = 0.1, goats = 0.1, chicken = 0.01
(Harvest Choice, 2011).
However, since the 1990’s drastic declines in livestock density was observed in the study
sites. 82 % of farmers in the study sites decreased their livestock density in the past 30 years,
from sell-off their livestock (39%), feed shortage (39%), livestock disease (16%), and labour
shortage (6%). However, 18% of the farmers increased their livestock numbers due to their
investing power and use of livestock as cash saving for their family. The trends in livestock
holding show relatively higher decline in Tula and Wondo Genet compared to Hawassa Zuria
(Table 4.6). The relatively higher decline is attributed to high-feed shortage in Wondo Genet
and Tula, compared to Hawassa Zuria.
Table 4.6: Farmer’s response to trends in livestock holding and factors accounted for the change in herd size
since 1970’s (%).
Wondo Genet Tula Hawassa Zuria
Trends in livestock holding
Decreasing 83 91 73
Increasing 17 9 27
Reasons to decreased livestock size
Feed shortage 60 50 9
Sell-off livestock 30 30 73
Livestock diseases 10 20 18
Source: Own computation from life history interview, 2014
4.4. Analysis of farming systems trajectories
Principal component analysis (PCA) was conducted on socioeconomic and market access
variables for 40 farmers to identify factors that summarize variation among farms. Eigenvalue
from the analysis was used to determine the number of components to be included in the
farming system’s trajectories analysis. Consequently, the first three principal components
with eigenvalues above one were selected for the analysis. The three PCs explained 59.59%
of the total variation of farms. The first PC, which explained 30.23 % of the total variance,
was associated with farmland size (land), periods of food self-sufficiency (food), enset crop
area share (enset), herd size (lsck), and family size (fams) with negative loadings. The second
PC, which explained 18.45% of the variance was associated with production orientation (pror)
and distance to the nearest market (markt) with negative loadings and khat crop area share
26
(khat) with a positive loading. The third-PC axis, which explained 10.92% of the total
variance, was associated with age of farm household with positive loadings.
The correlation circle of quantitative variables is indicated on the first two PCs (Figure 4.9).
The first PC (axis 1) sort farms by total farmland area, periods of food self-sufficiency, enset
production and herd size. Family size was also linked to the first axis to a lesser extent. These
are indicators of farm size and showed strong correlation and greatly contributed to the first
axis. Moreover, showed the potential of self-sufficiency from own production. The second PC
(axis 2) sort farms by khat area, production orientations and distances to the nearest market.
Khat production and age of the farmers showed a strong correlation, while they contribute to
the second axis with distance to the road. These results indicate that older farmers had a
relatively more area share for khat crop and living along the roadside. Farmers in Wondo
Genet and Tula have better access to the main road which resulted in the dominance of cash
crop mainly khat and coffee, compared to Hawassa Zuria. Besides, the potential for cash crop
production, Washa town in Wondo Genet and Tula is the main collection centre, market and
transit for khat produce. Tula is closest to Hawassa town and on the way to Shashemane and
other surrounding towns to transit khat. The production orientation and distance to the nearest
market contributed to the second axis, but on the opposite to khat production, age of the
farmers and distance to the nearest road. Farmers in Hawassa Zuria, showed relatively higher
production orientation, compared to Wondo Genet and Tula. Besides, the use of maize as a
sole staple food source famer also uses maize as cash source over the studied period.
Figure 4.9: Representation of the quantitative variables on the first two principal components of dudi. pca.

27
Land, total farmland owned by the farmer; lsck, herd size; fams, family size; food, months of food self-
sufficiency; pror, production orientation; khat, khat area; enset, enset area; markt, distance to the nearby market;
road, distance from the road; age, age of farm household.
4.5. Description of farming system trajectory types
The hierarchal cluster analysis of the first two PCs was result three-board groups of farming
systems trajectory (Figure 4.10). The three distinguished trajectories were present in all the
three landscapes and constitute group of farms roughly with similar trends of change. The
number of clusters was determined on the observed ‘jumps’ in the inertia inter-cluster on the
bar plot.
Figure 4.10: Positioning the farms on the first two principal components of the dudi.pca.
Almost all farms in each trajectory include off-farm activities as an additional source of
family income. About 70, 67 and 100% of farms in trajectory 1-3, respectively include some
kind of off-farm activities in 2014. Higher percentage involvement in off-farm activities in
trajectory 3 were attributed to lack of other cash sources while farmers in trajectory 1 and 2
could fulfil their cash needs from cash crop production. General descriptions of each
trajectory are given in the following paragraph:
Trajectory 1: (Moderate increase in farmland size, reduced annual crop area (maize), and
increased perennial crop area (enset and khat), cash oriented production)
The group constitutes (n=10, 25%) farms that experienced moderate increase in farm land size
(from 1.16 ha prior to 1991 to 1.33 ha in 2014), thereby increment in perennial crop (enset

28
and khat) area share and decreased maize area (Table 4.8). Farms from Wondo Genet (25%),
Tula (33.33%) and Hawassa Zuria (18.75%) belong to this group. Average family size per
household was increased from three at the beginning of farming activity to seven in 2014 and
owned by relatively older farmers of about 46.2 years old. Farmers are food self-sufficient
from own production for roughly eleven months in 2014. The production orientation of this
type decreased from 83% prior 1991 to 76% in 2014. Livestock density declined from 11.86
TLU prior 1991 to 4.86 TLU in 2014. Moreover, farms in this group decreased annual food
crop (maize) area share from 0.85 ha prior 1991 to 0.59 ha in 2014, while increasing perennial
crop area share (enset) from 0.17 ha prior 1991 to 0.33 ha in 2014. Cash crop area share
(mainly khat) was increased from 0.11 ha prior 1991 to 0.21 ha in 2014 (Table 4.7). The
increase in perennial crop production in this type could be explained by relatively higher
access to irrigation water (40%), compared to the other trajectories.
Trajectory 2: (Maintained farmland size, reduced annual crop area (maize), minor increase
in perennial crop area (enset and khat), self-subsistent food and cash oriented)
The trajectory 2 grouped the greatest number of farms (n=21, 52.5%) that experienced
stability in farm land size, thereby minor increment in perennial crop (enset and khat) area
share (Table 4.8). Majority of farms from Wondo Genet (75%), Tula (58.33%) and Hawassa
Zuria (31.25%) belongs to this group. Farms of this type were relatively owned by older
farmers with a mean age of about 46.7 years. Average family size per household was
increased from three at the beginning of farming activity to seven in 2014. This trajectory
corresponds to self-subsistence food and cash crop orientation. Farmers are food self-
sufficient for about ten months and characterized by low and decreased production orientation
from 73% in 1991 to 54% in 2014. The lower production orientation could be attributed to the
relatively smaller mean farmland holdings of 0.57 ha since 1975 and annual food crop area
share, compared to trajectory 1 and 3. Moreover, cash crop area share of farms in this
trajectory was lower (0.09 ha in 2014), compared to 0.21 ha in trajectory 1 in the same period.
However, farms in this trajectory are closest to the road (1.1 km in 2014), compared to the
other groups. Livestock density declined from 5.55 TLU prior 1991 to 1.49 TLU in 2014
(Table 4. 7).
Trajectory 3: (Maintained farmland size, reduced annual crop area (maize), increased and/or
introduced enset, self-subsistent food crop oriented production)

29
Trajectory 3 grouped relatively small number of farms (n= 9, 22.5%) that experienced
stability in farm land size, decreased maize area share and introduced enset (Table 4.8). Farms
of Hawassa Zuria (50%) and Tula (8.34%) belong to this category. Farms in this group have
predominated higher production orientation of 94% prior to 1991 and 89% in 2014. These
could be attributed to higher access to agricultural inputs (89%) and credit service (78%),
compared to trajectory 1 and 2. Farmers in this trajectory are food self-sufficient for only
about six months, which is less as compared to trajectory 1 and 2. These could partly explain
the dependency on annual crop (maize) both as food and cash source, compared to the other
groups where enset and a khat would contribute to food and cash source, respectively.
Moreover, the area share of the annual food crop (maize) area of 0.71 ha prior 1991 which
declined to 0.53 ha in 2014. The relative decline in annual food crop could be explained by
increased perennial food crop (enset) area share from 0.09 ha prior 1991 to 0.22 ha in 2014.
Cash crop production was negligible for this type of farming systems over the studied period.
These are assigned to lesser access to agricultural extension service (78%), compared to
trajectory 1 and 2, which could contribute to food and cash crop diversification. Relatively
younger farmers of about 38.9 years old undertake this type of farming systems. Average
family size per household was increased from three at the beginning of farming activity to
about six persons in 2014. Farmland holding of this trajectory was 0.85 ha over the studied
period, and relatively keep the small number of livestock 3.96 and 1.47 TLU prior 1991 and
in 2014, respectively (Table 4. 7).

30
Table 4.7: Main changes in farm characteristics according to trajectories of changes since 1970.
Variables Periods Trajectory 1 Trajectory 2 Trajectory 3 Overall
average
Number of farms 10 21 9
Farms distribution (%) 25 52.5 22.5
Mean age of farm household 46.20±14.30 46.67±14.43 38.89±4.91 44.8±13.01
Family size (# of family members
living with the farmer)
Farm start-
up
2.70±1.80 2.76±1.69 3.22±1.98 2.85±1.73
2014 8.40±3.24 7.19±2.74 6.00±1.18 7.22±2.77
Farm land size (ha) Prior-1974 0.41±0.81 0.42±0.62 0.0±0.00 0.32±0.62
1975-1991 1.16±0.64 0.58±0.27 0.85±0.51 0.78±0.50
2014 1.33±0.49 0.57±0.24 0.85±0.27 0.81±0.45
Livestock size (TLU) Prior-1991 11.86±13.37 5.55±10.19 3.96±5.31 6.72±10.44
2014 4.86±2.25 1.49±1.42 1.47±1.16 2.32±2.16
Periods of food self-sufficiency (#
of months)
2014 11.2±1.13 10.06±2.51 6.29±2.23 9.03±2.96
Maize area (ha)a Prior-1974 0.32±0.67 0.25±0.39 0.00±0.00 0.21±0.44
1975-1991 0.85±0.35 0.35±0.41 0.71±0.39 0.56±041
2014 0.59±0.45 0.26±0.18 0.53±0.22 0.40±0.28
Enset area (ha) Prior-1974 0.07±0.17 0.13±0.24 0.00±0.00 0.09±0.20
1975-1991 0.17±0.12 0.14±0.14 0.09±0.10 0.14±0.12
2014 0.33±0.15 0.11±0.09 0.22±0.12 0.19±0.14
Khat area (ha) Prior-1974 0.0±0.04 0.03±0.06 0.00±0.00 0.02±0.05
1975-1991 0.11±0.11 0.06±0.08 0.01±0.04 0.06±0.08
2014 0.21±0.13 0.09±0.8 0.02±0.04 0.1±0.11
Distance to the nearest market (km) Prior-1991 13.6±10.84 9.31±+11.69 14.43±10.62 12.17±11.11
2014 4.6±1.52 3.78±1.32 2.75±2.11 3.62±1.97
Distance to the closest road (km) Prior-1991 5.2±3.27 7.37±3.46 6.14±7.07 6.4±4.47
2014 2.4±0.81 1.1±0.76 1.54±0.61 1.57±0.76
Production orientation (% of food
crop area to total farm area)
Prior-1991 83 73 94 80
2014 76 54 89 68
Involvement in off-farm activities
(%) a
2014 70 67 100 75
Irrigation water (%) a 2014 40 29 33 33
Extension service (%)a 2014 90 81 78 83
Inputs service (%)a 2014 80 62 89 73
Credit service (%)a 2014 50 57 78 60
Source: Own computation from life history interview, 2014
Mean ± S.D: are calculated to study relative changes aSupplementary variables not included in principal component analysis

31
Table 4.8: Trends observed in farming systems trajectories of evolution
Variables Periods Trajectory 1 Trajectory 2 Trajectory 3 Overall
average
Family size (# of family members
living with the farmer)
Change 2 ↑ ↑ ↑ ↑
Farm land size (ha) Change 1 ↑ ↑ ↑ ↑
Change 2 ↑ ↔ ↔ ↑
Livestock size (TLU) Change ↓ ↓ ↓ ↓
Maize area (ha)a Change 1 ↑ ↑ ↑ ↑
Change 2 ↓ ↓ ↓ ↓
Enset area (ha) Change 1 ↑ ↑ ↑ ↑
Change 2 ↑ ↓ ↑ ↑
Khat area (ha) Change 1 ↑ ↑ ↑ ↑
Change 2 ↑ ↑ ↑ ↑
Distance to the nearest market (km) Change 2 ↓ ↓ ↓ ↓
Distance to the closest road (km) Change 2 ↓ ↓ ↓ ↓
Production orientation (% of food crop
area to total farm area)
Change 2 ↓ ↓ ↓ ↓
Change 1: difference of 1975 to 1991from the prior to 1974
Change 2: difference of post to1991 (2014) from the prior to 1991
4.6. Drivers of farming system changes
Increasing family size: The average family size of about 2.85 at the beginning of farming
activity was increased to about 7.22 in 2014. These contributed to decreased per capital
average farmland holding from 0.27 ha prior 1991 to about 0.11 ha in 2014 from sharing of
arable land to family members. The change in farmland size is driving the change in farming
system. A decreasing trends in per capital, land holding result a change of farming systems
towards selection of valuable crops.
Economic return: The higher economic return from cash crop is driving farmers towards cash
crop production mainly khat. Rises in the market price of agricultural produces: cash crops,
cereals and vegetables are driving the changes in farming system of the area
Easy market access: Over the last two decade’s improvement in access to market have been
the main drivers of farming system change in the area (Garrity et al., 2012). A farmer in
Wondo Genet and Tula district has more access to the “asphalt road”, compared to Hawassa
Zuria that cash crop, mainly khat is cash source. However, farmer in the Hawassa Zuria
focuses on food crop productions. However, with the improved market access in the area
continued subsistence-oriented production characterise farming system of the area.
32
Institutional change: Change in agricultural policy resulted from regime change enabled
farmers to have access to agricultural extension services, agricultural inputs and credits,
which could contribute to improved crop productivity.

33
5. Discussions
The study provides evidence of farming system dynamics between 1974 and 2014 in Hawassa
area. The approach used in this study is holistic, combining different quantitative and
qualitative data and attempted to describe the changes in farming system, and identify the
main drivers of the changes; thereby understand the trajectories of farming system. Our
approach differs from those studies which employ quantitative analysis to understand the
trajectories of farming systems over a given period (Rueff et al., 2012; Choisis et al., 2012;
Rueff and Gibon, 2010). Empirical studies of trajectory analysis based on an interview with
farmers could have intrinsic limitations, in which collection of data relies on the farmers
memories of past farming characteristics. According to Mottet (2005) and Cialdella et al.,
(2008) cited in Rueff et al., 2010 “relying only on data from farmers memories could present
vagueness that will increase with time and will hamper precision in temporal analysis.”
Therefore, our approach has the advantage that it would enable us to triangulate the
perception of the communities in their local area, life history of individual farmers and
quantitative analysis on the evolution of farming systems. Nevertheless, the approach has
inherent limitations because of the difficulties in combining data derived by different methods
and data of the different nature.
The participatory mapping based perception analysis shows that changes in the biophysical
features of the area were observed since 1991. Arable land and habitat expansions were
observed in Hawassa area. However, the increase was paralleled by eventual disappearance
and conversion of natural forest and grazing lands. This aspect agrees with quantitative data
and life history analysis of individual farmers that show changes in crop production over the
studied period. The result also agrees with the work of Negash and Niehof (2004) who
reported on the decline in natural forest and grazing lands and conversion to arable land in the
area. Reynolds et al., (2010) also reported in Hawassa area on the loss of fertile flatlands with
heavy machinery and conversion to maize mono-crop some 30 years ago and clearing of
mountain slopes and galley forests from the population growth, which demand for expansion
of farmland, fuel woods and construction materials. Dessie and Kinlund (2008) also reported
on the expansion of khat crop at the cost of natural forest decline. The expansion of cash
crops is driven by higher financial return from a particular crop, market and road networks in
Wondo Genet and Tula. The result agrees with other studies that stated demographic

34
condition, economic and market factors result in the expansion of the khat crop production in
Wondo Genet (Abebe, 2013; Dessie and Kinlund 2008).
Socio-political conditions and economic policy change explained at national level influenced
land ownership change, access to the resource and economic process, thereby farming system
changes at local level. The result in line with the work of Dessie and Kleman (2007) who
reported on the pattern of political control and control over resource, and Belete et al., (1991);
Zerihun (2009); Headey et al., (2014) who reported on farmers access to farmland as affected
by the regime changes.
The quantitative analysis reveals three-farming system trajectories, which present in all the
three landscapes. Trajectory 1: Moderate increase in farmland size, decreased maize area,
increased enset and khat area, cash oriented production; Trajectory 2: Maintained farm land
size, reduced maize area, minor increase in enset and khat, self-subsistent food and cash
oriented; and Trajectory 3: Maintained farm land size, decreased maize area, introduced enset,
self-subsistent food crop oriented and non-cash crop production. These characteristics,
however, present the categorisation of farms built on standard farm household socioeconomic
indicators, production orientation and market access.
The three-trajectory groups had clearly defined production orientation, which is characterised
by decreasing trends post 1991. Trajectory 3 and 1 has predominantly higher production
orientation, compared to trajectory 2. The post-1991, increase in the area share of cash crop
(khat) and perennial food crop (enset), is because that cash crop production was more intense
in Wondo Genet than Tula and the need for perennial food crop source in Hawassa Zuria. The
increase in khat crop production, post-1991 was driven by higher financial return over any
other crops per unit area and per annum multiple harvests favoured by improved market
access. The result in line with the work of Dessie and Kinlund (2008) who reported on the
intense production of the khat crop as favoured by access to road and transport facilities to
enable efficient transport of the perishable produce. Abebe et al., (2010) also reported on the
economic advantages of khat over coffee and ecological benefits of khat to that of maize post
1991.
The trends in enset production shown to increase over time in each study site for its drought
resistance and a multipurpose use as food and fodder source. Focus group discussions and life
history analysis shown that enset based food source helped farmers of Wondo Genet and Tula

35
to withstand the incident of the 1985 famine that happened at national level. The life history
analysis and FGD confirm the result that in there saying
“We cannot live without enset as a food source, and enset has been our heritage that we
received from our family, and Kocho (food prepared from enset) is our stable and cultural
food.”
However, enset is virtually never the sole food-source of households and is rarely their chief
marketed item. The result contradicts with the work of Abebe et al., (2010) who reported on
decreasing trends in perennial food crop (enset) in favour of the annual food crop (maize) in
the area. The actions of the farmers were also encouraged by development projects promoting
agricultural diversification like Goal Ethiopia (distribute enset seedling and vegetable seeds in
Hawassa Zuria since 2004 (Table 4.3). Access to agricultural extension and technologies
enabled the farmer to diversify their food crops source since 2004.

36
6. Conclusions
From the empirical evidence described above, we can derive the following conclusions: The
report reflects the expansion of arable land area from the eventual disappearance of natural
forest and conversion of grazing lands, per capital decreased farmland holding, decreasing
trends in livestock density and change in production orientation. The study also reveals the
decreasing trends in maize area share; while trends in perennial crop (enset and Khat) area
share is increasing.
The observed change in farming systems were not only explained by the landscape itself. The
biophysical factors, micro climatic conditions, household socioeconomic conditions and easy
market access are factors drivers explained at the landscape level. The political system or
regime change which is accountable to change in agricultural policy, access to resources,
access to agricultural technologies and market are the driver of changes that could be
explained at higher levels even at region and national level. However, some drivers are
relatively specific to a given landscape. For example, development program intervention by
different governmental and non-governmental organizations working to improve the
livelihood of the farmers suffering from shortages of rainfall.
Three farming system trajectories that present in each landscape, constituting a group of farms
roughly with similar trends of changes were distinguished. The trajectories were characterised
by trends in resource endowment, production orientation and dominant crop production.

37
7. References
Abate T, Van Huis A., Ampofo J. Pest management strategies in traditional agriculture: an
African perspective. Annual Review of Entomology. 2000; 45(1):631-59.
Abate T, Worku M, Twumasi-Afriyie S, Wolde L, Tadesse B, Demisie G, et al., editors.
Maize stalk borers of Ethiopia: quantitative data on ecology and management.
Meeting the challenges of global climate change and food security through innovative
maize research Proceedings of the 3rd National Maize Workshop of Ethiopia, Addis
Ababa, Ethiopia, 18-20 April, 2011; 2012: CIMMYT International Maize and Wheat
Improvement Center.
Abebe T, Wiersum K, Bongers F, Stock F. Diversity and dynamics in home gardens of
southern Ethiopia. Tropical Home gardens: Springer; 2006. p. 123-42.
Abebe T, Wiersum K, Bongers F. Spatial and temporal variation in crop diversity in
agroforestry home gardens of southern Ethiopia. Agroforestry systems. 2010; 78
(3):309-22.
Abebe T. Determinants of crop diversity and composition in Enset-coffee agroforestry home
gardens of Southern Ethiopia. Journal of Agriculture and Rural Development in the
Tropics and Subtropics (ARTS). 2013; 114(1):29-38.
Addis Ababa University (AAU). Agricultural mechanization suited for Ethiopian conditions.
Department of Economics, AAU, Addis Ababa (mimeo). 1980.
Belay K, Manig W. Access to rural land in Eastern Ethiopia: Mismatch between policy and
reality. Journal of Agriculture and Rural Development in the Tropics and Subtropics
(JARTS). 2004; 105(2):123-38.
Belete A, Dillon JL, Anderson FM. Development of agriculture in Ethiopia since the 1975
land reform. Agricultural Economics. 1991; 6(2):159-75.
Bishaw B, Neufeldt H, Mowo J, Abdelkadir A, Muriuki J, Dalle G, et al. Farmers’ Strategies
for Adapting to and Mitigating Climate Variability and Change through Agroforestry
in Ethiopia and Kenya. 2013.
Carswell G. Agricultural intensification in Ethiopia and Mali. IDS research report (2000).
Choisis JP, Thévenet C, Gibon A. Analyzing farming systems diversity: a case study in south-
western France. Spanish Journal of Agricultural Research. 2012; 10(3):605-18.

38
Dennis Garrity, John Dixon, Jean- Marrc Boffa. Understanding African farming system
science and implications. Aciag. Gov.au/aifsc. 2012.
Dessie G, Kleman J. Pattern and magnitude of deforestation in the South Central Rift Valley
Region of Ethiopia. Mountain research and development. 2007; 27(2):162-8.
Dessie, G. and P. Kinlund. "Khat expansion and forest decline in Wondo Genet, Ethiopia."
Geographical Annals: Series B, Human Geography. 2008; 90 (2): 187-203.
Emana Getu. Ecological analyses of cereal stem borers and their natural enemies under maize
and sorghum based agro-ecosystems in Ethiopia. Ph.D thesis, Kenyatt a University.
2002a.
FAO. http://www.fao.org/farmingsystems/description_en.htm
Garrity, Dennis, John Dixon, and Jean-Marc Boffa. "Understanding African farming
systems." Australian International Food Security Centre, Canberra, 2012.
Getahun, A. "Agricultural systems in Ethiopia." Agricultural systems. 1978; 3(4): 28.
Getahun, D. Evaluation of the toxicity of crude extracts of some plants and a synthetic
insecticide on different castes of Macrotermes termites. M.Sc. thesis, Addis Ababa
University. 2003.
Harvest Choice. "Total livestock population (TLU) (2005)." International Food Policy
Research Institute, Washington, DC. and University of Minnesota, St. Paul, MN.
2011. http://harvestchoice.org/maps/total-livestock-population-tlu-2005 .
Hawassa Zuria district agricultural office, 2013
Headey, Derek, Mekdim Dereje, and Alemayehu Seyoum Taffesse. "Land constraints and
agricultural intensification in Ethiopia: A village-level analysis of high-potential
areas." Food Policy, 2014.
Madry W, Gozdowski D, Roszkowska-Madra B, Dabrowski M, Lupa W. Diversity and
typology of farms according to farming system: a case study for a dairy region of
Podlasie Province, Poland. Electronic Journal of Polish Agricultural Universities
Series Economics. 2010; 13 (2).
Negash, A. and A. Niehof. "The significance of enset culture and biodiversity for rural
household food and livelihood security in south-western Ethiopia." Agriculture and
human values. 2004; 21(1): 61-71.

39
Oerke E, Dehne H, Schönbeck F, Weber A, Meulen T, Schoeman A, et al. Crop production
and crop protection; estimated losses in major food and cash crops. Fruits (Francia).
1994; 49(1):71-5.
Pengelly, Bruce C., and Brigitte L. Maass. "Lablab purpureus (L.) Sweet–diversity, potential
use and determination of a core collection of this multi-purpose tropical legume."
Genetic Resources and Crop Evolution 48.3 (2001): 261-272.
Pretty, Jules, Camilla Toulmin, and Stella Williams. "Sustainable intensification in African
agriculture." International journal of agricultural sustainability 9, no. 1 (2011): 5-24.
Reynolds, Travis W., Joshua Farley, and Candice Huber. "Investing in human and natural
capital: An alternative paradigm for sustainable development in Awassa, Ethiopia."
Ecological Economics 69.11 (2010): 2140-2150.
Rueff, Camille, Annick Gibon, I. Darnhofer, and M. Grötzer. "Using a view of livestock
farms as social-ecological systems to study the local variety in their trajectories of
change." In Building sustainable rural futures: the added value of systems approaches
in times of change and uncertainty. 9th European IFSA Symposium, Vienna, Austria,
4-7 July 2010. pp. 1169-1179. BOKU-University of Natural Resources and Applied
Life Sciences, 2010.
Rueff, Camille, Jean-Philippe Choisis, Gerard Balent, and Annick Gibon. "A preliminary
assessment of the local diversity of family farms changes trajectories since 1950 in a
Pyrenees Mountains area." Journal of Sustainable Agriculture 36, no. 5 (2012): 564-
590.
Ryschawy, J., N. Choisis, J. P. Choisis, and A. Gibon. "Paths to last in mixed crop–livestock
farming: lessons from an assessment of farm trajectories of change." animal 7, no. 04
(2013): 673-681.
Ryschawy, J., N. Choisis, J. P. Choisis, and A. Gibon. "Understanding how farmers last over
the long term: a typology of trajectories of change in farming systems. A French case-
study." In Book of Abstracts of the 62nd Annual Meeting of the European Federation
of Animal Science, Stavanger, Norway, vol. 17, p. 377. 2011.
Taffesse AS, Dorosh PA, Asrat S. Crop production in Ethiopia: Regional patterns and trends.
International Food Policy Research Institute (IFPRI), 2011.
40
Tittonell P, Muriuki A, Shepherd KD, Mugendi D, Kaizzi K, Okeyo J, et al. The diversity of
rural livelihoods and their influence on soil fertility in agricultural systems of East
Africa–A typology of smallholder farms. Agricultural systems. 2010; 103(2):83-97.
Tittonell P. “Farm typologies and resilience: The diversity of livelihood strategies seen as
alternative system states.” 2013.
Tittonell, Pablo. "Livelihood strategies, resilience and transformability in African agro-
ecosystems." Agricultural Systems 126 (2014): 3-14.
USAID. 2005. Ethiopia SNNPR follow-on to regional livelihoods baseline study.
http://pdf.usaid.gov/pdf_docs/pnadj866.pdf
Wondo Gent district office of agriculture, 2013.
CIMMYT. Meeting the challenges of global climate change and food security through
innovative maize research. Proceedings of the National Maize Workshop of Ethiopia,
3; Addis Ababa, Ethiopia; 18-20 April, 2011 -. 2012. Worku, M.; Twumasi Afriyie,
S.; Wolde, L.; Tadesse, B.; Demisie, G.; Bogale, G.; Wegary, D.; Prasanna, B.M.. : vi,
290 pags. Mexico, DF (Mexico). CIMMYT.
World fact book. (2014).
http://www.theodora.com/wfbcurrent/ethiopia/ethiopia_economy.html
Wubne, Mulatu. (1991). "Agriculture" (and subsections). A Country Study: Ethiopia (Thomas
P. Ofcansky and LaVerle Berry, Eds.) Library of Congress Federal Research Division.
http://en.wikipedia.org/wiki/Agriculture_in_Ethiopia
Zerihun Gudeta. How Successful The Agricultural Development Led Industrialization
Strategy (ADLI) Will Be Leaving The Existing Land Holding System Intact – A
Major Constraints For The Realization of ADLI’s Targets? Vol 1, No 1 (December
2009) - Inaugural Issue: pp (19-35).

42
Appendixs
Appendix 1: Average farmland holdings by landscape since 1970’s
Districts Prior to 1974 1975-1991 2014
Wondo Genet 0.35 0.51 0.66
Tula 0.54 0.97 0.87
Hawassa Zuria 0.15 0.85 0.91
Average 0.33 0.78 0.82
Source: Life history interview, 2014
Appendix2: Average dominant crop area by landscape since 1970’s
Maize
pre-
1974
Maize
1975-
1991
Maize
post
1991
Enset
pre-
1974
Enset
1975-
1991
Enset
post
1991
Khat
pre-
1974
Khat
1975-
1991
Khat
post
1991
Coffee
pre-
1974
Coffee
1975-
1991
Coffee
post
1991
Chili
pepper
1975-
1991
Chili
pepper
post
1991
Potato
1975-
1991
Potato
post
1991
Sweet
potato
post
1991
Hawassa
Zuria
0.13 0.71 0.60 0.02 0.08 0.19 0.00 0.02 0.02 0.00 0.00 0.00 0.18 0.08 0.25 0.06 0.07
Tula 0.35 0.62 0.39 0.13 0.20 0.21 0.04 0.10 0.13 0.02 0.03 0.01 0.25 0.25
Wondo
Genet
0.19 0.29 0.15 0.13 0.14 0.16 0.02 0.07 0.18 0.00 0.00 0.01
Average 0.21 0.56 0.40 0.09 0.14 0.19 0.02 0.06 0.10 0.01 0.01 0.01 0.20 0.08 0.25 0.06 0.12
Source: Life history interview, 2014

43
Appendix 3: Principal component analysis summary
Comp1 Comp2 Comp3 Comp4 Comp5
Eigenvalues 3.02 1.84 1.09 0.99 0.88
Projected
inertia (%) 30.23 18.45 10.92 9.9 8.8
Cumulative
projected inertia
(%)
30.22 48.67 59.59 69.53 78.35
Component
loadings
Comp1 Comp2 Comp3 Comp4 Comp5
Age -0.28 0.50 0.64 0.04 0.29
Fams -0.56 0.36 0.27 0.45 -0.28
Pror -0.33 -0.72 0.34 -0.17 -0.18
Food -0.77 -0.11 -0.15 0.01 0.12
Lsck -0.63 0.02 -0.35 0.18 -0.55
Land -0.89 -0.11 -0.01 -0.11 0.09
Enset -0.75 -0.08 0.15 -0.11 0.22
Khat -0.39 0.56 -0.53 -0.21 0.33
Markt -0.16 -0.69 -0.09 -0.11 0.23
Road -0.06 0.36 0.16 -0.80 -0.39
Appendix 4: Informal discussion checklist
Target group Tool Objectives Checklist
Elderly farmers Informal
discussion
Obtain overview
information on
farming systems in
the area
- How do you explain farming practice
in this area
- What the environment looks like over
a time
Determine the
starting point of
trajectory analysis
- Did you observe any changes in
farming system
- When did change observed
- How did you explain regime change
- How did you recall regime change
and access to resource
Appendix 5: Focus group discussion checklist
Target group Tool Objectives Checklist
Selected key
informants
Participatory mapping Perception on
changes - Land use/ crop type
- Forest & grazing area
- Degraded area
- Main roads
- School, health & farmers
training centres, religious

44
place
Timeline recording Timelines of events - The most historical events
- Bad weather
- Regime change
- Access to resource or
technologies
Self-categorization
criteria identification
Farm typology - Diversity between farm
households
- Criteria used to categories
into groups
- Types of farms/farmers
Appendix 6: Creiteria used to categorise farms into typologies.
Farms Name of respondent District Kebele (PA) Livesto
ck
land Month of
food self
sufficency
Crop
diversit
y
1 Samiro Tifa Tula Tulo 7 1 12 5
2 Manitu Meligano Tula Tulo 4 0.5 10 4
3 Shuramo Holra Tula Tulo 2 0.5 10 3
4 Mariame Wageso Tula Tula 1 0.38 2 3
1 Hirpho Samago Tula Finchawa 2 2.5 12 5
2 Tomas Oyic Tula
Finchawa 12 1 12 5
3 Tefera lema Tula
Finchawa 5 0.91 10 5
4 Markose Shibery Tula
Finchawa 0 0.26 5 3
1 Uburo Mersa Tula Alamura 13 1.03 12 4
2 Philipose Daleno Tula Alamura 7 1 9 4
3 Erpto Efamo Tula Alamura 4 0.88 6 3
4 Betac shotora Tula Alamura 0 0.27 1 2
1 Womitu Fulasa H/Zuria Kajma 3 1 12 4
2 Alemaz Earimias H/Zuria Kajma 3 0.75 11 4
3 Bilbile Biliso H/Zuria Kajma 3 0.19 10 3
4 Eyasu Ayula H/Zuria Kajma 0 0.64 6 2
1 Adote Agiso H/Zuria Dore bafana 3 1.7 12 3
2 Tese Arba H/Zuria Dore bafana 1 1 9 1
3 Kajela Kasamo H/Zuria Dorie bafana 1 0.43 10 3
4 Yonamsse Aberm H/Zuria Dore bafana 2 0.25 4 1
1 Ergamo Etemo H/Zuria Gallo argisa 19 2.5 12 3
2 Mermera Letemo H/Zuria Gallo argisa 6 1 5 2
3 Barsamo Banata H/Zuria Gallo argisa 5 0.7 8 2
4 Walena Hona H/Zuria Gallo argisa 2 0.5 6 1
1 Shakure kitessa H/Zuria Galalcha 14 1.7 12 3

45
2 Mengesha H/Zuria Galalcha 6 1.75 11 4
3 Esayas huriso H/Zuria Galalcha 3 0.63 10 2
4 Yoseph Alemu H/Zuria Galalcha 2 0.5 7 2
1 Nasie Safa W/ Genet Edo 7 1.31 2 3
2 Mentewad Bezunhe W/ Genet Edo 1 0.75 10 3
3 Bekele Shokota W/ Genet Edo 2 0.12 0 2
4 Kadir Bute W/ Genet Edo 0 0.02 0 2
1 Welaso Sedamo W/ Genet Aruma 2 0.8 12 3
2 Eshetu Gobaro W/ Genet Aruma 2 0.5 6 3
3 Wako Betiso W/ Genet Aruma 1 0.27 1 3
4 Bisru Gobano W/ Genet Aruma 2 0.11 0 2
1 Mataye Mersa W/ Genet Yubo 12 1 10 4
2 Wako lendamo W/ Genet Yubo 5 1 4 4
3 Tariku Ledamo W/ Genet Yubo 6 0.5 6 3
4 Samuel Futesa W/ Genet Yubo 0 0.19 3 3
Appendix 7: Semi-structured retrospective questionnaires for life history interview
Name of enumerator____________________
1. General information
Date (GC):_________ District: _________Kebele: _______ Farm code: _______
1. What is your name? ___________________________________
2. What is your date of birth? __________________________________
3. Where were you born ________or when did you settle on this area? ____________
4. Educational level: 1. none 2. Elementary 3. Primary 4. Secondary 5. Post-secondary
5. Number of family members when start farming ____________and currently ______
6. What are the sources of income to your family over a time? Sources of income Before 1974 1974-1991 After 1991 Comment
Crop farming
Livestock rearing
Crop-livestock production
Non-farm income
Other
7. Is there any family member working outside the farm at the start of farming and currently
1. Yes 2. No
8. If yes, reason to work outside the farm 1. __________________________________
2. ___________________________________3. _______________________________
10. If no, why? ____________________________________________________________
9. Who will involve in non-farm activities? ________________________
10. What are the non-farm activities?
Activities At the start of Currently Season of work Use of

46
farming Off
season
Active
production
period
When
crop fail
income
from it
Casual labour
Small business (own shop)
Trading
Employment (pension)
Others
2. Farming system
11. What are the challenges to agricultural production over a time?
Period Land
shortage
Soil
fertility
Water
shortage
Lack
of
inputs
Labour
shortage
Pests &
disease (stem
borer)
Feed for
livestock
Weather
condition
change
Pre 1974
1974-1991
Post 1991
12. What were the consequences of those challenges?
_______________________________________________________________________
_______________________________________________________________________
_______________________________________________________________________
13. Measures taken to manage the difficulties
_______________________________________________________________________
______________________________________________________________________
3. Crop production
14. What are the dominant crops on your farm? Crops Pre
1974
1974-
1991
Post
1991
Increased
production?
Y/N
How, e.g. area
share, input
use
Use
priority
C/F
Remarks
Enset
Maize
Haricot bean
Other cereals
Potato
Sweet potato
Chilly paper
Coffee
Khat
Pin appeal
Sugarcane
Other fruits
Carrots
Cabbages
Tobacco
15. What limited you to diversify crops in different time?
Limiting factors At the start of farming Currently Comment
Market access
Land shortage
Access to inputs & credit
Access to extension service

47
Lack of irrigation
Disease, insect-pest attack
Policy limitations
16. What allowed you to diversify your crops?
Enabling factors At the start of farming Currently Comment
Market access
Extension service
Inputs & credit
Access to irrigation
Land availability
Policy
17. How is the productivity of dominant crops over a time?
Types crop Productivity per ha in
pervious time
Crop productivity
currently
Comment
18. Looking back over your farming life is there any difficult periods that stand out? 1. Yes
2. No When and what it was? _______________________________
19. How did you manage the difficulties?
_______________________________________________________________________
______________________________________________________________________
4. Livestock production
20. Do you have livestock? 1. Yes 2. No
21. Types & number of livestock Period Cow Oxen Sheep Goat Equines Chicken
This year Local
Improved
30 years
ago
Local
Improved
22. Trend in number of livestock’s? 1. Decreasing 2. Increasing
23. Reason if increasing?
________________________________________________________
24. Reason if decreasing?
_______________________________________________________
5. Land use
25. Total area of land owed at the start of farming_________ and currently_________
26. What is your land use pattern over a time (in local unit)
Land allotted Pre 1974 1974-1991 Post 1991 Change Remarks
Maize
Haricot bean
Enset
Khat
Coffee

48
Sweet potato
Potato
Vegetables
Fruit
Pasture
Forest
Marshy area
27. Trend in arable land holding/HH 1. Decreasing 2. Increasing
28. Reason if the trend in arable land holding is decreasing: 1st ________________
2nd
_________________________________ 3rd
________________________
29. Which crop is your preference with decreased farm size? __________________why?
30. Reason if the trend in land holding is increasing: 1st ______________________
2nd
____________________________ 3rd
__________________________
31. Which crop is your preference with increased land size? ___________________why?
32. Do you have access to irrigation water? 1. Yes 2. No If yes, since when? ______
33. If yes what type of source 1.Motor pump 2. Water point 3. River 4. Catchment
34. Is there any change in type or number of crops you have been cultivating as a result of
access to irrigation water?
_______________________________________________________________________
__________________________________________________________________
5. Institution
35. How would you describe your access to agricultural resource, use and management in
different time?
__________________________________________________________________
36. Do you have access to extension services? 1. Yes 2. No If yes, since when? _____
37. Do you have access to agricultural inputs? 1. Yes 2. No if yes, since when? _______
38. If yes, what are the common inputs you have been using?
_______________________________________________________________________
__________________________________________________________________
39. What are the prices of agricultural inputs over time? Period Types of input Amounts of
inputs used
Price of input (birr/100kg)
Previous Currently
40. What are the market prices of agricultural produce over time? Period Types of produce Amounts of
produce sold
Market price of produce
(birr/100kg)
Previous Currently
41. Is there any change in access to agricultural inputs over a time?
__________________________________________________________________
42. Do you have access to credit service? 1. Yes 2. No
49
43. If yes, are you using this service? 1. Yes 2. No If yes, since when? ___
44. Are there any cooperatives in your area? 1. Yes 2.No If yes, since when? ____
45. Are you a member of any cooperatives? 1. Yes 2.No If yes, since when? ____
46. What are the services provided by the cooperatives?
_______________________________________________________________________
_________________________________________________________________
47. Are you involved in any form of local organization in the community? 1. Yes 2. No
If yes, what are the benefits of this organization to your crop production?
__________________________________________________________________________
_________________________________________________________________
48. Distance to nearby market at the start of farming________ currently __________km?
49. Distance from high way at the start of farming________ currently __________km?
50. Transportation access over time_____________________________________________
General comments
_____________________________________________________________________________
__________________________________________________________________

50
: Some pictures Appendix 8Mapping exercise in Tula Mapping exercise in Tula
FGD in Hawassa Zuria FGD in Wondo Genet
Timeline recording in Tula Timeline recording in Wondo Genet

51
Khat expansion in Wondo Genet Khat expansion in Tula
Enset expansion in Tula Maize & haricot bean intercropped with enset in Wondo
Maize and potato based annual crop production in Hawassa Zuria

52
Sugarcane market in Wondo Genet Khat coffee-enset home garden in Tula
Feed shortage and enset based fodder source in Wondo & Tula