Analysing different technology pathways for the pulp...
124
THESIS FOR THE DEGREE OF DOCTOR OF PHILOSOPHY Analysing different technology pathways for the pulp and paper industry in a European energy systems perspective JOHANNA JÖNSSON Heat and Power Technology Department of Energy and Environment CHALMERS UNIVERSITY OF TECHNOLOGY Göteborg, Sweden 2011
Transcript of Analysing different technology pathways for the pulp...
THESIS FOR THE DEGREE OF DOCTOR OF PHILOSOPHY
Analysing different technology pathways for the
pulp and paper industry in a European energy
systems perspective
JOHANNA JÖNSSON
Heat and Power Technology
Department of Energy and Environment
CHALMERS UNIVERSITY OF TECHNOLOGY
Göteborg, Sweden 2011
ii
Analysing different technology pathways for the pulp and paper industry in a European
energy systems perspective
JOHANNA JÖNSSON
ISBN 978-91-7385-625-6
© Johanna Jönsson, 2011
Doktorsavhandlingar vid Chalmers tekniska högskola
Ny serie nr 3306
ISSN 0346 - 718X
Publication 2011:2
Heat and Power Technology
Department of Energy and Environment
Chalmers University of Technology, Göteborg
ISSN 1404-7098
Chalmers University of Technology
SE-412 96 Göteborg
Sweden
Telephone + 46(0)31-772 1000
Printed by Chalmers Reproservice
Göteborg, Sweden, 2011
iii
This thesis is based on work conducted within the interdisciplinary graduate school Energy Systems. The national Energy Systems Programme aims at creating competence in solving complex energy problems by combining technical and social sciences. The research programme analyses processes for the conversion, transmission and utilisation of energy, combined together in order to fulfil specific needs.
The research groups that participate in the Energy Systems Programme are the Department of Engineering Sciences at Uppsala University, the Division of Energy Systems at Linköping Institute of Technology, the Department of Technology and Social Change at Linköping University, the Division of Heat and Power Technology at Chalmers University of Technology in Göteborg as well as the Division of Energy Processes at the Royal Institute of Technology in Stockholm.
www.liu.se/energi

iv
v
Analysing different technology pathways for the pulp and paper industry in a European
energy systems perspective
JOHANNA JÖNSSON
Heat and Power Technology
Department of Energy and Environment
Chalmers University of Technology
ABSTRACT
For the pulp and paper industry (PPI), earlier research has shown that there are many
technology pathways, proven and new, available for improvement of energy efficiency
and additional sales of (new) products. Some pathways can only be implemented in
kraft mills, e.g. black liquor gasification (BLG), but some can be implemented industry-
wide, e.g. carbon capture and storage (CCS). From a future perspective it is not clear
which pathway is the most profitable one or which pathway gives the lowest emissions
of CO2 due to uncertainties in both the future value of different products and the future
development of energy infrastructure. This can lead to decision anxiety, both for the PPI
regarding the choice of pathways and for decision-makers creating new policy schemes.
The overall aim of this thesis is to analyse six technology pathways for the European
PPI: increased electricity production, export of bark, extraction of lignin, CCS, BLG
and export of heat for district heating purposes. To elucidate the potential for, and
effects of, implementation of these pathways, three themes of research questions are
addressed:
1. General integration opportunities in different types of existing mills.
2. Economic performance and global CO2 emissions assuming different future
developments of the European energy market.
3. Factors influencing the potential for industry-wide implementation.
The results show that for kraft pulp mills, proven pathways, such as increased electricity
production and district heat production, are economically robust, i.e. they are profitable
for varying energy market conditions. The new and emerging technology pathways
studied, CCS, BLG and lignin extraction, hold a larger potential for reduction of global
CO2 emissions, but their economic performance is more dependent on the development
of the energy market. Further, the thesis shows how earlier, detailed research can be
lifted to a higher system level in order to be put in context and to answer research
questions on a more aggregated industry level. The thesis also shows that improving the
availability (and accuracy) of public data and statistics is a key factor if good industry
level analyses are to be performed.
Keywords: pulp and paper industry, kraft pulp mill, biorefinery, technology pathways,
global CO2 emission, energy market scenarios

vi

vii
To my parents

viii

ix
Once you’ve gone tech, you ain’t ever going back – Robyn, Fembot
Ring the bells that still can ring Forget your perfect offering
There is a crack in everything That's how the light gets in.
– Leonard Cohen, Anthem
x
List of appended papers
This thesis is based on the papers listed below, referred to by Roman numerals in the
text:
I. Svensson, I.-L., Jönsson, J., Berntsson, T., Moshfegh, B., 2008. Excess heat
from kraft pulp mills: Trade-offs between internal and external use in the case of
Sweden – Part 1: Methodology. Energy Policy 36(11): 4178-4185.
II. Jönsson, J., Svensson, I.-L., Berntsson, T., Moshfegh, B., 2008. Excess heat
from kraft pulp mills: Trade-offs between internal and external use in the case of
Sweden – Part 2: Results for future energy market scenarios. Energy Policy
36(11): 4186-4197.
III. Jönsson, J., Algehed, J., 2008. Economic trade-offs between internal and
external use of excess heat from kraft pulp mills in Sweden. Proceedings of the
21st International Conference of Efficiency, Cost, Optimization, Simulation and
Environmental Impact of Energy Systems, ECOS, Krakow, Poland, 24-27 June
2008, pp. 965-972.
IV. Jönsson, J., Algehed, J., 2009. A systematic approach for assessing potentials for
energy efficiency at chemical pulp mills. Proceedings of the 22nd
International
Conference of Efficiency, Cost, Optimization, Simulation and Environmental
Impact of Energy Systems, ECOS, 2009, Foz do Iguaçu, Paraná, Brazil, August
31 - September 3, pp. 1559-1568.
V. Jönsson, J., Algehed, J., 2010. Pathways to a sustainable European kraft pulp
industry: Trade-offs between economy and CO2 emissions for different
technologies and system solutions. Applied Thermal Engineering 30(16): 2315-
2325.
VI. Jönsson, J., Ruohonen, P., Michel, G., Berntsson, T., 2011. The potential for
steam savings and implementation of different biorefinery concepts in
Scandinavian integrated TMP and paper mills. Applied Thermal Engineering
31(13): 2107-2114.
VII. Jönsson, J., Pettersson, K., Berntsson, T., Harvey, S. Comparison of options for
utilization of a potential steam surplus at kraft pulp mills –Economic
performance and CO2 emissions. Submitted to International Journal of Energy
Research.
VIII. Jönsson, J., Berntsson, T. Analysing the Potential for implementation of CCS
within the European Pulp and Paper Industry. Submitted to Energy
IX. Jönsson, J., Pettersson, K., Berntsson, T., Harvey, S. Comparison of options for
debottlenecking the recovery boiler at kraft pulp mills – Economic performance
and CO2 emissions. Manuscript for the 25th
International Conference of
Efficiency, Cost, Optimization, Simulation and Environmental Impact of Energy
Systems, ECOS, 2012.
xi
Co-authorship statement
Jönsson is the main author of Papers III-V and VIII. Papers I and II are a joint effort by
Jönsson and Svensson (Linköping University of Technology, Sweden). Jönsson was
responsible for the input data and calculations related to the pulp mill whereas Svensson
was responsible for the input data and calculations for the district heating system. The
system modelling and optimization in the energy system modelling tool reMIND was a
joint effort by Jönsson and Svensson. Paper VI is a joint effort by Jönsson and
Ruohonen (Aalto University, Finland) based partly on the master thesis work performed
by Michel (Chalmers University of Technology, Sweden), supervised by Jönsson and
Ruohonen. Ruohonen was responsible for the supervision of the modelling whereas
Jönsson was responsible for the supervision of the data gathering and analysis of the
results. Papers VII and IX are a joint effort by Jönsson and Pettersson (Chalmers
University of Technology) where Pettersson was responsible for the calculations
regarding black liquor gasification with downstream production of electricity and motor
fuels whereas Jönsson conducted the system modelling and optimization using the
reMIND tool.
Professor Thore Berntsson supervised the work for Papers I-II (together with Professor
Bahram Moshfegh) and Papers VI-IX (Papers VII and IX were co-supervised by
Professor Simon Harvey). Jessica Algehed, PhD, supervised the work for Papers III-V.
Papers based on the same work but not included
Jönsson, J., Algehed, J., 2009. Pathways to a sustainable European pulp and paper
industry: Trade-offs between different technologies and system solutions for kraft pulp
mills, Chemical Engineering Transactions 18, pp. 917-922. (Early version of paper V)
Jönsson, J., Ruohonen, P., Michel, G., Berntsson, T., 2010. Increased thermal efficiency
in Scandinavian integrated TMP and paper mills – Analysing the potential for steam
savings using the Heat Load Model for Pulp and Paper. Chemical Engineering
Transactions 21, pp. 535-540. (Early version of paper VI)
Jönsson, J., Berntsson, T., 2010. Analysing the potential for CSS within the European
pulp and paper industry. Proceedings of the 23th
International Conference of Efficiency,
Cost, Optimization, Simulation and Environmental Impact of Energy Systems, ECOS,
2010, Lausanne, Switzerland, June 14-17, pp. 676-683. (Early version of paper VIII)
Other work by the author not included
Jönsson, J., Ottosson, M., Svensson, I.-L., 2007. Överskottsvärme från kemiska
massabruk – En socioteknisk analys av interna och externa användningspotentialer.
Arbetsnotat Nr 38, Program Energisystem, Linköping, Sweden. (In Swedish)
xii
Svensson, I.-L., Ottosson, M., Jönsson, J., Moshfegh, B., Anshelm, J., Berntsson, T.,
2009. Socio-technical aspects of potential future use of excess heat from kraft pulp
mills. Proceedings of the 22nd
International Conference of Efficiency, Cost,
Optimization, Simulation and Environmental Impact of Energy Systems, ECOS, 2009,
Foz do Iguaçu, Paraná, Brazil, August 31 - September 3, pp. 995-1004.
Algehed, J., Wirsenius, S., Jönsson, J., 2009. Modelling energy efficiency and carbon
dioxide emissions in energy-intensive industry under stringent CO2 policies:
Comparison of top-down and bottom-up approaches and evaluation of usefulness to
policy makers. Proceedings of the ECEEE 2009 summer study, La Colle sur Loup,
France, June 1-6, pp. 1181-1191.
Berntsson, T., Jönsson, J., 2010. Towards a sustainable European energy system – The
role of the pulp and paper industry. Chemical Engineering Transactions 21, pp. 529-
534.
xiii
Table of Contents 1 Introduction 1
1.1 Background 1
1.2 Aim 3
1.2.1 Research themes and research questions 4
1.3 List and short summary of appended papers 5
1.4 Short comments to facilitate the reading 7
2 Overview of key energy system characteristics for the European
PPI 8
3 Scope, delimitations and definitions 12
4 Main concepts and related work 17
4.1 Process integration and potential for energy efficiency within the pulp
and paper industry 17
4.2 Selected technology pathways 18
4.2.1 Technology pathways based on traditional products 19
4.2.2 Technology pathways producing new, high-value products 21
4.3 Modelling of the pulp and paper industry on different system levels 24
4.3.1 Mill level 25
4.3.2 Industry level 25
4.4 Evaluation of the potential for implementation of new technologies –
geographical and infrastructural conditions 26
5 Methods, tools and methodology 29
5.1 Fundamental assumptions 29
5.2 Approach for analysing the PPI on different system levels 31
5.2.1 Energy market scenarios 33
5.2.2 General economic assumptions 33
5.3 The energy system modelling tool reMIND 34
5.4 Process integration 36
5.4.1 Overview of the main concept of thermal process integration and pinch analysis 36
5.4.2 The Heat Load Model for Pulp and Paper 37
5.5 The methodological approach developed throughout this thesis work 38
6 Input data 41
6.1 Input data for mill-level analysis 41
6.1.1 Key data for the model mill depicting a typical Scandinavian kraft pulp mill 41
6.1.2 Data for the utility producing district heating studied in Papers I-III 42
6.1.3 Data for the existing and model kraft pulp mills studied in Paper IV 43
6.1.4 Data for the existing TMP mills studied 43
6.1.5 Investment costs and data for the technology pathways studied 44
6.2 Input data for industry level analysis 45
6.3 Input data for analysis of the connections to surrounding system(s) 46
6.3.1 Data for other heavy industries and power plants 46
xiv
6.3.2 Data for the scenarios describing possible future energy markets 46
7 Results research theme 1: General integration opportunities in
existing mills 49
7.1 Kraft pulp mills – a methodological approach for estimating steam
balances 49
7.1.1 Summary of conclusions from this sub-chapter 51
7.2 The mechanical pulp and paper industry – potential for increased
thermal energy efficiency in TMP mills 52
7.2.1 Summary of conclusions from this sub-chapter 55
7.3 Addressing the research question in theme 1 56
8 Results research theme 2: Economic performance and global CO2
emissions assuming different future developments of the European
energy market 57
8.1 Trade-off between using kraft pulp mill excess heat internally in mill
processes and using it externally for production of district heating 57
8.1.1 Summary of conclusions from this sub-chapter 60
8.2 Pricing of excess heat 60
8.2.1 Summary of conclusions from this sub-chapter 61
8.3 Comparison of technology pathways for utilization of kraft pulp mill
excess heat 61
8.3.1 Summary of conclusions from this sub-chapter 69
8.4 Addressing the research question in theme 2 70
9 Results research theme 3: Factors influencing the potential for
industry-wide implementation 73
9.1 Carbon capture and storage 73
9.1.1 Summary of conclusions from this sub-chapter 78
9.2 Addressing the research question in theme 3 79
10 Discussion 80
10.1 Mill characteristics and mill-level input data 80
10.2 Assumptions, methods, tools and methodologies 80
10.2.1 Inherent limitations when using a bottom-up approach 81
10.2.2 Using the reMIND tool based on mixed-integer linear programming 81
10.2.3 Accuracy of the HLMPP 82
10.2.4 Using different versions of the ENPAC tool 82
10.3 Data availability and reliability of data for the industry-level analysis 82
11 Conclusions 85
12 Further work 89
13 Abbreviations 91
14 Acknowledgements 93
15 References 97

xv

Introduction
1
1 Introduction
This chapter gives a short background to the thesis work and presents the aim of the
thesis together with the research questions addressed. Lastly, the chapter provides an
overview of the appended papers.
1.1 Background
Today, the challenge of curbing global climate change is high on the agenda in many
countries. In Europe, the EU has defined the goal of achieving 20% reduction of
greenhouse gas emissions1, 20% share of renewable in the energy mix, and 20%
improvement of energy efficiency on a European level by the year 2020 (EC 2010).
Further, Sweden has set a national target to reach a reduction of emissions of
greenhouse gas emissions2 of 40% by the year 2020.
In Europe, the industrial sector is responsible for about 30% of the total energy use and
about 20% of the emissions of fossil CO23 (Eurostat 2009). The pulp and paper industry
(PPI) is the sixth largest industrial energy user in Europe and the single largest
industrial user of biomass, using approximately 102 TWh of electricity and 330 TWh of
thermal energy annually, out of which 55% originates from biomass, during 2009 (CEPI
2011). In Europe, roughly, the energy used in the PPI corresponds to 4% of the total
energy use and 14% of the industrial energy use (Eurostat 2009). In Sweden and
Finland, two of the main pulp and paper producers in Europe, the PPI stands for ~50%
of the industrial energy use (SEA 2010; SF 2011). As for other energy-intensive
industry sectors as well as the power and heat sector, the energy use, and thus on-site
emissions of CO2, in the PPI are associated with only a few geographical sites, i.e.
mills. Due to this fact, making changes in the energy system at only a limited amount of
mills can have significant impact on the European energy system as a whole and
consequently also on the emissions of CO2. It should be noted that within the energy-
intensive industry, the energy use is mainly related to the production processes rather
than the support processes and thus the process of changing the energy use demands
strategic decisions rather than operative decisions. For the European PPI, a large share
of the CO2 emissions are biogenic (~62%), and consequently if carbon capture and
1 Compared to the greenhouse gas emissions emitted in 1990.
2 To be reached by reductions in Sweden as well as by investments in other EU countries or by applying
flexible measures such as CDM.
3 This figure refers only to the actual on-site emissions and not the emissions related to e.g. electricity
imported from the grid or transport of raw materials and finished products, which are allocated to the
power and the transport sector respectively.
Johanna Jönsson
2
storage (CCS) is implemented in the PPI, the levels of CO2 in the atmosphere can be
further reduced in comparison to implementing CCS only for fossil-based emission
sources. Thus the PPI can play a significant role when striving to reach both European
climate targets and national climate goals in Sweden and Finland.
In the climate-conscious Europe of today, with increasing energy prices, the threat of
depletion of fossil fuels and the introduction of new policy instruments, not least for
reduction of greenhouse gas emissions, large changeovers are to be expected for the
energy systems within the European PPI in the near future. Already today, the PPI is
approaching a transitional situation – where it is no longer only producing pulp and/or
paper but also producing additional products which can increase both the mill
profitability and the overall mill energy efficiency – thereby transforming mills into so-
called biorefineries. These additional products can be electricity, district heating, wood
pellets, dried bark chemicals, materials, biofuels etc. Another alternative is to integrate
CCS, something which can be done also in combination with integration of other new
technologies such as black liquor gasification (BLG). The above-mentioned
technologies and system solutions, aiming at transforming a mill into different types of
biorefineries, are hereafter collectively denoted technology pathways.
For energy-efficient implementation of different technology pathways, it is an
advantage if the mill has a surplus of steam and/or heat which can be utilized for
thermal integration of the new biorefinery processes, or a heating demand at such a
temperature level so that it can be supplied with heat from the biorefinery processes.
Depending on the development of the energy markets, the implementation of different
technology pathways can also contribute to a reduction of the global CO2 emissions.
The potential for energy-efficient introduction of new technologies and production of
additional value-adding products depends both on mill-specific conditions, such as the
type of pulping process and potential for thermal integration, and on geographical
conditions, such as the proximity to other large industries and important energy
infrastructure (e.g. natural gas grids and/or district heating grids). Research and
development projects have identified potentials for energy efficiency and
implementation of specific biorefinery concepts within the pulp and paper industry.
However, most previous studies are either detailed – considering only mill-specific
conditions for one mill, not stating anything about the overall potential on a national or
European level – or very aggregated, not considering important mill-specific conditions.
Consequently, in order to make the fast-approaching transition of the European PPI as
smooth as possible from both an environmental and a business-competitiveness point of
view, the knowledge concerning techno-economic potentials within the field needs to
increase and new approaches, connecting the results from detailed studies to the actual
European PPI stock, are necessary.
None of the earlier performed, aggregated industry level studies includes technology
pathways which lead to new products. Instead, they mainly focus on increased energy
Introduction
3
efficiency and fuel switching. As mentioned above, on the other hand, many studies
regarding technical aspects of such pathways have been performed at mill level. These
studies, however, have not been extended to incorporate the whole industry and the
infrastructure level influencing the potential for large-scale implementation of the
individual pathways. Thus, the European PPI‟s progress towards energy-efficient
implementation of different technology pathways, and how these pathways will
influence the global CO2 emissions and the energy systems, on both mill and industry
level, need to be studied. This study aims at acting as a building block in filling this
research space by evaluating the potential for, and effect of, implementation of selected
technology pathways for utilisation of excess heat4 within the European PPI – as is
further description in the next section.
1.2 Aim
The overall aim of this thesis is to identify and analyse selected future technology
pathways for the European PPI which, for different assumptions regarding policy
instruments and the development of the energy market, will:
Strengthen the competitiveness of the pulp and paper industry
Reduce the global emissions of CO2
Interact with the expected development of the rest of the European energy
system in an efficient way.
In this thesis, the term „technology pathway‟ refers to combinations of technical
solutions, both well-tried and emerging, that have been proved to have a large technical,
economic and/or CO2 emissions reduction potential and are at least at pilot scale,
indicating a possible implementation within a near future. The pathways are strategic
and will, if implemented, have a significant effect on a mill‟s energy system. Examples
of pathways are production of the second generation of biofuels and CCS. The
pathways were selected based on their fulfilment of the following two criteria:
1. Identified as interesting from an economic and/or CO2 reduction potential point
of view
2. Enough technical and economic data available at the start of the thesis work
The focus is on thermal energy efficiency and thermal integration of selected pathways
based on the characteristics of different mills. Increasing the thermal energy efficiency
and implementing these pathways will alter the whole mill‟s energy balance, not only
the thermal energy balance, and these changes are evaluated using a European energy
systems perspective (for further descriptions see Chapter 3 on delimitations and Section
5.2 on the system levels studied). The selected technology pathways, their resulting
4 Here, the term excess heat refers to heat (in excess) at different temperature levels, ranging from
lukewarm water to steam.
Johanna Jönsson
4
energy balance changes, and how these changes are valued from both an economic and
CO2 emissions point of view, are further described in Chapter 3, Section 4.2 and Section
6.3.2. The analysis is made with an overall systems perspective with Europe as system
boundary but with input data based on earlier, detailed (mill level) research for the
individual technology pathways analysed, see Chapter 6; Input data.
1.2.1 Research themes and research questions
To elucidate the potential for, and effects of, implementation of selected technology
pathways within the PPI as stated in the aim, three themes of research questions are
addressed:
1. General integration opportunities in different types of existing mills. What
are the characteristics of the mills‟ existing energy systems and how do they
influence the potential for thermal integration of new processes? How large is
the potential for process steam savings for different types of mills? At what
temperature(s) can excess heat be made available? Are there ways to draw
general conclusions for different types of mills?
2. Economic performance and global CO2 emissions assuming different future
developments of the European energy market. How do assumptions
regarding different energy market parameters influence the economic
performance and CO2 emissions for the pathways? Are any of the studied
pathways “robust”5 given the uncertainty of the future energy market and
parameters such as policy instruments and investment costs?
3. Factors influencing the potential for industry-wide implementation. Which
process characteristics and external, geographical and infrastructural, factors
influence the potential for large-scale implementation of the pathways? In what
way do these characteristics and factors influence the potential?
The work performed in order to answer the research questions in theme 2 is based on
previous, detailed work regarding each individual technology and its characteristics.
Using this earlier research as a basis, together with the methodological developments
performed to answer research questions 1 and 3, the aim of this thesis can be reached.
The three themes and their research questions are addressed in Chapters 7, 8 and 9
respectively and the main conclusions are summarised in Chapter 11.
5 Here, the term robust is used to describe the state when a pathway shows a stable economic performance
and/or a stable reduction potential for global CO2 emissions for multiple changes of different parameters
such as the energy market prices.
Introduction
5
1.3 List and short summary of appended papers
This thesis is based on nine papers. A graphic overview of the papers is given in Fig. 1.
The figure shows that the papers address different issues and cover different parts of the
European pulp and paper industry. It can also be seen that the papers analyse the PPI on
different system levels. Papers I-III, V, VII and IX analyse a single kraft pulp mill based
on data from a model mill depicting a typical Scandinavian pulp mill. As an addition,
Papers IV, VI and VIII are based on data from existing European pulp and paper mills
and cover a broader spectrum of the industry. Below, the papers are presented in brief.
In Papers I-II, a kraft pulp mill and a utility (producing district heating) are modelled
within the same system boundary in order to analyse the competitiveness of using pulp
mill excess heat as district heating compared with other production techniques for
district heating and alternative utilization options for the excess heat. Paper I presents
the methodology used, and Paper II presents the results and shows how the
competitiveness of using excess heat as district heating depends on future energy
market conditions (energy market scenarios), the sizes of the district heating demand,
and the type of existing heat production.
Paper III uses the model from Papers I and II and expands the methodology to address
also the question of pricing of pulp mill excess heat. In the paper, supply and demand
curves are constructed which show the magnitude of excess heat that the mill and the
utility are willing to sell or buy (in MW) depending on the excess heat price (in
€/MWh). The analysis is made for four different scenarios concerning the future energy
market.
In Paper IV, a systematic approach for assessing a mill‟s steam balance, assuming only
a limited amount of data, is developed and applied to a case study. It is investigated
which energy-related data are publicly and/or easily accessible for the European kraft
pulp industry. Assuming this limited amount of data, a model is developed which
assesses the existing steam balance of a kraft pulp mill in terms of total steam
production and steam consumption at different pressure levels. As an example of how
the model can be used, a case study is made showing the potential for improved energy
efficiency through increased electricity production within the Swedish kraft pulp
industry.
Paper V investigates the annual net profit and global CO2 emissions for different
energy-related technology options for utilizing excess heat at a kraft pulp mill depicting
a typical Scandinavian mill. The methodology used is based on the methodology
presented in Papers I-III. The options studied are: Increased electricity production,
selling of bark, production of district heating, extraction of lignin and capturing of CO2.
The analysis is performed using four different scenarios for energy prices and emissions
on the future energy market.
Johanna Jönsson
6
In Paper VI, the potential for steam savings and temperature levels of excess heat are
identified for four Scandinavian thermo-mechanical (TMP) pulp and paper mills using
the Heat Load Model for Pulp and Paper (HLMPP). The results are compared with
similar results for two other TMP mills in order to draw some more general conclusions.
Based on the data for the six mills, an analysis is made regarding the relationship
between the steam consumption and temperature levels of excess heat and mill-specific
characteristics such as production rate and fresh warm water usage. Based on the
results, the potential for implementation of different biorefinery concepts at a TMP mill
is discussed.
Paper VII builds on the work presented in Paper V and compares selected technology
options for utilization of potential surplus steam at a kraft pulp mill depicting a typical
Scandinavian mill. The technology options studied include lignin extraction, electricity
production, capturing of CO2 and black liquor gasification with production of electricity
or dimethyl ether (DME). The methodology and model used are based on the work
presented in Paper V, and the technology options are compared with respect to annual
net profit and global CO2 emissions for four different scenarios concerning the future
energy market. The paper also includes a sensitivity analysis on different parameters.
Paper VIII presents an approach for analysing the potential for reduction of global CO2
emissions by introduction of selected technology pathways in the European pulp and
paper industry. The approach is based on bottom-up thinking whilst still estimating the
potential on a European level, considering both technical and geographical data for the
mills. The usefulness of the approach is exemplified by a case study of the potential for
reduction of global CO2 emissions by introduction of CCS within the European Pulp
and Paper industry.
Paper IX builds on the work presented in Paper VII and compares three selected
technology options for debottlenecking the recovery boiler and utilizing a potential
steam surplus at a kraft pulp mill depicting a typical Scandinavian mill. The technology
options compared are extraction of lignin, black liquor gasification (as a booster) and an
upgrading of the existing recovery boiler.

Introduction
7
Excellent knowledge
regarding the
processes within the
pulp and paper
industry
Ind
ustr
y M
ill
Energy market
scenarios
Process integration
at mill level
Implementation of
different technology
options for utilization
of excess heat,
technology pathways
(mill level)
Industry-wide
implementation of
different technology
pathways
Sco
pe
of is
su
es to
be
ad
resse
d w
he
n a
na
lysin
g e
ne
rgy-e
ffic
ien
t im
ple
me
nta
tio
n o
f (n
ew
)
tech
no
log
ies w
ith
in th
e (
pu
lp a
nd
pa
pe
r) in
du
str
y
Sco
pe
of th
e r
ese
arc
h in
pa
pe
rs I-V
III
Ma
in s
yste
m le
ve
l stu
die
d
Model
Methodology
and model
Methodology
and model
The papers are based
on data for a typical
Scandinavian kraft
pulp mill of today.
The papers are based on
data from existing
European pulp and paper
mills as well as models
depicting Scandinavian
kraft and TMP mills.
Main mill processes
Chemical (kraft) Mechanical Paper
Paper VI
Paper VIII
Paper IV
Papers I-III,
V, VII and IX
Paper
IV
Paper
VI
Paper
VIII
Papers
I and II
Paper
III
Paper
V
Paper
VII
Research theme 2
The paper is based on
data from existing
European pulp and paper
mills.
Paper
IXMethodology
and model
Research theme 1
Research theme 3
Figure 1. Positioning of the appended papers in relation to (1) the scope of issues to be addressed when
analysing energy-efficient implementation of (new) technologies within the PPI (left), (2) type of mill and
system level studied (middle), and (3) each other (right). The colouring shows the scope of the papers.
1.4 Short comments to facilitate the reading
This thesis uses a systems approach to address the questions stated in the three research
themes defined above. The systems approach and the system levels used are further
described in Section 5.2. Further, the work is based on the assumption that “biomass is a
limited resource” and also, when discussing CCS this thesis assumes that “all CO2 are
equal”. These two assumptions are further described and motivated in Section 5.1.
Chapter 13 presents all abbreviations used, and Chapter 3 presents the scope and
delimitation of the thesis together with a short description of some terms frequently
used in the text such as „utilization of excess heat‟. Chapter 2 gives a short presentation
of the European PPI and its key energy system characteristics.
Johanna Jönsson
8
2 Overview of key energy system
characteristics for the European PPI
This chapter briefly introduces the European PPI from an energy systems perspective.
The PPI is divided into three different sub-sectors, described and presented with respect
to their energy use and CO2 emissions. It is also described how the type of production
processes influences the potential for implementation of new technology pathways.
In this thesis, the European pulp and paper industry is defined as the mills located in the
countries that are included in the confederation of European paper industries, CEPI
(CEPI, 2008), i.e. the countries in Europe with the highest density of pulp and paper
industry. Relative to the world production, the 19 CEPI countries are responsible for
about 20% of the total pulp production and 24% of the total paper and board production,
producing 36 million tonnes of pulp and 89 million tonnes of paper and board in 2009
(CEPI 2011). Within CEPI, a majority of the pulp, >60%, is produced in Scandinavia,
mainly in Sweden and Finland, whereas the paper production is more evenly
geographically distributed although Germany, Sweden and Finland collectively are
responsible for ~48% (CEPI 2011). With respect to energy use, the PPI is the sixth
largest industrial energy user in Europe and the single largest industrial user of biomass,
using approximately 102 TWh of electricity and 330 TWh of thermal energy annually
(55% biomass) during 2009 (CEPI 2011). Relative to the total energy use in Europe, the
energy use within the PPI corresponds, roughly, to 4% of the total energy use and 14%
of the total industrial energy use (Eurostat 2009).
With respect to energy use and CO2 emissions the PPI can be divided into three sub-
sectors: chemical/kraft pulp6 (and paper) mills, mechanical pulp (and paper) mills, and
pure paper mills without any virgin pulp production. Depending on sub-sector, the
amount and type of energy sources and raw material used, and consequently the on-site
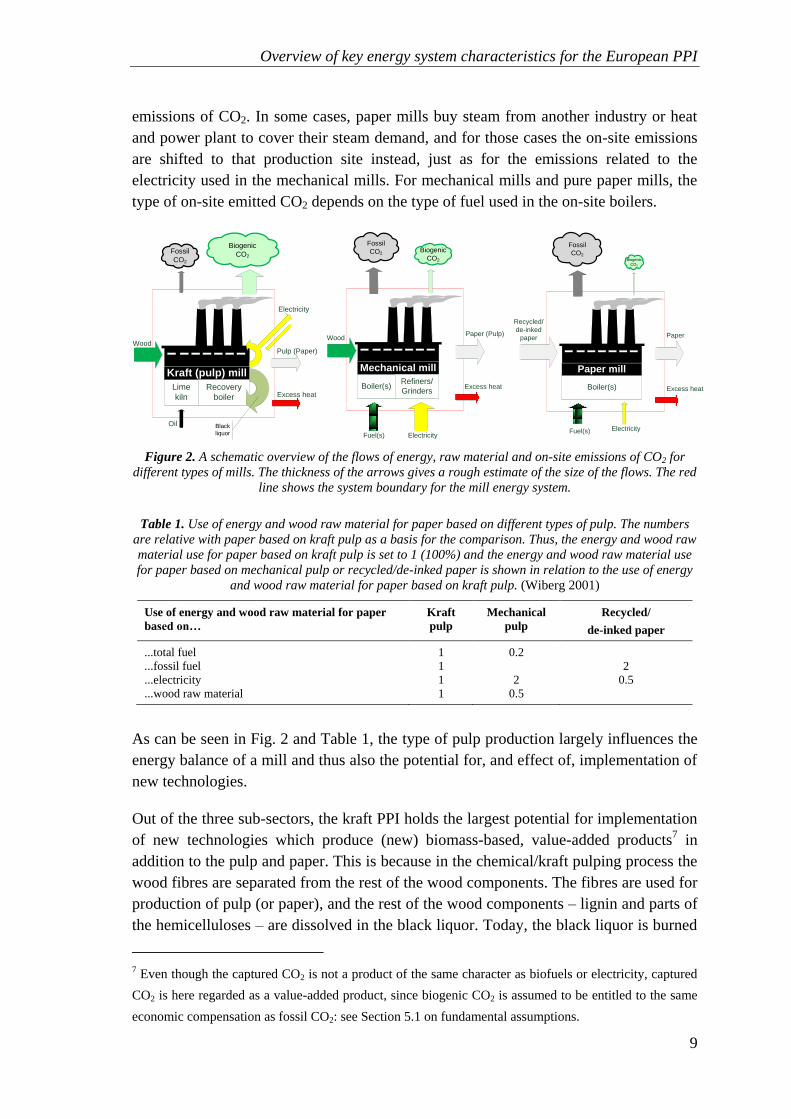
emissions of CO2, differ; see Fig. 2 and Table 1.
Considering CO2 emissions, generally, kraft mills have the largest on-site emissions out
of the three sub-sectors. These emissions are, however, mainly biogenic, originating
from the recovery boiler and (for an integrated kraft mill) the bark boiler. A mechanical
mill, using large amounts of electricity in the mechanical pulping process, has lower on-
site emissions of CO2 than a kraft mill of the same size. A paper mill using imported
kraft or mechanical pulp and/or de-inked paper has a lower energy demand than a
mechanical or kraft pulp and paper mill and, due to the lower energy use, lower on-site
6 The kraft (sulphate) process is not the only chemical pulping process. It is, however, by far the largest in
terms of production volume both within CEPI and in the world.
Overview of key energy system characteristics for the European PPI
9
emissions of CO2. In some cases, paper mills buy steam from another industry or heat
and power plant to cover their steam demand, and for those cases the on-site emissions
are shifted to that production site instead, just as for the emissions related to the
electricity used in the mechanical mills. For mechanical mills and pure paper mills, the
type of on-site emitted CO2 depends on the type of fuel used in the on-site boilers.
Lime
kiln
Biogenic
CO2
Kraft (pulp) mill
Fossil
CO2
Recovery
boiler
Black
liquor
Wood
Oil
Excess heat
Pulp (Paper)
Electricity
Boiler(s)
Biogenic
CO2
Mechanical mill
Fossil
CO2
Refiners/
Grinders
Wood
Excess heat
Paper (Pulp)
ElectricityFuel(s)
Boiler(s)
Biogenic
CO2
Paper mill
Fossil
CO2
Recycled/
de-inked
paper Paper
Excess heat
ElectricityFuel(s)
Figure 2. A schematic overview of the flows of energy, raw material and on-site emissions of CO2 for
different types of mills. The thickness of the arrows gives a rough estimate of the size of the flows. The red
line shows the system boundary for the mill energy system.
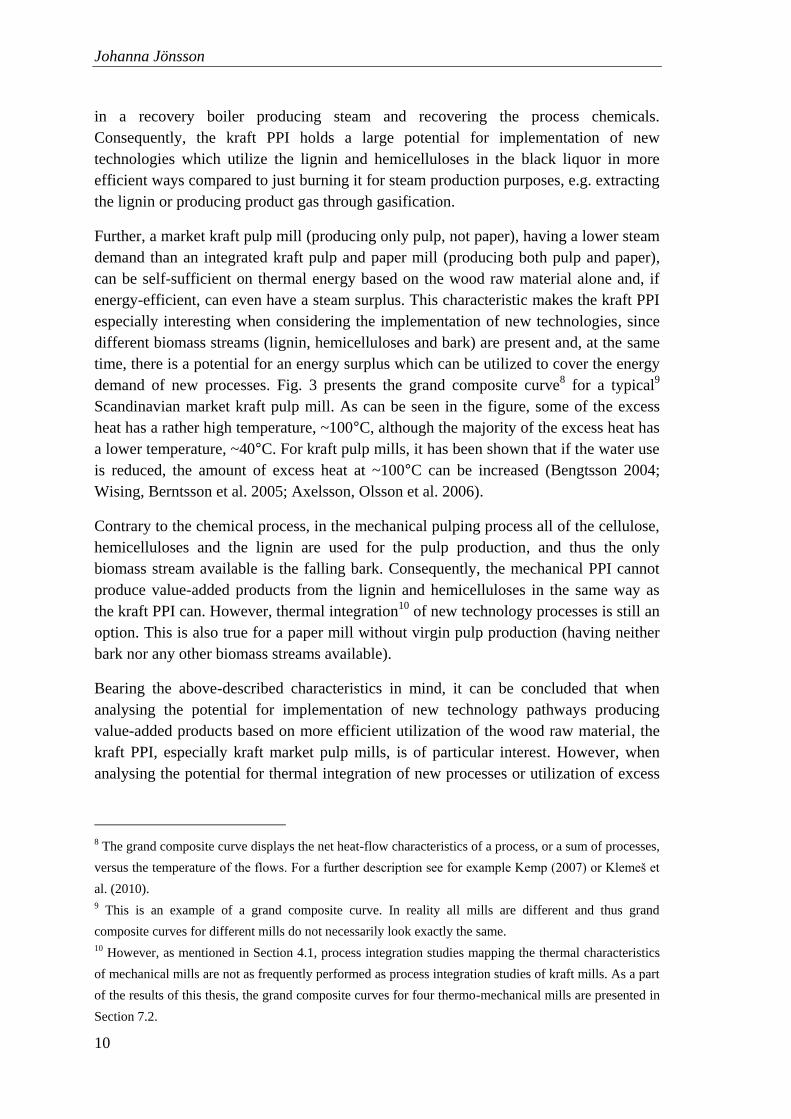
Table 1. Use of energy and wood raw material for paper based on different types of pulp. The numbers
are relative with paper based on kraft pulp as a basis for the comparison. Thus, the energy and wood raw
material use for paper based on kraft pulp is set to 1 (100%) and the energy and wood raw material use
for paper based on mechanical pulp or recycled/de-inked paper is shown in relation to the use of energy
and wood raw material for paper based on kraft pulp. (Wiberg 2001)
Use of energy and wood raw material for paper
based on…
Kraft
pulp
Mechanical
pulp
Recycled/
de-inked paper
...total fuel 1 0.2
...fossil fuel 1 2
...electricity 1 2 0.5
...wood raw material 1 0.5
As can be seen in Fig. 2 and Table 1, the type of pulp production largely influences the
energy balance of a mill and thus also the potential for, and effect of, implementation of
new technologies.
Out of the three sub-sectors, the kraft PPI holds the largest potential for implementation
of new technologies which produce (new) biomass-based, value-added products7 in
addition to the pulp and paper. This is because in the chemical/kraft pulping process the
wood fibres are separated from the rest of the wood components. The fibres are used for
production of pulp (or paper), and the rest of the wood components – lignin and parts of
the hemicelluloses – are dissolved in the black liquor. Today, the black liquor is burned
7 Even though the captured CO2 is not a product of the same character as biofuels or electricity, captured
CO2 is here regarded as a value-added product, since biogenic CO2 is assumed to be entitled to the same
economic compensation as fossil CO2: see Section 5.1 on fundamental assumptions.
Johanna Jönsson
10
in a recovery boiler producing steam and recovering the process chemicals.
Consequently, the kraft PPI holds a large potential for implementation of new
technologies which utilize the lignin and hemicelluloses in the black liquor in more
efficient ways compared to just burning it for steam production purposes, e.g. extracting
the lignin or producing product gas through gasification.
Further, a market kraft pulp mill (producing only pulp, not paper), having a lower steam
demand than an integrated kraft pulp and paper mill (producing both pulp and paper),
can be self-sufficient on thermal energy based on the wood raw material alone and, if
energy-efficient, can even have a steam surplus. This characteristic makes the kraft PPI
especially interesting when considering the implementation of new technologies, since
different biomass streams (lignin, hemicelluloses and bark) are present and, at the same
time, there is a potential for an energy surplus which can be utilized to cover the energy
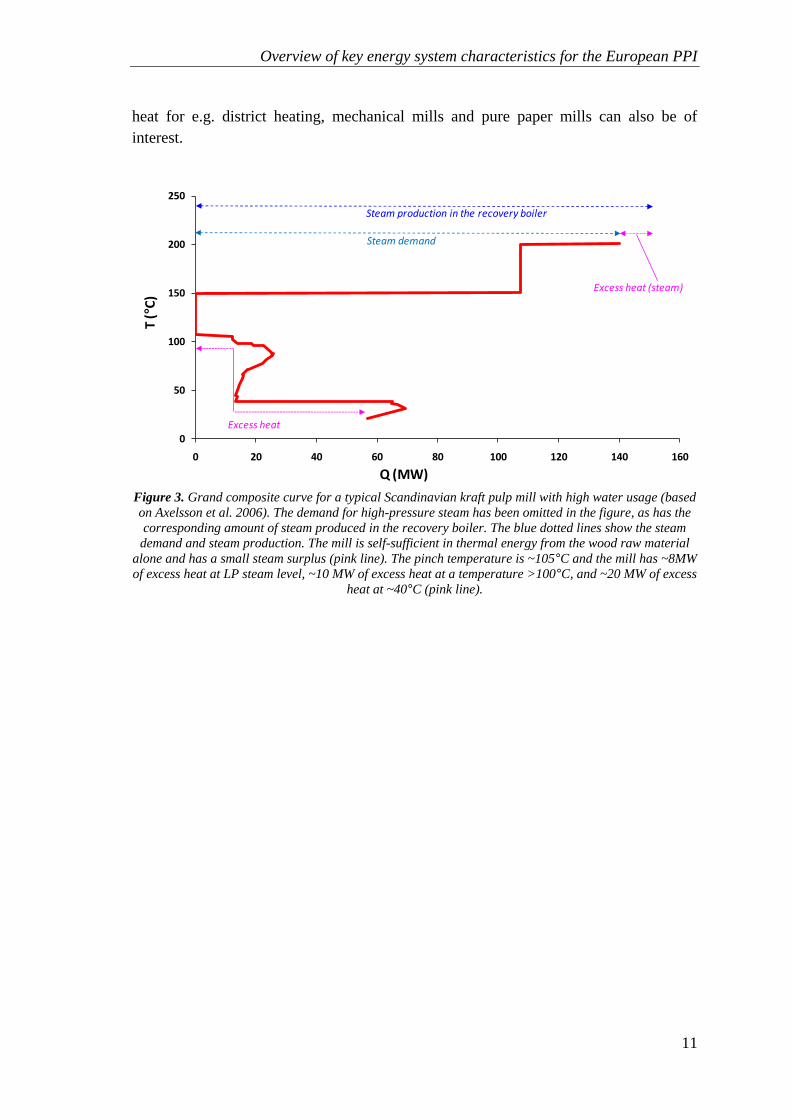
demand of new processes. Fig. 3 presents the grand composite curve8 for a typical
9
Scandinavian market kraft pulp mill. As can be seen in the figure, some of the excess
heat has a rather high temperature, ~100°C, although the majority of the excess heat has
a lower temperature, ~40°C. For kraft pulp mills, it has been shown that if the water use
is reduced, the amount of excess heat at ~100°C can be increased (Bengtsson 2004;
Wising, Berntsson et al. 2005; Axelsson, Olsson et al. 2006).
Contrary to the chemical process, in the mechanical pulping process all of the cellulose,
hemicelluloses and the lignin are used for the pulp production, and thus the only
biomass stream available is the falling bark. Consequently, the mechanical PPI cannot
produce value-added products from the lignin and hemicelluloses in the same way as
the kraft PPI can. However, thermal integration10
of new technology processes is still an
option. This is also true for a paper mill without virgin pulp production (having neither
bark nor any other biomass streams available). (Klemeš, Friedler et al. 2010)
Bearing the above-described characteristics in mind, it can be concluded that when
analysing the potential for implementation of new technology pathways producing
value-added products based on more efficient utilization of the wood raw material, the
kraft PPI, especially kraft market pulp mills, is of particular interest. However, when
analysing the potential for thermal integration of new processes or utilization of excess
8 The grand composite curve displays the net heat-flow characteristics of a process, or a sum of processes,
versus the temperature of the flows. For a further description see for example Kemp (2007) or Klemeš et
al. (2010).
9 This is an example of a grand composite curve. In reality all mills are different and thus grand
composite curves for different mills do not necessarily look exactly the same.
10 However, as mentioned in Section 4.1, process integration studies mapping the thermal characteristics
of mechanical mills are not as frequently performed as process integration studies of kraft mills. As a part
of the results of this thesis, the grand composite curves for four thermo-mechanical mills are presented in
Section 7.2.
Overview of key energy system characteristics for the European PPI
11
heat for e.g. district heating, mechanical mills and pure paper mills can also be of
interest.
0
50
100
150
200
250
0 20 40 60 80 100 120 140 160
T (°
C)
Q (MW)
Steam demand
Excess heat
Excess heat (steam)
Steam production in the recovery boiler
Figure 3. Grand composite curve for a typical Scandinavian kraft pulp mill with high water usage (based
on Axelsson et al. 2006). The demand for high-pressure steam has been omitted in the figure, as has the
corresponding amount of steam produced in the recovery boiler. The blue dotted lines show the steam
demand and steam production. The mill is self-sufficient in thermal energy from the wood raw material
alone and has a small steam surplus (pink line). The pinch temperature is ~105°C and the mill has ~8MW
of excess heat at LP steam level, ~10 MW of excess heat at a temperature >100°C, and ~20 MW of excess
heat at ~40°C (pink line).

Johanna Jönsson
12
Scope and delimitations
13
3 Scope, delimitations and definitions
This chapter briefly presents the delimitations for this thesis and the appended papers
on which it is based. Some frequently used terms are also presented and described.
Based on bottom-up models and thinking, this thesis performs energy systems analyses
of the European PPI on different system levels (for further description see Section 5.2).
As described in the previous section, the energy systems of different types of mills
differ significantly. In this thesis, thermal energy-efficiency measures which enable
energy-efficient implementation of selected technology pathways are studied.
Consequently, the kraft PPI, especially the kraft market pulp mills (having potential for
a steam surplus), is of particular interest. This is due to the large thermal flows in the
kraft PPI (compared to the mechanical and paper PPI, see Fig. 2), along with the fact
that a kraft mill, due to the lignin content in the black liquor, can implement a larger
variety of biorefinery concepts.
The European PPI is a large user of both thermal energy and electricity. However, as
stated above, the focus in this thesis is on thermal energy efficiency and implementation
of selected new concepts based on the thermal characteristics of different mills. Thus,
electrical energy efficiency and measures aiming at reducing the electricity
consumption – such as double disc refiners, pre-treatment of chips to ease refining, and
variable speed drives on pumps – are not within the scope of this thesis. Further,
increased energy efficiency in support processes such as space heating, ventilation and
compressed air systems has not been analysed. It should be noted, though, that systems
aspects regarding electricity use and production are included, such as combined heat
and power production, steam recovery from electricity use in the refiners, etc.
As for energy efficiency, the concept of biorefinery is by nature wider than the scope of
this thesis. Consequently, a limited number of technology pathways, leading the PPI
towards becoming biorefineries, have been studied. These technology pathways are:
1. Increased electricity production
2. Export of bark
3. Extraction of lignin
4. Carbon capture and storage11
(CCS)
5. Black liquor gasification (BLG)
6. Export of heat for district heating
11 CCS is sometimes not considered as a biorefinery technology. However, since CO2 can be a valuable
product it is a competing option for utilization of pulp mill excess heat which has the potential to
contribute to substantial reduction of CO2 emissions.
Johanna Jönsson
14
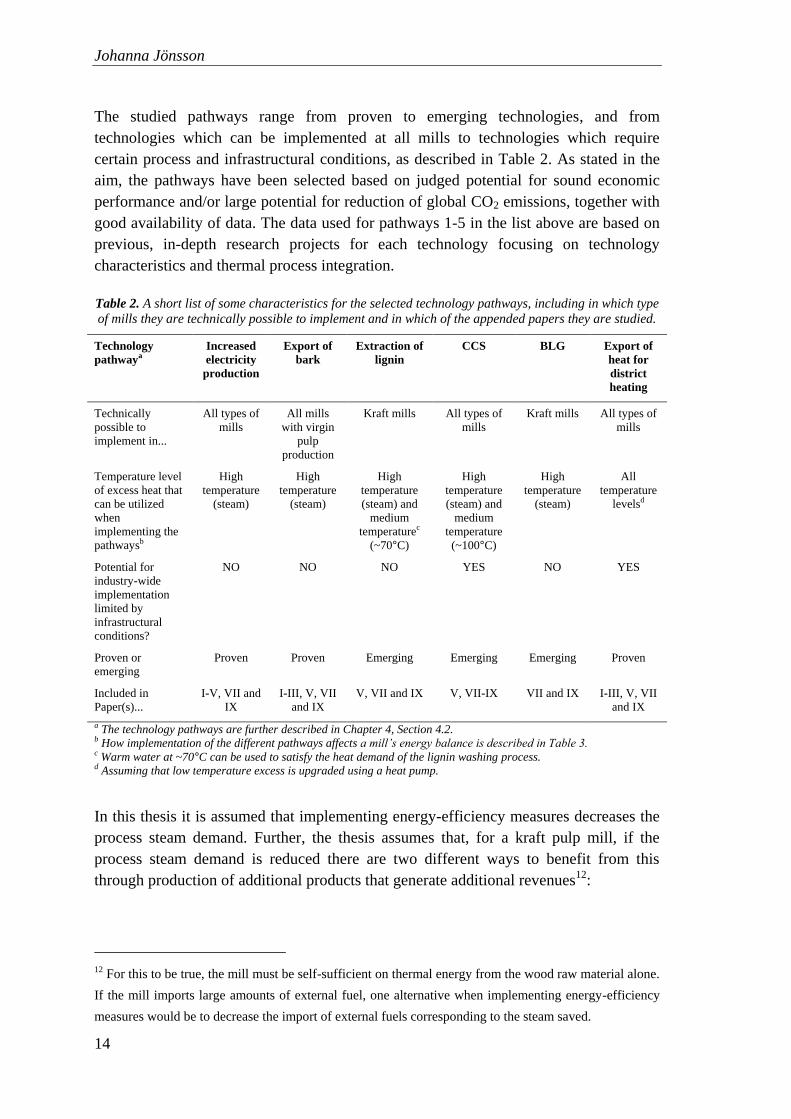
The studied pathways range from proven to emerging technologies, and from
technologies which can be implemented at all mills to technologies which require
certain process and infrastructural conditions, as described in Table 2. As stated in the
aim, the pathways have been selected based on judged potential for sound economic
performance and/or large potential for reduction of global CO2 emissions, together with
good availability of data. The data used for pathways 1-5 in the list above are based on
previous, in-depth research projects for each technology focusing on technology
characteristics and thermal process integration.
Table 2. A short list of some characteristics for the selected technology pathways, including in which type
of mills they are technically possible to implement and in which of the appended papers they are studied.
Technology
pathwaya
Increased
electricity
production
Export of
bark
Extraction of
lignin
CCS BLG Export of
heat for
district
heating
Technically
possible to
implement in...
All types of
mills
All mills
with virgin
pulp
production
Kraft mills All types of
mills
Kraft mills All types of
mills
Temperature level
of excess heat that
can be utilized
when
implementing the
pathwaysb
High
temperature
(steam)
High
temperature
(steam)
High
temperature
(steam) and
medium
temperaturec
(~70°C)
High
temperature
(steam) and
medium
temperature
(~100°C)
High
temperature
(steam)
All
temperature
levelsd
Potential for
industry-wide
implementation
limited by
infrastructural
conditions?
NO NO NO YES NO YES
Proven or
emerging
Proven Proven Emerging Emerging Emerging Proven
Included in
Paper(s)...
I-V, VII and
IX
I-III, V, VII
and IX
V, VII and IX V, VII-IX VII and IX I-III, V, VII
and IX
a The technology pathways are further described in Chapter 4, Section 4.2. b How implementation of the different pathways affects a mill’s energy balance is described in Table 3. c Warm water at ~70°C can be used to satisfy the heat demand of the lignin washing process. d Assuming that low temperature excess is upgraded using a heat pump.
In this thesis it is assumed that implementing energy-efficiency measures decreases the
process steam demand. Further, the thesis assumes that, for a kraft pulp mill, if the
process steam demand is reduced there are two different ways to benefit from this
through production of additional products that generate additional revenues12
:
12 For this to be true, the mill must be self-sufficient on thermal energy from the wood raw material alone.
If the mill imports large amounts of external fuel, one alternative when implementing energy-efficiency
measures would be to decrease the import of external fuels corresponding to the steam saved.
Scope and delimitations
15
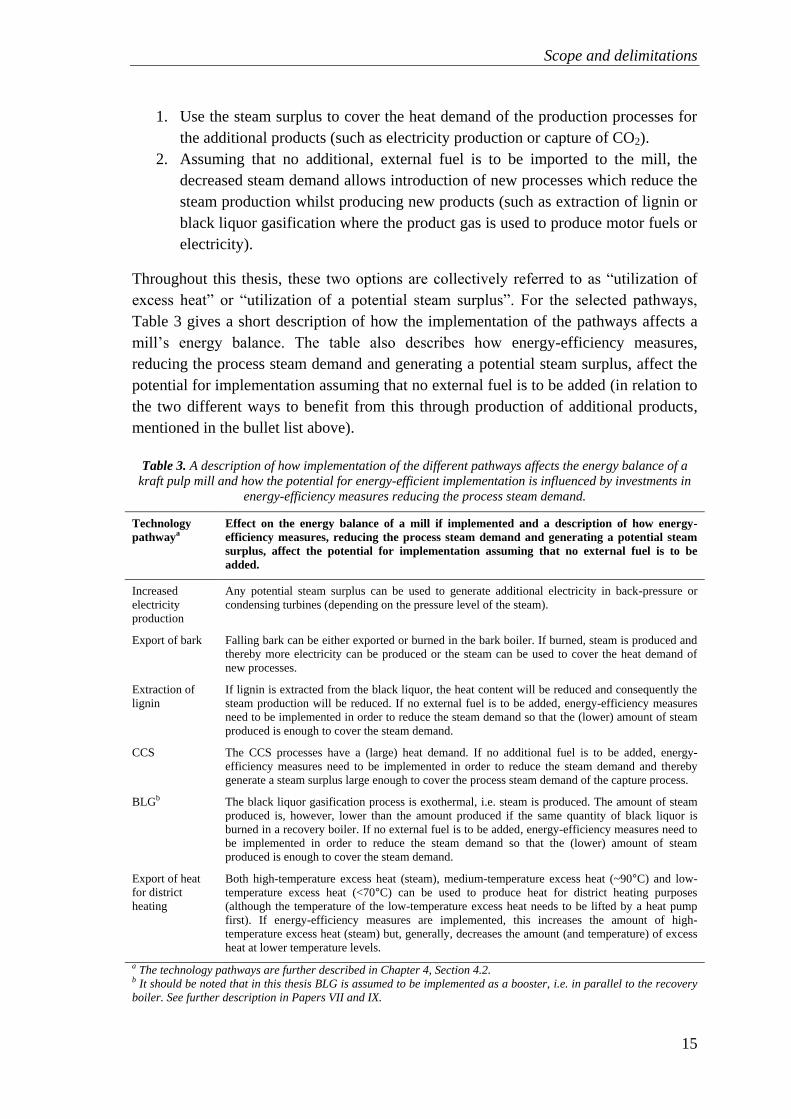
1. Use the steam surplus to cover the heat demand of the production processes for
the additional products (such as electricity production or capture of CO2).
2. Assuming that no additional, external fuel is to be imported to the mill, the
decreased steam demand allows introduction of new processes which reduce the
steam production whilst producing new products (such as extraction of lignin or
black liquor gasification where the product gas is used to produce motor fuels or
electricity).
Throughout this thesis, these two options are collectively referred to as “utilization of
excess heat” or “utilization of a potential steam surplus”. For the selected pathways,
Table 3 gives a short description of how the implementation of the pathways affects a
mill‟s energy balance. The table also describes how energy-efficiency measures,
reducing the process steam demand and generating a potential steam surplus, affect the
potential for implementation assuming that no external fuel is to be added (in relation to
the two different ways to benefit from this through production of additional products,
mentioned in the bullet list above).
Table 3. A description of how implementation of the different pathways affects the energy balance of a
kraft pulp mill and how the potential for energy-efficient implementation is influenced by investments in
energy-efficiency measures reducing the process steam demand.
Technology
pathwaya
Effect on the energy balance of a mill if implemented and a description of how energy-
efficiency measures, reducing the process steam demand and generating a potential steam
surplus, affect the potential for implementation assuming that no external fuel is to be
added.
Increased
electricity
production
Any potential steam surplus can be used to generate additional electricity in back-pressure or
condensing turbines (depending on the pressure level of the steam).
Export of bark Falling bark can be either exported or burned in the bark boiler. If burned, steam is produced and
thereby more electricity can be produced or the steam can be used to cover the heat demand of
new processes.
Extraction of
lignin
If lignin is extracted from the black liquor, the heat content will be reduced and consequently the
steam production will be reduced. If no external fuel is to be added, energy-efficiency measures
need to be implemented in order to reduce the steam demand so that the (lower) amount of steam
produced is enough to cover the steam demand.
CCS The CCS processes have a (large) heat demand. If no additional fuel is to be added, energy-
efficiency measures need to be implemented in order to reduce the steam demand and thereby
generate a steam surplus large enough to cover the process steam demand of the capture process.
BLGb The black liquor gasification process is exothermal, i.e. steam is produced. The amount of steam
produced is, however, lower than the amount produced if the same quantity of black liquor is
burned in a recovery boiler. If no external fuel is to be added, energy-efficiency measures need to
be implemented in order to reduce the steam demand so that the (lower) amount of steam
produced is enough to cover the steam demand.
Export of heat
for district
heating
Both high-temperature excess heat (steam), medium-temperature excess heat (~90°C) and low-
temperature excess heat (<70°C) can be used to produce heat for district heating purposes
(although the temperature of the low-temperature excess heat needs to be lifted by a heat pump
first). If energy-efficiency measures are implemented, this increases the amount of high-
temperature excess heat (steam) but, generally, decreases the amount (and temperature) of excess
heat at lower temperature levels.
a The technology pathways are further described in Chapter 4, Section 4.2. b It should be noted that in this thesis BLG is assumed to be implemented as a booster, i.e. in parallel to the recovery
boiler. See further description in Papers VII and IX.
Johanna Jönsson
16
For the papers analysing the kraft PPI – Papers I-V, VII and IX – the majority of the
papers, Papers I-III, V, VII and IX, are based on data for a model mill depicting a
typical Scandinavian kraft pulp mill. Paper IV, on the other hand, is based on data from
several existing Swedish kraft pulp mills as well as data for model mills. For the
thermo-mechanical (TMP) mills more extensively studied in Paper VI, they all have
different characteristics and have been chosen in order to show the steam-saving
potential for different types of TMP-based pulp and paper mills. The reason for
choosing mills with TMP lines is that amongst the mechanical pulp and paper
processes, TMP is the most promising process to convert to a biorefinery due to the
possibility to recover steam from the high-pressure refiners. The majority of the
European TMP production is located in Scandinavia (>70%), as is also a majority of the
chemical pulp production. This is mainly due to the abundance of wood raw material
and historically low electricity prices. Thus, the mills included for the work in Paper VI
were all Scandinavian. The total number of mills in the CEPI countries decreased by
25% between the years 2000 and 2010 (CEPI 2011). When looking at the “whole”
European PPI, as in Paper VIII, this change of the industry structure is taken into
consideration by including only a selection of mills in the study. The selection was done
together with PPI consultants from Pöyry. Thereby 176 mills were selected and
included, based on their competitive strength and size; see Section 6.2.
Main concepts and related work
17
4 Main concepts and related work
This chapter presents main concepts and earlier work within the field of this thesis.
Further, relevant work from adjacent fields is briefly mentioned. Focus is placed on
studies describing the technologies and system solutions which are included in the
pathways analysed in the latter part of the thesis.
As stated in the introduction to this thesis, the PPI and especially the kraft pulp industry,
due to its high use of biomass and potential for energy-efficient integration of new
processes, has the potential of being a major contributor to reducing global CO2
emissions through delivery of better products (replacing others produced with fossil
energy or lower efficiency). However, to fully achieve this potential, the PPI needs to
increase its energy efficiency and/or introduce new, efficient technology solutions such
as lignin separation, black liquor gasification and carbon sequestration. Research
dealing with energy efficiency in the pulp and paper industry has been conducted on
both the process and mill levels, showing the techno-economic potential for increased
energy efficiency through specific process modifications and the introduction of new,
efficient technologies (see Sections 4.1 and 4.2 below), and on a more aggregated level,
showing the potential for energy savings within the European or global pulp and paper
industry assuming, for example, different policy instruments and/or varying market
development (see Section 4.3). Furthermore, in earlier studies, models have been
constructed to depict the pulp and paper industry either at a detailed mill level – model
mills – or on a more aggregated, national or global, industry level (see Section 4.3).
4.1 Process integration and potential for energy efficiency within the pulp and paper industry
For energy-efficient implementation of technology pathways in the PPI, it is an
advantage if the mill has a surplus of steam and/or heat which can be utilized for
thermal integration of the new biorefinery processes, or a heating demand at such a
temperature level so that it can be supplied with heat from the biorefinery processes. A
steam surplus can only be achieved for kraft market pulp mills, whereas all types of
mills can have excess heat available at different temperature levels. One way to reduce
the process steam demand, and thereby free steam which can be utilized in (new)
biorefinery processes, is to thermally integrate the mill processes – process integration;
see Chapter 5, Section 5.4. Process integration studies within the PPI have shown large
potentials for process steam savings, 15-30% (Group 1999; Fouche and Banerjee 2004;
Savulescu, Poulin et al. 2005; Axelsson, Olsson et al. 2008; Persson and Berntsson
2009; Mateos-Espejel, Savulescu et al. 2010). The identified potential seems valid for
Johanna Jönsson
18
most types of mills; however, the majority of mills analysed are kraft mills. For kraft
mills, process integration studies have also been performed on model mills, depicting
both typical Scandinavian mills and green-field mills built with best available
technology (BAT). For the model mills depicting typical mills, the potential for steam
savings through better process integration and new equipment is similar to the potential
identified for real mills, up to 30% (Olsson, Axelsson et al. 2006; Axelsson and
Berntsson 2008), and for the BAT mills the potential is somewhat lower (Wising 2003).
For the mechanical PPI, potentials for steam savings and temperature levels of excess
heat have been identified for thermo-mechanical (TMP) model mills (Axelsson and
Berntsson 2005; Ruohonen and Ahtila 2009) and for a few real TMP and ground wood
(GW) mills (Noël 1995; Noël and Boisvert 1998; Schaareman, Verstraeten et al. 2000;
Lafourcade, Labidi et al. 2003; Ruohonen and Ahtila 2010; Ruohonen, Hakala et al.
2010; Ruohonen, Hippinen et al. 2010). Recent studies on thermal process integration at
paper mills (without virgin pulp production) are scare in the literature. For this type of
mill, the focus has instead been on system closure and minimization of water use,
something which often also reduces the energy demand even though that is not the
primary goal (Paris 2000; Brown, Maréchal et al. 2004; Ordóñez, Hermosilla et al.
2010; Žarković, Rajaković-Ognjanović et al. 2011).
4.2 Selected technology pathways
There are many technology pathways which could be of interest for the mills within the
European PPI when striving towards becoming biorefineries. In this thesis, the selection
is limited to six:
1. Increased electricity production
2. Export of bark
3. Extraction of lignin
4. Carbon capture and storage13
(CCS)
5. Black liquor gasification (BLG)
6. Export of heat for district heating
Out of these six, three give traditional products (see Section 4.2.1) and three are new,
emerging technologies (see Section 4.2.2).
Other possible pathways, not included in the scope of the thesis, are: hemicellulose
extraction (Persson, Nordin et al. 2007; Mao, Genco et al. 2008; Marinova, Mateos-
Espejel et al. 2009; Huang, Ramaswamy et al. 2010; Mora, Mahmoudkhani et al. 2011),
gasification of biomass (Varma, Chaouki et al. 2010; Isaksson, Mahmoudkhani et al.
13 CCS is sometimes not considered as a biorefinery technology. However, since CO2 can be a valuable
product it is a competing option for utilization of pulp mill excess heat which has the potential to
contribute to substantial reduction of CO2 emissions.
Main concepts and related work
19
2011; Wetterlund, Pettersson et al. 2011), upgrading of biomass through e.g. drying
(Andersson, Harvey et al. 2006), pelleting (Andersson, Harvey et al. 2006; Wolf,
Vidlund et al. 2006), pyrolysis (Ghezzaz and Stuart 2011; Lou, Wu et al. 2012)
torrefaction (van der Stelt, Gerhauser et al. 2011), or conversion of the whole pulp mill
into an ethanol production plant (Phillips, Jameel et al. 2008; Fornell 2010). As for the
studied technologies, some of these technologies can benefit from combined
implementation (Consonni, Katofsky et al. 2009; Huang and Ramaswamy 2010;
Pettersson and Harvey in press).
The majority of research papers regarding different biorefinery options for the PPI refer
to kraft mills (Olsson, Axelsson et al. 2006; Van Heiningen 2006; Towers, Browne et
al. 2007; Consonni, Katofsky et al. 2009; Marinova, Mateos-Espejel et al. 2010a,
2010b; Perrin-Levasseur, Maréchal et al. 2010; Pettersson and Harvey 2010). Moreover,
some biorefinery technologies such as extraction of lignin and black liquor gasification
can only be implemented at chemical pulp mills. For the mechanical PPI, research
regarding the potential for introduction of biorefinery concepts has not been performed
as extensively. This is mainly because, for pulp produced by mechanical pulping
processes, all wood components (cellulose, hemicelluloses and lignin) are present in the
pulp (see Chapter 2 for further description). However, this fact does not mean that a
mechanical mill cannot be transformed into a biorefinery. It only means that the
biorefinery options available for mechanical mills are more limited (and less studied)
than chemical/kraft mills.
The references given for the selected technologies in the following sections are mainly
related to energy efficiency and the potential for thermal integration of the new
technology processes.
4.2.1 Technology pathways based on traditional products
The technology pathways listed below are technically feasible to implement for all kraft
and mechanical mills regardless of the production process. Paper mills without virgin
pulp production have no bark to access and thus cannot export bark. Increasing the
electricity production and increasing the bark exports are possible regardless of
geographical position, since the infrastructure for these products is already in place.
Export of heat for district heating, on the other hand, depends on the availability of a
district heating grid nearby, or a large heat sink for which a grid can be built.
Increased electricity production
For kraft mills, electricity is generated in back-pressure turbines, utilizing the steam
produced in the recovery boiler and any other boilers before it is used in the production
processes. The electricity production can, for example, be increased by raising the steam
quality (when investing in new boilers), increasing the dry solid content of the black
liquor, decreasing any throttling and/or reducing the process steam demand, and
investing in a condensing turbine, as discussed by e.g. Vakkilainen (2008), Kankkonen
Johanna Jönsson
20
(2010) and Olsson (2006). In this thesis, increased electricity production due to
increased dry solid content of the black liquor, reduction of any throttling and/or
investment in a condensing turbine to utilize a potential steam surplus are considered.
For a mechanical mill, any on-site electricity production is produced in back-pressure
turbines connected to the boilers used to produce process steam. If energy efficiency is
increased through process steam savings, increased recovery of steam from the refiners,
or a lower electricity use in the refiners, this will lead to a lower demand for steam
produced in boilers. Consequently, the fuel demand will be lower but the potential for
producing electricity in back-pressure turbines will also be reduced.
During 2009, the mills within CEPI produced 49 TWh of electricity, equal to 48% of
their total electricity use.
Export of bark
Kraft and mechanical mills, which use timber as their wood raw material, get falling
bark from the de-barking process. This bark can be either used to produce steam or
exported, depending on the steam demand of the mill. However, since the falling bark is
fairly wet its market value can be low. To increase the dry content, and thus the value of
the bark, it can be dried prior to export. In the case of bark export, less bark is burned
and consequently less electricity can be produced in back-pressure turbines. Due to this
fact, the trade-off between selling the bark and using it internally at the mill depends on
the mill steam demand as well as the price of electricity and bark (Eriksson, Harvey et
al. 2002; Axelsson and Berntsson 2005; Axelsson and Berntsson 2008). This is also true
if biorefinery processes such as BLG or gasification of biomass are introduced
(Eriksson, Harvey et al. 2002; Farahani, Worrell et al. 2004).
Export of heat for district heating
The PPI has a large on-site use of energy. Nevertheless, substantial amounts of the
primary process energy used exit the processes at different (lower) temperatures
(compared to the temperatures they had when entering the process), called excess heat.
The excess heat can e.g. be utilized for production of district heating. Since the PPI is
energy-intensive, substantial amounts of excess heat are associated with only a limited
number of geographical sites, i.e. mills. Further, hot water, such as excess heat used for
district heating, can only be transported over limited distances. This is mainly due to the
capital cost of the necessary culvert; technically the heat can be transferred for quite
long distances without too much heat loss. Consequently, the potential for district
heating production within the PPI depends on whether there is a heat sink in the form
of, for example, a city or a company with a large heat demand situated nearby, and
whether the mill excess heat meets the temperature requirements. In the case of Sweden,
an approach for identifying the length of culvert which can be built for utilization of
excess heat has been developed (Gustafsson and Larsson 2003). The approach is based
on the assumption that the cost for supplying the excess heat as district heating should
Main concepts and related work
21
be equal to the cost of supplying the same amount of heat by investment in a new
biofuel boiler.
Within the CEPI countries, the distribution of district heating varies greatly. In Sweden
and Finland, district heating currently holds approximately 50% of the heat market,
whereas it is almost nonexistent in Spain and Portugal (Werner 2006; Energy Markets
Inspectorate 2010; Energiateollisuus 2011). Werner (2006) and Persson and Werner
(2011) discuss, amongst other issues, the future competitiveness and expansion of
district heating in Europe. They conclude that district heating is competitive, especially
if based on excess heat, and describe how the use can be doubled during the upcoming
15-20 years. Werner (2006) also critically analyses other projections of future district
heating expansion, made by the European Commission (2004), IEA (2004) and IPCC
(2001), and concludes that the environmental benefit of district heating is not
recognised on the international policy level concerning climate change and
consequently, the international community has very low expectations concerning the
future growth of district heating systems in Europe. Compared to other alternatives for
utilization of excess heat, district heating is an alternative that can usually be combined
with other technology pathways such as electricity production or production of biofuels,
and can thereby further reduce the global CO2 emissions and at the same time improve
the economic performance when implementing such pathways (Egeskog, Hansson et al.
2009; Difs, Wetterlund et al. 2010). However, if the excess heat is of high quality
(temperature of >95°C or steam) there could be a competition for the excess heat
between district heating and other utilization alternatives such as internal, advanced
process integration, electricity production, etc. (Bengtsson, Nordman et al. 2002).
In the CEPI countries, the use of industrial excess heat for district heating is not
common; Sweden is basically the only country where industrial excess heat has more
than a very marginal share of the heat market (Werner 2006). In Sweden, excess heat
from the PPI is used for district heating purposes in a number of cities, for example
Varberg (the Södra Värö mill), Karlstad (the Stora Enso Skoghall mill), Mönsterås (the
Södra Mönsterås mill), Gävle (the Korsnäs mill) and Sundsvall (the SCA Ortviken
mill).
4.2.2 Technology pathways producing new, high-value products
Extraction of lignin and black liquor gasification can only be implemented for chemical
mills. Carbon capture and storage, on the other hand, is technically possible to
implement for any type of pulp and paper mill.
Lignin extraction
In the kraft pulp process, the fibres are used for production of pulp (or paper), and the
rest of the wood components – lignin and parts of the hemicelluloses – are dissolved in
the black liquor. Lignin can be extracted from the black liquor by using either e.g. acid
precipitation (Öhman 2006) or ultrafiltration (Wallberg 2005). Currently, acid
Johanna Jönsson
22
precipitation is closer to commercialisation and thus is the process assumed when lignin
extraction is discussed. In the acid precipitation process, CO2 is used to precipitate the
lignin, which thereafter can be filtered and washed. From a mill energy systems
perspective, lignin extraction will lead to reduced heat content in the black liquor in the
recovery boiler, and thus to reduced steam and electricity production, together with an
increased steam demand in the evaporation plant due to the increased evaporation load
from wash filtrates.
Many alternatives have been discussed with respect to the products which could be
based on extracted lignin (Berntsson 2008; Lindgren 2009; Ziegler, Nägele et al. 2009;
LigniMatch 2010; Perrin-Levasseur, Benali et al. 2010). Today, the only commercial
alternative with large-volume market potential is to use it as a fuel e.g. to replace oil in
the lime kiln or for co-combustion in coal power plants. However, in regard to the near
future, it can be assumed that the extracted lignin may be used to replace oil both as a
fuel and as a feedstock in production of materials and chemicals. Consequently, the
future profitability of lignin extraction is dependent on the world prices of both biomass
and oil.
Structural changes in the European PPI imply that some mills will be closed down,
while the remaining mills will increase their production capacity (CEPI 2011). For
increased production capacity, the recovery boiler is often a bottleneck. Axelsson et al.
(2006) conclude that for a kraft pulp mill, lignin extraction is an economically attractive
alternative for debottlenecking the recovery boiler, if the alternative is to upgrade the
recovery boiler and the connected steam turbines. Further, when increasing the
production capacity at a kraft pulp mill, lignin extraction shows a better economic
performance than increased electricity production for utilization of excess steam
(Axelsson, Olsson et al. 2006; Olsson, Axelsson et al. 2006; Laaksometsä, Axelsson et
al. 2009). An alternative approach for debottlenecking of the recovery boiler could be to
introduce a black liquor gasifier as a booster; see the section on black liquor gasification
below.
Today, lignin is extracted at a (small) demonstration plant at the Nordic Paper
Bäckhammar mill in Sweden. Further, financial support has been granted by the
Swedish Energy Agency (SEA) for building of a full-scale demonstration plant at the
Södra Mörrum mill in Sweden.
Carbon capture and storage (CCS)
Being large energy users, pulp and paper mills have large on-site emissions of CO2.
Since these emissions are associated with only a limited number of geographical sites,
the PPI, like other energy-intensive industry branches (Rootzén, Kjärstad et al. 2011), is
suitable for implementation of carbon capture (CC). Further, since a large share of the
CO2 emissions associated with the European PPI are biogenic, if CCS is implemented
the levels of CO2 in the atmosphere can be further reduced in comparison to
implementing CCS only on fossil emission sources (Ekström, Blümer et al. 1997;
Main concepts and related work
23
Möllersten, Yan et al. 2003; Möllersten, Gao et al. 2004; Hektor and Berntsson 2007;
Hektor and Berntsson 2008; Hektor and Berntsson 2009). Since the main source of CO2
from the pulp and paper industry is boiler flue gases, there are in principle three
technology options for capture: post-combustion, pre-combustion and oxy-combustion.
In this thesis, post-combustion using chemical absorption is considered since it is the
only technique not requiring any reconstruction of the boilers (Hektor and Berntsson
2007). For post-combustion with chemical absorption the energy cost for capture is 50-
70% of the total cost and thus cannot be neglected (Abu-Zahra, Niederer et al. 2007;
Hektor and Berntsson 2007). Hence, for CC to be economically and technically
realistic, the source of CO2 must be large enough and the energy demand of the capture
process should preferably be possible to integrate (fully or partly) with other processes
at the capture site. The potential for heat integration of post-combustion CO2 capture to
kraft pulp and paper mills has been studied by Hektor and Berntsson (2007; 2009) who
show that thermal integration is possible to a substantial extent.
Generally, the costs of CO2 transport and storage are assumed to be low compared to
the cost for capture. However, that assumption is only valid if a large-scale
infrastructure, serving several emission sources, is in place. This is especially true when
studying CCS in the industry sector since the industrial point sources usually are smaller
than the point sources in the power and heat sector. One way of limiting the cost of CCS
is to create capture clusters in regions with several emission sources located near each
other. In this way, the transport network can be integrated and thus benefit from
economy of scale. Capture clusters in Europe based on emissions from other energy-
intensive industry sectors have been identified by Rootzén et al. (2011).
Another option for CC within the European PPI, apart from capture of CO2 from boiler
flue gases, would be to capture CO2 from the lime kiln at kraft mills using oxy-
combustion (Grönkvist, Bryngelsson et al. 2006; Grönkvist, Grundfelt et al. 2008).
However, since the technology cannot be applied directly to existing kilns (or boilers),
and since the flow of CO2 from the lime kiln is minor compared to the boiler flue gas
flows, this option will not be discussed further.
Today, CO2 is captured from the flue gases at two Swedish pulp and paper mills, the M-
real Husum mill and the StoraEnso Nymölla mill. However, this CO2 is not transported
and stored as pure CO2 but chemically bound in the production of precipitated calcium
carbonate (Grönkvist, Grundfelt et al. 2008).
Black liquor gasification (BLG)
The black liquor generated in the kraft pulp process is burned in the recovery boiler in
order to recover the cooking chemicals and produce steam for the mill process steam
demand. Another alternative for the recovery of chemicals and energy in the black
liquor is to use BLG. In this thesis, the BLG technology considered is the one based on
the Chemrec process, since this is the technology which currently is being most
developed and is closest to commercialisation.
Johanna Jönsson
24
Introducing BLG will alter a mill‟s energy balance. As in the case of a conventional
recovery boiler, the BLG unit will have a net surplus of steam. The amount of steam,
however, will be lower than if the same amount of black liquor is burned in a recovery
boiler. Due to the lower steam production, additional fuel needs to be burned in the
(bark) boiler if the steam production is to be unchanged. On the other hand, the BLG
unit also generates a product gas which can be used to produce either biofuels or
electricity. For the case of biofuel production, the mill‟s electricity production will
decrease and for the case of electricity production it will obviously increase. Compared
to a conventional recovery boiler, a BLG unit makes the recovery process more
complicated and is significantly more expensive (Modig 2005). Thus, for BLG to be a
competitive alternative, the monetary and environmental value gained from the
produced biofuel or electricity must offset these drawbacks.
System aspects of integration of BLG to kraft mills have been systematically studied by
Pettersson (2011) who shows how the potential for reduction of global CO2 emissions
and economic profitability of BLG depend on a number of factors such as the mill
steam demand, the degree of heat integration possible, choice of product produced from
the product gas, etc. Based on her work, Pettersson concludes, among other things, that
BLG generally shows a better performance for market pulp mills than for integrated
pulp and paper mills, that production of biofuels from the product gas generally shows a
better performance than electricity, and that CCS can be integrated to the mill in a more
profitable way if BLG is used than if using a conventional recovery boiler. The
economic performance and/or potential for reduction of global CO2 emissions for BLG
have also been investigated by, for example, Andersson and Harvey (2006), Berglin et
al. (2003), Ekbom et al. (2005), Eriksson and Harvey (2004), Joelsson and Gustavsson
(2008), Consonni et al. (2009), and Larson et al. (2009).
As extraction of lignin, BLG can also be an alternative for debottlenecking of the
recovery boiler or for utilization of a steam surplus if installed as a booster, not
replacing but complementing the recovery boiler.
In Europe today, the BLG technology is implemented at only one mill, the Smurfit
Kappa Piteå mill. However, the BLG plant handles only a small fraction of the black
liquor flow. Between the years 2005-2010 the BLG plant was a development plant,
focused only on the gasification. By the year 2011, however, a small demonstration
plant, incorporating the whole production chain from gasification to production of
motor fuels, was built and this plant is currently in the start-up phase.
4.3 Modelling of the pulp and paper industry on different system levels
The PPI industry has been modelled in both detailed studies, on mill level, and in more
aggregated studies, on industry or world level. Most of the studies are based on a
bottom-up framework.
Main concepts and related work
25
4.3.1 Mill level
Detailed studies on mill level comprise mill-specific conditions but usually do not
consider interactions between a wide range of different techniques and technology
solutions – other than the particular technique or technology solution in focus in the
given study, perhaps compared to one or two alternatives – and neither do they say
anything about the general, industry-wide potential. At mill level, the models used are
based on either data from existing mills, case studies, or using reference values due to
solid knowledge about the industry, model mill studies. For the kraft PPI, model mills
depicting typical Scandinavian mills and model mills based on BAT technology have
been developed within the FRAM research programme, along with a model of a BAT
mechanical TMP mill producing SC-paper (FRAM 2005). Model mills based on TMP
and recycled fiber/de-inked paper (RCF/DIP) have been developed within the
ECOTARGET project (ECOTARGET 2005). The model mills developed within the
ECOTARGET project have also been used in the development of the Heat Load Model
for Pulp and Paper (HLMPP); see Section 5.4.2.
The model mills have been used in a number of research projects focused on analysing
the effect of implementation of new technologies. For the kraft model mills, the
research has been focused on process integration and implementation of new biorefinery
processes, whereas the research on the mechanical model mills generally has been very
technology-focused and performed on a more detailed system level. Examples of
relevant mill-level studies are given in Section 4.2.1. Obviously these studies are based
on knowledge and results gained from studies made on even more detailed system
levels.
4.3.2 Industry level
Most aggregated studies at an industry level identify general potential but usually do not
consider mill-specific conditions in any detail. Kinstrey and White (2007) for example,
study the potential for energy efficiency within the North American pulp and paper
industry by comparing the current average energy use with the level of energy use that
could be achieved either through implementation of the most efficient commercially
available technology (BAT) or implementation of new, advanced technology currently
not practised (Practical Minimum). In this way they estimated the potential for energy
efficiency on an industry level. A similar approach has been applied by Klugman et al.
(2007a, 2007b) who estimate the potential for energy efficiency at a Swedish pulp mill
by comparing the mill‟s energy use with other similar Scandinavian mills and two
model mills. Energy and electricity use for BAT for the PPI can be found in e.g. Worrell
et al. (2008) and Ecofys (2009).
Davidsdottir and Ruth (2005) and Ruth et al. (2004) use capital vintage modelling to
assess changes in energy use and CO2 emissions due to capital stock turnover and fuel
switching for the US pulp and paper industry when implementing different policy
measures. They conclude that if increasing the cost for emitting CO2 alone, the
Johanna Jönsson
26
reductions of CO2 from the PPI can mainly be derived from fuel switching. To
overcome the capital stock inertia and thereby achieve larger emission reductions, they
suggest a combination of policy instruments to be applied simultaneously, such as a
combination of a cost for emitting CO2 and policies providing incentives that advance
the adoption of higher-efficiency technologies.
Murphy et al. (2007) use the CIMS model, a further development based on the ISTUM
model presented by e.g. Jaccard and Roop (1990), to analyse how the industrial sector,
including the PPI, in Canada would be affected if an economy-wide, compulsory
greenhouse gas reduction policy were to be implemented. Regarding the studies based
on capital vintage modelling mentioned above, Murphy et al. (2007) find that when
introducing a charge for emitting CO2 the main consequential emission reductions are
related to fuel switching. The CIMS model started as a bottom-up model with a high
technological explicitness, and has during the years evolved towards an economy-wide
hybrid model by inclusion of macro-economic feedbacks and parameters for simulating
technological evolution. Although technologically explicit, the pulp and paper industry
part in the CIMS model does not reach the same level of detail as the model mills
described in Section 4.3.1 do.
Szabó et al. (2009) have developed a bottom-up, global model of the world PPI,
PULPSIM, which focuses on energy use and emissions of CO2. The model is used to
analyse the effect on the PPI if introducing new policy instruments compared to the case
of “business as usual”. Although PULPSIM uses a bottom-up framework, the energy
system for the mill configurations studied (including three types of pulping processes
and three paper types based on compositions of these pulps) is only schematically
represented, based on an overall energy balance, and the authors themselves point out
the need for more technological detail. In line with the results from the aggregated
studies reviewed above, Szabó et al. (2009) conclude that fuel switching is the major
reason for decreased levels of CO2 emissions in the PPI when subjected to a cost for
emitting CO2. They also state that for the European PPI, which already has a relatively
“clean” fuel mix, further emission cuts can only be made if additional, technology-
based measures are applied.
4.4 Evaluation of the potential for implementation of new technologies – geographical and infrastructural conditions
When assessing the potential for implementation of technology pathways within the
energy-intensive industry in Europe, the physical energy infrastructure and geographical
location of the industry, as well as knowledge regarding these facts, are of importance.
In some cases it can even be reasonable to adapt the development in other sectors after
the structure of the energy-intensive industry. For example, when planning for new
biofuel production plants or heat and power plants it could be rational to consider where
the existing energy-intensive industry is located, since this type of industry is a large
Main concepts and related work
27
user of both thermal and electric energy but usually at the same time can supply vast
amounts of excess heat.
The importance of considering geographical and infrastructural conditions when
evaluating the potential for implementation of new technology on a national or
European level has been stressed by e.g. Leduc et al. (2009) who developed the
geographically explicit optimisation model BEWHERE. The model is used to identify
the optimal location of bioenergy conversion plants and biofuel production plants,
considering geographical characteristics for the raw material supply and the markets for
both end products and residual products. The model has been used on both a national
level (Leduc, Lundgren et al. 2010; Leduc, Starfelt et al. 2010; Natarajan, Leduc et al.
2011) and European level (Wetterlund, Leduc et al. 2011; Leduc, Wetterlund et al.
submitted for publication).
Apart from closeness to raw material supply and markets for the products produced, the
potential for energy efficiency and implementation of new technologies at a specific
industrial site is influenced by whether the site consists of one isolated industry or
several co-located industries, so-called industrial clusters. Situated in an industrial
cluster, the industrial plants can make efficient use of common energy and transport
infrastructure and/or reduce their total demand for external heating and cooling by
exchanging excess heat via a common utility system. Using total site analysis, TSA
(described by e.g. Raissi 1994; Klemeš, Dhole et al. 1997; Perry, Klemeš et al. 2008),
the potential for utility savings through implementation of a common utility system has
been investigated for e.g. petrochemical clusters (Matsuda, Hirochi et al. 2009; Hackl,
Andersson et al. 2011; Stijepovic and Linke 2011). The occurrence of energy-intensive
industrial clusters emitting large volumes of CO2 has been investigated by e.g. Rootzén
et al. (2011), who discuss how the geographical positions of these clusters can influence
the development of transport and infrastructure for captured CO2, and by Johansson et
al. (submitted for publication), who discuss how the potential for CO2 abatement within
the European petroleum refining industry is influenced by location of the refineries and
their proximity to other industries and/or transport and energy infrastructure.

Johanna Jönsson
28
Methods, tools and methodology
29
5 Methods, tools and methodology
Due to the span of system levels studied in this thesis, several methods and tools have
been used. Further, part of the work was to develop a methodological approach to be
used for the thesis work. This chapter first defines the three system levels used and
describes how they are connected. Thereafter, the main methods and tools used are
presented. Last, the developed approach, based on the mentioned methods and tools, is
presented.
5.1 Fundamental assumptions
The assumption that biomass, within the near future, should be viewed as a limited
resource is based on the fact that there are numerous studies showing how different
biomass-based technologies can substitute fossil-based technologies in order to
contribute to decreasing global emissions of CO2, for example biomass gasification for
electricity, heat and/or motor fuel production and/or co-firing of biomass with coal for
electricity production (for system studies on European potentials for gasification of
biomass and/or co-firing see e.g. Marbe 2005; Egeskog, Hansson et al. 2009; Hansson,
Berndes et al. 2009). Realising only a number of these technologies in large scale in
order to eliminate the use of fossil fuels in e.g. the transport and/or electricity sector
will, however, demand more biomass than may be available (André P.C. 2006). Due to
this fact, it is important to use the biomass as efficiently as possible in order to achieve
as large global emission reductions per biomass unit as possible. In other words,
biomass can be regarded as a limited resource. Consequently, the biomass used in the
PPI limits the amount of biomass used elsewhere (for example for co-combustion in
coal power plants producing electricity) and thus the CO2 emissions from such other
alternative uses will increase. Conversely, biomass exported from the PPI will decrease
the emissions from such alternative applications since more biomass is then available.
This study assumes a future, 20-40 years from now, when the amount of biomass used
has reached its limits but fossil fuels still are used to a fairly large extent. Further, at this
time in the future, the new emerging technologies are assumed to be commercially
available. In Fig. 4, this time in the future is symbolised by the letter B. Point A refers
to today where the limit for the amount of biomass available has not yet been reached.
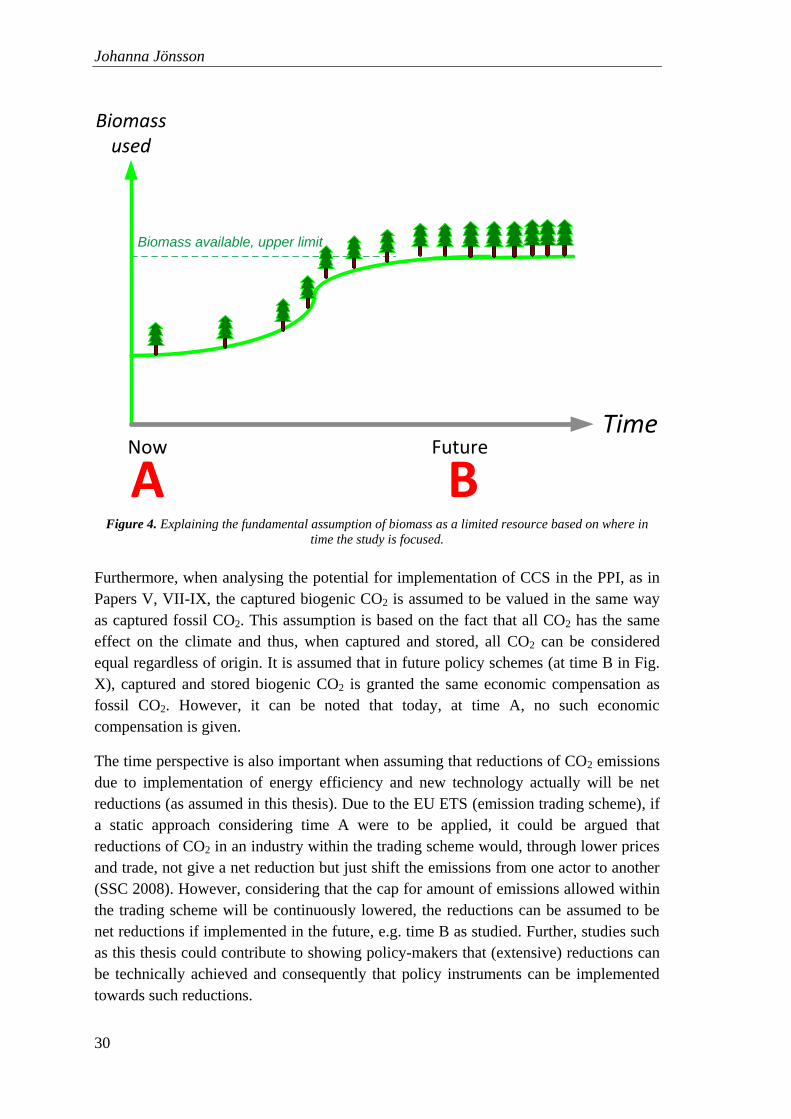
Johanna Jönsson
30
Now FutureTime
Biomassused
A B
Biomass available, upper limit
Figure 4. Explaining the fundamental assumption of biomass as a limited resource based on where in
time the study is focused.
Furthermore, when analysing the potential for implementation of CCS in the PPI, as in
Papers V, VII-IX, the captured biogenic CO2 is assumed to be valued in the same way
as captured fossil CO2. This assumption is based on the fact that all CO2 has the same
effect on the climate and thus, when captured and stored, all CO2 can be considered
equal regardless of origin. It is assumed that in future policy schemes (at time B in Fig.
X), captured and stored biogenic CO2 is granted the same economic compensation as
fossil CO2. However, it can be noted that today, at time A, no such economic
compensation is given.
The time perspective is also important when assuming that reductions of CO2 emissions
due to implementation of energy efficiency and new technology actually will be net
reductions (as assumed in this thesis). Due to the EU ETS (emission trading scheme), if
a static approach considering time A were to be applied, it could be argued that
reductions of CO2 in an industry within the trading scheme would, through lower prices
and trade, not give a net reduction but just shift the emissions from one actor to another
(SSC 2008). However, considering that the cap for amount of emissions allowed within
the trading scheme will be continuously lowered, the reductions can be assumed to be
net reductions if implemented in the future, e.g. time B as studied. Further, studies such
as this thesis could contribute to showing policy-makers that (extensive) reductions can
be technically achieved and consequently that policy instruments can be implemented
towards such reductions.
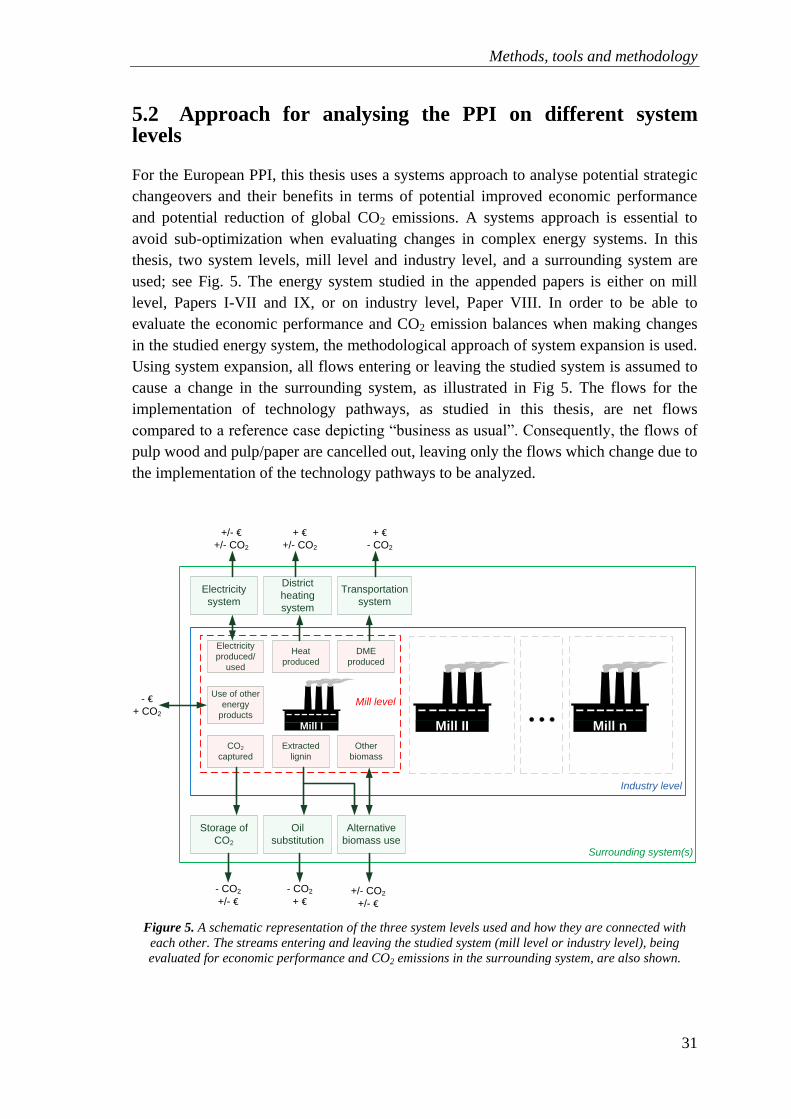
Methods, tools and methodology
31
5.2 Approach for analysing the PPI on different system levels
For the European PPI, this thesis uses a systems approach to analyse potential strategic
changeovers and their benefits in terms of potential improved economic performance
and potential reduction of global CO2 emissions. A systems approach is essential to
avoid sub-optimization when evaluating changes in complex energy systems. In this
thesis, two system levels, mill level and industry level, and a surrounding system are
used; see Fig. 5. The energy system studied in the appended papers is either on mill
level, Papers I-VII and IX, or on industry level, Paper VIII. In order to be able to
evaluate the economic performance and CO2 emission balances when making changes
in the studied energy system, the methodological approach of system expansion is used.
Using system expansion, all flows entering or leaving the studied system is assumed to
cause a change in the surrounding system, as illustrated in Fig 5. The flows for the
implementation of technology pathways, as studied in this thesis, are net flows
compared to a reference case depicting “business as usual”. Consequently, the flows of
pulp wood and pulp/paper are cancelled out, leaving only the flows which change due to
the implementation of the technology pathways to be analyzed.
Mill IIMill I Mill n
Mill level
Industry level
Surrounding system(s)
Electricity
system
District
heating
system
Alternative
biomass use
Oil
substitution
Storage of
CO2
Transportation
system
Electricity
produced/
used
Heat
produced
DME
produced
Other
biomass
Extracted
lignin
CO2
captured
Use of other
energy
products
+/- €+/- CO2
+ €+/- CO2
+ €- CO2
- CO2
+/- €
- €+ CO2
- CO2
+ €+/- CO2
+/- €
Figure 5. A schematic representation of the three system levels used and how they are connected with
each other. The streams entering and leaving the studied system (mill level or industry level), being
evaluated for economic performance and CO2 emissions in the surrounding system, are also shown.
Johanna Jönsson
32
The system expansion approach is used in Papers I-III, V, VII and IX. In Papers I and II
the studied energy system consists of a kraft pulp mill and an utility whereas the studied
energy system in Papers III, V, VII and IX consists of only a kraft pulp mill. In these
papers, changes in the studied energy system, in the form of investments in energy
efficiency and new technology are evaluated for a variety of conditions in the
surrounding system, in the form of energy market scenarios. In the subsequent text the
main assumptions for the system expansion are given. For more description and detailed
price and emission data used see Sections 5.2.1 and 6.2.3, and for a more thorough
description of the assumptions behind these data see Axelsson and Harvey (2010).
The electricity surplus or deficit due to implementation of energy efficiency and
technology pathways is assumed to affect the marginal electricity production
technology. Due to the long economic lifetime of the pathways studied, the marginal
production technology considered refers to the base load build margin (not the operating
margin production technology). The assumed base load build margin technology varies
depending on fuel prices and policy instruments. Electricity produced based on
renewable sources is assumed to be subject to a policy instrument incentive scheme due
to which additional revenue is obtained for such electricity. Based on this, it is assumed
that all electricity produced is sold to obtain the additional revenue, and that the
electricity demand is covered by purchased electricity (non-renewable base load build
margin, thus having a lower price).
In a similar way, it is assumed that the excess heat exported from the studied system
will be used as part of the base load in a district heating system and thus affect the
building of base load capacity. The district heating market is by nature local. Due to this
fact, no single marginal production technology for district heating in Europe can be
determined. In Papers I-III, three options for the alternative district heating production is
used based on data from real district heating grids in Sweden, representing the
conditions for a small, a medium sized and a large district heating system respectively.
In Paper V the alternative heat supply technology is assumed to be biomass combined
heat and power (CHP). Finally, in Papers VII and IX, the alternative heat supply
technology is assumed to be a combination of coal CHP and gas boiler.
In the transport system, DME produced by the PPI is assumed to replace diesel. As for
electricity produced based on biomass, apart from the DME price, additional revenue is
assumed to be obtained due to a policy instrument incentive scheme promoting
production of biofuels.
The alternative use of biomass is assumed to be either co-combustion with coal in coal
power plants or production of DME. Extracted lignin, a more high-value product
compared to other types of biomass such as bark, is either assumed to replace oil, as
feedstock for production of materials and chemicals, or other biomass for co-
combustion with coal in coal power plants.
Methods, tools and methodology
33
5.2.1 Energy market scenarios
The future economic performance, as well as the global emissions of CO2, associated
with the technology pathways studied is dependent on the development of the energy
market. Consequently, to identify robust investment options, the performance of the
technology pathways should be evaluated for varying future energy market conditions.
In Papers I-III, V, VII and IX energy market scenarios are used to reflect a variety of
possible future energy market conditions.
To achieve reliable results from an evaluation using energy market scenarios, the energy
market parameters within a given scenario must be consistent, i.e. the energy prices
must be related to each other (i.e. accounting for energy conversion technology
characteristics and applying suitable substitution principles). Consequently, a systematic
approach for constructing such consistent scenarios is facilitated by the use of a suitable
calculation tool. In this thesis the Energy Price and Carbon Balance Scenarios tool (the
ENPAC tool) developed by Axelsson and Harvey (2010) (based on work by Ådahl and
Harvey 2007 and Axelsson et al. 2009) was used. The ENPAC tool proposes energy
market prices for large-volume customers, based on world market fossil fuel price data
and assumed values for energy and climate mitigation policy instruments. Hence, the
required user inputs to the tool are fossil fuel prices and charges for emitting CO2.
Based on these inputs, the probable marginal energy conversions technologies in key
energy markets are determined, which in turn yield consistent values for energy prices
and CO2 emissions associated with marginal use of fossil fuels, electricity, wood fuel
and heat for district heating. Further, using the energy market scenarios a packaged
sensitivity analysis of the energy market prices is conducted. The prices and CO2
emissions associated with marginal use of different energy products, as generated by the
ENPAC tool, used as part of the input data in Papers I-III, V, VII and IX, are presented
along with other input data in Chapter 6.
Another option for evaluating the future economic performance and global emissions of
CO2 associated with the technology pathways would be to use traditional sensitivity
analysis where the energy market parameters are varied separately, often called “one-
factor-at-a-time” analysis. Such an approach can be a suitable, simple, option for an
analysis where the varied factors are independent of each other. However, energy
market parameters are not independent but rather strongly connected to each other and
thus a “one-factor-at-a-time” analysis could give unrealistic relations between the
energy market prices.
5.2.2 General economic assumptions
In Papers I-III, V, VII and IX, the net annual profit for an “average year” was used for
the evaluation of the economic performance (see Eq. 1, Section 5.3). For the cases
where the mill is the studied system, Papers V, VII and IX, a capital recovery factor of
Johanna Jönsson
34
0.214
was used as a base case; and for the case when the mill was modelled within the
same system boundary as a utility, Papers I-III, a capital recovery factor of 0.1 was used
as a base case15
. The same capital recovery factor was used for all investments
considered, since a more detailed modelling of individual capital recovery factors would
require knowledge, not only about the expected lifetime of each investment, but also
about the risk associated with the investment in the view of the decision-maker at the
company making the investments. Another, similar, alternative for evaluation of the
economic performance would be to use the net present value (NPV). However, such an
analysis demands data for each year during the economic lifetime of the investment and
it is hard enough to estimate the different energy market prices for an “average” year in
the future (as done using the energy market scenario tool; see Section 5.2.1)16
. The
uncertainty regarding the cash flows for individual years in the future, together with the
fact that the net annual profit method still considers the time value of money through the
capital recovery factor, makes the net annual profit for an average year a good enough
method for comparing the selected technology pathways with each other. When
significant changes in price and policy conditions are expected over the investment
lifetime, it becomes more important to consider later investment options as reactions to
the changing conditions (see for example Svensson, Berntsson et al. 2009). This would
require the use of NPV instead of an average annual net profit.
The investment cost for the not yet commercial technologies, i.e. black liquor
gasification, lignin extraction and CO2 capture and storage, are assumed to be for the
“Nth
plant” 17
.
5.3 The energy system modelling tool reMIND
In Papers I-III, V, VII and IX the energy system modelling tool reMIND tool is used.
When using the tool the work followed a systematic methodology developed and
described in Papers I, V and VII. The methodology enables changes in a studied energy
system to be analysed in a systematic way. Typical changes that can be studied are:
changes due to investments, varying energy market prices, emission targets and policy
14 A capital recovery factor of 0.2 is equivalent to e.g. an economic lifetime of 10 years and an interest
rate of 15% or an economic lifetime of 6 years and an interest rate of 5%.
15 However, in the papers sensitivity analysis was performed where the capital recovery factor was set to
0.2 for Papers I-III and to 0.1 for Papers V and VII.
16 Actually, dividing the net annual profit with the capital recovery factor gives the NPV for the
investment if assuming that the cash flow is the same for all years during the economic lifetime as for the
“average year”.
17 This assumes the time in the future when the emerging technologies are mature, reliable and sold in
significant volumes to have reached the Nth plant investment cost. A problem sometimes discussed
regarding the Nth plant is the fact that if no one is willing to invest in the first couple of plants the Nth
plant will never be built.
Methods, tools and methodology
35
instruments. The main steps for a study based on this methodology are briefly described
below:
1. Define the studied system (in Papers I-III a pulp mill and a utility producing
district heating and in Papers V, VII and IX a pulp mill).
2. Define possible system changes to be evaluated (in this work, the investments in
energy-efficiency measures and the implementation of energy-related
technologies for utilization of excess steam and heat).
3. Define the surrounding system used for evaluation of the studied system (the
energy market scenarios describing energy market prices and policy
instruments).
4. Construct a model based on 1-3 (here the energy systems modelling tool
reMIND was used).
5. Define the performance indicator(s) to be considered for comparing the system
changes to be evaluated (for the work presented in this thesis the net annual
profit and global CO2 emissions).
6. Optimize the system based on the selected performance indicator for different
settings in the surrounding system (defined by the aim of the study in question),
to see how/whether the optimal solution is affected by changes in the
surrounding system (here to find the optimal solution for each energy market
scenario studied).
7. Fix certain parameters in order to investigate how close other solutions of
interest are to the optimal solution (showing the effect of changes in different
system parameters)
8. Analyse the results in relation to the aim of the study (as defined by steps 1-3).
The reMIND tool is based on mixed-integer linear programming and has been used and
described by e.g. Karlsson (2011) Nilsson and Söderström (1992), Sandberg (2004) and
Karlsson and Söderström (2002). With the tool, an optimization problem can be drawn
up graphically using pre-defined equations. The constructed model is then optimized
with the objective of minimizing the total annual system cost of the studied energy
system, assuming a surrounding system. For this work, the objective has been to study
the annual net profit generated by investments in energy efficiency and new
technologies at a pulp mill and the effect on global CO2 emissions from these
investments. In this work, changes in the mill‟s energy system due to different
investment options are in focus, and thus flows that are constant for all different options
analysed, such as the pulp production, have been excluded. Hence, the objective
function can schematically be described as follows:
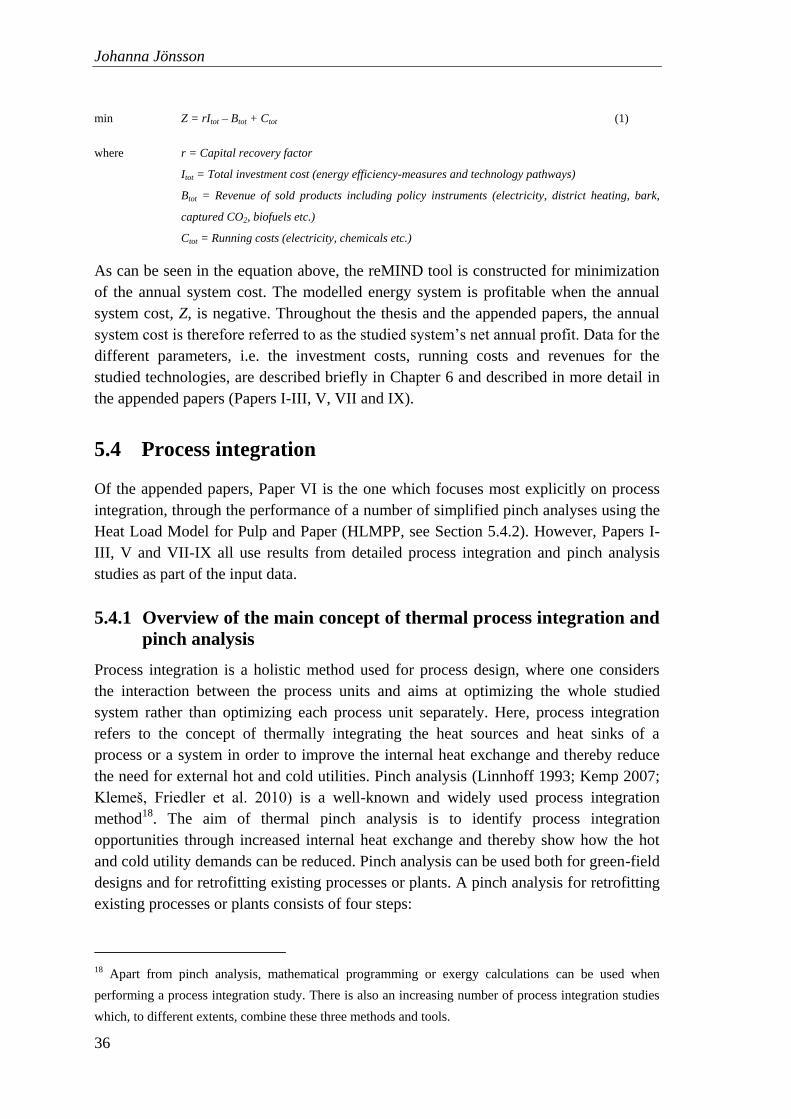
Johanna Jönsson
36
min Z = rItot – Btot + Ctot (1)
where r = Capital recovery factor
Itot = Total investment cost (energy efficiency-measures and technology pathways)
Btot = Revenue of sold products including policy instruments (electricity, district heating, bark,
captured CO2, biofuels etc.)
Ctot = Running costs (electricity, chemicals etc.)
As can be seen in the equation above, the reMIND tool is constructed for minimization
of the annual system cost. The modelled energy system is profitable when the annual
system cost, Z, is negative. Throughout the thesis and the appended papers, the annual
system cost is therefore referred to as the studied system‟s net annual profit. Data for the
different parameters, i.e. the investment costs, running costs and revenues for the
studied technologies, are described briefly in Chapter 6 and described in more detail in
the appended papers (Papers I-III, V, VII and IX).
5.4 Process integration
Of the appended papers, Paper VI is the one which focuses most explicitly on process
integration, through the performance of a number of simplified pinch analyses using the
Heat Load Model for Pulp and Paper (HLMPP, see Section 5.4.2). However, Papers I-
III, V and VII-IX all use results from detailed process integration and pinch analysis
studies as part of the input data.
5.4.1 Overview of the main concept of thermal process integration and
pinch analysis
Process integration is a holistic method used for process design, where one considers
the interaction between the process units and aims at optimizing the whole studied
system rather than optimizing each process unit separately. Here, process integration
refers to the concept of thermally integrating the heat sources and heat sinks of a
process or a system in order to improve the internal heat exchange and thereby reduce
the need for external hot and cold utilities. Pinch analysis (Linnhoff 1993; Kemp 2007;
Klemeš, Friedler et al. 2010) is a well-known and widely used process integration
method18
. The aim of thermal pinch analysis is to identify process integration
opportunities through increased internal heat exchange and thereby show how the hot
and cold utility demands can be reduced. Pinch analysis can be used both for green-field
designs and for retrofitting existing processes or plants. A pinch analysis for retrofitting
existing processes or plants consists of four steps:
18 Apart from pinch analysis, mathematical programming or exergy calculations can be used when
performing a process integration study. There is also an increasing number of process integration studies
which, to different extents, combine these three methods and tools.
Methods, tools and methodology
37
1. Data gathering of stream data for the process and data for the utility system.
2. Targeting, where the hot and cold Composite Curves and the Grand Composite
Curve are established. From these curves the theoretical minimum hot and cold
utility demand can be determined.
3. Mapping of the layout of the existing Heat Exchanger Network (HEN).
4. Retrofit, where the layout of the existing HEN is improved by removing pinch
violations in order to get closer to the targets identified in step 2.
The data gathering (Step 1) has to be performed manually while steps 2-4 can be
performed by using some Pinch Analysis tool. Further, step 1 is usually the most time-
consuming part, sometimes constituting up to 75% of the total analysis time.
5.4.2 The Heat Load Model for Pulp and Paper
The HLMPP is a tool developed for estimating the potential for energy-efficiency
improvements through process integration (Hakala, Manninen et al. 2008; Ruohonen,
Hakala et al. 2009). The HLMPP tool and methodology are based on pinch analysis and
an overview of the four steps comprising an HLMPP analysis is shown in Fig. 6. For
further description of the tool see Section 2.2 in Paper VI.
1. Data
gathering and
data input in
Excel
Example of input data:
- production values
- paper recipies
- fresh hot and warm
water usage
- refinery pressure
- refinery SEC
-etc.
2. Process
calculations
and process
simulation
Using:
- simulation model in
Balas
- MS Excel
- default values
- else
3. Stream data
table containing
all hot and cold
streams
Stream data:
- start and target
temperatures
- ∆Tmin- flows
- etc.
4. Construct the
composite curves
and the grand
composite curve and
analyse the results
Containing:
- minimum hot utility
- minimum cold utility
- Pinch temperature
- etc.
Use stream
data table to..
Use input
data to do...
..which as
output gives..
Figure 6. Overview of the four steps constituting an HLMPP analysis as performed in Paper VI.
Since the stream data used for construction of the Composite Curves and the Grand
Composite Curve are given by process simulation, they do not correspond to the actual
set of existing streams at the studied mill. Due to the same fact, the full process layout
remains unknown, as do the actual locations of streams and heat exchangers – and thus
steps 3 and 4 in a full pinch analysis (Original network design and Retrofit, see Section
5.4.1) cannot be performed. since these steps require good knowledge and data for the
actual physical streams and the existing heat exchanger network. However, considerably
less input data are required to get the complete stream data for an HLMPP analysis than
for a complete pinch analysis. This time-saving characteristic, which is the main
advantage, makes the HLMPP suitable for screening of saving potentials, as when doing
a pre-study or a more aggregated study or when estimating a rough potential for
integration of other, new processes at a mill.
Johanna Jönsson
38
5.5 The methodological approach developed throughout this thesis work
As stated in Chapter 1, the overall aim of this thesis is to evaluate selected technology
pathways for the PPI and the potential for their implementation on a European level.
Since there is no commonly accepted approach for such a study, part of the work for
this thesis was devoted to the development of a methodological approach. The result is
presented below.
The suggested approach is based on earlier research regarding process steam savings
and the effect of implementing selected technology pathways on the energy balance for
different types of mills (Axelsson, Olsson et al. 2006; Axelsson, Olsson et al. 2006;
Olsson, Axelsson et al. 2006; Hektor and Berntsson 2007). In order to estimate the
potential for implementation of the studied technologies in the whole European PPI
stock, this knowledge has been coupled to technical and geographical data for the
European PPI and important European energy and transport infrastructure. For
evaluation of the future performance of different technology options, the approach
assumes earlier research regarding the future development of the energy market.
Consequently, the approach assumes detailed research and is based on bottom-up
thinking whilst estimating the potential on a European level. The approach is carried out
stepwise and an overview of it is presented in Fig. 7. Its different steps are presented
below:
I: External, infrastructural preconditions
These are the characteristics of the geographical area surrounding the mills, e.g. data for
where potential storage sites for CO2 and district heating grids are located.
II: Mill-specific data
Mill-specific data are the characteristics of the individual mills constituting the
European PPI stock. Data included are e.g. technical age of mill and specific mill
equipment, production, fuel usage, process steam demand, CO2 emissions and estimates
of available amounts of excess heat.
III: Potential for energy efficiency and implementation of new technology
The potential for energy efficiency and implementation of new technology pathways at
mill level is based on earlier and on-going research by others as well as by the author of
this thesis. The results from this part typically show the economic performance and
impact on global CO2 emissions for implementation of specific technology pathways in
specific mills. The future economic performance, as well as the global emissions of
CO2, associated with implementation of the different technology pathways are evaluated
by using energy market scenarios: see Section 7.
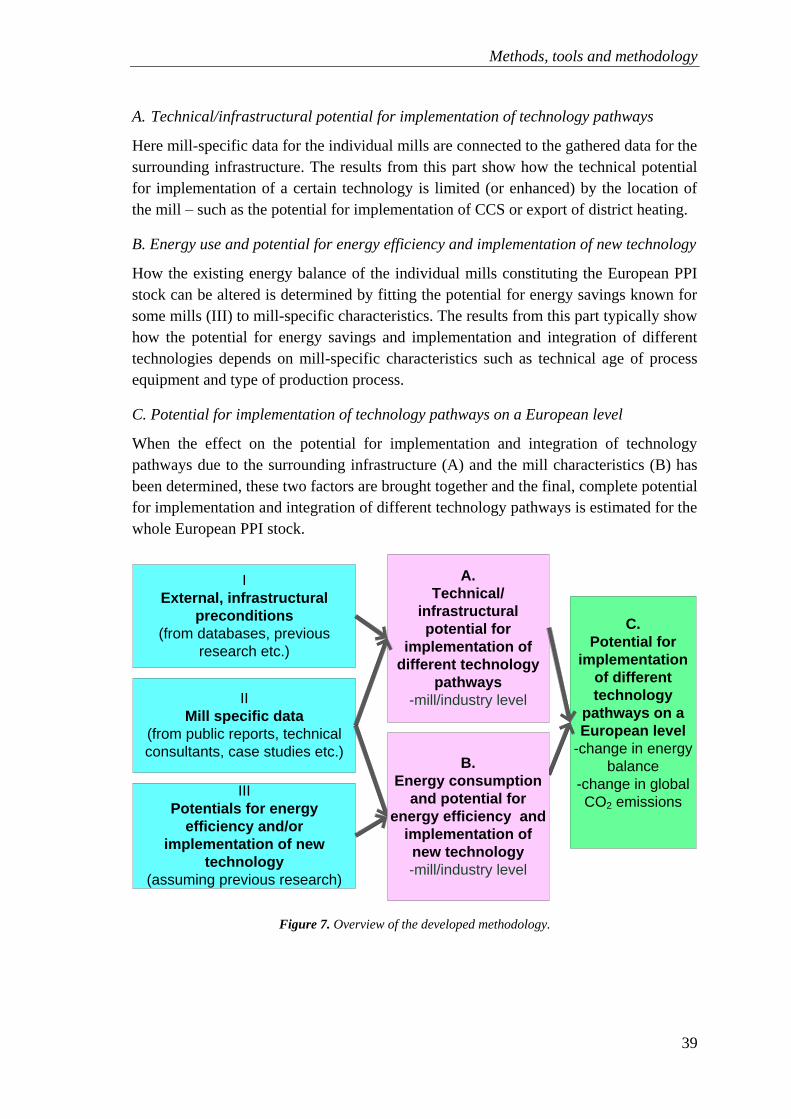
Methods, tools and methodology
39
A. Technical/infrastructural potential for implementation of technology pathways
Here mill-specific data for the individual mills are connected to the gathered data for the
surrounding infrastructure. The results from this part show how the technical potential
for implementation of a certain technology is limited (or enhanced) by the location of
the mill – such as the potential for implementation of CCS or export of district heating.
B. Energy use and potential for energy efficiency and implementation of new technology
How the existing energy balance of the individual mills constituting the European PPI
stock can be altered is determined by fitting the potential for energy savings known for
some mills (III) to mill-specific characteristics. The results from this part typically show
how the potential for energy savings and implementation and integration of different
technologies depends on mill-specific characteristics such as technical age of process
equipment and type of production process.
C. Potential for implementation of technology pathways on a European level
When the effect on the potential for implementation and integration of technology
pathways due to the surrounding infrastructure (A) and the mill characteristics (B) has
been determined, these two factors are brought together and the final, complete potential
for implementation and integration of different technology pathways is estimated for the
whole European PPI stock.
II
Mill specific data
(from public reports, technical
consultants, case studies etc.)
A.
Technical/
infrastructural
potential for
implementation of
different technology
pathways
-mill/industry level
C.
Potential for
implementation
of different
technology
pathways on a
European level
-change in energy
balance
-change in global
CO2 emissions
I
External, infrastructural
preconditions
(from databases, previous
research etc.)
III
Potentials for energy
efficiency and/or
implementation of new
technology
(assuming previous research)
B.
Energy consumption
and potential for
energy efficiency and
implementation of
new technology
-mill/industry level
Figure 7. Overview of the developed methodology.

Johanna Jönsson
40
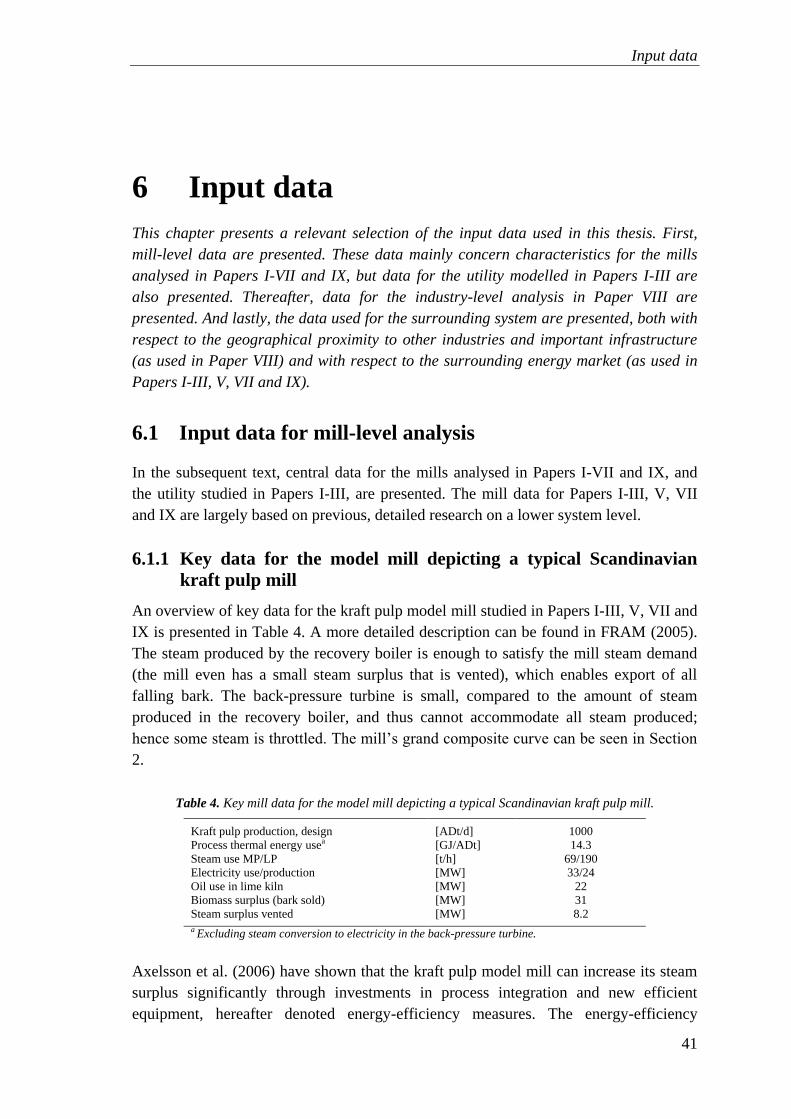
Input data
41
6 Input data
This chapter presents a relevant selection of the input data used in this thesis. First,
mill-level data are presented. These data mainly concern characteristics for the mills
analysed in Papers I-VII and IX, but data for the utility modelled in Papers I-III are
also presented. Thereafter, data for the industry-level analysis in Paper VIII are
presented. And lastly, the data used for the surrounding system are presented, both with
respect to the geographical proximity to other industries and important infrastructure
(as used in Paper VIII) and with respect to the surrounding energy market (as used in
Papers I-III, V, VII and IX).
6.1 Input data for mill-level analysis
In the subsequent text, central data for the mills analysed in Papers I-VII and IX, and
the utility studied in Papers I-III, are presented. The mill data for Papers I-III, V, VII
and IX are largely based on previous, detailed research on a lower system level.
6.1.1 Key data for the model mill depicting a typical Scandinavian
kraft pulp mill
An overview of key data for the kraft pulp model mill studied in Papers I-III, V, VII and
IX is presented in Table 4. A more detailed description can be found in FRAM (2005).
The steam produced by the recovery boiler is enough to satisfy the mill steam demand
(the mill even has a small steam surplus that is vented), which enables export of all
falling bark. The back-pressure turbine is small, compared to the amount of steam
produced in the recovery boiler, and thus cannot accommodate all steam produced;
hence some steam is throttled. The mill‟s grand composite curve can be seen in Section
2.
Table 4. Key mill data for the model mill depicting a typical Scandinavian kraft pulp mill.
Kraft pulp production, design [ADt/d] 1000
Process thermal energy usea [GJ/ADt] 14.3
Steam use MP/LP [t/h] 69/190
Electricity use/production [MW] 33/24
Oil use in lime kiln [MW] 22
Biomass surplus (bark sold) [MW] 31
Steam surplus vented [MW] 8.2
a Excluding steam conversion to electricity in the back-pressure turbine.
Axelsson et al. (2006) have shown that the kraft pulp model mill can increase its steam
surplus significantly through investments in process integration and new efficient
equipment, hereafter denoted energy-efficiency measures. The energy-efficiency
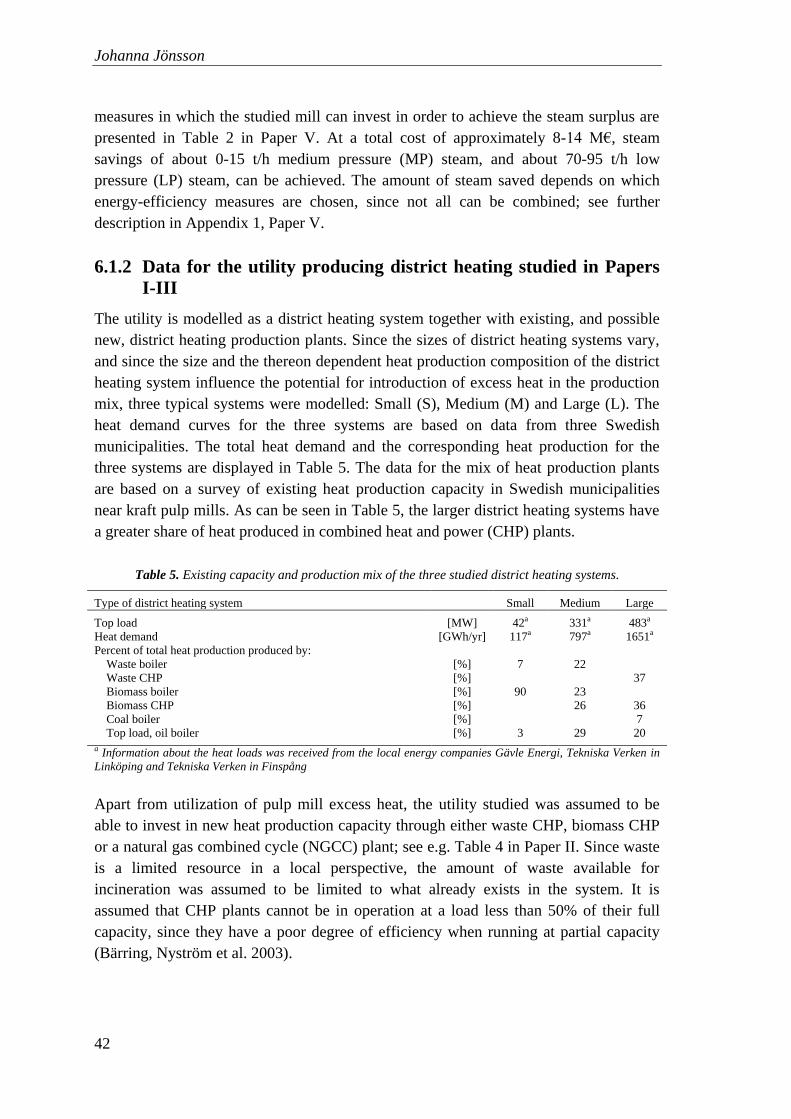
Johanna Jönsson
42
measures in which the studied mill can invest in order to achieve the steam surplus are
presented in Table 2 in Paper V. At a total cost of approximately 8-14 M€, steam
savings of about 0-15 t/h medium pressure (MP) steam, and about 70-95 t/h low
pressure (LP) steam, can be achieved. The amount of steam saved depends on which
energy-efficiency measures are chosen, since not all can be combined; see further
description in Appendix 1, Paper V.
6.1.2 Data for the utility producing district heating studied in Papers
I-III
The utility is modelled as a district heating system together with existing, and possible
new, district heating production plants. Since the sizes of district heating systems vary,
and since the size and the thereon dependent heat production composition of the district
heating system influence the potential for introduction of excess heat in the production
mix, three typical systems were modelled: Small (S), Medium (M) and Large (L). The
heat demand curves for the three systems are based on data from three Swedish
municipalities. The total heat demand and the corresponding heat production for the
three systems are displayed in Table 5. The data for the mix of heat production plants
are based on a survey of existing heat production capacity in Swedish municipalities
near kraft pulp mills. As can be seen in Table 5, the larger district heating systems have
a greater share of heat produced in combined heat and power (CHP) plants.
Table 5. Existing capacity and production mix of the three studied district heating systems.
Type of district heating system Small Medium Large
Top load [MW] 42a 331a 483a
Heat demand [GWh/yr] 117a 797a 1651a
Percent of total heat production produced by:
Waste boiler [%] 7 22
Waste CHP [%] 37
Biomass boiler [%] 90 23
Biomass CHP [%] 26 36
Coal boiler [%] 7
Top load, oil boiler [%] 3 29 20
a Information about the heat loads was received from the local energy companies Gävle Energi, Tekniska Verken in
Linköping and Tekniska Verken in Finspång
Apart from utilization of pulp mill excess heat, the utility studied was assumed to be
able to invest in new heat production capacity through either waste CHP, biomass CHP
or a natural gas combined cycle (NGCC) plant; see e.g. Table 4 in Paper II. Since waste
is a limited resource in a local perspective, the amount of waste available for
incineration was assumed to be limited to what already exists in the system. It is
assumed that CHP plants cannot be in operation at a load less than 50% of their full
capacity, since they have a poor degree of efficiency when running at partial capacity
(Bärring, Nyström et al. 2003).
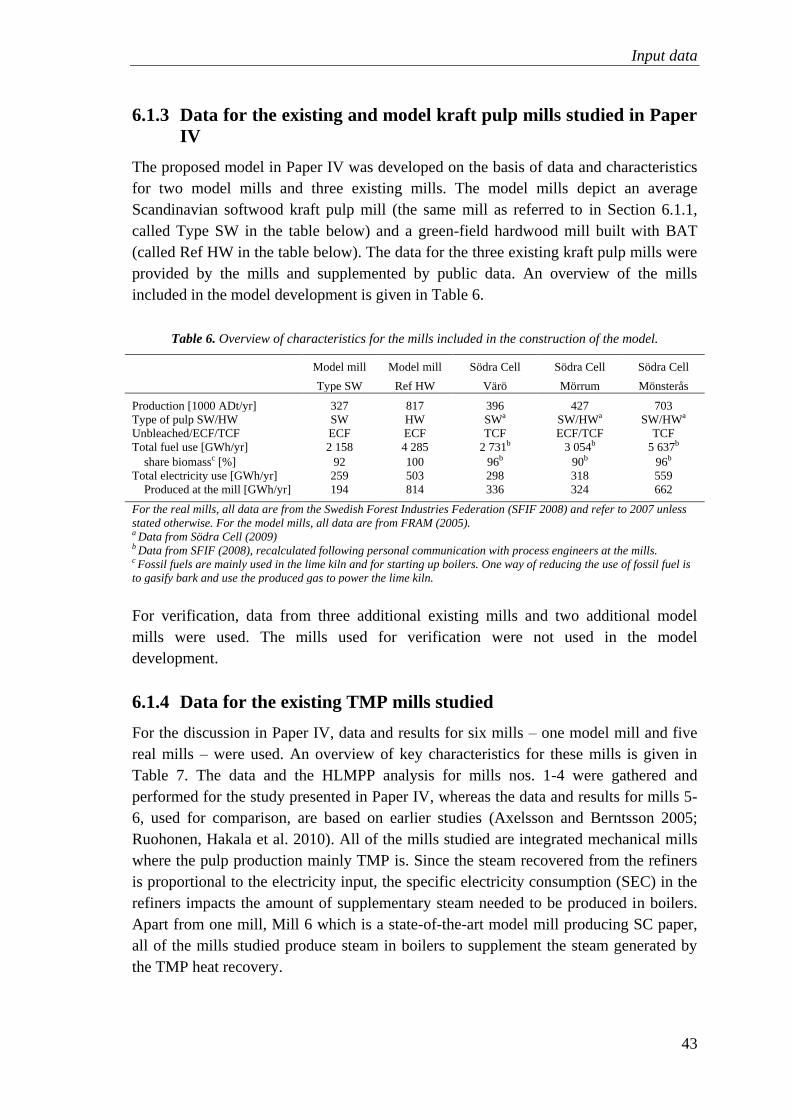
Input data
43
6.1.3 Data for the existing and model kraft pulp mills studied in Paper
IV
The proposed model in Paper IV was developed on the basis of data and characteristics
for two model mills and three existing mills. The model mills depict an average
Scandinavian softwood kraft pulp mill (the same mill as referred to in Section 6.1.1,
called Type SW in the table below) and a green-field hardwood mill built with BAT
(called Ref HW in the table below). The data for the three existing kraft pulp mills were
provided by the mills and supplemented by public data. An overview of the mills
included in the model development is given in Table 6.
Table 6. Overview of characteristics for the mills included in the construction of the model.
Model mill
Type SW
Model mill
Ref HW
Södra Cell
Värö
Södra Cell
Mörrum
Södra Cell
Mönsterås
Production [1000 ADt/yr] 327 817 396 427 703
Type of pulp SW/HW SW HW SWa SW/HWa SW/HWa
Unbleached/ECF/TCF ECF ECF TCF ECF/TCF TCF
Total fuel use [GWh/yr] 2 158 4 285 2 731b 3 054b 5 637b
share biomassc [%] 92 100 96b 90b 96b
Total electricity use [GWh/yr] 259 503 298 318 559
Produced at the mill [GWh/yr] 194 814 336 324 662
For the real mills, all data are from the Swedish Forest Industries Federation (SFIF 2008) and refer to 2007 unless
stated otherwise. For the model mills, all data are from FRAM (2005). a Data from Södra Cell (2009)
b Data from SFIF (2008), recalculated following personal communication with process engineers at the mills. c Fossil fuels are mainly used in the lime kiln and for starting up boilers. One way of reducing the use of fossil fuel is
to gasify bark and use the produced gas to power the lime kiln.
For verification, data from three additional existing mills and two additional model
mills were used. The mills used for verification were not used in the model
development.
6.1.4 Data for the existing TMP mills studied
For the discussion in Paper IV, data and results for six mills – one model mill and five
real mills – were used. An overview of key characteristics for these mills is given in
Table 7. The data and the HLMPP analysis for mills nos. 1-4 were gathered and
performed for the study presented in Paper IV, whereas the data and results for mills 5-
6, used for comparison, are based on earlier studies (Axelsson and Berntsson 2005;
Ruohonen, Hakala et al. 2010). All of the mills studied are integrated mechanical mills
where the pulp production mainly TMP is. Since the steam recovered from the refiners
is proportional to the electricity input, the specific electricity consumption (SEC) in the
refiners impacts the amount of supplementary steam needed to be produced in boilers.
Apart from one mill, Mill 6 which is a state-of-the-art model mill producing SC paper,
all of the mills studied produce steam in boilers to supplement the steam generated by
the TMP heat recovery.
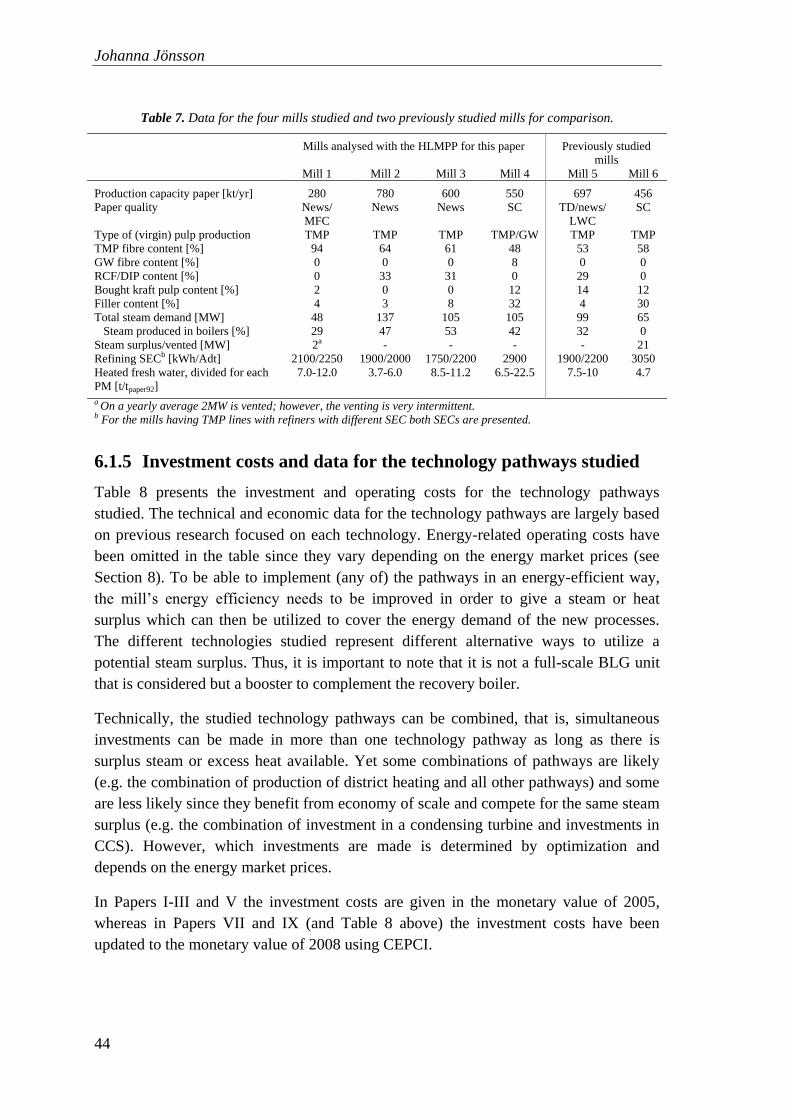
Johanna Jönsson
44
Table 7. Data for the four mills studied and two previously studied mills for comparison.
Mills analysed with the HLMPP for this paper Previously studied
mills
Mill 1 Mill 2 Mill 3 Mill 4 Mill 5 Mill 6
Production capacity paper [kt/yr] 280 780 600 550 697 456
Paper quality News/
MFC
News News SC TD/news/
LWC
SC
Type of (virgin) pulp production TMP TMP TMP TMP/GW TMP TMP
TMP fibre content [%] 94 64 61 48 53 58
GW fibre content [%] 0 0 0 8 0 0
RCF/DIP content [%] 0 33 31 0 29 0
Bought kraft pulp content [%] 2 0 0 12 14 12
Filler content [%] 4 3 8 32 4 30
Total steam demand [MW] 48 137 105 105 99 65
Steam produced in boilers [%] 29 47 53 42 32 0
Steam surplus/vented [MW] 2a - - - - 21
Refining SECb [kWh/Adt] 2100/2250 1900/2000 1750/2200 2900 1900/2200 3050
Heated fresh water, divided for each
PM [t/tpaper92]
7.0-12.0 3.7-6.0 8.5-11.2 6.5-22.5 7.5-10 4.7
a On a yearly average 2MW is vented; however, the venting is very intermittent. b For the mills having TMP lines with refiners with different SEC both SECs are presented.
6.1.5 Investment costs and data for the technology pathways studied
Table 8 presents the investment and operating costs for the technology pathways
studied. The technical and economic data for the technology pathways are largely based
on previous research focused on each technology. Energy-related operating costs have
been omitted in the table since they vary depending on the energy market prices (see
Section 8). To be able to implement (any of) the pathways in an energy-efficient way,
the mill‟s energy efficiency needs to be improved in order to give a steam or heat
surplus which can then be utilized to cover the energy demand of the new processes.
The different technologies studied represent different alternative ways to utilize a
potential steam surplus. Thus, it is important to note that it is not a full-scale BLG unit
that is considered but a booster to complement the recovery boiler.
Technically, the studied technology pathways can be combined, that is, simultaneous
investments can be made in more than one technology pathway as long as there is
surplus steam or excess heat available. Yet some combinations of pathways are likely
(e.g. the combination of production of district heating and all other pathways) and some
are less likely since they benefit from economy of scale and compete for the same steam
surplus (e.g. the combination of investment in a condensing turbine and investments in
CCS). However, which investments are made is determined by optimization and
depends on the energy market prices.
In Papers I-III and V the investment costs are given in the monetary value of 2005,
whereas in Papers VII and IX (and Table 8 above) the investment costs have been
updated to the monetary value of 2008 using CEPCI.

Input data
45
Table 8. Summary of investment and operating costs for the units needed for implementation of the
technology pathways studied.
Investment and operating costsa
Based on
BLGMF/BLGMF with CO2 separationb 7055BL0,6 M€, 9.7 k€/yr/BL Ekbom et al. 2005
BLGCCb,c 5952BL0,6 M€, 1.0 k€/yr/BL KAM 2003
BLGCCb,c with CO2 separation 6365BL0,6 M€, 1.0 k€/yr/BL KAM 2003,Ekbom et al. 2005
Lignin extraction plantd 7.2LR0,6 M€, 5.8 €/MWh Olsson et al. 2006
Back-pressure steam turbinee 1.3P0,6 M€ Olsson et al. 2006
Condensing steam turbinee 2.4P0,6 M€
CO2 separation plant for RB flue gasesf, g 2.3CO2 0.7, 4% of investment cost Hektor and Berntsson 2007
CO2 compressorf, h 1.1P0.7, 4% of investment cost
Transportation and storage of CO2 8 €/t
Heat pump for DHi 0.11Q M€ Bengtsson 2004
Heat exchanger steam-DHi 0.68+0.033Q M€
Heat exchanger heat-DHi 0.059+0.042Q M€
a All values in 2008 money value. All investment costs have been recalculated to 2008 money value using Chemical
Engineering’s Plant Cost Index (CEPCI). b BL refers to the flow of black liquor in MW. c Excluding the steam turbine/s. d LR refers to the lignin extraction rate in kg/s. e P refers to the power output in MW. f Operating cost CO2 absorber and CO2 compressor; 4% of investment cost. g CO2 refers to the CO2 capture rate in kg/s. h P is the compressor electricity demand. i Q refers to the heat supplied by the heat pump or heat exchanged in the heat exchanger in MW.
6.2 Input data for industry level analysis
As previously stated, the European pulp and paper industry is defined as mills located in
the countries that are included in CEPI (CEPI 2008), i.e. the countries in Europe with
the highest density of pulp and paper industry. However, the European PPI is currently
in a situation where many (small) less profitable mills are decommissioned (CEPI
2011). Thus, not all of the mills in production today will still be in production at the
time when pathways such as CCS or BLG will be commercially available. To take
account of this fact, a selection of mills to be included was made together with PPI
consultants from Pöyry. Thereby 171 mills were selected and included, based on their
competitive strength and size. Five more mills were then added due to their large size
and good availability of data. Hence, here the European PPI is represented by 55 kraft
pulp and/or paper mills, 45 mechanical pulp and paper mills, and 76 paper mills without
any virgin pulp production (having only bought pulp and/or RCF/DIP). Data for the
included mills are presented in Table 9. Due to the large amount of mills included in the
study, the data are presented in aggregated form. As can be seen in the table, a large
share of the CEPI pulp production and a fair share of CEPI paper production are
covered by the included mills.
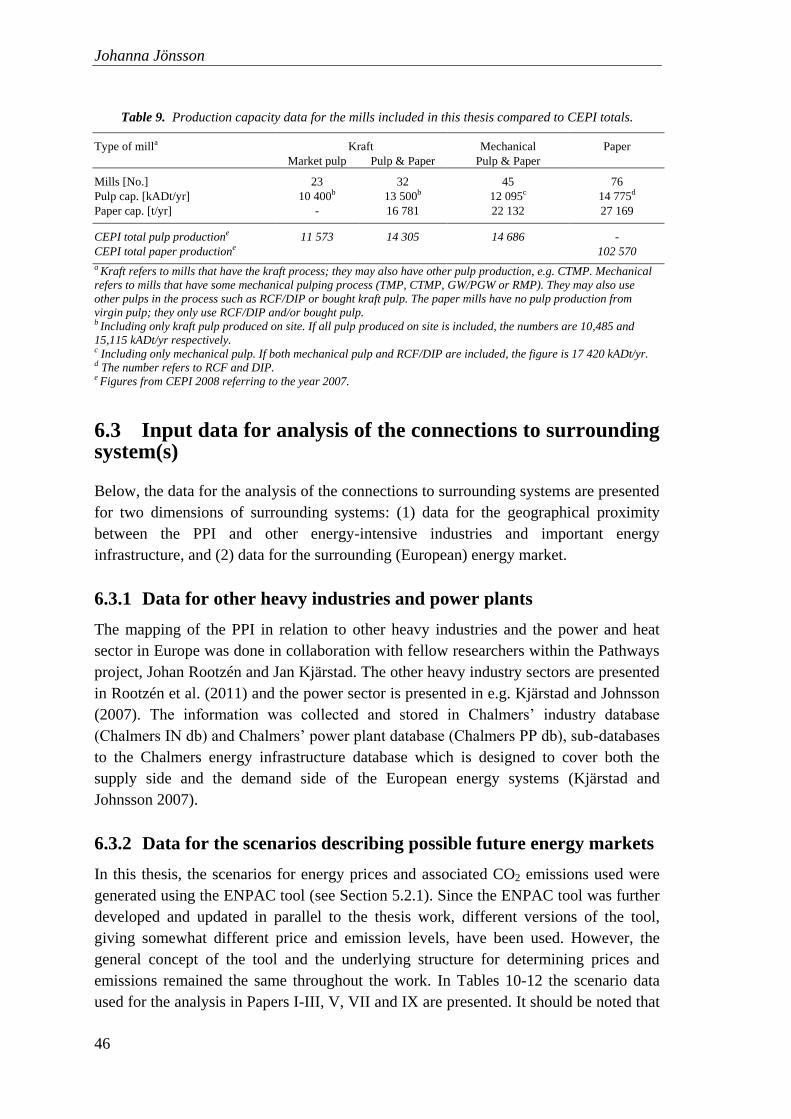
Johanna Jönsson
46
Table 9. Production capacity data for the mills included in this thesis compared to CEPI totals.
Type of milla Kraft Mechanical Paper
Market pulp Pulp & Paper Pulp & Paper
Mills [No.] 23 32 45 76
Pulp cap. [kADt/yr] 10 400b 13 500b 12 095c 14 775d
Paper cap. [t/yr] - 16 781 22 132 27 169
CEPI total pulp productione 11 573 14 305 14 686 -
CEPI total paper productione 102 570
a Kraft refers to mills that have the kraft process; they may also have other pulp production, e.g. CTMP. Mechanical
refers to mills that have some mechanical pulping process (TMP, CTMP, GW/PGW or RMP). They may also use
other pulps in the process such as RCF/DIP or bought kraft pulp. The paper mills have no pulp production from
virgin pulp; they only use RCF/DIP and/or bought pulp. b Including only kraft pulp produced on site. If all pulp produced on site is included, the numbers are 10,485 and
15,115 kADt/yr respectively. c Including only mechanical pulp. If both mechanical pulp and RCF/DIP are included, the figure is 17 420 kADt/yr. d The number refers to RCF and DIP. e Figures from CEPI 2008 referring to the year 2007.
6.3 Input data for analysis of the connections to surrounding system(s)
Below, the data for the analysis of the connections to surrounding systems are presented
for two dimensions of surrounding systems: (1) data for the geographical proximity
between the PPI and other energy-intensive industries and important energy
infrastructure, and (2) data for the surrounding (European) energy market.
6.3.1 Data for other heavy industries and power plants
The mapping of the PPI in relation to other heavy industries and the power and heat
sector in Europe was done in collaboration with fellow researchers within the Pathways
project, Johan Rootzén and Jan Kjärstad. The other heavy industry sectors are presented
in Rootzén et al. (2011) and the power sector is presented in e.g. Kjärstad and Johnsson
(2007). The information was collected and stored in Chalmers‟ industry database
(Chalmers IN db) and Chalmers‟ power plant database (Chalmers PP db), sub-databases
to the Chalmers energy infrastructure database which is designed to cover both the
supply side and the demand side of the European energy systems (Kjärstad and
Johnsson 2007).
6.3.2 Data for the scenarios describing possible future energy markets
In this thesis, the scenarios for energy prices and associated CO2 emissions used were
generated using the ENPAC tool (see Section 5.2.1). Since the ENPAC tool was further
developed and updated in parallel to the thesis work, different versions of the tool,
giving somewhat different price and emission levels, have been used. However, the
general concept of the tool and the underlying structure for determining prices and
emissions remained the same throughout the work. In Tables 10-12 the scenario data
used for the analysis in Papers I-III, V, VII and IX are presented. It should be noted that
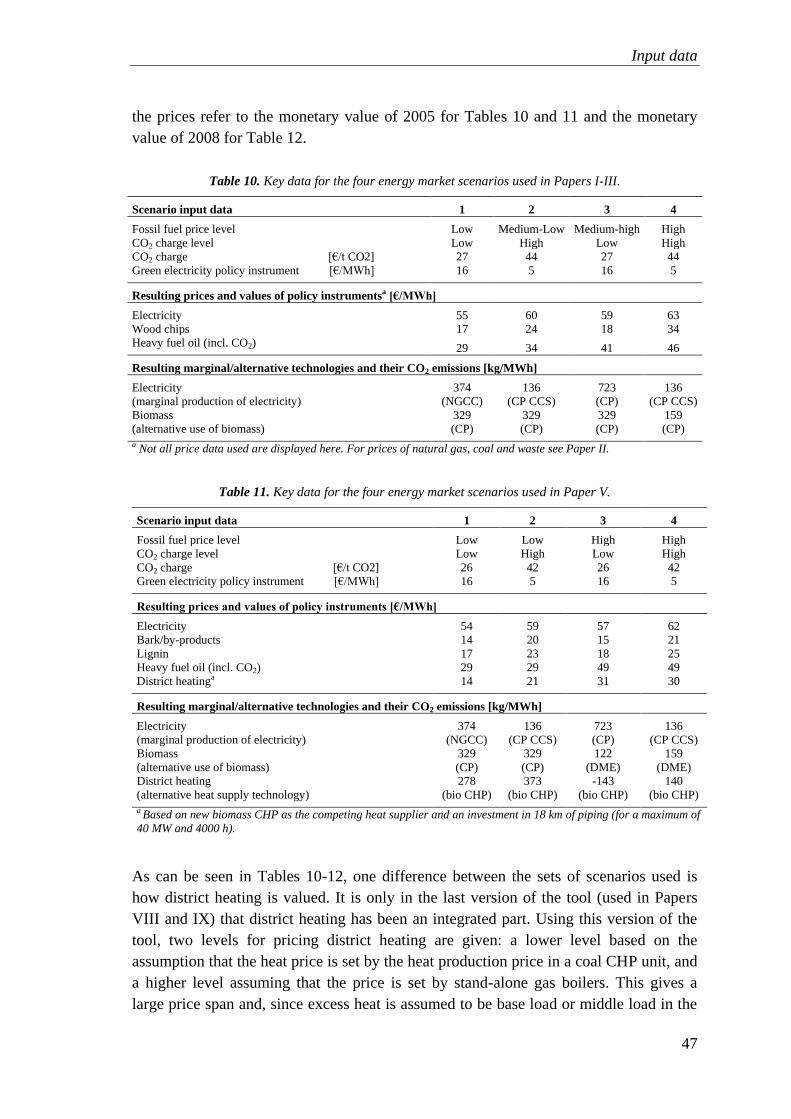
Input data
47
the prices refer to the monetary value of 2005 for Tables 10 and 11 and the monetary
value of 2008 for Table 12.
Table 10. Key data for the four energy market scenarios used in Papers I-III.
Scenario input data 1 2 3 4
Fossil fuel price level Low Medium-Low Medium-high High
CO2 charge level Low High Low High
CO2 charge [€/t CO2] 27 44 27 44
Green electricity policy instrument [€/MWh] 16 5 16 5
Resulting prices and values of policy instrumentsa [€/MWh]
Electricity 55 60 59 63
Wood chips 17 24 18 34
Heavy fuel oil (incl. CO2) 29 34 41 46
Resulting marginal/alternative technologies and their CO2 emissions [kg/MWh]
Electricity
(marginal production of electricity)
374
(NGCC)
136
(CP CCS)
723
(CP)
136
(CP CCS)
Biomass
(alternative use of biomass)
329
(CP)
329
(CP)
329
(CP)
159
(CP)
a Not all price data used are displayed here. For prices of natural gas, coal and waste see Paper II.
Table 11. Key data for the four energy market scenarios used in Paper V.
Scenario input data 1 2 3 4
Fossil fuel price level Low Low High High
CO2 charge level Low High Low High
CO2 charge [€/t CO2] 26 42 26 42
Green electricity policy instrument [€/MWh] 16 5 16 5
Resulting prices and values of policy instruments [€/MWh]
Electricity 54 59 57 62
Bark/by-products 14 20 15 21
Lignin 17 23 18 25
Heavy fuel oil (incl. CO2) 29 29 49 49
District heatinga 14 21 31 30
Resulting marginal/alternative technologies and their CO2 emissions [kg/MWh]
Electricity
(marginal production of electricity)
374
(NGCC)
136
(CP CCS)
723
(CP)
136
(CP CCS)
Biomass
(alternative use of biomass)
329
(CP)
329
(CP)
122
(DME)
159
(DME)
District heating
(alternative heat supply technology)
278
(bio CHP)
373
(bio CHP)
-143
(bio CHP)
140
(bio CHP)
a Based on new biomass CHP as the competing heat supplier and an investment in 18 km of piping (for a maximum of
40 MW and 4000 h).
As can be seen in Tables 10-12, one difference between the sets of scenarios used is
how district heating is valued. It is only in the last version of the tool (used in Papers
VIII and IX) that district heating has been an integrated part. Using this version of the
tool, two levels for pricing district heating are given: a lower level based on the
assumption that the heat price is set by the heat production price in a coal CHP unit, and
a higher level assuming that the price is set by stand-alone gas boilers. This gives a
large price span and, since excess heat is assumed to be base load or middle load in the
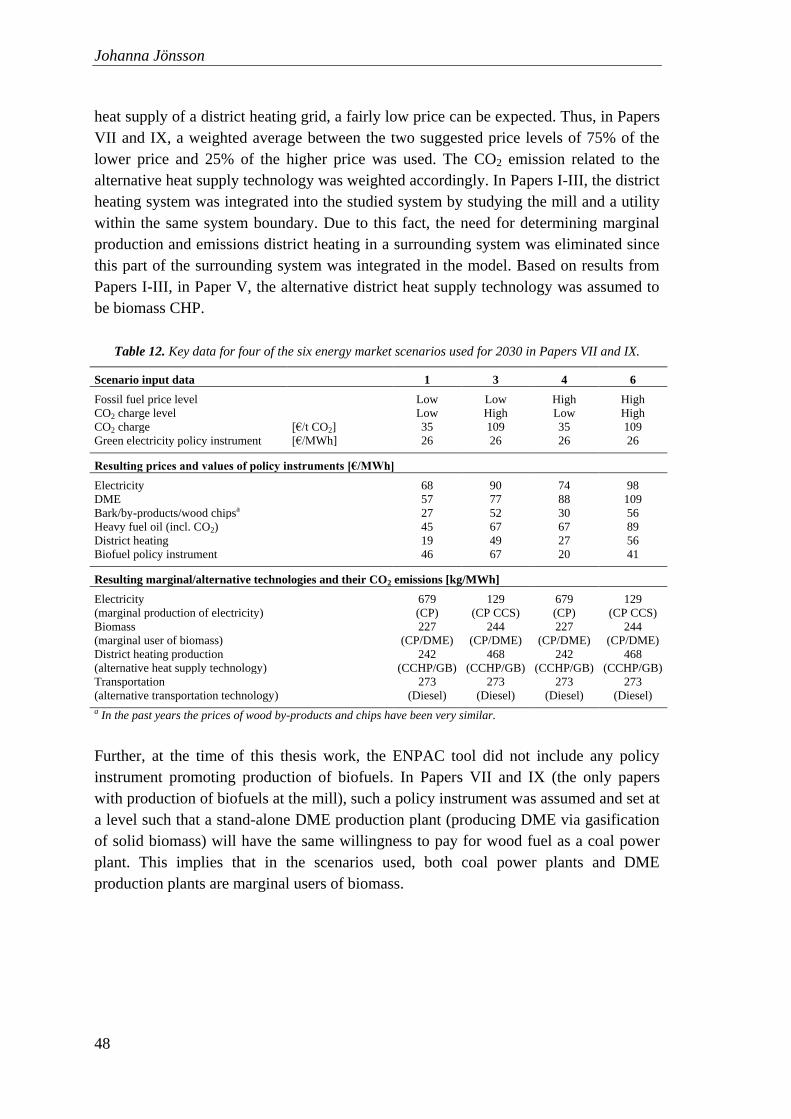
Johanna Jönsson
48
heat supply of a district heating grid, a fairly low price can be expected. Thus, in Papers
VII and IX, a weighted average between the two suggested price levels of 75% of the
lower price and 25% of the higher price was used. The CO2 emission related to the
alternative heat supply technology was weighted accordingly. In Papers I-III, the district
heating system was integrated into the studied system by studying the mill and a utility
within the same system boundary. Due to this fact, the need for determining marginal
production and emissions district heating in a surrounding system was eliminated since
this part of the surrounding system was integrated in the model. Based on results from
Papers I-III, in Paper V, the alternative district heat supply technology was assumed to
be biomass CHP.
Table 12. Key data for four of the six energy market scenarios used for 2030 in Papers VII and IX.
Scenario input data 1 3 4 6
Fossil fuel price level Low Low High High
CO2 charge level Low High Low High
CO2 charge [€/t CO2] 35 109 35 109
Green electricity policy instrument [€/MWh] 26 26 26 26
Resulting prices and values of policy instruments [€/MWh]
Electricity 68 90 74 98
DME 57 77 88 109
Bark/by-products/wood chipsa 27 52 30 56
Heavy fuel oil (incl. CO2) 45 67 67 89
District heating 19 49 27 56
Biofuel policy instrument 46 67 20 41
Resulting marginal/alternative technologies and their CO2 emissions [kg/MWh]
Electricity
(marginal production of electricity)
679
(CP)
129
(CP CCS)
679
(CP)
129
(CP CCS)
Biomass
(marginal user of biomass)
227
(CP/DME)
244
(CP/DME)
227
(CP/DME)
244
(CP/DME)
District heating production
(alternative heat supply technology)
242
(CCHP/GB)
468
(CCHP/GB)
242
(CCHP/GB)
468
(CCHP/GB)
Transportation
(alternative transportation technology)
273
(Diesel)
273
(Diesel)
273
(Diesel)
273
(Diesel)
a In the past years the prices of wood by-products and chips have been very similar.
Further, at the time of this thesis work, the ENPAC tool did not include any policy
instrument promoting production of biofuels. In Papers VII and IX (the only papers
with production of biofuels at the mill), such a policy instrument was assumed and set at
a level such that a stand-alone DME production plant (producing DME via gasification
of solid biomass) will have the same willingness to pay for wood fuel as a coal power
plant. This implies that in the scenarios used, both coal power plants and DME
production plants are marginal users of biomass.
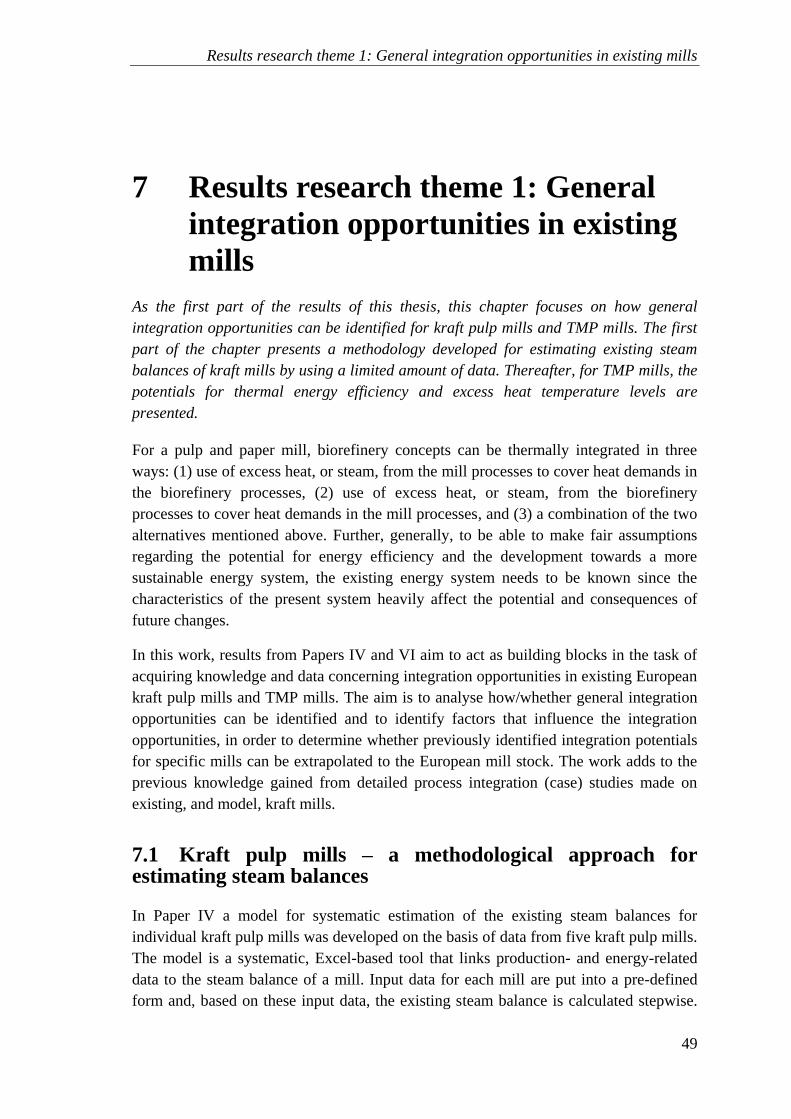
Results research theme 1: General integration opportunities in existing mills
49
7 Results research theme 1: General
integration opportunities in existing
mills
As the first part of the results of this thesis, this chapter focuses on how general
integration opportunities can be identified for kraft pulp mills and TMP mills. The first
part of the chapter presents a methodology developed for estimating existing steam
balances of kraft mills by using a limited amount of data. Thereafter, for TMP mills, the
potentials for thermal energy efficiency and excess heat temperature levels are
presented.
For a pulp and paper mill, biorefinery concepts can be thermally integrated in three
ways: (1) use of excess heat, or steam, from the mill processes to cover heat demands in
the biorefinery processes, (2) use of excess heat, or steam, from the biorefinery
processes to cover heat demands in the mill processes, and (3) a combination of the two
alternatives mentioned above. Further, generally, to be able to make fair assumptions
regarding the potential for energy efficiency and the development towards a more
sustainable energy system, the existing energy system needs to be known since the
characteristics of the present system heavily affect the potential and consequences of
future changes.
In this work, results from Papers IV and VI aim to act as building blocks in the task of
acquiring knowledge and data concerning integration opportunities in existing European
kraft pulp mills and TMP mills. The aim is to analyse how/whether general integration
opportunities can be identified and to identify factors that influence the integration
opportunities, in order to determine whether previously identified integration potentials
for specific mills can be extrapolated to the European mill stock. The work adds to the
previous knowledge gained from detailed process integration (case) studies made on
existing, and model, kraft mills.
7.1 Kraft pulp mills – a methodological approach for estimating steam balances
In Paper IV a model for systematic estimation of the existing steam balances for
individual kraft pulp mills was developed on the basis of data from five kraft pulp mills.
The model is a systematic, Excel-based tool that links production- and energy-related
data to the steam balance of a mill. Input data for each mill are put into a pre-defined
form and, based on these input data, the existing steam balance is calculated stepwise.

Johanna Jönsson
50
The term „steam balance‟ refers to the amount of high-pressure (HP) steam produced,
process steam consumed at different pressure levels (HP, MP2, MP and LP), throttled
steam, steam through back-pressure and condensing turbines, vented steam and steam
used for the production of sold heat.
Throughout the model development process, emphasis was put on the trade-off between
simplicity of the model, e.g. by limiting the amount of input data needed to just data that
are either publicly available or can be easily obtained, and accuracy, checked by
comparing model results with real mill data. The model was developed by using a
systematic step-by-step approach based on (1) detailed energy balances of model kraft
pulp mills and real kraft pulp mills, (2) public mill data for production, energy and
electricity, and (3) previous research and case studies regarding energy efficiency and
new technology solutions.
Fig. 8 shows how the data needed to estimate the steam balance of a mill were identified
through identification of factors influencing the steam balance and identification of the
relationships between these factors and specific mill data. These factors and
relationships are further described in Paper IV.
Model
Assessing steam and energy
balance for a kraft pulp mill
Results
Relationship-analysis
Identification of important factors
Model development
Applying the model to get results
Verifying the model by comparison of
results with real, detailed, mill data
Work by
author
Previous case and
model mill studies
Detailed mill steam and
energy balances for the
mills included in the
model development
Public, and easily
accessible, data
Mills NOT included in
model development
Work by
others/
Input data
Assessment of key-factors
Detailed mill steam and
energy balances
Mills NOT included in the
model development
Public, and easily
accessible, data for the
mills included in
model development
Figure 8. Description of the methodological approach developed for estimation of kraft pulp mill steam
balances. The black arrows show the process of model developments and the green arrows and the red
dotted arrows show the process of applying the model to generate results and perform validation.
To evaluate the proposed model, the results obtained with it were compared to actual
data for the five mills included in the model development as well as six additional mills
not included. Fig. 9 presents the comparison for the total steam production and the
steam use at different pressure levels. As can be seen, the model gives a fair estimate of
the steam use at different pressure levels. The largest difference between model values
and real values was obtained for the estimated MP steam use for mills with low total
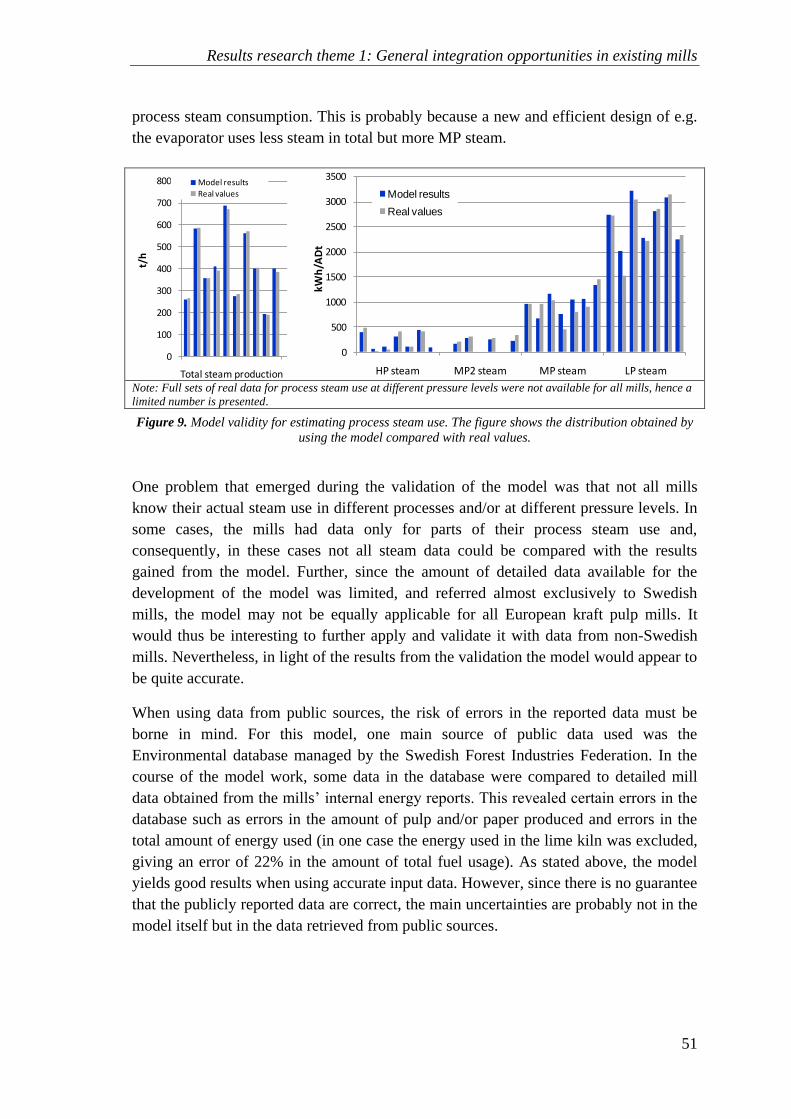
Results research theme 1: General integration opportunities in existing mills
51
process steam consumption. This is probably because a new and efficient design of e.g.
the evaporator uses less steam in total but more MP steam.
0
100
200
300
400
500
600
700
800
Total steam production
t/h
Model results
Real values
0
500
1000
1500
2000
2500
3000
3500
HP steam MP2 steam MP steam LP steam
kWh
/AD
t
Model results
Real values
Note: Full sets of real data for process steam use at different pressure levels were not available for all mills, hence a
limited number is presented.
Figure 9. Model validity for estimating process steam use. The figure shows the distribution obtained by
using the model compared with real values.
One problem that emerged during the validation of the model was that not all mills
know their actual steam use in different processes and/or at different pressure levels. In
some cases, the mills had data only for parts of their process steam use and,
consequently, in these cases not all steam data could be compared with the results
gained from the model. Further, since the amount of detailed data available for the
development of the model was limited, and referred almost exclusively to Swedish
mills, the model may not be equally applicable for all European kraft pulp mills. It
would thus be interesting to further apply and validate it with data from non-Swedish
mills. Nevertheless, in light of the results from the validation the model would appear to
be quite accurate.
When using data from public sources, the risk of errors in the reported data must be
borne in mind. For this model, one main source of public data used was the
Environmental database managed by the Swedish Forest Industries Federation. In the
course of the model work, some data in the database were compared to detailed mill
data obtained from the mills‟ internal energy reports. This revealed certain errors in the
database such as errors in the amount of pulp and/or paper produced and errors in the
total amount of energy used (in one case the energy used in the lime kiln was excluded,
giving an error of 22% in the amount of total fuel usage). As stated above, the model
yields good results when using accurate input data. However, since there is no guarantee
that the publicly reported data are correct, the main uncertainties are probably not in the
model itself but in the data retrieved from public sources.
Johanna Jönsson
52
7.1.1 Summary of conclusions from this sub-chapter
From this work regarding the development of a methodology developed for estimating
existing steam balances of kraft mills using limited amounts of data, the following
conclusions can be drawn:
The minimum amount of data needed to estimate the steam balance of a kraft
pulp mill is data for production, fuel usage, power balance, heat sales, recovery
boiler steam pressure, and pressure of steam used for soot blowing.
Using this limited amount of data the developed model gives a fair estimate of
the steam balance of a kraft pulp mill, e.g. the model accuracy for total steam
production is +/- 8%.
If data were available, the model could be developed further to include an
assessment of the steam use in different processes in order, for example, to
calculate the potential for introducing new, efficient technology solutions, such
as lignin extraction and black liquor gasification.
The key factor for a good, accurate analysis on a more aggregated level is the
availability and accuracy of input data.
7.2 The mechanical pulp and paper industry – potential for increased thermal energy efficiency in TMP mills
In Paper VI, the potential for steam savings is identified together with excess heat
temperature levels for four Scandinavian TMP mills by using the HLMPP (see Section
5.4.2 for description of the HLMPP tool). The results are compared with similar results
from previous studies for two other TMP mills. The main results are presented in Table
13, Fig. 10 and Fig 11.
As can be seen in Table 13, the theoretical potential for steam savings for the four mills
studied ranges between 2 and 20%. These levels of steam savings are comparable to the
levels previously identified for TMP mills; see Mills 5-6. However, as can also be seen,
both the current steam use and the amount of theoretical steam savings identified vary a
lot between the mills.
In Fig. 10 it can be seen that, in general, there is excess heat available but it has a rather
low temperature. Only one mill has a pinch temperature >80°C and that is a state-of-the-
art model mill. Furthermore, it can be seen that two of the mills, Mill 4 and Mill 5, only
have a heating demand and thus their Grand Composite Curves are un-pinched. For
these two mills the heat demand curve starts close to 0°C; this indicates a high water
usage and, hence, some of the fresh water, heated to a rather moderate temperature
level, will be heated using external hot utility (steam). Finally, from the Grand
Composite Curves, it can also be seen that for Mills 1-3 there is a small temperature
span between the heating demand and the cooling demand just around the pinch point.
This indicates that implementation of a heat pump could be of interest since heat from
Results research theme 1: General integration opportunities in existing mills
53
below the pinch could be raised to a temperature above the pinch with a small
temperature lift, saving additional 2-12 MW of steam for Mills 1-3, corresponding to
~7-8% of the mills‟ original steam consumption.
Table 13. Overview of main results in form of steam-saving potentials and excess heat temperature levels
for the four mills analysed and two previously studied mills for comparison.
Mills analysed with the HLMPP for this thesis Previously studied
mills
Mill 1 Mill 2 Mill 3 Mill 4 Mill 5 Mill 6
Original steam demand [MW] 48 137 105 105 99 65
[kW/tpaper92] 66.3 53.4 62.6 77.2 51.1 49.4
Theoretical savings potential [MW] 9.7 2.9 5.1 20.7 9.0 3.4
[kW/tpaper92] 13.4 1.1 3.1 15.2 4.6 2.6
[%] 20 2 5 20 9 5
Hot water (>80°C) available [MW]
[kW/tpaper92]
0
0
0
0
0
0
0
0
0
0
4.0
3.1
Pinch temperature [°C] 65 72 65 0a 0a 117
aIf maximum heat recovery is achieved; these mills have only a heating demand and no cooling demand. This is
shown by un-pinched Grand Composite Curves in Fig. 10 and thus the temperature is not a pinch temperature but
the starting temperature for the heat demand curve.
It should be noted that the discussion presented above is based on the Grand Composite
Curves showing the situation for the case of minimum theoretical steam consumption. If
no retrofit measures are made, the mills will have higher steam consumption and the
Grand Composite Curves will not look the same. However, an analysis showed that, if a
global ∆T is set and adjusted so that the steam demand in the GCC corresponds to the
current steam demand, the pinch temperature remains low, between 18°C and 62°C, and
thus the discussion above can be assumed to be valid also if no retrofit measures to
achieve a lower steam consumption are made.
To be able to draw some general conclusions regarding the steam use and the potential
for steam savings, an analysis was made to try to identify any relationship between
steam use and the potential for steam savings and other important process parameters.
The parameters studied were: (1) Technical age of equipment, (2) TMP share of pulp
used, (3) Daily paper production and (4) Fresh warm water usage. For parameters 1-3,
no significant correlation was found, neither with the current steam consumption nor
with the theoretical minimum steam consumption. A correlation was found only for the
fourth parameter, the fresh warm water usage, as presented in Fig. 11. It was also found
that the fresh water usage affects the pinch temperature or, for the two mills with un-
pinched Grand Composite Curves, the start temperature for the heat demand curve. A
low fresh warm water usage gives a high pinch temperature and thus a more usable
temperature of the excess heat available. These results are in line with similar results
from earlier studies made on kraft pulp mills showing that a lower use of heated fresh
water gives excess heat at higher temperatures, and thus a larger potential for further
process integration (Wising, Berntsson et al. 2005; Axelsson, Olsson et al. 2006).
Hence, it can be concluded that water management is important, also for energy
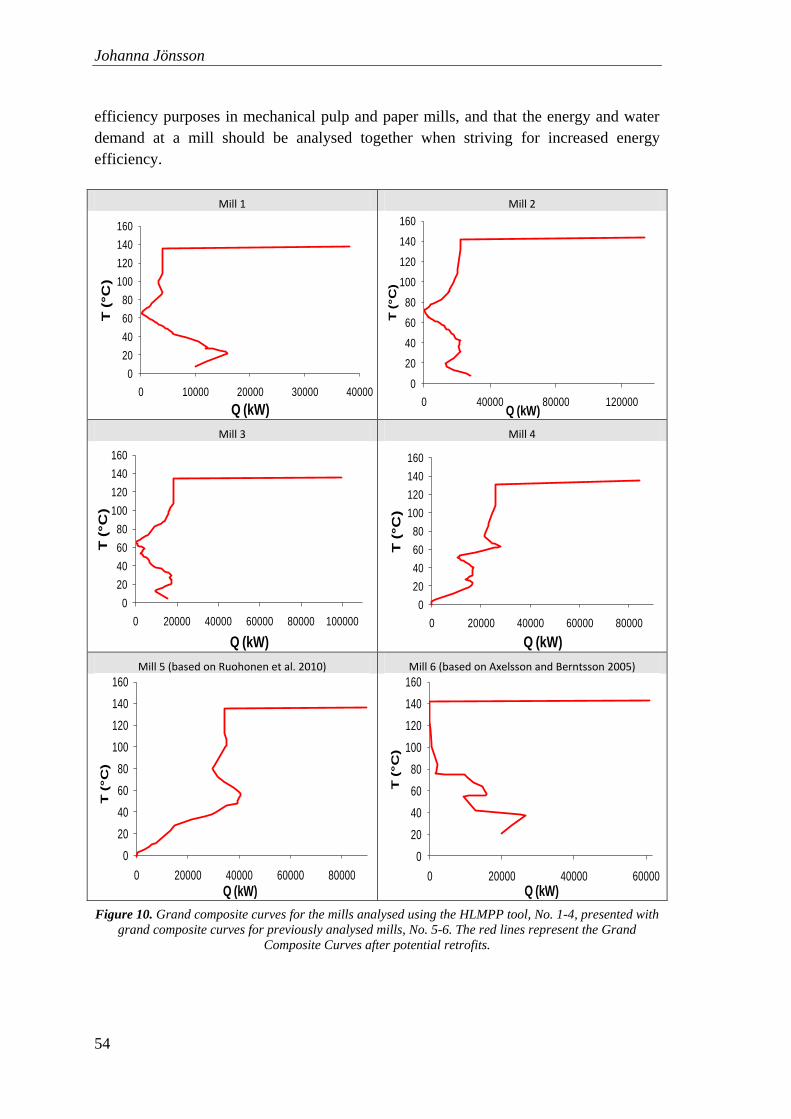
Johanna Jönsson
54
efficiency purposes in mechanical pulp and paper mills, and that the energy and water
demand at a mill should be analysed together when striving for increased energy
efficiency.
Mill 1 Mill 2
0
20
40
60
80
100
120
140
160
0 10000 20000 30000 40000
T (
°C
)
Q (kW)
0
20
40
60
80
100
120
140
160
0 40000 80000 120000T
(°C
)
Q (kW)
Mill 3 Mill 4
0
20
40
60
80
100
120
140
160
0 20000 40000 60000 80000 100000
T (
°C
)
Q (kW)
0
20
40
60
80
100
120
140
160
0 20000 40000 60000 80000
T (
°C
)
Q (kW)
Mill 5 (based on Ruohonen et al. 2010) Mill 6 (based on Axelsson and Berntsson 2005)
0
20
40
60
80
100
120
140
160
0 20000 40000 60000 80000
T (°C
)
Q (kW)
0
20
40
60
80
100
120
140
160
0 20000 40000 60000
T (°C
)
Q (kW)
Figure 10. Grand composite curves for the mills analysed using the HLMPP tool, No. 1-4, presented with
grand composite curves for previously analysed mills, No. 5-6. The red lines represent the Grand
Composite Curves after potential retrofits.

Results research theme 1: General integration opportunities in existing mills
55
40
50
60
70
80
0 2 4 6 8 10 12
Stea
m c
on
sum
pti
on
[kW
/t p
aper
per
day
]
Heated fresh water [t/t paper]
Current steam consumption
Theoretical minimum steam consumption
Correlation for current steam consumption
Correlation for theoretical minimum steam consumption
Figure 11. Linkage between fresh warm water consumption, steam use and theoretical minimum steam
consumption.
7.2.1 Summary of conclusions from this sub-chapter
For this work regarding excess heat temperature levels, potential for steam savings and
integration opportunities in TMP mills, the main conclusions are:
For the TMP mills studied, the theoretical steam-saving potential varies between
2% and 20%. Looking at the shape of the Grand Composite Curves, three of the
studied mills show promising potentials for further steam savings of up to 12
MW (equal to ~7-8% of the mills‟ original steam consumption) by installation of
heat pumps.
For TMP mills, the level of fresh warm water usage affects both the steam
consumption and the pinch temperature and thus also the potential for efficient
integration of different biorefinery processes.
The pinch temperature, and thus the temperature of excess heat, is quite low,
ranging from 18 to 72°C for all of the studied mills (both for the existing
configuration of the HENs and if maximum energy recovery is achieved), except
for the model mill based on best available technology (which shows a pinch
temperature of 117°C if maximum energy recovery is achieved). Further, two of
the mills are un-pinched and have no cooling demand and thus no excess heat
available.
Due to a low pinch temperature, possible biorefinery applications for TMP mill
excess heat are rare, at least if the mill has a high fresh water usage. However,
due to the same fact, thermal integration with new biorefinery processes could
supply part of the mill‟s heating demand and thereby further reduce its current
steam demand.
Johanna Jönsson
56
7.3 Addressing the research question in theme 1
Based on the results and conclusions above, the research questions in theme 1 regarding
general integration opportunities in different types of existing mills, as stated in the aim,
can be addressed:
What are the characteristics of the mills’ existing energy systems and how do they
influence the potential for thermal integration of new processes? TMP mills, generally,
have a heating demand partly at lower temperatures than kraft mills. This means that
they could benefit from receiving heat if integrated with another process. Kraft mills on
the other hand, having higher pinch temperatures, have a larger potential to supply heat
and steam to new processes. Most of the existing kraft mills studied currently throttle
steam. This shows a potential for increased electricity production if investments in new
turbines are made. For the TMP mills studied, the fresh warm water usage was proven
to greatly influence both the potential for steam savings and the pinch temperature.
How large is the potential for process steam savings for different types of mills? The
theoretical potential for steam savings (2-20% of current steam use) in the TMP mills
studied is somewhat lower than the theoretical potential identified for kraft mills in
previous research. Generally, TMP mills cannot reach self-sufficiency in thermal energy
by increased process integration alone, and thus the steam savings, if achieved, will not
lead to a steam surplus (as for kraft pulp mills) but to a reduction of the fuel usage.
At what temperature(s) can excess heat be made available? The amount and
temperature of the excess heat depend on the type and size of the mill. Generally, TMP
(and probably also ground wood mills and pure paper mills) mills have lower pinch
temperatures, <80°C, compared to kraft mills, usually having pinch temperatures
>90°C.
Are there ways to draw general conclusions for different types of mills? The model for
estimating steam balances for kraft mills seems to give accurate estimations. From
earlier validation studies, the HLMPP also has been proven to give fairly accurate
results, at least for the system above the pinch temperature. Although both models
would benefit from further validation and use, it can be concluded that fairly accurate
estimates can be made regarding the general integration opportunities for different types
of mills based on a limited amount of data (provided that the data are accessible).
Results research theme 2: Economic performance and global CO2 emissions assuming
different future developments of the European energy market
57
8 Results research theme 2: Economic
performance and global CO2 emissions
assuming different future developments
of the European energy market
This chapter presents the main findings from the papers which compare the
performance of the selected technology pathways for utilization of kraft pulp mill excess
heat. First, it is shown how changes in energy market prices and the assumed district
heating system influence both the pricing of excess heat and the trade-off between using
the excess heat for production of electricity and export of district heating. Thereafter,
the economic performance and the potential for reduction of global CO2 emissions are
evaluated and compared for a number of both proven and new technology pathways.
As stated in the introduction, for a kraft pulp mill there are many technology pathways
available for improvement of energy efficiency and additional sales of (new) products.
From a future perspective, however, it is not as clear which technology pathway is the
most profitable one or which pathway gives the lowest emissions of CO2 due to
uncertainties in the future value of different products. This can lead to uncertainty for
the kraft pulp mill regarding the choice of technology pathway. In this chapter, the
economic performance and the potential for reduction of global CO2 emissions are
evaluated and compared for a number of selected technology pathways assuming
different developments of the future energy market.
The work done for the results presented in this chapter is largely based on earlier,
detailed research work. This earlier research has identified the potential for increased
process integration and steam savings in the kraft pulp model mill, as well as the
technical and economic data for the different pathways compared. The contribution of
the present work is to bring together this earlier work, to compare the different
pathways and to analyse them using a higher systems perspective.
8.1 Trade-off between using kraft pulp mill excess heat internally in mill processes and using it externally for production of district heating
In Papers I and II, an average Scandinavian kraft pulp mill is modelled within the same
system boundary as a utility; see Sections 6.1.1 and 6.1.2 for input data. The purpose of
the study was to analyse the trade-off, in terms of economics and CO2 emission
consequences, between using low- and medium-quality pulp mill excess heat (warm and
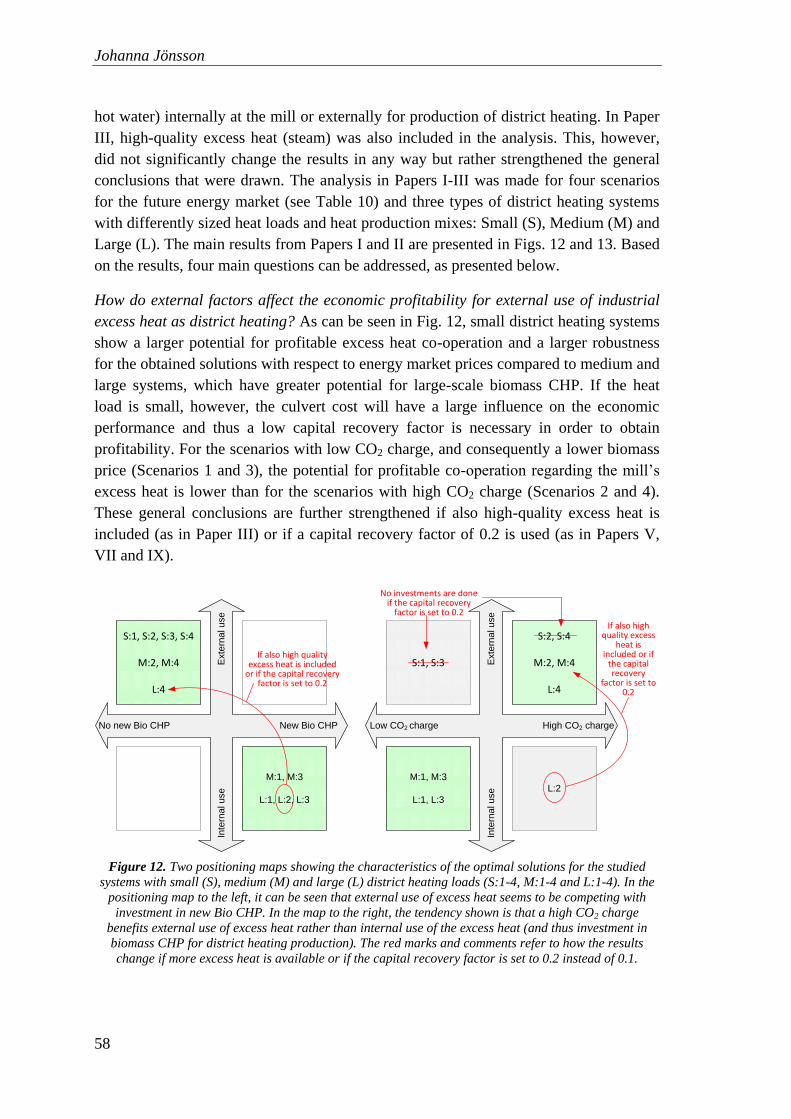
Johanna Jönsson
58
hot water) internally at the mill or externally for production of district heating. In Paper
III, high-quality excess heat (steam) was also included in the analysis. This, however,
did not significantly change the results in any way but rather strengthened the general
conclusions that were drawn. The analysis in Papers I-III was made for four scenarios
for the future energy market (see Table 10) and three types of district heating systems
with differently sized heat loads and heat production mixes: Small (S), Medium (M) and
Large (L). The main results from Papers I and II are presented in Figs. 12 and 13. Based
on the results, four main questions can be addressed, as presented below.
How do external factors affect the economic profitability for external use of industrial
excess heat as district heating? As can be seen in Fig. 12, small district heating systems
show a larger potential for profitable excess heat co-operation and a larger robustness
for the obtained solutions with respect to energy market prices compared to medium and
large systems, which have greater potential for large-scale biomass CHP. If the heat
load is small, however, the culvert cost will have a large influence on the economic
performance and thus a low capital recovery factor is necessary in order to obtain
profitability. For the scenarios with low CO2 charge, and consequently a lower biomass
price (Scenarios 1 and 3), the potential for profitable co-operation regarding the mill‟s
excess heat is lower than for the scenarios with high CO2 charge (Scenarios 2 and 4).
These general conclusions are further strengthened if also high-quality excess heat is
included (as in Paper III) or if a capital recovery factor of 0.2 is used (as in Papers V,
VII and IX).
S:1, S:2, S:3, S:4
M:2, M:4
L:4
No new Bio CHP
Exte
rna
l u
se
Inte
rna
l u
se
New Bio CHP
M:1, M:3
L:1, L:2, L:3
M:1, M:3
L:1, L:3
S:2, S:4
M:2, M:4
L:4
S:1, S:3
Low CO2 charge
Exte
rna
l u
se
Inte
rna
l u
se
High CO2 charge
L:2
If also high quality excess heat is included
or if the capital recovery factor is set to 0.2
If also high quality excess
heat is included or if
the capital recovery
factor is set to 0.2
No investments are done if the capital recovery
factor is set to 0.2
Figure 12. Two positioning maps showing the characteristics of the optimal solutions for the studied
systems with small (S), medium (M) and large (L) district heating loads (S:1-4, M:1-4 and L:1-4). In the
positioning map to the left, it can be seen that external use of excess heat seems to be competing with
investment in new Bio CHP. In the map to the right, the tendency shown is that a high CO2 charge
benefits external use of excess heat rather than internal use of the excess heat (and thus investment in
biomass CHP for district heating production). The red marks and comments refer to how the results
change if more excess heat is available or if the capital recovery factor is set to 0.2 instead of 0.1.
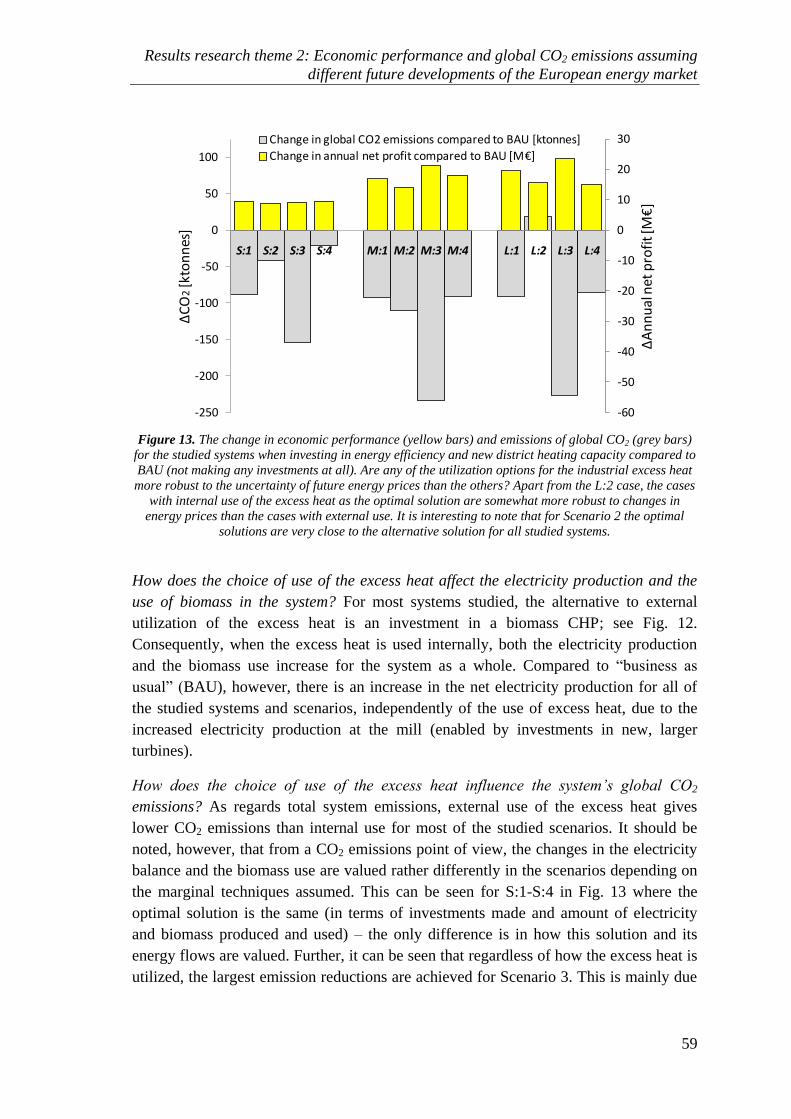
Results research theme 2: Economic performance and global CO2 emissions assuming
different future developments of the European energy market
59
-60
-50
-40
-30
-20
-10
0
10
20
30
-250
-200
-150
-100
-50
0
50
100
S:1 S:2 S:3 S:4 M:1 M:2 M:3 M:4 L:1 L:2 L:3 L:4
∆A
nn
ual
net
pro
fit [
M€
]
∆C
O2
[kto
nn
es]
Change in global CO2 emissions compared to BAU [ktonnes]
Change in annual net profit compared to BAU [M€]
Figure 13. The change in economic performance (yellow bars) and emissions of global CO2 (grey bars)
for the studied systems when investing in energy efficiency and new district heating capacity compared to
BAU (not making any investments at all). Are any of the utilization options for the industrial excess heat
more robust to the uncertainty of future energy prices than the others? Apart from the L:2 case, the cases
with internal use of the excess heat as the optimal solution are somewhat more robust to changes in
energy prices than the cases with external use. It is interesting to note that for Scenario 2 the optimal
solutions are very close to the alternative solution for all studied systems.
How does the choice of use of the excess heat affect the electricity production and the
use of biomass in the system? For most systems studied, the alternative to external
utilization of the excess heat is an investment in a biomass CHP; see Fig. 12.
Consequently, when the excess heat is used internally, both the electricity production
and the biomass use increase for the system as a whole. Compared to “business as
usual” (BAU), however, there is an increase in the net electricity production for all of
the studied systems and scenarios, independently of the use of excess heat, due to the
increased electricity production at the mill (enabled by investments in new, larger
turbines).
How does the choice of use of the excess heat influence the system’s global CO2
emissions? As regards total system emissions, external use of the excess heat gives
lower CO2 emissions than internal use for most of the studied scenarios. It should be
noted, however, that from a CO2 emissions point of view, the changes in the electricity
balance and the biomass use are valued rather differently in the scenarios depending on
the marginal techniques assumed. This can be seen for S:1-S:4 in Fig. 13 where the
optimal solution is the same (in terms of investments made and amount of electricity
and biomass produced and used) – the only difference is in how this solution and its
energy flows are valued. Further, it can be seen that regardless of how the excess heat is
utilized, the largest emission reductions are achieved for Scenario 3. This is mainly due
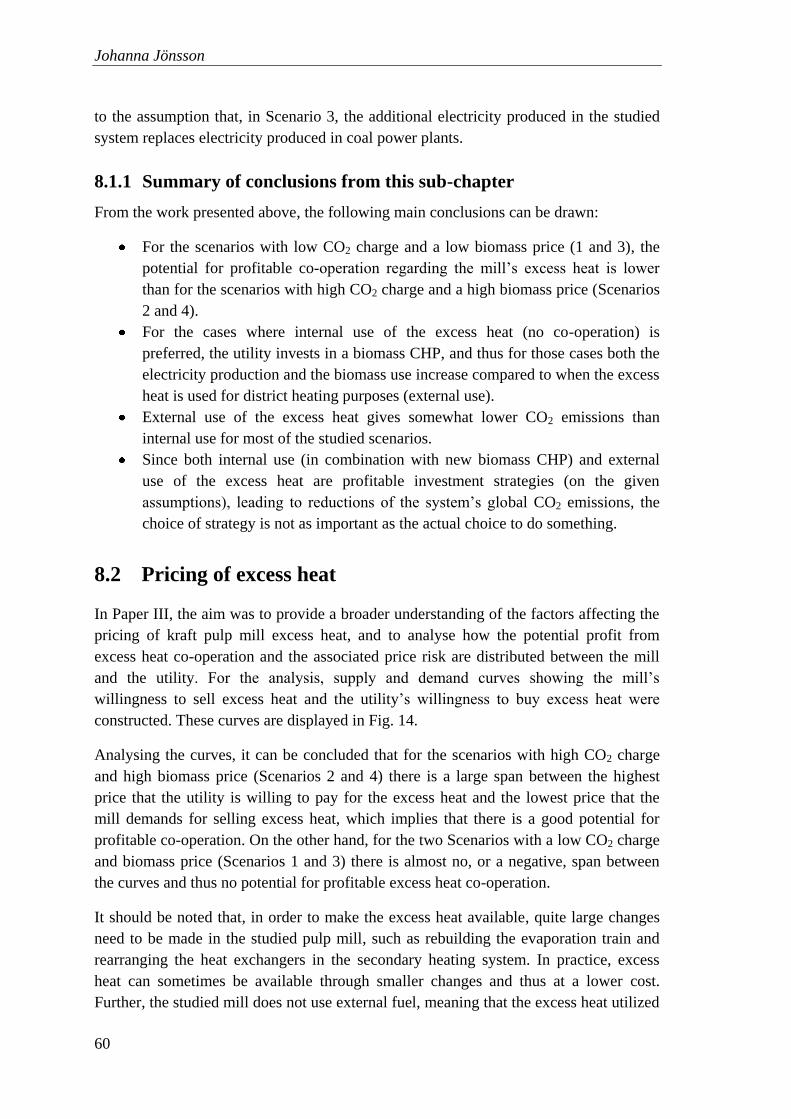
Johanna Jönsson
60
to the assumption that, in Scenario 3, the additional electricity produced in the studied
system replaces electricity produced in coal power plants.
8.1.1 Summary of conclusions from this sub-chapter
From the work presented above, the following main conclusions can be drawn:
For the scenarios with low CO2 charge and a low biomass price (1 and 3), the
potential for profitable co-operation regarding the mill‟s excess heat is lower
than for the scenarios with high CO2 charge and a high biomass price (Scenarios
2 and 4).
For the cases where internal use of the excess heat (no co-operation) is
preferred, the utility invests in a biomass CHP, and thus for those cases both the
electricity production and the biomass use increase compared to when the excess
heat is used for district heating purposes (external use).
External use of the excess heat gives somewhat lower CO2 emissions than
internal use for most of the studied scenarios.
Since both internal use (in combination with new biomass CHP) and external
use of the excess heat are profitable investment strategies (on the given
assumptions), leading to reductions of the system‟s global CO2 emissions, the
choice of strategy is not as important as the actual choice to do something.
8.2 Pricing of excess heat
In Paper III, the aim was to provide a broader understanding of the factors affecting the
pricing of kraft pulp mill excess heat, and to analyse how the potential profit from
excess heat co-operation and the associated price risk are distributed between the mill
and the utility. For the analysis, supply and demand curves showing the mill‟s
willingness to sell excess heat and the utility‟s willingness to buy excess heat were
constructed. These curves are displayed in Fig. 14.
Analysing the curves, it can be concluded that for the scenarios with high CO2 charge
and high biomass price (Scenarios 2 and 4) there is a large span between the highest
price that the utility is willing to pay for the excess heat and the lowest price that the
mill demands for selling excess heat, which implies that there is a good potential for
profitable co-operation. On the other hand, for the two Scenarios with a low CO2 charge
and biomass price (Scenarios 1 and 3) there is almost no, or a negative, span between
the curves and thus no potential for profitable excess heat co-operation.
It should be noted that, in order to make the excess heat available, quite large changes
need to be made in the studied pulp mill, such as rebuilding the evaporation train and
rearranging the heat exchangers in the secondary heating system. In practice, excess
heat can sometimes be available through smaller changes and thus at a lower cost.
Further, the studied mill does not use external fuel, meaning that the excess heat utilized
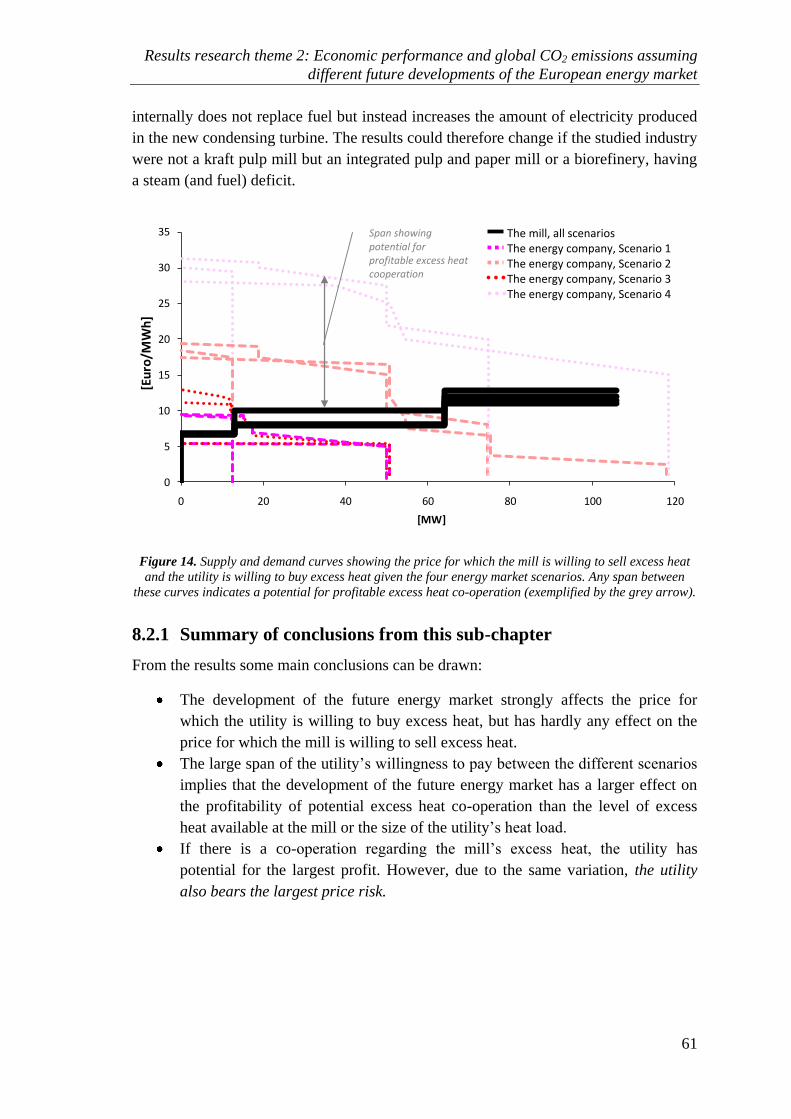
Results research theme 2: Economic performance and global CO2 emissions assuming
different future developments of the European energy market
61
internally does not replace fuel but instead increases the amount of electricity produced
in the new condensing turbine. The results could therefore change if the studied industry
were not a kraft pulp mill but an integrated pulp and paper mill or a biorefinery, having
a steam (and fuel) deficit.
0
5
10
15
20
25
30
35
0 20 40 60 80 100 120
[Eu
ro/M
Wh
]
[MW]
The mill, all scenarios The energy company, Scenario 1 The energy company, Scenario 2 The energy company, Scenario 3 The energy company, Scenario 4
Span showing potential for profitable excess heat cooperation
Figure 14. Supply and demand curves showing the price for which the mill is willing to sell excess heat
and the utility is willing to buy excess heat given the four energy market scenarios. Any span between
these curves indicates a potential for profitable excess heat co-operation (exemplified by the grey arrow).
8.2.1 Summary of conclusions from this sub-chapter
From the results some main conclusions can be drawn:
The development of the future energy market strongly affects the price for
which the utility is willing to buy excess heat, but has hardly any effect on the
price for which the mill is willing to sell excess heat.
The large span of the utility‟s willingness to pay between the different scenarios
implies that the development of the future energy market has a larger effect on
the profitability of potential excess heat co-operation than the level of excess
heat available at the mill or the size of the utility‟s heat load.
If there is a co-operation regarding the mill‟s excess heat, the utility has
potential for the largest profit. However, due to the same variation, the utility
also bears the largest price risk.
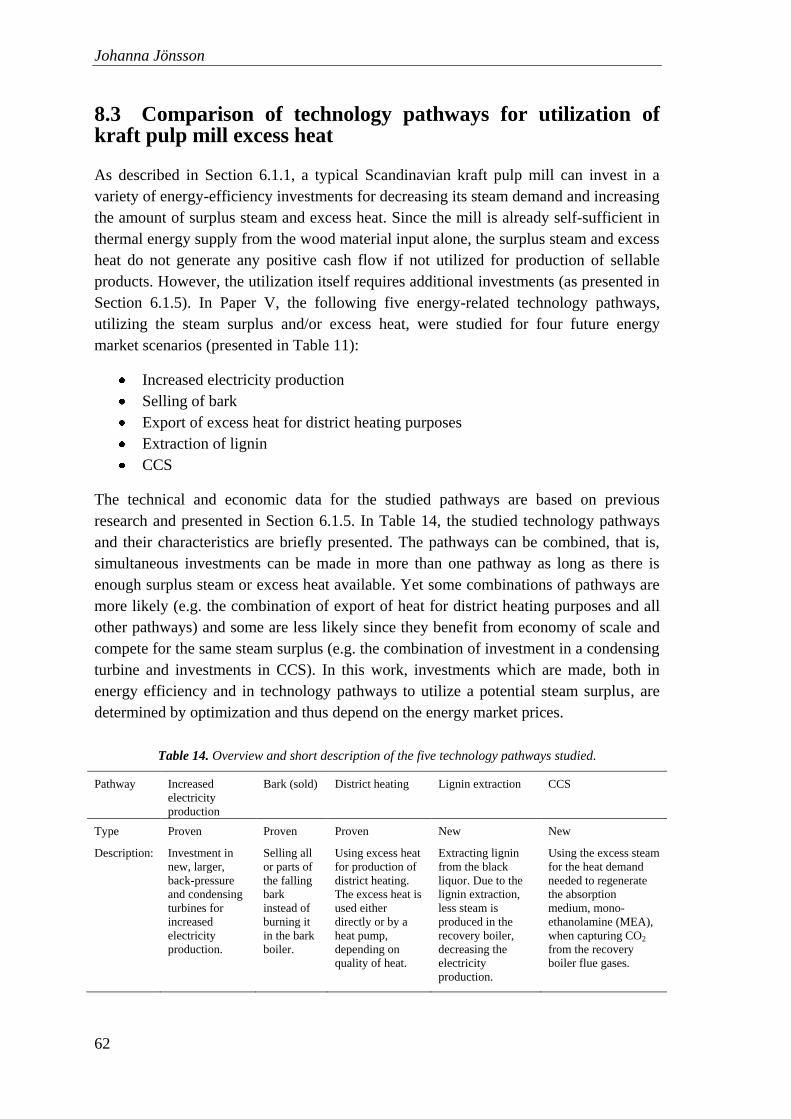
Johanna Jönsson
62
8.3 Comparison of technology pathways for utilization of kraft pulp mill excess heat
As described in Section 6.1.1, a typical Scandinavian kraft pulp mill can invest in a
variety of energy-efficiency investments for decreasing its steam demand and increasing
the amount of surplus steam and excess heat. Since the mill is already self-sufficient in
thermal energy supply from the wood material input alone, the surplus steam and excess
heat do not generate any positive cash flow if not utilized for production of sellable
products. However, the utilization itself requires additional investments (as presented in
Section 6.1.5). In Paper V, the following five energy-related technology pathways,
utilizing the steam surplus and/or excess heat, were studied for four future energy
market scenarios (presented in Table 11):
Increased electricity production
Selling of bark
Export of excess heat for district heating purposes
Extraction of lignin
CCS
The technical and economic data for the studied pathways are based on previous
research and presented in Section 6.1.5. In Table 14, the studied technology pathways
and their characteristics are briefly presented. The pathways can be combined, that is,
simultaneous investments can be made in more than one pathway as long as there is
enough surplus steam or excess heat available. Yet some combinations of pathways are
more likely (e.g. the combination of export of heat for district heating purposes and all
other pathways) and some are less likely since they benefit from economy of scale and
compete for the same steam surplus (e.g. the combination of investment in a condensing
turbine and investments in CCS). In this work, investments which are made, both in
energy efficiency and in technology pathways to utilize a potential steam surplus, are
determined by optimization and thus depend on the energy market prices.
Table 14. Overview and short description of the five technology pathways studied.
Pathway Increased
electricity
production
Bark (sold) District heating Lignin extraction CCS
Type Proven Proven Proven New New
Description: Investment in
new, larger,
back-pressure
and condensing
turbines for
increased
electricity
production.
Selling all
or parts of
the falling
bark
instead of
burning it
in the bark
boiler.
Using excess heat
for production of
district heating.
The excess heat is
used either
directly or by a
heat pump,
depending on
quality of heat.
Extracting lignin
from the black
liquor. Due to the
lignin extraction,
less steam is
produced in the
recovery boiler,
decreasing the
electricity
production.
Using the excess steam
for the heat demand
needed to regenerate
the absorption
medium, mono-
ethanolamine (MEA),
when capturing CO2
from the recovery
boiler flue gases.
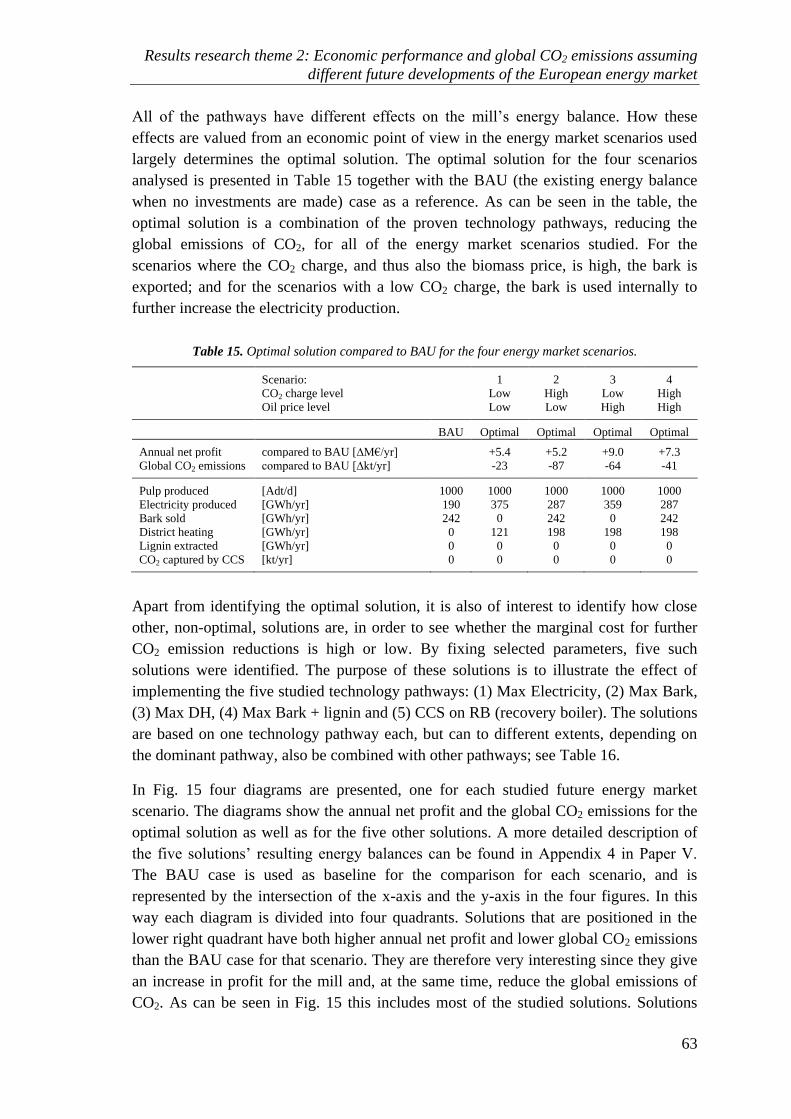
Results research theme 2: Economic performance and global CO2 emissions assuming
different future developments of the European energy market
63
All of the pathways have different effects on the mill‟s energy balance. How these
effects are valued from an economic point of view in the energy market scenarios used
largely determines the optimal solution. The optimal solution for the four scenarios
analysed is presented in Table 15 together with the BAU (the existing energy balance
when no investments are made) case as a reference. As can be seen in the table, the
optimal solution is a combination of the proven technology pathways, reducing the
global emissions of CO2, for all of the energy market scenarios studied. For the
scenarios where the CO2 charge, and thus also the biomass price, is high, the bark is
exported; and for the scenarios with a low CO2 charge, the bark is used internally to
further increase the electricity production.
Table 15. Optimal solution compared to BAU for the four energy market scenarios.
Scenario: 1 2 3 4
CO2 charge level Low High Low High
Oil price level Low Low High High
BAU Optimal Optimal Optimal Optimal
Annual net profit compared to BAU [∆M€/yr] +5.4 +5.2 +9.0 +7.3
Global CO2 emissions compared to BAU [∆kt/yr] -23 -87 -64 -41
Pulp produced [Adt/d] 1000 1000 1000 1000 1000
Electricity produced [GWh/yr] 190 375 287 359 287
Bark sold [GWh/yr] 242 0 242 0 242
District heating [GWh/yr] 0 121 198 198 198
Lignin extracted [GWh/yr] 0 0 0 0 0
CO2 captured by CCS [kt/yr] 0 0 0 0 0
Apart from identifying the optimal solution, it is also of interest to identify how close
other, non-optimal, solutions are, in order to see whether the marginal cost for further
CO2 emission reductions is high or low. By fixing selected parameters, five such
solutions were identified. The purpose of these solutions is to illustrate the effect of
implementing the five studied technology pathways: (1) Max Electricity, (2) Max Bark,
(3) Max DH, (4) Max Bark + lignin and (5) CCS on RB (recovery boiler). The solutions
are based on one technology pathway each, but can to different extents, depending on
the dominant pathway, also be combined with other pathways; see Table 16.
In Fig. 15 four diagrams are presented, one for each studied future energy market
scenario. The diagrams show the annual net profit and the global CO2 emissions for the
optimal solution as well as for the five other solutions. A more detailed description of
the five solutions‟ resulting energy balances can be found in Appendix 4 in Paper V.
The BAU case is used as baseline for the comparison for each scenario, and is
represented by the intersection of the x-axis and the y-axis in the four figures. In this
way each diagram is divided into four quadrants. Solutions that are positioned in the
lower right quadrant have both higher annual net profit and lower global CO2 emissions
than the BAU case for that scenario. They are therefore very interesting since they give
an increase in profit for the mill and, at the same time, reduce the global emissions of
CO2. As can be seen in Fig. 15 this includes most of the studied solutions. Solutions
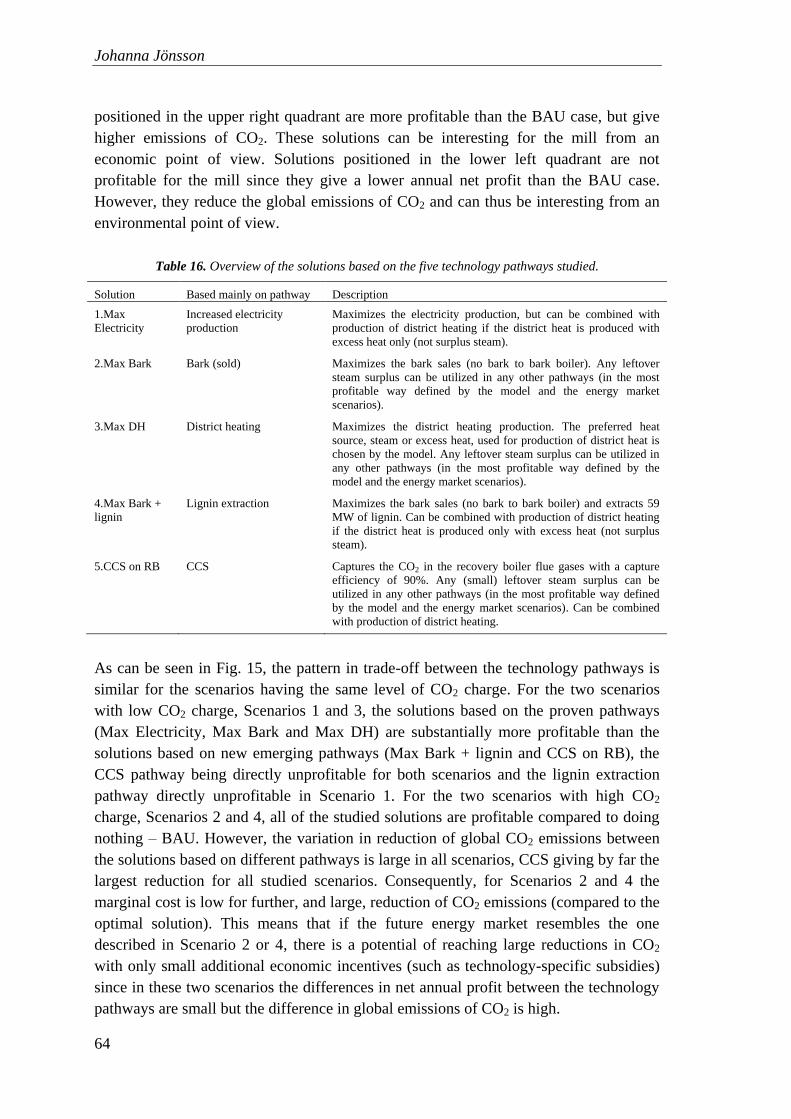
Johanna Jönsson
64
positioned in the upper right quadrant are more profitable than the BAU case, but give
higher emissions of CO2. These solutions can be interesting for the mill from an
economic point of view. Solutions positioned in the lower left quadrant are not
profitable for the mill since they give a lower annual net profit than the BAU case.
However, they reduce the global emissions of CO2 and can thus be interesting from an
environmental point of view.
Table 16. Overview of the solutions based on the five technology pathways studied.
Solution Based mainly on pathway Description
1.Max
Electricity
Increased electricity
production
Maximizes the electricity production, but can be combined with
production of district heating if the district heat is produced with
excess heat only (not surplus steam).
2.Max Bark Bark (sold) Maximizes the bark sales (no bark to bark boiler). Any leftover
steam surplus can be utilized in any other pathways (in the most
profitable way defined by the model and the energy market
scenarios).
3.Max DH District heating Maximizes the district heating production. The preferred heat
source, steam or excess heat, used for production of district heat is
chosen by the model. Any leftover steam surplus can be utilized in
any other pathways (in the most profitable way defined by the
model and the energy market scenarios).
4.Max Bark +
lignin
Lignin extraction Maximizes the bark sales (no bark to bark boiler) and extracts 59
MW of lignin. Can be combined with production of district heating
if the district heat is produced only with excess heat (not surplus
steam).
5.CCS on RB CCS Captures the CO2 in the recovery boiler flue gases with a capture
efficiency of 90%. Any (small) leftover steam surplus can be
utilized in any other pathways (in the most profitable way defined
by the model and the energy market scenarios). Can be combined
with production of district heating.
As can be seen in Fig. 15, the pattern in trade-off between the technology pathways is
similar for the scenarios having the same level of CO2 charge. For the two scenarios
with low CO2 charge, Scenarios 1 and 3, the solutions based on the proven pathways
(Max Electricity, Max Bark and Max DH) are substantially more profitable than the
solutions based on new emerging pathways (Max Bark + lignin and CCS on RB), the
CCS pathway being directly unprofitable for both scenarios and the lignin extraction
pathway directly unprofitable in Scenario 1. For the two scenarios with high CO2
charge, Scenarios 2 and 4, all of the studied solutions are profitable compared to doing
nothing – BAU. However, the variation in reduction of global CO2 emissions between
the solutions based on different pathways is large in all scenarios, CCS giving by far the
largest reduction for all studied scenarios. Consequently, for Scenarios 2 and 4 the
marginal cost is low for further, and large, reduction of CO2 emissions (compared to the
optimal solution). This means that if the future energy market resembles the one
described in Scenario 2 or 4, there is a potential of reaching large reductions in CO2
with only small additional economic incentives (such as technology-specific subsidies)
since in these two scenarios the differences in net annual profit between the technology
pathways are small but the difference in global emissions of CO2 is high.
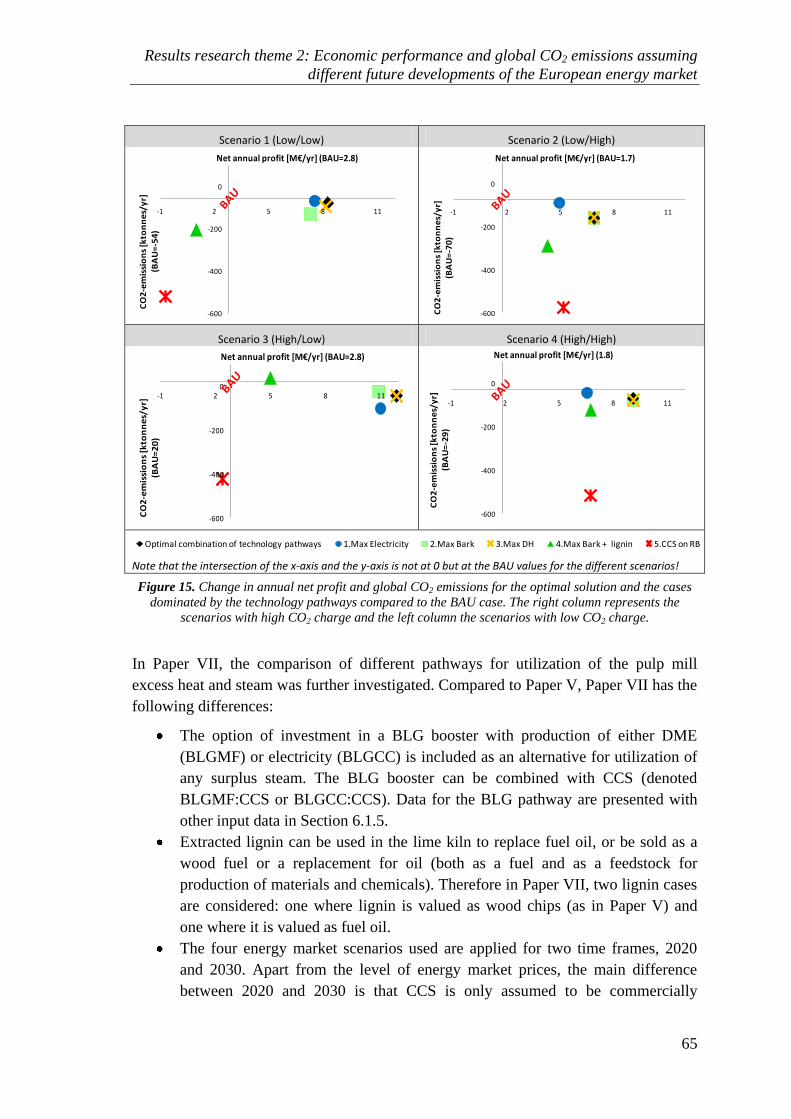
Results research theme 2: Economic performance and global CO2 emissions assuming
different future developments of the European energy market
65
Scenario 1 (Low/Low) Scenario 2 (Low/High)
-600
-400
-200
0
-1 2 5 8 11
CO
2-e
mis
sio
ns
[kto
nn
es/
yr]
(B
AU
=-5
4)
Net annual profit [M€/yr] (BAU=2.8)
-600
-400
-200
0
-1 2 5 8 11
CO
2-e
mis
sio
ns
[kto
nn
es/
yr]
(B
AU
=-7
0)
Net annual profit [M€/yr] (BAU=1.7)
Scenario 3 (High/Low) Scenario 4 (High/High)
-600
-400
-200
0-1 2 5 8 11
CO
2-e
mis
sio
ns
[kto
nn
es/
yr]
(B
AU
=2
0)
Net annual profit [M€/yr] (BAU=2.8)
-600
-400
-200
0
-1 2 5 8 11
CO
2-e
mis
sio
ns
[kto
nn
es/
yr]
(BA
U=
-29
)
Net annual profit [M€/yr] (1.8)
-700
-300
100
0,0 4,0 8,0 12,0
CO
2-em
issi
on
s [k
ton
nes
/yr]
(BA
U=-
32)
Net annual profit [M€/yr] (BAU=2.1)
Optimal combination of technology pathways 1.Max Electricity 2.Max Bark 3.Max DH 4.Max Bark + lignin 5.CCS on RB
Note that the intersection of the x-axis and the y-axis is not at 0 but at the BAU values for the different scenarios!
Figure 15. Change in annual net profit and global CO2 emissions for the optimal solution and the cases
dominated by the technology pathways compared to the BAU case. The right column represents the
scenarios with high CO2 charge and the left column the scenarios with low CO2 charge.
In Paper VII, the comparison of different pathways for utilization of the pulp mill
excess heat and steam was further investigated. Compared to Paper V, Paper VII has the
following differences:
The option of investment in a BLG booster with production of either DME
(BLGMF) or electricity (BLGCC) is included as an alternative for utilization of
any surplus steam. The BLG booster can be combined with CCS (denoted
BLGMF:CCS or BLGCC:CCS). Data for the BLG pathway are presented with
other input data in Section 6.1.5.
Extracted lignin can be used in the lime kiln to replace fuel oil, or be sold as a
wood fuel or a replacement for oil (both as a fuel and as a feedstock for
production of materials and chemicals). Therefore in Paper VII, two lignin cases
are considered: one where lignin is valued as wood chips (as in Paper V) and
one where it is valued as fuel oil.
The four energy market scenarios used are applied for two time frames, 2020
and 2030. Apart from the level of energy market prices, the main difference
between 2020 and 2030 is that CCS is only assumed to be commercially
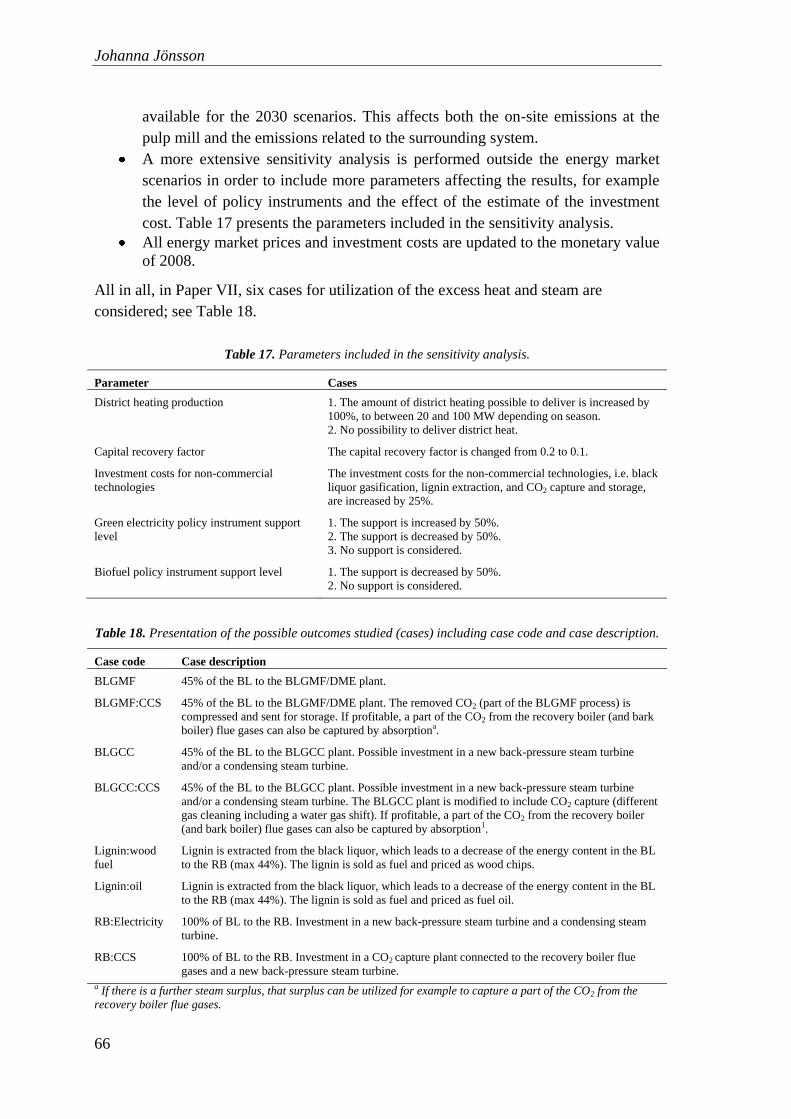
Johanna Jönsson
66
available for the 2030 scenarios. This affects both the on-site emissions at the
pulp mill and the emissions related to the surrounding system.
A more extensive sensitivity analysis is performed outside the energy market
scenarios in order to include more parameters affecting the results, for example
the level of policy instruments and the effect of the estimate of the investment
cost. Table 17 presents the parameters included in the sensitivity analysis.
All energy market prices and investment costs are updated to the monetary value
of 2008.
All in all, in Paper VII, six cases for utilization of the excess heat and steam are
considered; see Table 18.
Table 17. Parameters included in the sensitivity analysis.
Parameter Cases
District heating production 1. The amount of district heating possible to deliver is increased by
100%, to between 20 and 100 MW depending on season.
2. No possibility to deliver district heat.
Capital recovery factor The capital recovery factor is changed from 0.2 to 0.1.
Investment costs for non-commercial
technologies
The investment costs for the non-commercial technologies, i.e. black
liquor gasification, lignin extraction, and CO2 capture and storage,
are increased by 25%.
Green electricity policy instrument support
level
1. The support is increased by 50%.
2. The support is decreased by 50%.
3. No support is considered.
Biofuel policy instrument support level 1. The support is decreased by 50%.
2. No support is considered.
Table 18. Presentation of the possible outcomes studied (cases) including case code and case description.
Case code Case description
BLGMF 45% of the BL to the BLGMF/DME plant.
BLGMF:CCS 45% of the BL to the BLGMF/DME plant. The removed CO2 (part of the BLGMF process) is
compressed and sent for storage. If profitable, a part of the CO2 from the recovery boiler (and bark
boiler) flue gases can also be captured by absorptiona.
BLGCC 45% of the BL to the BLGCC plant. Possible investment in a new back-pressure steam turbine
and/or a condensing steam turbine.
BLGCC:CCS 45% of the BL to the BLGCC plant. Possible investment in a new back-pressure steam turbine
and/or a condensing steam turbine. The BLGCC plant is modified to include CO2 capture (different
gas cleaning including a water gas shift). If profitable, a part of the CO2 from the recovery boiler
(and bark boiler) flue gases can also be captured by absorption1.
Lignin:wood
fuel
Lignin is extracted from the black liquor, which leads to a decrease of the energy content in the BL
to the RB (max 44%). The lignin is sold as fuel and priced as wood chips.
Lignin:oil Lignin is extracted from the black liquor, which leads to a decrease of the energy content in the BL
to the RB (max 44%). The lignin is sold as fuel and priced as fuel oil.
RB:Electricity 100% of BL to the RB. Investment in a new back-pressure steam turbine and a condensing steam
turbine.
RB:CCS 100% of BL to the RB. Investment in a CO2 capture plant connected to the recovery boiler flue
gases and a new back-pressure steam turbine.
a If there is a further steam surplus, that surplus can be utilized for example to capture a part of the CO2 from the
recovery boiler flue gases.
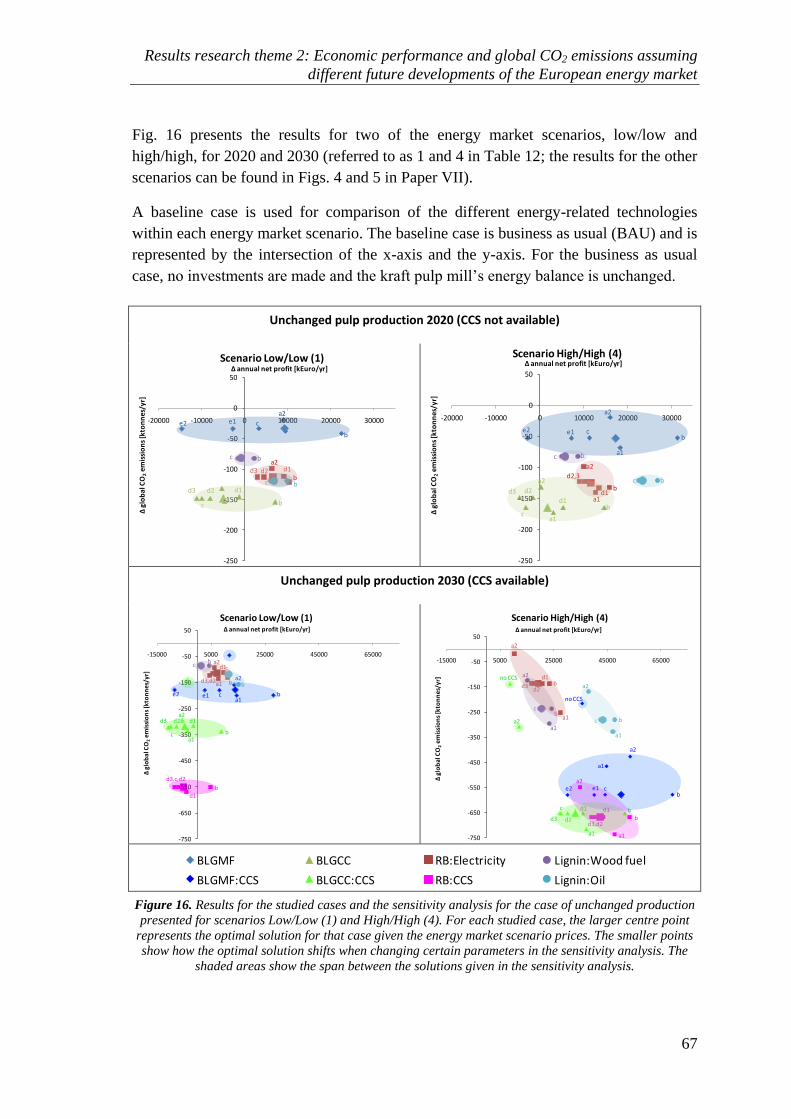
Results research theme 2: Economic performance and global CO2 emissions assuming
different future developments of the European energy market
67
Fig. 16 presents the results for two of the energy market scenarios, low/low and
high/high, for 2020 and 2030 (referred to as 1 and 4 in Table 12; the results for the other
scenarios can be found in Figs. 4 and 5 in Paper VII).
A baseline case is used for comparison of the different energy-related technologies
within each energy market scenario. The baseline case is business as usual (BAU) and is
represented by the intersection of the x-axis and the y-axis. For the business as usual
case, no investments are made and the kraft pulp mill‟s energy balance is unchanged.
Unchanged pulp production 2020 (CCS not available)
-250
-200
-150
-100
-50
0
50
-20000 -10000 0 10000 20000 30000
∆g
lob
al C
O2
em
issi
on
s [k
ton
ne
s/y
r]
∆ annual net profit [kEuro/yr]Scenario Low/Low (1)
a2
a2bc
b
bb
b
c
c
c
d1d3
d2
d2
d3
e2
d1
e1
-250
-200
-150
-100
-50
0
50
-20000 -10000 0 10000 20000 30000
∆g
lob
al C
O2
em
issi
on
s [k
ton
ne
s/y
r]
∆ annual net profit [kEuro/yr]Scenario High/High (4)
a1
a2
bd1
d2d3
c
bc
c b
b
a2
a1d1
d2,3
b
a1
a2
ce1e2
Unchanged pulp production 2030 (CCS available)
-750
-650
-550
-450
-350
-250
-150
-50
50
-15000 5000 25000 45000 65000
∆ g
lob
al C
O2
em
issi
on
s [k
ton
ne
s/yr
]
∆ annual net profit [kEuro/yr]
Scenario Low/Low (1)
b
b
b
b
b
b
cc
d3 d2
d3,c,d2
d1
c
d1
a1
a2
a1
a2
ce1e2
a2
a1
d1
d3,d2
-750
-650
-550
-450
-350
-250
-150
-50
50
-15000 5000 25000 45000 65000
∆gl
ob
al C
O2
em
issi
on
s [k
ton
ne
s/yr
]
∆ annual net profit [kEuro/yr]
Scenario High/High (4)
no CCS
no CCS
b
bc
a2
a1a1
a2
bc
b
a2
a1
d1
d2d3
a2
a1
bd1
d2d3
c
a1
b
a2
d1
d3,d2
a2
a1
ce1e2
-750
-650
-550
-450
-350
-250
-150
-50
50
-5000 15000 35000 55000 75000
∆ g
lob
al C
O2
emis
sio
ns
[kto
nn
es/y
r]
∆ annual net profit [kEuro/yr]
Scenario Low/Low (1)
BLGMF BLGCC RB:Electricity Lignin:Wood fuel
BLGMF:CCS BLGCC:CCS RB:CCS Lignin:Oil
b
b
b
b
b
cc
d3 d2
c
d1
a1
a2
a1
a2
ce1e2
a1
d1
d3,d2
Figure 16. Results for the studied cases and the sensitivity analysis for the case of unchanged production
presented for scenarios Low/Low (1) and High/High (4). For each studied case, the larger centre point
represents the optimal solution for that case given the energy market scenario prices. The smaller points
show how the optimal solution shifts when changing certain parameters in the sensitivity analysis. The
shaded areas show the span between the solutions given in the sensitivity analysis.
Johanna Jönsson
68
The bullet list below summarises the main findings from Paper VII:
Generally, in scenarios assuming a low oil price level, BLGMF has the best
economic performance; and in scenarios assuming a high oil price level,
extraction of lignin that can be valued as oil has the best economic performance
out of the studied technologies. However, contrary to lignin, the BLGMF case is
valued as oil, very sensitive to changes of several parameters, especially the
level of support for biofuels.
All the studied technology cases decrease global CO2 emissions significantly
compared to not making investments. For the year 2020, where there is assumed
to be no possibility for CCS, BLGCC gives the highest CO2 reduction potential,
followed by investments in new turbines in connection with the recovery boiler
and extraction of lignin that can be priced as oil. For the year 2030, where there
is assumed to be an established infrastructure for CCS, investments in CCS
coupled to the recovery boiler flue gases render the highest CO2 reduction
potential, followed by BLGCC and BLGMF, where CCS also can be included.
The level of financial support for green electricity does not significantly
influence the results, partly due to the assumed design of the support system,
where only new production capacity is entitled to support. However, the level of
support for biofuels affects the results to a large extent since it significantly
influences the economic performance of the BLGMF case. If conditions
influencing the BLGMF case positively are not considered, such as inclusion of
CCS, a substantial level of the support for biofuels is needed in order for
BLGMF to be competitive compared to extraction of lignin that can be valued as
oil.
The results show that for technologies with substantial investment costs,
BLGMF, BLGCC and CCS coupled to the boiler flue gases, a 25% increase of
the investment cost has a quite large influence on the economic performance.
For lignin extraction, which is not yet a commercialised technology but has a
lower investment compared to the other non-commercial, a 25% increase of the
investment cost has a very low influence on the economic performance.
The possibility to capture CO2 from the recovery boiler flue gases gives a large
CO2 reduction potential. However, the profitability of capturing the CO2 is
strongly dependent on the CO2 charge – e.g. it is only for the scenarios with a
high CO2 charge that CCS coupled to the boiler flue gases is more profitable
than investments in new turbines. CCS decreases the global CO2 emissions and
the economic performance for BLGMF and BLGCC both in absolute terms and
in relation to the other technologies.
Extraction of lignin that can be valued as oil has a very good economic
performance, even in the scenarios with a low oil price. The CO2 emissions
reduction from lignin extraction is also fairly stable between the scenarios.
For the scenarios with a low oil price the support for biofuel is high, which of course is
questionable. This is due to the approach used for determining the level (see Section
Results research theme 2: Economic performance and global CO2 emissions assuming
different future developments of the European energy market
69
6.3.2). The sensitivity analysis shows for example the consequences of a 50% reduction
of the support, which in the scenarios with low oil prices results in a more reasonable
level of the support. At this level, BLGMF is never the most profitable option (in the
scenarios with a low oil price). Further, an aspect that is often discussed in connection
with BLG is the availability factor of the equipment. If the production capacity is
assumed to be unchanged, the availability of the BLG plant is not very critical, since the
recovery boiler can handle the entire black liquor flow if necessary.
Using the model constructed for Paper VII, in Paper IX three different options for
debottlenecking of the recovery boiler assuming a 25% production capacity increase are
compared:
1. Upgrading the recovery boiler
2. Lignin extraction
3. Black liquor gasification (as a booster)
The same energy-efficiency measures as in the case with unchanged production are
considered, most of which can be scaled corresponding to the increased production.
The results from Paper IX show that, generally, BLGMF and lignin extraction with
lignin valued as oil achieve the best economic performance. Capturing and storing CO2
from the upgraded recovery boiler flue gases gives the highest CO2 emissions reduction,
but is an economically attractive option only in scenarios with a high CO2 emissions
charge. Comparing the results from Paper IX with the results from Paper VII where the
production capacity was unchanged, it can be seen that the BLG cases (both with and
without CCS) benefit from economy of scale. Lignin extraction, however, does not
show the same scale dependence. Thus, the BLGMF case becomes more profitable than
lignin extraction with lignin valued as oil for some of the scenarios where lignin
extraction was shown to be more profitable for the case of unchanged production
capacity.
8.3.1 Summary of conclusions from this sub-chapter
From Papers V, VII and IX, evaluating and comparing technology pathways for
utilization of kraft pulp mill excess heat presented above, the following main
conclusions can be drawn:
The results show that if investments are made in energy-efficiency measures and
different technology pathways to utilize the steam surplus, the energy balance of
the kraft pulp mill can be significantly altered and the mill can produce a
considerable amount of (new) products in addition to the pulp.
The new and emerging technology pathways, especially BLG and CCS,
combined with energy efficiency, hold much larger potential for reduction of
global emissions of CO2 than the proven pathways.
Johanna Jönsson
70
The economic performances of the proven pathways (electricity production,
district heating production and selling bark) are, however, much more robust
than the economic performance of the emerging pathways for varying energy
market prices.
The results show that for a high CO2 charge and a high biomass price, there is a
potential for reaching large reductions in CO2 if only relatively minor additional
economic incentives are given. Yet, due to the low marginal cost of further
reduction of CO2 emissions in these scenarios, such economic support does not
need to be large. Applying a high cost of CO2 alone may not be enough to reach
the full potential of CO2 emissions reduction, since a high cost of CO2 also
profits the proven pathways.
The investment cost for the non-commercial, capital-intensive technologies BLG
and CCS is highly uncertain but has a significant effect on the economic
performance. This makes the future economic performance of these technologies
hard to predict.
Lignin extraction is a less capital-intensive technology than the other emerging
technologies. Further, its economic performance and potential for reduction of
CO2 emissions are not highly influenced by any of the parameters studied
outside the energy market scenarios, and can therefore be said to be a fairly
robust investment compared to e.g. BLGMF which is highly influenced by
several parameters such as biofuel policy instruments and investment costs.
Furthermore, if the lignin is valued as oil, lignin extraction shows a good
economic performance for all of the scenarios studied.
BLGMF and BLGCC benefit from economy of scale and thus have a better
economic performance when increasing the production capacity than when the
production capacity remains unchanged.
8.4 Addressing the research question in theme 2
Based on the work done in Papers I-III, V, VII and IX, as summarised above, the
research questions for theme 2 can be addressed:
How do assumptions regarding different energy market parameters influence the
economic performance and CO2 emissions for the pathways? The economic
performances of BLG and CCS are largely dependent on the CO2 charge and biomass
price level. For BLGMF the level of assumed biofuel support also strongly affects the
economic performance. In terms of the potential for reduction of global CO2 emissions,
the individual technologies show fairly similar performance for the different scenarios if
CCS is not considered. If CCS is considered a commercially available technology, and
thus is implemented both in the European power system and at the mill, this has a large
effect on the potential for reduction of global CO2 emissions. The energy market
scenario parameters have a larger effect on the economic performance and potential for
reduction of global CO2 emissions than individual non-market parameters have.
Results research theme 2: Economic performance and global CO2 emissions assuming
different future developments of the European energy market
71
Are any of the studied pathways “robust” given the uncertainty of the future energy
market and parameters such as policy instruments and investment costs? The proven
technology pathways are more robust to changing energy market parameters than the
new, emerging pathways. They show stable economic performance and, compared to
the emerging pathways, moderate reductions of the global CO2 emissions. For the new,
emerging technology pathways, lignin extraction shows the most robust performance,
perhaps due to its lower capital intensity compared to BLG and CCS. If the extracted
lignin can be valued as oil, lignin extraction will show a very good economic
performance, even in the scenarios with a low oil price. The CO2 emissions reduction
from lignin extraction is also fairly stable between the scenarios, although not as low as
for the other emerging technologies if CCS is considered. With respect to the potential
for reduction of global CO2 emissions, the emerging technologies show a large, robust
reduction potential for all of the studied scenarios.

Johanna Jönsson
72
Results research theme 3: Factors influencing the potential for industry-wide
implementation
73
9 Results research theme 3: Factors
influencing the potential for industry-
wide implementation
This chapter shows the results for how the potential for implementation of CCS in the
European PPI is influenced by the geographical proximity to potential future transport
and storage infrastructure.
Apart from the development of the future energy market conditions, for some of the
pathways studied, external preconditions, such as geographical location and existing
and new infrastructures, will largely influence the potential for (profitable)
implementation. This is especially true for CCS, impacted by the future transport and
storage infrastructure, and district heating, impacted by e.g. the distance to (large)
district heating sinks. In contrast, the potentials for increased electricity production,
export of bark and/or lignin and black liquor gasification, are not significantly affected
by the surrounding infrastructure and geographical conditions. Instead these
technologies are more dependent on the process conditions of the individual mills, e.g.
black liquor gasification and lignin extraction can only be implemented by kraft mills.
9.1 Carbon capture and storage
The potential for implementation of CCS within the European PPI is analysed in Paper
VIII. Technical and economic data for the technology are based on work by Hektor et
al. (Hektor and Berntsson 2007) and partly presented in Section 6.2.5.
As described in Chapter 2, the kraft PPI has large on-site emissions of CO2 due to the
burning of black liquor in the recovery boiler, whereas the mechanical PPI and the
paper mills based mainly on recycled fibers (RCF) generally have lower on-site
emissions.
In this study, the European PPI is represented by 176 mills, including kraft, mechanical
and paper mills; see Section 6.2. The amounts of on-site CO2 emissions from the pulp
and paper mills included are presented in Table 18. For comparison, the total on-site
emissions of CO2 for all CEPI mills are also included (CEPI 2008). The fossil CO2
emissions were gathered from the Chalmers industry database (for more details see
work by Rootzén et al. 2011). The biogenic CO2 emissions, on the other hand, are not
reported centrally, either for the EU or by CEPI. Thus, these emissions were gathered
by screening national statistics, sustainability reports, annual reports and web pages for
all of the mills included in the study. However, numbers for biogenic CO2 emissions
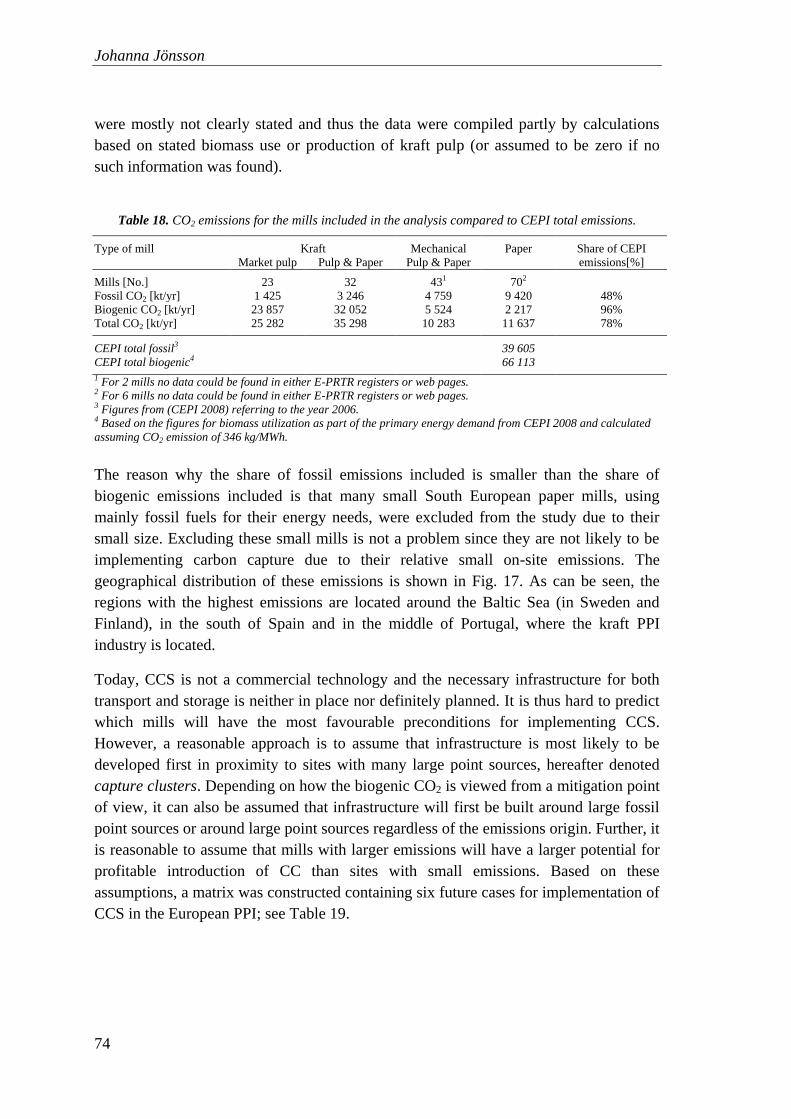
Johanna Jönsson
74
were mostly not clearly stated and thus the data were compiled partly by calculations
based on stated biomass use or production of kraft pulp (or assumed to be zero if no
such information was found).
Table 18. CO2 emissions for the mills included in the analysis compared to CEPI total emissions.
Type of mill Kraft Mechanical Paper Share of CEPI
emissions[%] Market pulp Pulp & Paper Pulp & Paper
Mills [No.] 23 32 431 702
Fossil CO2 [kt/yr] 1 425 3 246 4 759 9 420 48%
Biogenic CO2 [kt/yr] 23 857 32 052 5 524 2 217 96%
Total CO2 [kt/yr] 25 282 35 298 10 283 11 637 78%
CEPI total fossil3 39 605
CEPI total biogenic4 66 113
1 For 2 mills no data could be found in either E-PRTR registers or web pages. 2 For 6 mills no data could be found in either E-PRTR registers or web pages. 3 Figures from (CEPI 2008) referring to the year 2006. 4 Based on the figures for biomass utilization as part of the primary energy demand from CEPI 2008 and calculated
assuming CO2 emission of 346 kg/MWh.
The reason why the share of fossil emissions included is smaller than the share of
biogenic emissions included is that many small South European paper mills, using
mainly fossil fuels for their energy needs, were excluded from the study due to their
small size. Excluding these small mills is not a problem since they are not likely to be
implementing carbon capture due to their relative small on-site emissions. The
geographical distribution of these emissions is shown in Fig. 17. As can be seen, the
regions with the highest emissions are located around the Baltic Sea (in Sweden and
Finland), in the south of Spain and in the middle of Portugal, where the kraft PPI
industry is located.
Today, CCS is not a commercial technology and the necessary infrastructure for both
transport and storage is neither in place nor definitely planned. It is thus hard to predict
which mills will have the most favourable preconditions for implementing CCS.
However, a reasonable approach is to assume that infrastructure is most likely to be
developed first in proximity to sites with many large point sources, hereafter denoted
capture clusters. Depending on how the biogenic CO2 is viewed from a mitigation point
of view, it can also be assumed that infrastructure will first be built around large fossil
point sources or around large point sources regardless of the emissions origin. Further, it
is reasonable to assume that mills with larger emissions will have a larger potential for
profitable introduction of CC than sites with small emissions. Based on these
assumptions, a matrix was constructed containing six future cases for implementation of
CCS in the European PPI; see Table 19.
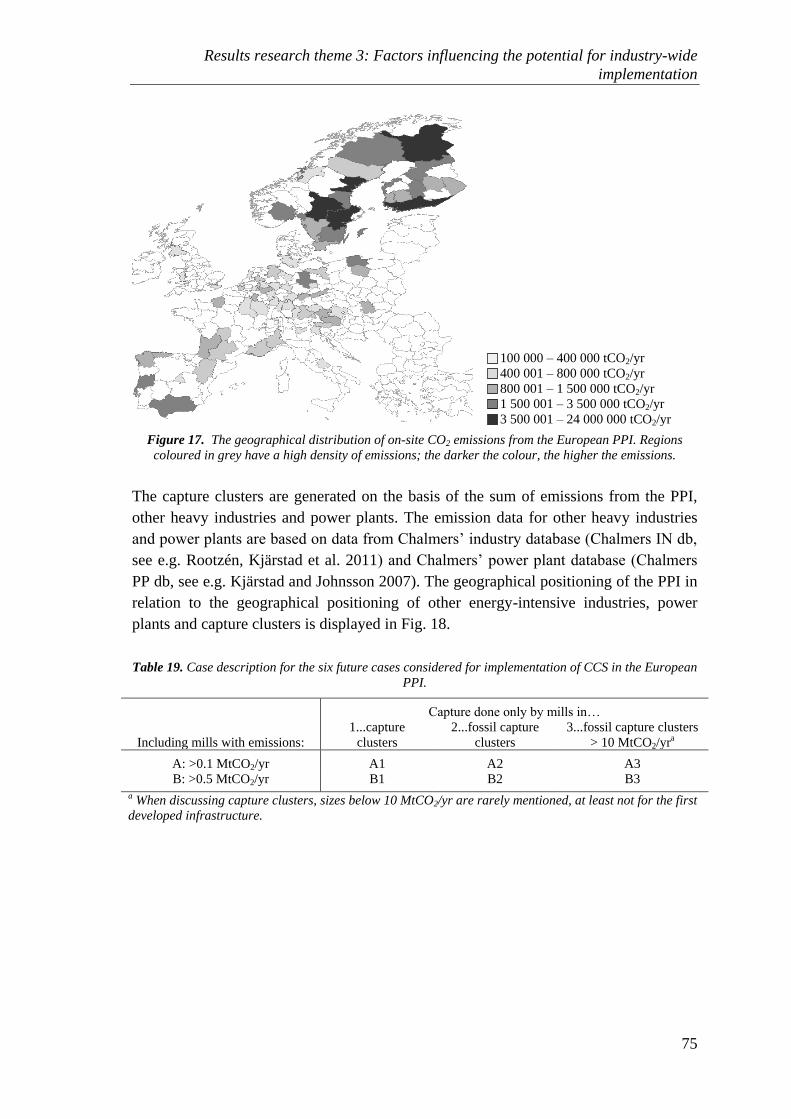
Results research theme 3: Factors influencing the potential for industry-wide
implementation
75
100 000 – 400 000 tCO2/yr
400 001 – 800 000 tCO2/yr
800 001 – 1 500 000 tCO2/yr
1 500 001 – 3 500 000 tCO2/yr
3 500 001 – 24 000 000 tCO2/yr
Figure 17. The geographical distribution of on-site CO2 emissions from the European PPI. Regions
coloured in grey have a high density of emissions; the darker the colour, the higher the emissions.
The capture clusters are generated on the basis of the sum of emissions from the PPI,
other heavy industries and power plants. The emission data for other heavy industries
and power plants are based on data from Chalmers‟ industry database (Chalmers IN db,
see e.g. Rootzén, Kjärstad et al. 2011) and Chalmers‟ power plant database (Chalmers
PP db, see e.g. Kjärstad and Johnsson 2007). The geographical positioning of the PPI in
relation to the geographical positioning of other energy-intensive industries, power
plants and capture clusters is displayed in Fig. 18.
Table 19. Case description for the six future cases considered for implementation of CCS in the European
PPI.
Capture done only by mills in…
Including mills with emissions:
1...capture
clusters
2...fossil capture
clusters
3...fossil capture clusters
> 10 MtCO2/yra
A: >0.1 MtCO2/yr A1 A2 A3
B: >0.5 MtCO2/yr B1 B2 B3
a When discussing capture clusters, sizes below 10 MtCO2/yr are rarely mentioned, at least not for the first
developed infrastructure.
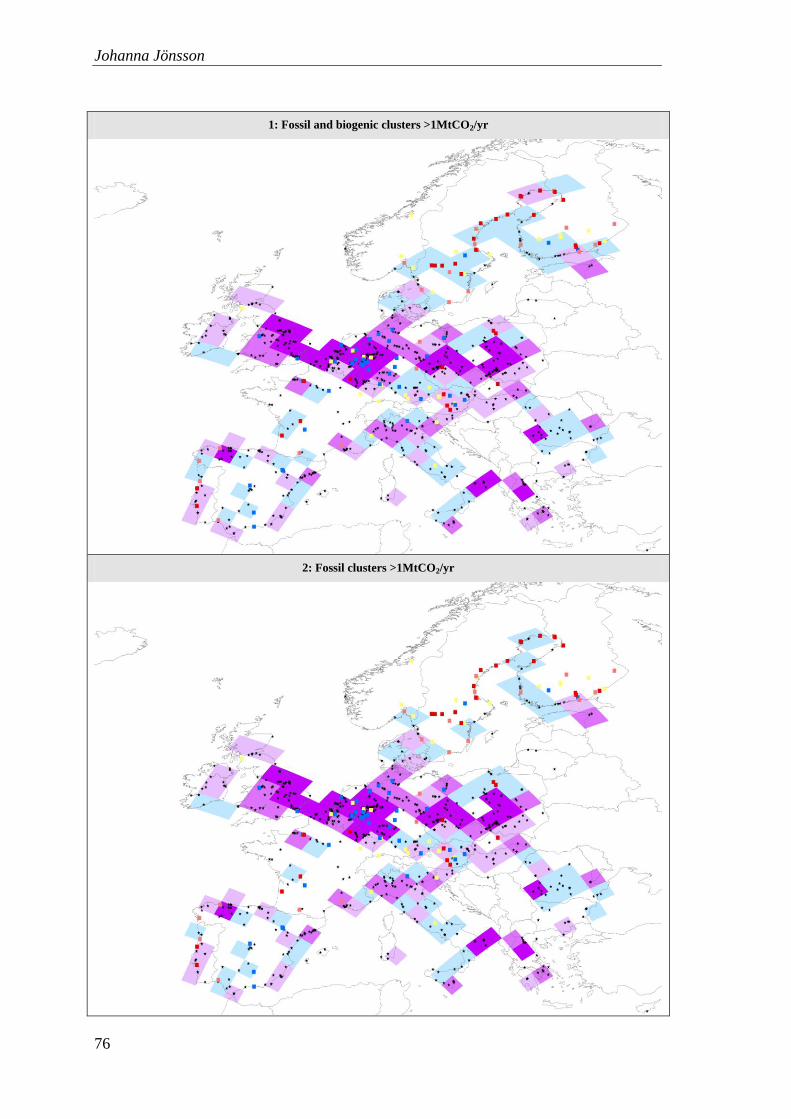
Johanna Jönsson
76
1: Fossil and biogenic clusters >1MtCO2/yr
2: Fossil clusters >1MtCO2/yr
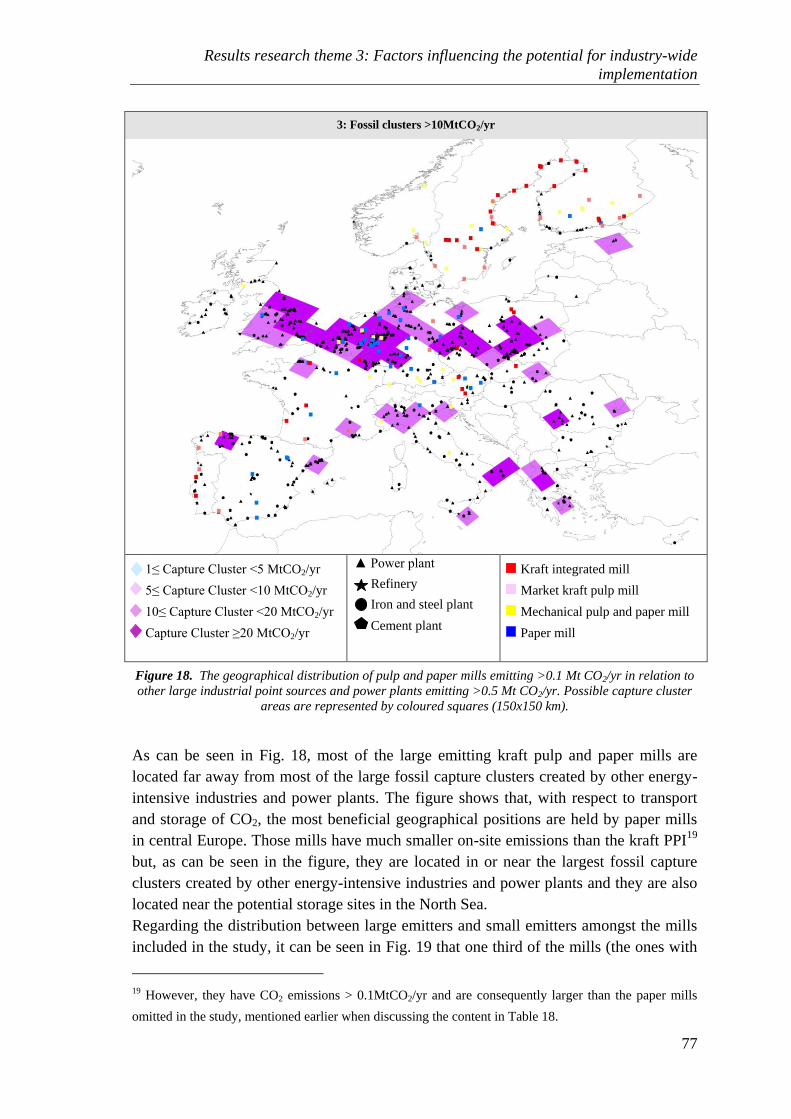
Results research theme 3: Factors influencing the potential for industry-wide
implementation
77
3: Fossil clusters >10MtCO2/yr
1≤ Capture Cluster <5 MtCO2/yr
5≤ Capture Cluster <10 MtCO2/yr
10≤ Capture Cluster <20 MtCO2/yr
Capture Cluster ≥20 MtCO2/yr
▲ Power plant
Refinery
Iron and steel plant
Cement plant
Kraft integrated mill
Market kraft pulp mill
Mechanical pulp and paper mill
Paper mill
Figure 18. The geographical distribution of pulp and paper mills emitting >0.1 Mt CO2/yr in relation to
other large industrial point sources and power plants emitting >0.5 Mt CO2/yr. Possible capture cluster
areas are represented by coloured squares (150x150 km).
As can be seen in Fig. 18, most of the large emitting kraft pulp and paper mills are
located far away from most of the large fossil capture clusters created by other energy-
intensive industries and power plants. The figure shows that, with respect to transport
and storage of CO2, the most beneficial geographical positions are held by paper mills
in central Europe. Those mills have much smaller on-site emissions than the kraft PPI19
but, as can be seen in the figure, they are located in or near the largest fossil capture
clusters created by other energy-intensive industries and power plants and they are also
located near the potential storage sites in the North Sea.
Regarding the distribution between large emitters and small emitters amongst the mills
included in the study, it can be seen in Fig. 19 that one third of the mills (the ones with
19 However, they have CO2 emissions > 0.1MtCO2/yr and are consequently larger than the paper mills
omitted in the study, mentioned earlier when discussing the content in Table 18.
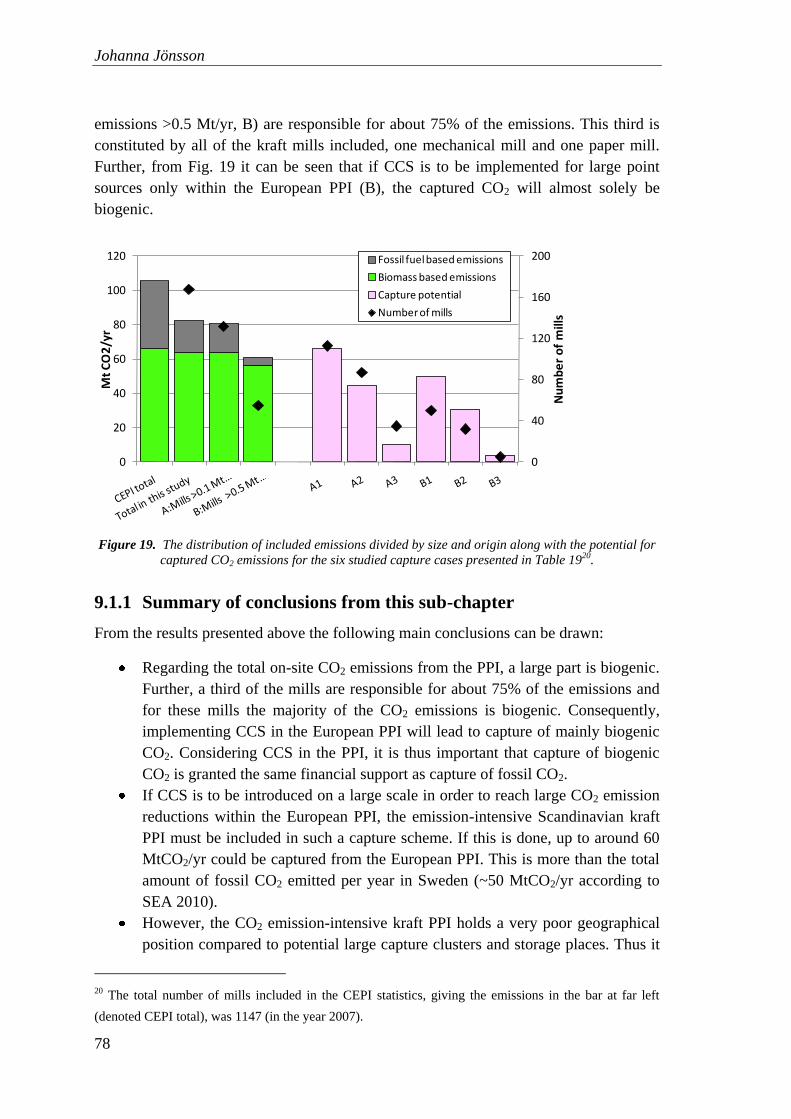
Johanna Jönsson
78
emissions >0.5 Mt/yr, B) are responsible for about 75% of the emissions. This third is
constituted by all of the kraft mills included, one mechanical mill and one paper mill.
Further, from Fig. 19 it can be seen that if CCS is to be implemented for large point
sources only within the European PPI (B), the captured CO2 will almost solely be
biogenic.
0
40
80
120
160
200
0
20
40
60
80
100
120
Nu
mb
er
of
mill
s
Mt
CO
2/y
r
Fossil fuel based emissions
Biomass based emissions
Capture potential
Number of mills
Figure 19. The distribution of included emissions divided by size and origin along with the potential for
captured CO2 emissions for the six studied capture cases presented in Table 1920.
9.1.1 Summary of conclusions from this sub-chapter
From the results presented above the following main conclusions can be drawn:
Regarding the total on-site CO2 emissions from the PPI, a large part is biogenic.
Further, a third of the mills are responsible for about 75% of the emissions and
for these mills the majority of the CO2 emissions is biogenic. Consequently,
implementing CCS in the European PPI will lead to capture of mainly biogenic
CO2. Considering CCS in the PPI, it is thus important that capture of biogenic
CO2 is granted the same financial support as capture of fossil CO2.
If CCS is to be introduced on a large scale in order to reach large CO2 emission
reductions within the European PPI, the emission-intensive Scandinavian kraft
PPI must be included in such a capture scheme. If this is done, up to around 60
MtCO2/yr could be captured from the European PPI. This is more than the total
amount of fossil CO2 emitted per year in Sweden (~50 MtCO2/yr according to
SEA 2010).
However, the CO2 emission-intensive kraft PPI holds a very poor geographical
position compared to potential large capture clusters and storage places. Thus it
20 The total number of mills included in the CEPI statistics, giving the emissions in the bar at far left
(denoted CEPI total), was 1147 (in the year 2007).
Results research theme 3: Factors influencing the potential for industry-wide
implementation
79
can be questioned whether the biogenic emissions from the Scandinavian PPI
are large enough to motivate the development of infrastructure.
9.2 Addressing the research question in theme 3
An important part of the work for this research theme was to develop a methodology
which could be used to answer the research questions posed. Here the developed
methodology was applied to CCS within the PPI, but could just as well be applied to
other industry branches or other technologies influenced by external geographical
factors, e.g. district heating.
Below, the research questions in theme 3 are addressed for the case of CCS:
Which process characteristics and external, geographical and infrastructural, factors
influence the potential for large-scale implementation of the pathways? In what way do
these characteristics and factors influence the potential? The process characteristic
which has the largest effect on the potential for implementation of CCS in the European
PPI is the on-site emissions of CO2. For the PPI, it is almost exclusively kraft mills
which have on-site emissions of >0.5 MtCO2/yr and thus the kraft PPI holds the largest
potential for capture of CO2. However, geographical and infrastructural factors such as
the proximity to so-called capture clusters and storage sites affect the potential for
transport and storage. With respect to geographical position in capture clusters, the
paper mills in Central Europe hold the largest potential for transport and storage, but
they have very small on-site emissions of CO2. It can thus be concluded that there is a
mis-match between where the PPI‟s CO2 emissions are located and where the largest
emission sources in Europe (and thus probably the future infrastructure for transport of
CO2) are located.

Johanna Jönsson
80
Discussion
81
10 Discussion This chapter gives a discussion on different aspects of the approach used for the thesis
work and on the reliability and accuracy of input data.
10.1 Mill characteristics and mill-level input data
This thesis and its results are largely based on mill-level studies of an average
Scandinavian market kraft pulp (model) mill. In practice, however, all mills are
different with respect to process equipment and layout, proximity to infrastructure etc.
This fact of course influences the generality of the results. Still, levels of steam savings
similar to the levels used in the study have been identified also for real market kraft
pulp mills in case studies, and thus the results are regarded as fairly general for kraft
pulp mills. The European PPI, though, consists not only of kraft pulp mills but also of
kraft integrated pulp and paper mills, mechanical pulp and paper mills, and paper mills
for which the analyses in Papers I-V, VII and IX are not applicable. An integrated kraft
pulp and paper mill can implement the same technologies as a kraft pulp mill but
cannot, due to a higher process steam demand, achieve a steam surplus in the same way.
This characteristic will influence both the economic performance and the related CO2
emissions of the technologies, since external fuel must be imported to cover the energy
demand of the new processes.
For the analysis in Papers I-III, V, VII and IX, the steam surplus that can be generated
through energy-efficiency measures and used for energy-efficient implementation of the
selected pathways is large. If the steam surplus had been smaller, this would have
affected the economic performance of the pathways, especially the capital-intensive
BLG cases which benefit from economy of scale.
The investment costs used for the new, emerging technologies (BLG, CCS and lignin
extraction) are estimated for commercially available plants, that is, the “Nth
plant”.
These technologies, however, still need to be demonstrated in large scale in order to
reach commercialisation. Consequently, the estimated investment cost for these
technologies is rather uncertain. In order to consider this uncertainty, a sensitivity
analysis of the investment cost for the not yet commercial technologies was included in
Papers VII and IX.
10.2 Assumptions, methods, tools and methodologies
Below, different aspects of the methods, tools and methodologies used are discussed.
Johanna Jönsson
82
10.2.1 Inherent limitations when using a engineering bottom-up
approach
Based on a engineering bottom-up approach, the work for this thesis uses disaggregated
models, containing a detailed representation of current and emerging technologies that
can be used to meet demands for different energy products. Technologies that provide
products which can fulfil the same demand/service are here assumed to be perfect
substitutes. They have, however, different estimated capital and operating costs, energy
use, and emissions profiles. Based on the estimated future capital and operating costs,
the technologies studied, generally, appear to be profitable relative to the existing
capital stock of equipment. Further, like most studies based on bottom-up models, this
thesis also finds that substantial emissions reduction related to energy use could be
profitable or available at low cost if new, low-emission technologies were to be
implemented in large scale. On the contrary, econometric top-down models seldom
identify such potentials for large emission reductions at low or negative costs. One
reason for this divergence is that an engineering bottom-up approach assumes that a
simple capital and operating cost estimate indicates the full social cost21
of
technological change In addition, some low-cost, low-emission technologies are not
perfect substitutes for their competitors (or at least not viewed as such buy the
investors).
10.2.2 Using the reMIND tool based on mixed-integer linear
programming
For the thesis work aiming at answering the research questions regarding economic
performance and global CO2 emissions for the selected pathways, the reMIND
modelling tool was used. The reMIND tool, like most tools based on mixed-integer
linear programming, uses “perfect foresight”. This means that the future energy market
prices are assumed to be known by the model at the time when the investments are
made, and that the uncertainty of the development of the energy market is handled by
performing sensitivity analysis or, as in this work, analysing different future energy
market conditions. In practice, however, the future energy market prices are usually not
known at the time of investment. To more fully depict this fact, optimization under
uncertainty can be used. In general, however, optimization under uncertainty is more
complicated than “regular” optimization and demands more data (e.g. probability
functions for the different uncertain parameters) and thus is more difficult to use.
Further, since optimization under uncertainty commonly assumes a decision-making
perspective, it is more difficult to analyse the results obtained by an analysis from
another perspective – such as a more general policy perspective.
21 Social cost is the total cost of any action (for example production of goods or services) due to the
consequences imposed on society by the action. The social cost is the sum of private costs, which are met
by the individuals or companies concerned, and indirect costs, which are passed on to third parties (e.g.
future generations or the society as a whole).
Discussion
83
10.2.3 Accuracy of the HLMPP
To a large extent, the accuracy of the HLMPP depends on how well the default values
set in the model correspond to the real values of the same process parameters in
different mills. Such knowledge can only be gained by applying the model to several
mills and thereby checking the accuracy of the default values as well as the results given
by the model. Being a new model, the HLMPP has not yet been widely applied and
validated. The previous studies performed using the tool, however, have given results
which correspond quite well to the results obtained by detailed analysis both for
pressurized ground wood (PGW) mills and for pulp and paper mills with TMP and DIP
lines. Further validation is, nonetheless, essential in order to establish the accuracy of
the tool.
10.2.4 Using different versions of the ENPAC tool
As stated, this thesis work uses energy market prices and related emission for different
energy carriers generated by the ENPAC tool. Since the ENPAC tool was further
developed and updated in parallel to the thesis work, different versions of the tool were
used. The versions mainly give different absolute values for the prices of different
energy carriers. Independently of which version is used, however, the results generally
show the same structure (see Chapter 8).
10.3 Data availability and reliability of data for the industry-level analysis
When performing the industry level analysis, one major recurrent problem was the
constant lack of public data and statistics. Mill-level data for total fuel and electricity
balances, together with data for fossil and biogenic CO2 emissions, were only compiled
and openly published on a national level for the mills in Sweden. Further, when
contacting multinational companies within the PPI, the companies refused to share such
(in Sweden public) data for their European mills. Therefore, data for the non-Swedish
mills were retrieved from many different sources, mainly environmental reports and
company homepages.
Further, when using data from public sources, the risk of errors in the reported data
must be borne in mind. For the studies presented in this thesis, one source of public data
was the Environmental database managed by the Swedish Forest Industries Federation.
In the course of the work on this thesis, some data in the database were compared to
detailed mill data from the mills‟ internal energy reports. This comparison revealed
certain errors in the database, such as errors in the amount of pulp and/or paper
produced and errors in the total amount of energy used (in one case the energy used in
the lime kiln was excluded, giving an error of 22% in the amount of total fuel usage).
Unfortunately, it can be assumed that similar errors may occur in other public databases
and documents (such as environmental and annual reports).

Johanna Jönsson
84
As for most models, the models used in this thesis work show accurate and good results
when using accurate input data. However, since there is no guarantee that the publicly
reported data are correct; the main uncertainties are perhaps not in the models
themselves but in the data retrieved from public sources. To avoid such errors, the data
retrieved from public sources were checked for reasonability and, in cases where data
were found to be outside the expected range, the data were either subjected to
supplementary calculations or, if possible, checked with the mill in question.
Conclusions
85
11 Conclusions Short summaries of the main findings from the appended papers, addressing the three
research question themes, are given at the end of Chapters 7, 8 and 9 and their
respective sub-chapters. This chapter states the main conclusions of the thesis, based on
the findings for each research question theme and the results of the appended papers.
This thesis aims at analysing selected future technology pathways for the European PPI,
focusing on kraft pulp mills. The pathways studied are strategic in nature and will, if
implemented, have a significant effect on a mill‟s energy system. For the kraft pulp
industry, this thesis gives new insights into the question of economic performance and
potential for reduction of global CO2 emissions for different technology pathways
assuming different developments of the future energy market. The thesis also gives new
methodological insights and shows how earlier, detailed research can be lifted to a
higher system level in order to be put in context and to answer research questions on a
more aggregated industry level.
Given the assumptions stated in Chapters 5 and 6 and the results presented in Chapters
7, 8 and 9, the following main conclusions are drawn:
Using high-temperature excess heat internally gives, in general, a better economic
performance and a larger potential for reduction of global CO2 emissions than
using the excess heat externally. It can be concluded that for efficient use of excess
heat, it is important to identify the temperature levels where excess heat is available.
Exporting high-temperature excess heat for district heating purposes does not give any
radical improvement in either economic performance or reduction of global CO2
emissions compared to utilizing it for other purposes internally at the mill. However, if
the mill has substantial amounts of excess heat which cannot be utilized internally
(typically of a temperature around 90° or lower), export for district heating purposes can
be an interesting option since it can be combined with the other studied pathways. For
low-temperature excess heat, another alternative is to invest in a heat pump to increase
the temperature to higher, internally usable, temperatures. This option has only been
marginally studied in this thesis, but can be an interesting option worth further analysis.
The new, emerging technology pathways that can be combined with carbon
capture show the largest potential for reduction of global CO2 emissions; however,
the proven technology pathways show a more robust economic performance. The
results show that for a kraft pulp mill the new and emerging technology pathways,
which can be combined with carbon capture (i.e. BLG and increased electricity
production in combination with CCS coupled to the recovery boiler flue gases) and with

Johanna Jönsson
86
improved energy efficiency, hold much larger potential for reduction of global
emissions of CO2 than the proven pathways for all of the energy market scenarios
studied. However, studying the trade-off between the different pathways for different
CO2 charges and corresponding developments in the energy market, it can be concluded
that from an economic point of view the proven pathways (electricity production,
district heating production and selling bark) are much more robust and thus likely to be
preferred by the industry. Generally, applying a high cost of CO2 will profit both the
emerging and the proven pathways, and consequently applying a high cost of CO2 alone
may not be enough to reach the full potential for CO2 emissions reduction held by the
emerging pathways.
The technology pathways giving the largest reductions of global CO2 emissions
never have the best economic performance; however, for a future with high CO2
charge, the marginal cost for further reductions is low. For the variety of energy
market conditions studied, the results show that the technologies achieving the largest
CO2 emission reductions never have the best economic performance. Consequently, if
the full (technical) potential for CO2 emission reductions in the kraft PPI is to be
achieved, some additional economic incentive may be needed (or the CO2 charge needs
to be higher than the highest level assumed in this thesis). For a future with high CO2
charge and a high biomass price, however, the results show that the marginal cost of
further reduction of CO2 emissions is low, and consequently in these scenarios the
additional economic support for reaching large CO2 reductions does not need to be
large. Nonetheless, it should be noted that implementing more than one policy
instrument at the same time increases the complexity of the system, reduces the
transparency of the system, and might not lead to the desired result. Further, targeted
policy instruments can distort the market and, if the CO2 charge is assumed to be set on
sound grounds, it can be questioned whether it is reasonable to allocate additional
economic resources to specific technologies through such policy instruments.
If lignin can be valued as oil rather than biomass, extraction of lignin shows both a
good economic performance and fairly large potential for reduction of CO2
emissions. For the variety of energy market scenarios studied, extraction of lignin
shows fairly robust results for economic performance and potential for reduction of
global CO2. How well extraction of lignin performs compared to the performance of the
other technology pathways studied, however, largely depends on how the lignin is
valued. If lignin is valued as biomass (chips or pellets), the economic performance is
low compared to the proven pathways, and the potential for reduction of global CO2
emissions is much lower than the potential for reduction held by the other emerging
technology pathways. On the other hand, if lignin is valued as oil, lignin extraction
shows a very good, robust, economic performance compared to all of the technology
pathways studied – even the best, for some energy market scenarios. The potential for
reduction of global CO2 emissions is also larger if lignin is valued as oil, although, the
Conclusions
87
potential is never as large as the potential for CO2 emission reductions held by the
BLG:CCS and CCS coupled to the recovery boiler flue gases.
If electricity is produced from the product gas (BLGCC) and/or if BLG is
combined with CCS, BLG holds a potential for large reductions of global CO2
emissions, compared to the other pathways studied. If CCS is assumed not to be
available, BLGCC holds the largest potential for reduction of global CO2 emissions.
Also, if CCS is assumed to be available, BLGCC has a potential for CO2 emissions
reduction comparable with CCS on the recovery boiler flue gases (which generally hold
the largest potential for reduction if CCS is assumed to be available). For the
assumptions made, BLGMF generally has a better economic performance than BLGCC
but has a lower potential for reduction of global CO2 emissions. However, the economic
performance of BLGMF is highly influenced by several parameters such as biofuel
policy instruments and investment costs. Both BLGMF and BLGCC benefit from
economy of scale and have a better economic performance if a production capacity
increase is assumed (and BLG is used to debottleneck the recovery boiler), compared to
when the production capacity remains unchanged.
It is important to consider the uncertainty of the future energy market. Some of the
pathways studied are not commercially viable today, and by the time they are
commercially viable the (volatile) energy market might not resemble the current energy
market. This thesis work shows that the development of the energy market (energy
market scenarios) has a greater influence on the economic performance and global CO2
emissions of the studied technology pathways than has the uncertainty of single
parameters, such as the capital recovery factor and the investment cost for emerging
technologies.
For the European PPI, CCS has an up-hill road in order to be a viable, large-scale
alternative for reduction of CO2 emissions. The amount of CO2 that can be captured
and stored depends heavily on the expansion of CO2 transport infrastructure. Assuming
a very widespread development of CO2 transport infrastructure, up to ~60 MtCO2/yr
could be captured. This is more than the total annual fossil CO2 emissions in Sweden.
However, when matching the PPI capture potential with the potential for CCS in other
energy-intensive industries and the emission from the power and heat sector, the
majority of the PPI emissions originate from kraft pulp and paper mills far away from
potential fossil capture clusters, especially if only the largest clusters are considered
(>10 MtCO2/yr). The paper mills in central Europe are geographically most suitable for
CCS, but these mills generally have much lower on-site emissions than the
Scandinavian kraft pulp and paper mills. It should thus be further investigated whether
the biogenic capture clusters in Scandinavia are large enough to motivate the
infrastructure needed for transport to potential storage sites.
Bringing earlier, detailed research together and analysing it on a higher systems
level gives new insights and enables answering research questions on a more
Johanna Jönsson
88
aggregated industry level. This thesis gives new insights and shows how earlier
detailed research can be lifted to a higher system level in order to be put in context and
to answer research questions on a more aggregated, industry level. The thesis also
shows how general estimates of steam use and integration potentials are done for
different mills. As an example of how the methodology can be used, a case study of the
potential for implementation of CCS in the European PPI is presented. For CCS, earlier,
detailed research has shown a promising potential for implementation and thermal
integration in kraft pulp mills. Using the methodology developed throughout this thesis
work, a broader perspective on CCS in the European PPI is given, based on this earlier
research. The option of CCS is compared with alternative pathways and the potential for
industry-wide implementation is estimated. The developed methodology could just as
well be applied to other technologies influenced by external geographical factors, e.g.
district heating, or other industry branches such as the oil refinery industry.
Improving the availability (and accuracy) of public data and statistics is a key
factor if good industry-level analyses are to be performed. This thesis work shows
that, for kraft pulp mills, fairly accurate estimates can be made regarding the process
steam use based on only a small amount of data. In Sweden such data are public or
easily accessible. On a European level, however, such data are difficult to obtain and the
industry is very restrictive when asked to contribute with data. If this were to change,
studies regarding the potential for and effect of large-scale implementation of the
studied pathways in the European PPI could more easily be performed.
Further work
89
12 Further work
This chapter points out some interesting areas where future work can be performed.
There is an increasing amount of research and development activities regarding
extraction of hemicelluloses prior to cooking at a kraft mill. This is partly due to the
currently beneficial economic conditions for production of dissolving pulp, where the
hemicelluloses must be separated from the wood fibres. Removing the hemicelluloses
(and/or converting kraft pulp production lines into dissolving pulp lines) will, however,
alter the energy balance of the mill since it reduces the energy content in the black
liquor. It remains to be studied how extraction of hemicelluloses can be thermally
integrated at different types of mills, how its profitability and global CO2 emissions
effect compares to other technology options, and how it can be combined with other
technologies, e.g. black liquor gasification.
This thesis mainly focuses on technology pathways of interest for kraft market pulp
mills, having both internal biomass streams available and potential for a steam surplus.
For other types of mills, other technologies can be of more interest. Such technologies
are gasification of biomass, upgrading of biomass through e.g. drying, pelleting,
pyrolysis and torrefaction, etc. For implementation of such technologies, the existing
PPI, compared to building green-field stand-alone plants, could benefit from having the
biomass-handling infrastructure in place and the potential for heat integration between
the mill processes and the new biorefinery processes. It is of interest to study which
factors affect the potential for large-scale implementation of such technologies. It would
also be interesting to study how such implementation would affect the overall energy
balance, and consequently the global CO2 emissions, of the European PPI.
This thesis focuses on the integration of technology pathways to existing, European
kraft pulp mills. Relative to the PPI in e.g. China and South America, the European
mills are rather old and small. It would be interesting to study whether/how the size and
age of the mills affect the economic performance and the potential for reduction of
global CO2 emissions for the studied pathways.
Finally, based on the results from this work regarding CCS in the European PPI, it could
be of interest to go further with the investigation of whether the biogenic capture
clusters in Scandinavia are large enough to motivate the infrastructure needed for
transport to potential storage sites. If this is to be done, more knowledge regarding
potential capture sites bordering the Baltic Sea and more cost estimations for different
transport alternatives are needed. It could also be worthwhile to look further into the
option of mineralization of CO2, assuming that the mineralization technology reaches a
technological breakthrough.

Johanna Jönsson
90
Abbreviations
91
13 Abbreviations
Adt Air Dry tonne
BAT Best Available Technology
BAU Business As Usual
BL Black Liquor
BLG Black Liquor Gasification
BLGCC Black Liquor Gasification Combined Cycle
BLGMF Black Liquor Gasification with Motor Fuel production
CC Carbon Capture
CCS Carbon Capture and Storage
CDM Clean Development Mechanism
CEPCI Chemical Engineering Plant Cost Index
CEPI Confederation of European Paper Industries
CHP Combined Heat and Power
CP Coal Power
CTMP Chemi-ThermoMechanical Pulp
d Day
DH District Heating
DIP De-Inked Pulp
DME DiMethyl Ether
EC European Commission
ECF Elementary Chlorine Free (bleaching)
ETS Emission Trading Scheme (EU)
GB Gas Boiler
GW Ground Wood (pulp)
HEN Heat Exchanger Network
HLMPP Heat Load Model for Pulp and Paper
HP High Pressure (steam, ~60-100 bar)
HW HardWood (e.g. birch, eucalyptus)
LP Low Pressure (steam, ~2-5 bar)
LWC Light Weight Coated
MFC Machine Finished Coated
MEA Mono-EthanolAmine
MP Medium Pressure (steam, ~9-14 bar)
MP2 Steam with a pressure between HP and MP (~25 bar)
News Newsprint
NGCC Natural Gas Combined Cycle
PGW Pressurised Ground Wood pulp

Johanna Jönsson
92
PPI Pulp and Paper Industry
RB Recovery Boiler
RCF ReCycled Fibre
SEA Swedish Energy Agency
SEC Specific Electricity Consumption
SF Statistics Finland
SW SoftWood (e.g. spruce, pine)
TCF Totally Chlorine Free (bleaching)
TD Telephone Directory
TMP Thermo-Mechanical Pulp
Acknowledgements
93
14 Acknowledgements
This work has been carried out under the auspices of the Energy Systems Programme,
primarily financed by the Swedish Energy Agency. The work was co-funded by the
AGS project “Pathways to Sustainable European Energy Systems” and the EU ENCAP
project through the Södra Foundation for Research, Development and Education.
For me the journey towards a PhD started already in 1993 when both my parents
received their PhD degrees (in the same week). Influenced by their hard work I
thereafter always stated “at least I will never do a PhD” when someone asked what I
would do when I grew up/finished school/graduated from University. I strongly held to
that belief until I actually applied for my PhD position in 2006. And so now, six years
later I have actually done a PhD (!!). This PhD journey of mine would not have been
possible without the help, support and inspiration from numerous people, of whom I
would especially like to thank “a few”:
First of all I would like to thank my supervisor Thore Berntsson for all interesting
discussions and for challenging, pushing and supporting me. You have been a source of
inspiration and I am sure I have improved my rhetorical skills thanks to our many
debates (even though I probably lost most of them…).
Jessica Algehed, thank you for working together with me during the time you
supervised my work and for your help with defining the structure of the later part of my
work. I would also like to thank you for showing me how to do crochet work AND look
totally professional during meetings at the same time. (However, as you can see I still
have a bit more to learn regarding how to “keep it short and simple”.)
To my co-supervisors Ingrid Nyström and Magnus Karlsson: Thank you for always
taking your time to answer my questions and for giving me feedback on everything
from very general to very specific questions.
Patrik Thollander, thank you for taking your time to give me constructive comments
on the draft version of this thesis. Jon van Leuven, thank you for editing the language
in this thesis and most of the appended papers (and you are right, I did not acquire my
language skills at a Catholic school in Argentina!).
Simon Harvey, thank you for our many interesting discussions on structure and
organization. Lennart Persson-Elmeroth, thank you for your support when we worked
in the IES course together but most of all thank you for always taking your time to
answer my (many) questions without making me feel stupid even once. Lennart
Vamling, thank you for always having time to discuss very important gender equality
questions with me; it was lots of fun.
Johanna Jönsson
94
I would also like to thank the “VoM-support team”: Bengt, for not getting angry when I
repeatedly set of the alarm in 2007 and for being a great companion in the
“samverkansgrupp”. Raya, Birgitta and Lillemor, for fixing “everything” always –
you are rocks!
To Ola Eriksson-Norrman; due to your splendid supervision of my master thesis work
I changed my mind from “at least I will never do a PhD!” to “hmm, I might apply for
that PhD-position”. And here I am. Further, I would like to thank you for the
“inspirational supervision” during my thesis work and for being a friend.
Marie-Louise Lagerstedt-Eidrup, how lucky was I to get you as my mentor? Thank
you for all our great talks; they have given me both perspective and inspiration. I hope
we can continue to meet!
The best roommate one could have: Karin Pettersson, thank you for helping me adjust
to the world of chemical engineering (and chemical engineers) and being such a
wonderful and supportive friend through all my professional and private ups and downs
during these 6 years. I will really miss our daily talks regarding kraft pulping, the
meaning of life and everything in between (how great wouldn‟t the world be if we ruled
it??). I would also like to thank you for our shared work on Papers VII and IX.
Inger-Lise Svensson, my co-author for Papers I and II, “P3” colleague and friend:
thank you for the research co-operation, for letting me crash on your sofa on numerous
occasions, for all good times we have shared during paper writing, being delayed at
airports, long conference dinners etc. I look forward to spending lots of time with you
and your “better half” now when you have moved to the right part of Sweden. Mikael
Ottosson, thank you for all fun times during and after the “tvärprojekt”.
Pekka Ruohonen, thank you for our “international” collaboration, joint master thesis
supervision and the co-authorship of Paper VI. Also, thank you for all fun times we
have had during conference trips; you sure know how to party!
To my master thesis students, Valeria Lundberg, Moa Festin and Grégory Michel:
thank you for your hard work; it was a joy to supervise you!
My fellow PhD students at VoM, thank you for making the division such a joyful place
to work, for “innebandy”, “dressed up Friday” and for the very interesting fika-
discussions regarding biorefineries, energy efficiency and all other buzzwords.
Mathias, thank you for being a great friend and for helping me out with lots of non-
work related stuff, I enjoy your company! Elin, thank you for all (seemingly) endless
(but very interesting) discussions we have had and for your supportive friendship
throughout the work with this thesis. Catherine, thank you for the first year we shared
at VoM (but maybe most for the continued friendship thereafter).
To all the people in the Energy Systems Programme: Thanks for five intellectually
rewarding years! Special thanks to the people in “Industrikonsortiet” and all “d06-or”

Acknowledgements
95
for discussions, debates and fun times. Elisabeth, thank you for being the intelligent,
energetic person you are (and for helping me move all my stuff that horrible Christmas).
All the people involved in the Pathways project, thank you for interesting discussions
and fruitful meetings. Special thanks to Johan Rootzén for the help with data for article
VIII and all the GIS-drawings.
To the people at the Paper and Fiber Research Institute (PFI), Norske Skog Skogn,
Norske Skog Saugbrugs, Norske Skog Follum and Holmen Braviken: Thank you for
your cooperation, for welcoming and supporting my master thesis students and for
providing data for Paper VI.
To my friends, “none mentioned, none forgotten”, thank you for being in my life and
for taking my mind off work in the most pleasant way. What would these years have
been without our days and nights of dwelling and drinking red wine and all our
“pysselkvällar”?
To my sibbling Maria and Axel, thank you for enduring my (sometimes) long and
boring work-related monologues, and for loving me even when I am a bossy wiseacre
older sister.
My little family, Jacob and Maja: Jacob, thank you for supporting me, for challenging
me both intellectually and emotionally and for making me so very happy. You are the
first guy I‟ve met who actually considers my doing a PhD to be a turn-on. Thus, you
must be a real catch (lucky me!). And Maja, I can‟t really thank you for contributing to
the thesis in any way whatsoever. In fact, your grand entrance to this world more or less
had the opposite effect on the thesis work. However, you are the best thing that has ever
happened to me, I love you so much! (So I guess I forgive you for delaying the thesis.)
Finally, to “mina dagars ursprung”, mamma Ingrid and pappa Håkan: this book is
dedicated to you. Thank you for your unconditional love and for always believing in
me. Thanks to you, I know that I can achieve anything I set my mind to as long as I
work hard enough (even a PhD…). So, thank you for life, thank you for everything!

References
97
15 References
Abu-Zahra, M. R. M., J. P. M. Niederer, et al. (2007). "CO2 capture from power plants:
Part II. A parametric study of the economical performance based on mono-
ethanolamine." International Journal of Greenhouse Gas Control 1(2): 135-142.
Andersson, E. and S. Harvey (2006). "System analysis of hydrogen production from
gasified black liquor." Energy 31(15): 3426-3434.
Andersson, E., S. Harvey, et al. (2006). "Energy efficient upgrading of biofuel
integrated with a pulp mill." Energy 31(10-11): 1384-1394.
André P.C.F. (2006). "Bio-energy in Europe: changing technology choices." Energy
Policy 34(3): 322-342.
Axelsson, E. and T. Berntsson (2005). "Pinch analysis of a model mill: Economic and
environmental gains from thermal process-integration in a state-of-the-art magazine
paper mill." Nordic Pulp and Paper Research Journal 20(3): 308-315.
Axelsson, E. and T. Berntsson (2008). "Heat integration opportunities in an average
Scandinavian fine paper mill: Model study and comparison with a market pulp mill."
TAPPI Journal 7(2): 19-25.
Axelsson, E. and S. Harvey (2010). Scenarios for assessing profitability and carbon
balances of energy investments in industry. AGS Pathways report 2010:EU1. AGS, The
alliance for global sustainability. Pathways to sustainable European energy systems.
Göteborg, Sweden.
Axelsson, E., M. R. Olsson, et al. (2006). "Heat Integration Opportunities in Average
Scandinavian Kraft Pulp Mills: Pinch Analysis of Model Mills." Nordic Pulp and Paper
Research Journal 21(4): 466-474.
Axelsson, E., M. R. Olsson, et al. (2006). "Increased capacity in kraft pulp mills: Lignin
separation and reduced steam demand compared with recovery boiler upgrade." Nordic
Pulp and Paper Research Journal 21(4): 485-492.
Axelsson, E., M. R. Olsson, et al. (2008). "Opportunities for process-integrated
evaporation in a hardwood pulp mill and comparison with a softwood model mill
study." Applied Thermal Engineering 28(16): 2100-2107.
Bengtsson, C. (2004). Novel Process Integration Opportunities in Existing Kraft Pulp
Mills with Low Water Consumption. Department of Chemical Engineering and
Environmental Science, Division of Heat and Power Technology, Chalmers University
of Technology. PhD thesis. Göteborg, Sweden.
Johanna Jönsson
98
Bengtsson, C., R. Nordman, et al. (2002). "Utilization of excess heat in the pulp and
paper industry – A case study of technical and economic opportunities." Applied
Thermal Engineering 22(9): 1069-1081.
Berglin, N., M. Lindblom, et al. (2003). "Preliminary economics of black liquor
gasification with motor fuels production." Proceedings of the Colloquium on Black
Liquor Combustion and Gasification, Park City, Utah, 2003, May13-16.
Berntsson, T. (2008). Swedish Pulp Mill Biorefineries – A vision of future possibilities.
ER 2008:26. The Swedish Energy Agency (SEA). Eskilstuna, Sweden.
Brown, D., F. Maréchal, et al. (2004). "Mass integration of a deinking mill."
Proceedings of the 90th Annual meeting – Pulp and Paper Technical Association of
Canada (PAPTAC), Montreal, Quebeck, Canada, 2004, January 27-29.
Bärring, M., O. Nyström, et al. (2003). El från nya anläggningar – 2003. Jämförelse
mellan olika tekniker för elgenerering med avseende på kostnader och
utvecklingstendenser. Elforsk rapport nr 03:14, Elforsk. (In Swedish)
CEPI (2008). Annual Statistics 2007 – European Pulp and Paper Industry.
Confederation of European Paper Industries, Brussels, Belgium.
CEPI (2011). Key Statistics 2010 – European Pulp and Paper Industry, Confederation of
European Paper Industries, Brussels, Belgium.
Consonni, S., R. E. Katofsky, et al. (2009). "A gasification-based biorefinery for the
pulp and paper industry." Chemical Engineering Research and Design 87(9): 1293-
1317.
Davidsdottir, B. and M. Ruth (2005). "Pulp nonfiction: Regionalized dynamic model of
the U.S. pulp and paper industry." Journal of Industrial Ecology 9(3): 191-211.
Difs, K., E. Wetterlund, et al. (2010). "Biomass gasification opportunities in a district
heating system." Biomass and Bioenergy 34(5): 637-651.
EC (2004). European Energy and Transport – Scenarios on key drivers. European
Commission Directorate-General for Energy and Transport, Belgium.
EC (2010). Communication from the Commission to the European Parliament, the
Council, the European Economic and Social Committee and Committee of the Regions.
Energy 2020 – A strategy for competitive, sustainable and secure energy, Belgium.
Ecofys (2009). Methodology for the free allocation of emission allowances in the EU
ETS post 2012 – Sector report for the pulp and paper industry. Ecofys project number:
PECSNL082164, Ecofys, Fraunhofer Institute for Systems and Innovation Research and
Öko-Institut. By order of the European Commission.
References
99
ECOTARGET (2005). D6.1.1 Description of the reference mills for ECOTARGET
project. 500345, ECOTARGET.
Egeskog, A., J. Hansson, et al. (2009). "Co-generation of biofuels for transportation and
heat for district heating systems – an assessment of the national possibilities in the EU."
Energy Policy 37(12): 5260-5272.
Ekbom, T., N. Berglin, et al. (2005). Black Liquor Gasification with Motor Fuel
Production – BLGMF II Nykomb Synergetics, Stockholm, Sweden.
Ekström, C., M. Blümer, et al. (1997). Teknik- och kostnadsalternativ i Sverige för
avskiljning och deponering av koldioxid som bildats vid förbränning av fossila bränslen
för produktion av elkraft, värme och/eller fordonsdrivmedel. En systemstudie. Report
UY 97:15Ö. Vattenfall Utveckling AB, Stockholm, Sweden. (In Swedish)
Energiateollisuus. (2011). Fjärrvärmeåret 2010. Retrieved 2011-09-07 from
http://www.energia.fi/sites/default/files/fjarrvarme_2010.ppt.
Energy Markets Inspectorate (2010). Uppvärmning i Sverige 2010. EI R2010:04.
Energimarknadsinspektionen, Eskilstuna, Sweden. (In Swedish)
Eriksson, H. and S. Harvey (2004). "Black liquor gasification – consequences for both
industry and society." Energy 29(4): 581-612.
Eriksson, H., S. Harvey, et al. (2002). "Efficient use of biomass in black liquor
gasification plants." Pulp and Paper Canada 103(12): 67-73.
Eurostat (2009). Energy, transport and environment indicators. Eurostat pocketbooks.
Luxembourg.
Farahani, S., E. Worrell, et al. (2004). "CO2-free paper?" Resources, Conservation and
Recycling 42(4): 317-336.
Fornell, R. (2010). Energy efficiency measures in a kraft pulp mill converted to a
biorefinery producing ethanol. Department of Energy and Environment, Division of
Heat and Power Technology, Chalmers University of Technology. Licentiate thesis.
Göteborg, Sweden.
Fouche, E. D. and S. Banerjee (2004). "Improving energy efficiency in the forest
products industry." TAPPI Journal 3(11): 24-26.
FRAM (2005). FRAM Final report – Application area: Model mills and system
analysis. FRAM report No. 70.
Ghezzaz, H. and P. Stuart (2011). "Biomass availability and process selection for an
integrated forest biorefinary." Pulp and Paper Canada 112(3): 19-26.
Johanna Jönsson
100
Grönkvist, S., M. Bryngelsson, et al. (2006). "Oxygen efficiency with regard to carbon
capture." Energy 31(15): 3220-3226.
Grönkvist, S., E. Grundfelt, et al. (2008). CO2-avskiljning i Sverige,
Ångpanneföreningens forskningsstiftelse and Naturvårdsverket. (In Swedish)
Gustafsson, M. and E. Larsson (2003). Svenska Värmenät – Potential för utökat
värmeunderlag för kraftvärme och spillvärme genom sammanbyggnad av fjärrvärmenät.
FVF 03 12 12, Svensk Fjärrvärme. (In Swedish)
Hackl, R., E. Andersson, et al. (2011). "Targeting for energy efficiency and improved
energy collaboration between different companies using total site analysis (TSA)."
Energy 36(8): 4609-4615.
Hakala, J., J. Manninen, et al. (2008). "Generic tool for screening energy saving
potential in pulp and paper industry." Proceedings of the 11th
Conference on Process
Integration, Modelling and Optimisation for Energy Saving and Pollution Reduction,
PRES, Prague, Czech Republic, 2008, August 24-28.
Hansson, J., G. Berndes, et al. (2009). "Co-firing biomass with coal for electricity
generation – An assessment of the potential in EU27." Energy Policy 37(4): 1444-1455.
Hektor, E. and T. Berntsson (2007). "Future CO2 removal from pulp mills – Process
integration consequences." Energy Conversion and Management 48(11): 3025-3033.
Hektor, E. and T. Berntsson (2008). "CO2 capture in pulp and paper mills –
Opportunities for chilled ammonia absorption." Proceedings of the 11th
Conference on
Process Integration, Modelling and Optimisation for Energy Saving and Pollution
Reduction, PRES, Prague, Czech Republic, 2008, August 24-28.
Hektor, E. and T. Berntsson (2009). "Reduction of greenhouse gases in integrated pulp
and paper mills: possibilities for CO2 capture and storage." Clean Technologies and
Environmental Policy 11(1): 59-65.
Huang, H. J. and S. Ramaswamy (2010). "Process simulation of pulp mill-based
integrated biorefinery with hemicellulose pre-extraction and black liquor gasification."
Proceedings of the 2010 AIChE Annual Meeting, 10AIChE, Salt Lake City, UT, United
States, 2010, November 7-12.
Huang, H. J., S. Ramaswamy, et al. (2010). "Process modeling and analysis of pulp
mill-based integrated biorefinery with hemicellulose pre-extraction for ethanol
production: A comparative study." Bioresource Technology 101(2): 624-631.
IEA (2004). World Energy Outlook 2004. International Energy Agency, Paris, France.
References
101
IPCC (2001). Climate Change 2001 – Mitigation. Cambridge University Press,
Contribution of Working Group III to the Third Assessment Report of the
Intergovernmental Panel of Climate Change.
Isaksson, J., M. Mahmoudkhani, et al. (2011). "Integration of biomass gasification with
a Scandinavian mechanical pulp and paper mill." Proceedings of the 24th
International
Conference of Efficiency, Cost, Optimization, Simulation and Environmental Impact of
Energy Systems, ECOS, 2011, Novi Sad, Serbia, 4-7 July.
Jaccard, M. and J. Roop (1990). "The ISTUM-PC model : Trial application to the
British Columbia pulp and paper industry." Energy Economics 12(3): 185-196.
Joelsson, J. M. and L. Gustavsson (2008). "CO2 emission and oil use reduction through
black liquor gasification and energy efficiency in pulp and paper industry." Resources,
Conservation and Recycling 52(5): 747-763.
Johansson, D., J. Rootzén, et al. (submitted for publication). "Assessment of Strategies
for CO2 Abatement in the European Petroleum Refining Industry." Submitted to Energy
the International Journal, 2011.
KAM (2003). Ecocyclic Pulp Mill – “KAM”, Final Report 1996-2002. KAM-report
A100. STFI. Stockholm, Sweden.
Kankkonen, S., J. Suutela, et al. (2010). "Enhancing the power generation in a modern
greenfield pulp mill." Proceedings of the 2010 International Chemical Recovery
Conference, Williamsburg, VA, United States, 2010, 29 March – 1 April.
Karlsson, M. (2011). "The MIND method: A decision support for optimization of
industrial energy systems - Principles and case studies." Applied Energy 88(3): 577-
589.
Karlsson, M. and M. Söderström (2002). "Sensitivity analysis of investments in the pulp
and paper industry On investments in the chemical recovery cycle at a board mill."
International Journal of Energy Research 26(14): 1253-1267.
Kemp, I. C. (2007). Pinch Analysis and Process Integration: A User Guide on Process
Integration for the Efficient Use of Energy (2nd ed.). Oxford, Butterworth-Heinemann.
Kinstrey, B. and D. White (2007). "Pulp and paper industry energy bandwidth study."
Proceedings of the Engineering, Pulping and Environmental Conference, TAPPI,
Jacksonville, FL, United States, 2007, October 21 - 24.
Kjärstad, J. and F. Johnsson (2007). "The European power plant infrastructure –
Presentation of the Chalmers energy infrastructure database with applications." Energy
Policy 35(7): 3643-3664.
Johanna Jönsson
102
Klemeš, J., V. R. Dhole, et al. (1997). "Targeting and design methodology for reduction
of fuel, power and CO2 on total sites." Applied Thermal Engineering 17(8-10): 993-
1003.
Klemeš, J., F. Friedler, et al. (2010). Sustainability in the Process Industry: Integration
and Optimization, McGraw-Hill.
Klugman, S., M. Karlsson, et al. (2007a). "A Scandinavian chemical wood pulp mill.
Part 1. Energy audit aiming at efficiency measures." Applied Energy 84(3): 326-339.
Klugman, S., M. Karlsson, et al. (2007b). "A Scandinavian chemical wood-pulp mill.
Part 2. International and model mills comparison." Applied Energy 84(3): 340-350.
Laaksometsä, C., E. Axelsson, et al. (2009). "Energy savings combined with lignin
extraction for production increase: Case study at a eucalyptus mill in Portugal." Clean
Technologies and Environmental Policy 11(1): 77-82.
Lafourcade, S., J. Labidi, et al. (2003). "Thermal pinch analysis with process streams
mixing at a TMP-newsprint mill." Pulp and Paper Canada 104(12): 74-77.
Larson, E. D., S. Consonni, et al. (2009). "An assessment of gasification-based
biorefining at kraft pulp and paper mills in the United States, Part B: Results." Tappi
Journal, January 2009: 27-35.
Leduc, S., J. Lundgren, et al. (2010). "Location of a biomass based methanol production
plant: A dynamic problem in northern Sweden." Applied Energy 87(1): 68-75.
Leduc, S., K. Natarajan, et al. (2009). "Optimizing biodiesel production in India."
Applied Energy 86(Suppl. 1): S125-S131.
Leduc, S., F. Starfelt, et al. (2010). "Optimal location of lignocellulosic ethanol
refineries with polygeneration in Sweden." Energy 35(6): 2709-2716.
Leduc S., E. Wetterlund, et al. (2011). "Second generation biofuel potential in Europe."
Proceedings of the International Symposium on Alcohol Fuels (ISAF XIX) in Verona,
Italy, 2011, October 10-14.
LigniMatch (2010). Future use of lignin in value added products – a roadmap for
possible Nordic/Baltic innovation. Göteborg, Sweden.
Lindgren, K. (2009). "Potential lignin applications beyond energy." Proceedings of the
2nd
Nordic Wood Biorefinery Conference, Helsinki, Finland, 2009, September 2-4.
Linnhoff, B. (1993). "Pinch analysis – A state-of-the-art overview." Chemical
Engineering Research and Design 71(A5): 503-522.
Lou, R., S. Wu, et al. (2012). "Energy and resource utilization of deinking sludge
pyrolysis." Applied Energy 90(1): 46-50.
References
103
Mao, H., J. M. Genco, et al. (2008). "Technical economic evaluation of a hardwood
biorefinery using the "near-neutral" hemicellulose pre-extraction process." Journal of
Biobased Materials and Bioenergy 2(2): 177-185.
Marbe, Å. (2005). New Opportunities and System Consequences for Biomass Integrated
Gasification Technology in CHP Applications. Department of Energy and Environment,
Division of Heat and Power Technology, Chalmers University of Technology. PhD
thesis. Göteborg, Sweden.
Marinova, M., E. Mateos-Espejel, et al. (2009). "Addressing the increased energy
demand of a Kraft mill biorefinery: The hemicellulose extraction case." Chemical
Engineering Research and Design 87(9): 1269-1275.
Marinova, M., E. Mateos-Espejel, et al. (2010a). "From kraft mill to forest biorefinery:
An energy and water perspective. II. Case study." Cellulose Chemistry and Technology
44(1-3): 21-26.
Marinova, M., E. Mateos-Espejel, et al. (2010b). "Sucessful conversion of a kraft mill
into a forest biorefinery: Energy analysis issues." Proceedings of the 23rd
International
Conference of Efficiency, Cost, Optimization, Simulation and Environmental Impact of
Energy Systems, ECOS, Lausanne, Switzerland, 2010, June 14-17.
Mateos-Espejel, E., L. Savulescu, et al. (2010). "Systems interactions analysis for the
energy efficiency improvement of a Kraft process." Energy 35(12): 5132-5142.
Matsuda, K., Y. Hirochi, et al. (2009). "Applying heat integration total site based pinch
technology to a large industrial area in Japan to further improve performance of highly
efficient process plants." Energy 34(10): 1687-1692.
Modig, G. (2005). Black liquor gasification: an assessment from the perspective of the
pulp and paper industry. Environmental and Energy Systems Studies, Lund University.
Licentiate Thesis. Lund, Sweden.
Mora, V., M. Mahmoudkhani, et al. (2011). "Scandinavian hardwood biorefinery using
"near-neutral" hemicelluloses pre-extraction – Energy efficiency measures." Chemical
Engineering Transactions 25: 411-416.
Murphy, R., N. Rivers, et al. (2007). "Hybrid modeling of industrial energy
consumption and greenhouse gas emissions with an application to Canada." Energy
Economics 29(4): 826-846.
Möllersten, K., L. Gao, et al. (2004). "Efficient energy systems with CO2 capture and
storage from renewable biomass in pulp and paper mills." Renewable Energy 29(9):
1583-1598.
Möllersten, K., J. Yan, et al. (2003). "Potential and cost-effectiveness of CO2 reductions
through energy measures in Swedish pulp and paper mills." Energy 28(7): 691-710.
Johanna Jönsson
104
Natarajan, K., S. Leduc, et al. (2011). "Optimal Locations for Methanol and CHP
Production in Eastern Finland." Bioenergy Research: 1-12.
Nilsson, K. and M. Söderström (1992). "Optimizing the operating strategy of a pulp and
paper mill using the mind method." Energy 17(10): 945-953.
Noël, G. (1995). "Pinch technology study at the Donohue Clermont newsprint mill."
Pulp and Paper Canada 96(7): 38-41.
Noël, G. and G. Boisvert (1998). "Project design in energy efficiency using Pinch
analysis: Shows its use at an abitibi-consolidated mill in Beaupré, Quebec." Pulp and
Paper Canada 99(12): 103-105.
Olsson, M. R., E. Axelsson, et al. (2006). "Exporting lignin or power from heat-
integrated kraft pulp mills: A techno-economic comparison using model mills." Nordic
Pulp and Paper Research Journal 4(21): 476-484.
Ordóñez, R., D. Hermosilla, et al. (2010). "Replacement of fresh water use by final
effluent recovery in a highly optimized 100% recovered paper mill." Water Science and
Technology 62(7): 1694-1703.
Paris, J. (2000). "Systems approach to system closure in integrated newsprint mills."
Pulp and Paper Canada 101(5): 34-42.
Perrin-Levasseur, Z., M. Benali, et al. (2010). "Lignin extraction technology integrated
in kraft pulp mill: Implementation strategy." Proceedings of the 23rd
International
Conference of Efficiency, Cost, Optimization, Simulation and Environmental Impact of
Energy Systems, ECOS, Lausanne, Switzerland, 2010, June 14-17.
Perrin-Levasseur, Z., F. Maréchal, et al. (2010). "Efficient conversion and biorefinery
implementation in a chemical pulp mill." Proceedings of the 23rd
International
Conference of Efficiency, Cost, Optimization, Simulation and Environmental Impact of
Energy Systems, ECOS, Lausanne, Switzerland, 2010, June 14-17.
Perry, S., J. Klemeš, et al. (2008). "Integrating waste and renewable energy to reduce
the carbon footprint of locally integrated energy sectors." Energy 33(10): 1489-1497.
Persson, J. and T. Berntsson (2009). "Influence of seasonal variations on energy-saving
opportunities in a pulp mill." Energy 34(10): 1705-1714.
Persson, T., A. K. Nordin, et al. (2007). "Economic evaluation of isolation of
hemicelluloses from process streams from thermomechanical pulping of spruce."
Applied Biochemistry and Biotechnology 137-140(1-12): 741-752.
Persson, U. and S. Werner (2011). "Heat distribution and the future competitiveness of
district heating." Applied Energy 88(3): 568-576.
References
105
Pettersson, K. (2011). Black Liquor Gasification-Based Biorefineries – Determining
Factors for Economic Performance and CO2 Emission Balances. Department of Energy
and Environment, Division of Heat and Power Technology, Chalmers University of
Technology. PhD thesis. Göteborg, Sweden.
Pettersson, K. and S. Harvey (2010). "CO2 emission balances for different black liquor
gasification biorefinery concepts for production of electricity or second-generation
liquid biofuels." Energy 35(2): 1101-1106.
Pettersson, K. and S. Harvey (In Press). "Comparison of black liquor gasification with
other pulping biorefinery concepts – Systems analysis of economic performance and
CO2 emissions." Energy doi 10.1016/j.energy.2011.10.020.
Phillips, R. B., H. Jameel, et al. (2008). "Technical and economic analysis of
repurposing a kraft pulp and paper mill to the production of ethanol." Proceedings of the
Engineering, Pulping and Environmental Conference, TAPPI, Portland, OR, United
States, 2008, August 24-27.
Raissi, K. (1994). Total site integration. Department of Process Integration. Manchester,
UK, University of Manchester Institute of Science and Technology (UMIST). PhD
Thesis. Manchester, United Kingdom.
Rootzén, J., J. Kjärstad, et al. (2011). "Prospects for CO2 capture in European industry."
Management of Environmental Quality 22(1): 18-32.
Ruohonen, P. and P. Ahtila (2009). "Analysis of a thermo mechanical pulp and paper
mill using advanced composite curves." Proceedings of the 22nd
International
Conference of Efficiency, Cost, Optimization, Simulation and Environmental Impact of
Energy Systems, ECOS, Foz do Iguazú, Brasil, 2009, August 31-September 3.
Ruohonen, P. and P. Ahtila (2010). "Analysis of a mechanical pulp and paper mill using
advanced composite curves." Applied Thermal Engineering 30(6-7): 649-657.
Ruohonen, P., J. Hakala, et al. (2009). "Testing of heat load model for pulp and paper in
two TMP cases." Chemical Engineering Transactions, 18:433-438.
Ruohonen, P., J. Hakala, et al. (2010). "Analysis of an operating TMP mill using
advanced composite curves and Heat Load Model for Pulp and Paper." Chemical
Engineering Transactions, 21:541-546.
Ruohonen, P., I. Hippinen, et al. (2010). "Analysis of alternative secondary heat uses to
improve energy efficiency – Case: A Finnish mechanical pulp and paper mill."
Resources, Conservation and Recycling 54(5): 326-335.
Ruth, M., B. Davidsdottir, et al. (2004). "Climate change policies and capital vintage
effects: the cases of US pulp and paper, iron and steel, and ethylene." Journal of
Environmental Management 70(3): 235-252.
Johanna Jönsson
106
Sandberg, P. (2004). Optimization and Co-operative Perspectives an Industrial Energy
Systems. Department of Mechanical Engineering, Division of Energy Systems.
Linköping University. PhD thesis. Linköping, Sweden.
Savulescu, L., B. Poulin, et al. (2005). "Water and energy savings at a kraft paperboard
mill using process integration." Pulp and Paper Canada 106(9): 29-31.
Schaareman, M., E. Verstraeten, et al. (2000). "Energy and water pinch study at the
Parenco paper mill." Paper Technology 41(1): 47-52.
SEA (2010). Energiläget 2010. ET 2010:45. Energimyndigheten, Eskilstuna, Sweden.
(In Swedish)
SF (2011). Tabellbilaga 2. Energianvändningen inom industrin efter näringsgren 2009.
Statistics Finland, Retrieved 2011-08-19 from
http://www.stat.fi/til/tene/2009/tene_2009_2010-10-27_tau_002_sv.html. (In Swedish)
SFIF (2008). The pulp and paper industry: emissions, waste and energy consumption
(database for the Swedish pulp and paper industry), The Swedish Forest Industries
Federation. Retrived 2009-01-30 from http://miljodatabas.skogsindustrierna.org.
Simons Consulting Group (1999). A system approach to energy management in the pulp
a paper industry. Forest Sector Table, National Climate Change Process. Ottawa,
Ontario, Canada.
SSC (2008). Svensk klimatpolitik. SOU (Statens offentliga utredningar), 2008:24.
Stockholm, Sweden. (In Swedish)
Stijepovic, M. Z. and P. Linke (2011). "Optimal waste heat recovery and reuse in
industrial zones." Energy 36(7): 4019-4031.
Svensson, E., T. Berntsson, et al. (2009). "An optimization methodology for identifying
robust process integration investments under uncertainty." Energy Policy 37(2): 680-
685.
Szabó, L., A. Soria, et al. (2009). "A world model of the pulp and paper industry:
Demand, energy consumption and emission scenarios to 2030." Environmental Science
& Policy 12(3): 257-269.
Södra Cell (2009). Homepage of Södra Cell. Retrieved 2009-03-02 from
http://www.sodra.com/sv/verksamheter/Pappersmassa/.
Towers, M., T. Browne, et al. (2007). "Biorefinery opportunities for the Canadian pulp
and paper industry." Pulp and Paper Canada 108 (6): 26-29
Vakkilainen, E. K., S. Kankkonen, et al. (2008). "Advanced efficiency options:
Increasing electricity generating potential from pulp mills." Pulp and Paper Canada
109(4): 14-18.
References
107
Wallberg, O. (2005). Extraction of Lignin from Kraft Cooking Liquor by Ultrafiltration.
Departement of Chemical Engineering, Lund Institute of Technology. PhD thesis.
Lund, Sweden.
van der Stelt, M. J. C., H. Gerhauser, et al. (2011). "Biomass upgrading by torrefaction
for the production of biofuels: A review." Biomass and Bioenergy 35(9): 3748-3762.
Van Heiningen, A. (2006). "Converting a kraft pulp mill into an integrated forest
biorefinery." Pulp and Paper Canada 107(6): 38-43.
Varma, P., J. Chaouki, et al. (2010). "Forest biomass gasification integrated to a kraft
pulping mill: Technology options." Proceedings of the 23rd
International Conference of
Efficiency, Cost, Optimization, Simulation and Environmental Impact of Energy
Systems, ECOS, Lausanne, Switzerland, 2010, June 14-17.
Werner, S. (2006). Ecoheatcool 2005–2006, Work package 1 (The European heat
market) and 4 (Possibilities with more district heating in Europe). Euroheat and Power,
Brussels, Belgium.
Wetterlund, E., K. Pettersson, et al. (2011). "Systems analysis of integrating biomass
gasification with pulp and paper production – Effects on economic performance, CO2
emissions and energy use." Energy 36(2): 932-941.
Wetterlund, E., S. Leduc, et al. (submitted for publication). "Optimal localisation of
biofuel production on a European scale." Submitted to Energy, 2011.
Wiberg, R. (2001). Energiförbrukningen i massa- och pappersindustrin 2000,
Skogsindustriernas Miljö- och Energikommitté. (In Swedish)
Wising, U. (2003). Process Integration in Model Kraft Pulp Mills: Technical,
Economical and Environmental Implications. Department of Energy and Environment,
Division of Heat and Power Technology, Chalmers University of Technology. PhD
thesis. Göteborg, Sweden.
Wising, U., T. Berntsson, et al. (2005). "The potential for energy savings when reducing
the water consumption in a Kraft Pulp Mill." Applied Thermal Engineering 25(7): 1057-
1066.
Wolf, A., A. Vidlund, et al. (2006). "Energy-efficient pellet production in the forest
industry – A study of obstacles and success factors." Biomass and Bioenergy 30(1): 38-
45.
Worrell, E., L. Price, et al. (2008). World Best Practice Energy Intensity Values for
Selected Industrial Sectors. LBNL-62806, Rev. 2, Ernest Orlando Lawrence Berkeley
National Laboratory, United States.
Johanna Jönsson
108
Žarković, D. B., V. N. Rajaković-Ognjanović, et al. (2011). "Conservation of resources
in the pulp and paper industry derived from cleaner production approach." Resources,
Conservation and Recycling 55(12): 1139-1145.
Ziegler, L., H. Nägele, et al. (2009). "Application of Innovative Lignin Composites."
Proceedings of the 2nd
Nordic Wood Biorefinery Conference, Helsinki, Finland, 2009,
September 2–4.
Öhman, F. (2006). Precipitation and Separation of Lignin from Kraft Black Liquor.
Department of Chemical and Biological Engineering, Chalmers University of
Technology. PhD thesis. Göteborg, Sweden.