Analyses of Lateral Loaded Piles with P-Y Curves - Observations on ...
49
Analyses of Lateral Loaded Piles with P-Y Curves - Observations on the Effect of Pile Flexural Stiffness and Cyclic Loading NCDOT 7 th Geo 3 T 2 , Raleigh, NC, Thursday, April 04, 2013 Session 3B - Geotechnical II (Room: Pinehurst) - Paper: 3B-1_A49 Miguel A. Pando, Ph.D., P. Eng. Associate Professor, UNC Charlotte
-
Upload
nguyenliem -
Category
Documents
-
view
263 -
download
1
Transcript of Analyses of Lateral Loaded Piles with P-Y Curves - Observations on ...
Analyses of Lateral Loaded Piles with P-Y Curves - Observations on the
Effect of Pile Flexural Stiffness and Cyclic Loading
NCDOT 7th Geo3 T2, Raleigh, NC, Thursday, April 04, 2013
Session 3B - Geotechnical II (Room: Pinehurst) - Paper: 3B-1_A49
Miguel A. Pando, Ph.D., P. Eng.
Associate Professor, UNC Charlotte
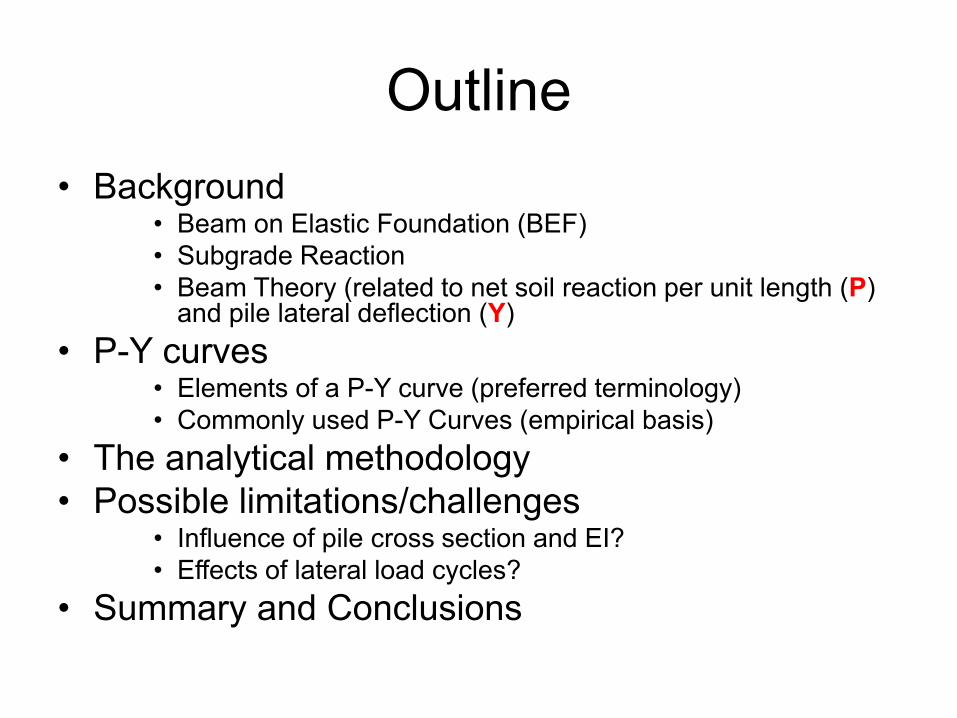
Outline
• Background • Beam on Elastic Foundation (BEF)
• Subgrade Reaction
• Beam Theory (related to net soil reaction per unit length (P) and pile lateral deflection (Y)
• P-Y curves • Elements of a P-Y curve (preferred terminology)
• Commonly used P-Y Curves (empirical basis)
• The analytical methodology
• Possible limitations/challenges • Influence of pile cross section and EI?
• Effects of lateral load cycles?
• Summary and Conclusions

BACKGROUND

Beam on Elastic Foundation (BEF)
• After Winkler (1867) aka as Beam on Winkler
Foundation (BWF)
kh = Modulus of Lateral (Horizontal) Subgrade Reaction [F/L3]
Typically linear representation of soil reaction.
VERTICAL HORIZONTAL

Vertical Modulus of Subgrade Reaction
• Modulus of subgrade reaction (k)
• Is it a soil property? NO
• Footing, rafts, pavement design
• Westergaard’s work in 1920’s
• q = k D (used by structural engineers)
– q = applied or contact pressure [F/L2]
– D = settlement of footing under q [L]
• k = q/D = slope (linear spring constant) = modulus of subgrade reaction [F/L3]
q (F/L2)
B
Zinf
Es
q (F/L2)
D (L)
1 k
1
ksec
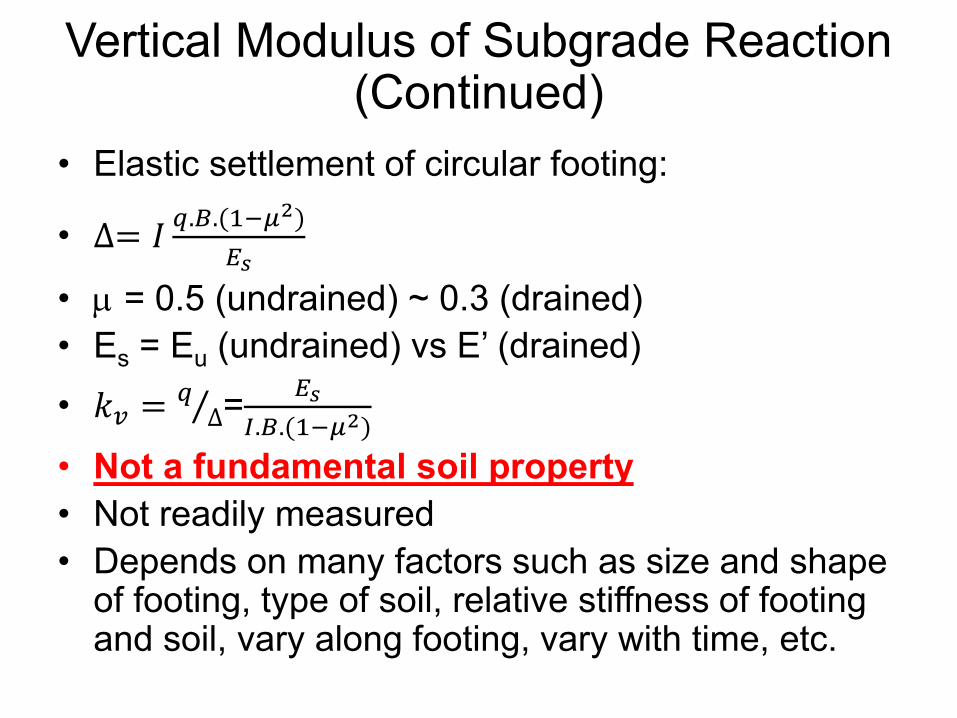
• Elastic settlement of circular footing:
• ∆= 𝐼𝑞.𝐵.(1−𝜇2)
𝐸𝑠
• m = 0.5 (undrained) ~ 0.3 (drained)
• Es = Eu (undrained) vs E’ (drained)
• 𝑘𝑣 =𝑞
∆ =𝐸𝑠
𝐼.𝐵.(1−𝜇2)
• Not a fundamental soil property
• Not readily measured
• Depends on many factors such as size and shape of footing, type of soil, relative stiffness of footing and soil, vary along footing, vary with time, etc.
Vertical Modulus of Subgrade Reaction (Continued)
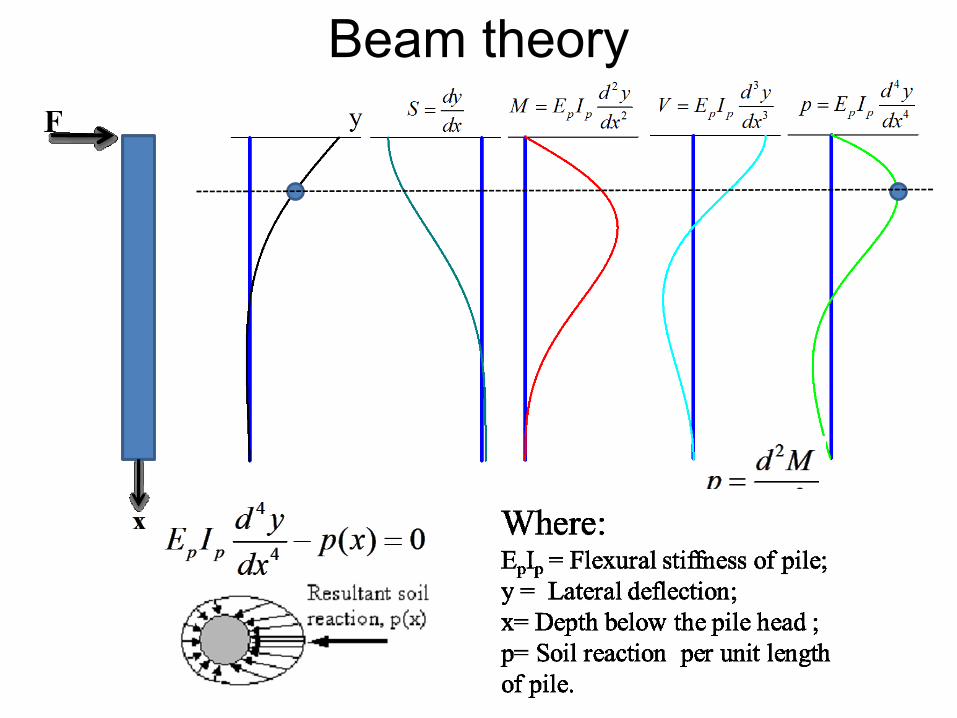
Beam theory

Table 1 Relationships commonly used for elastic piles in flexion
Variable Formula Units
Distance along the length of the pile
(measured from pile head) x [L]
Distance to neutral axis within pile
cross section z [L]
Deflection y [L]
Slope or rotation of pile section dy
dx [Dimensionless]
Curvature 2
2
d y
dx [Radians/L]
Bending moment 2
p p p p2
d yM E I E I
dx
[F x L]
Shear force 3
p p 3
d yV E I
dx [F]
Axial load Q [F]
Soil reaction (or load intensity) 4
p p 4
d yp E I
dx [F/L]
Notes: EpIp = flexural stiffness of pile, where Ep = elastic modulus of pile material, and Ip = moment of
inertia of pile cross section with respect to the neutral axis
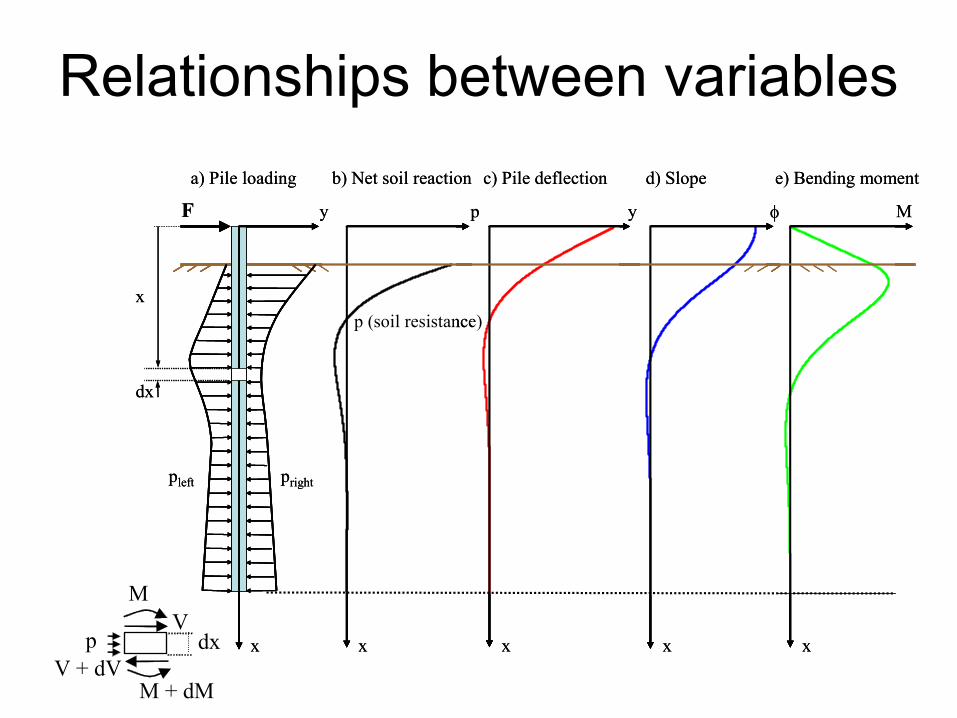
Relationships between variables
Figure 8.1 Laterally loaded pile problem
p
M + dM V + dV
V
M
dx x x x x x
y p y MF
x
dx
pright
p (soil resistance)
pleft
a) Pile loading b) Net soil reaction c) Pile deflection d) Slope e) Bending moment
x x x x x
y p y MF
x
dx
pright
p (soil resistance)
pleft
a) Pile loading b) Net soil reaction c) Pile deflection d) Slope e) Bending moment

The Genesis of the P-Y Curve:
(Reese and Van Impe, 2001)
B
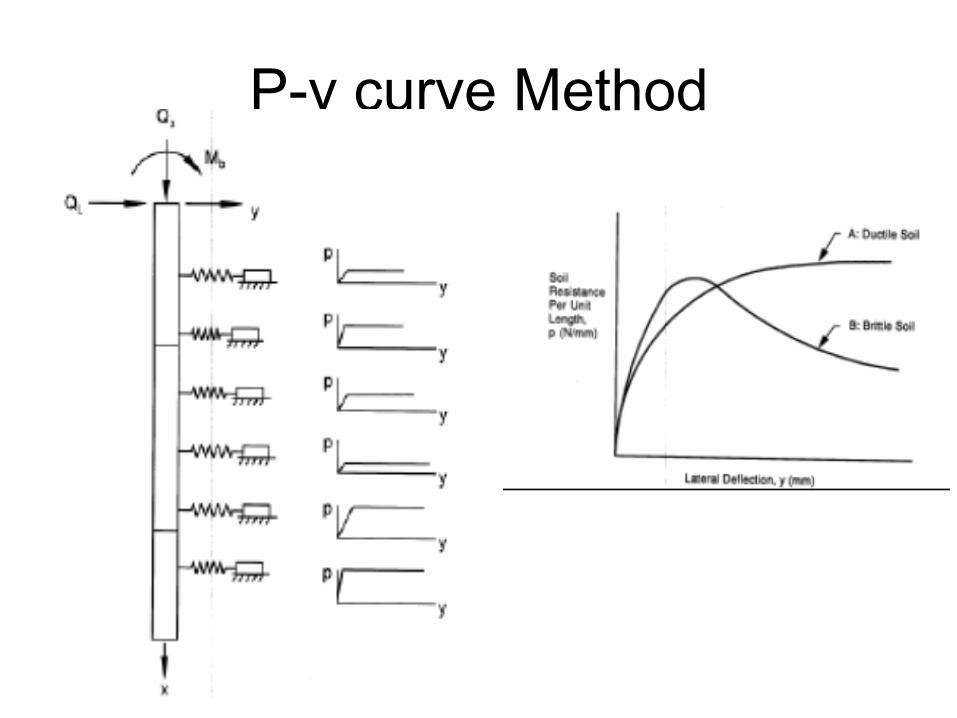
P-y curve Method

P-Y CURVES
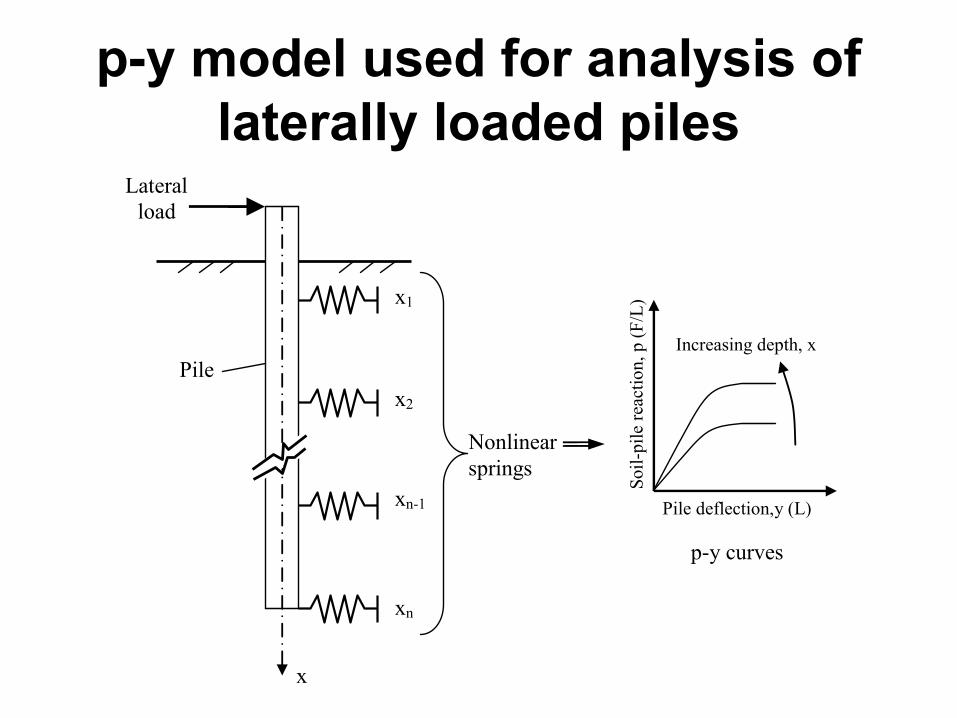
p-y model used for analysis of
laterally loaded piles
Figure 2 Schematic showing p-y model used for analysis of laterally loaded piles
x1
x2
xn
xn-1
Lateral
load
Nonlinear
springs
So
il-p
ile
reac
tio
n,
p (
F/L
)
Pile deflection,y (L)
Increasing depth, x
p-y curves
x
Pile
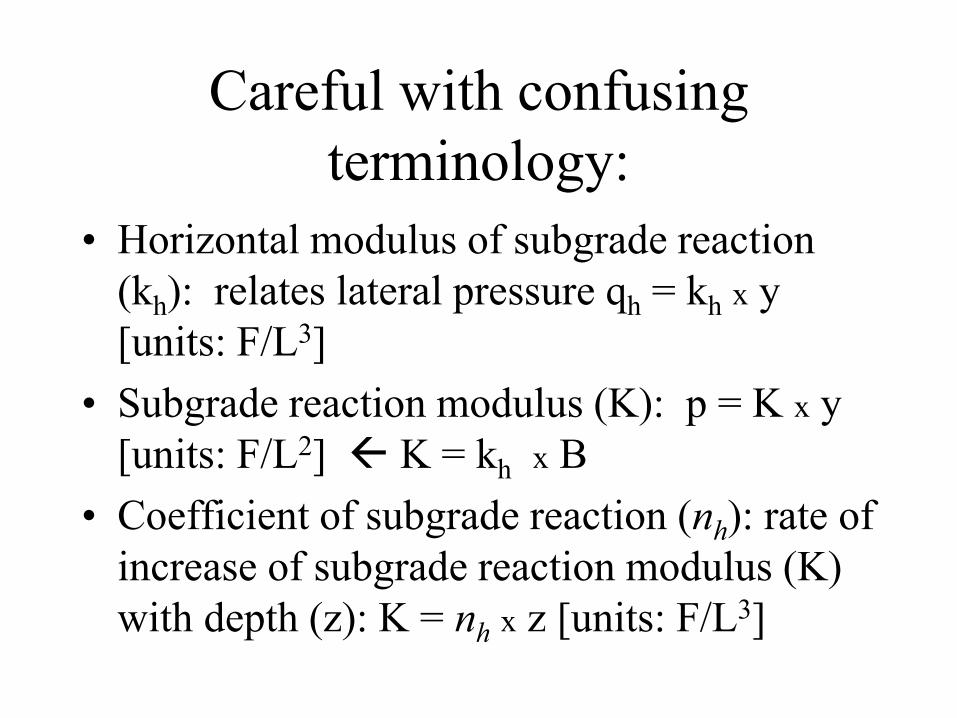
Careful with confusing
terminology:
• Horizontal modulus of subgrade reaction
(kh): relates lateral pressure qh = kh x y
[units: F/L3]
• Subgrade reaction modulus (K): p = K x y
[units: F/L2] K = kh x B
• Coefficient of subgrade reaction (nh): rate of
increase of subgrade reaction modulus (K)
with depth (z): K = nh x z [units: F/L3]

Soil reaction (p-y curve) and Horizontal
Modulus of Subgrade Reaction (kh)
Careful units of kh same as kv (F/L3)
but genesis is different
Net
soil
reaction p
er
unit length
of pile
(F
/L)
Type equation here.
qh = kh . y
1 1
(kh B) (kh _ sec B)
Units:
qh = [F/L2]
y = [L]
kh = [F/L3]
qh = p/B
p = (kh x B) . y
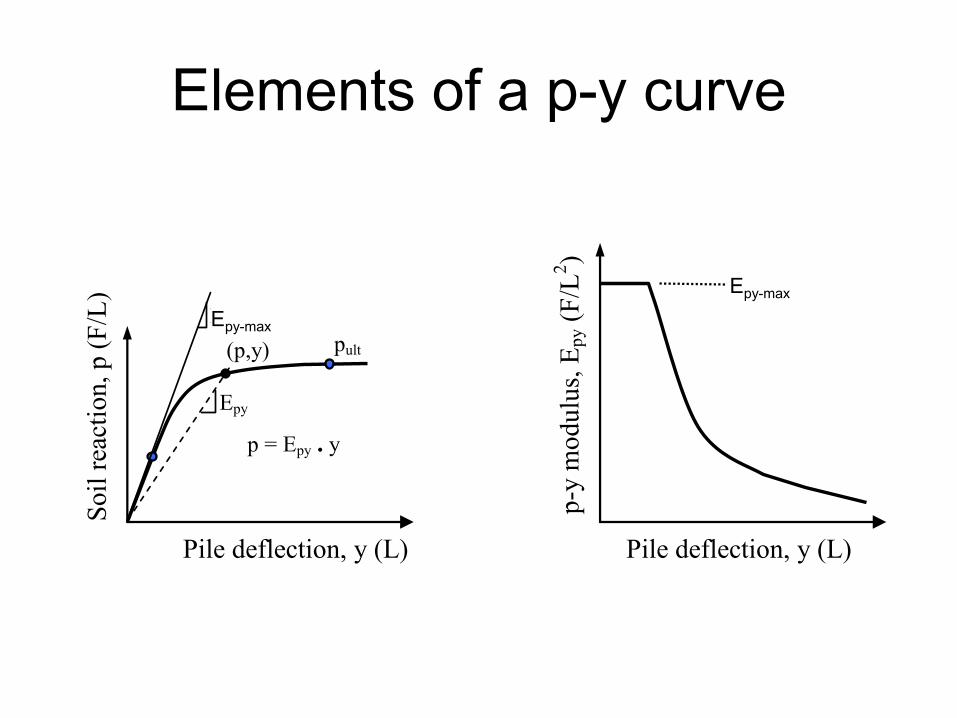
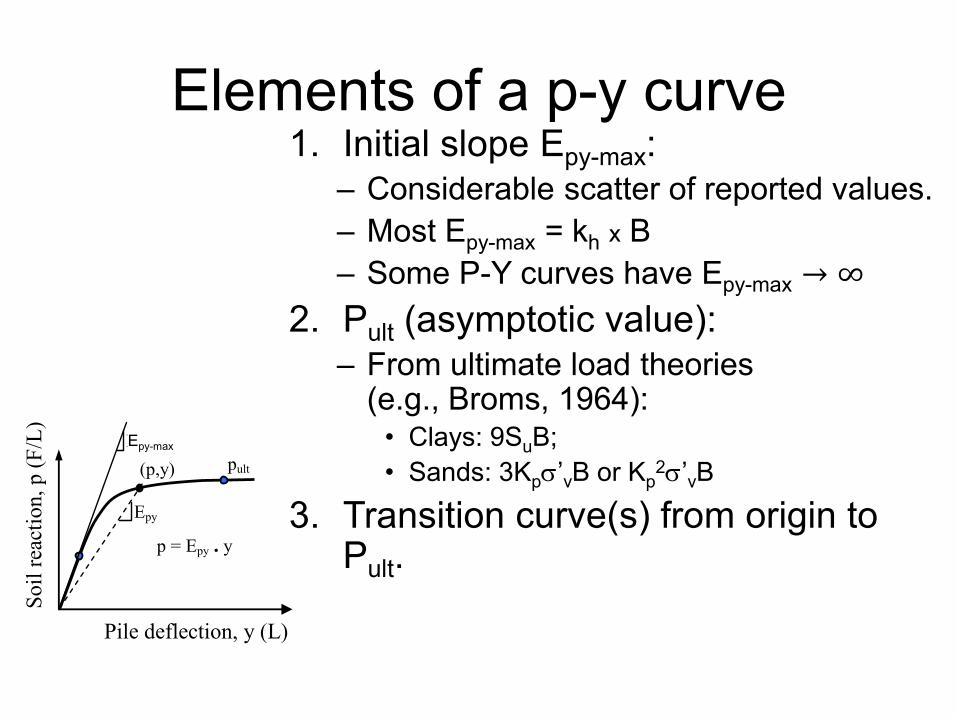
Elements of a p-y curve
Figure 3 Typical p-y curve and resulting p-y modulus
(p,y)
Epy
Epy-max
p = Epy . y
pult
Pile deflection, y (L)
Soil
rea
ctio
n, p (
F/L
)
Pile deflection, y (L) p-y
modulu
s, E
py (
F/L
2)
Epy-max
Epy-max
Epy-max
Elements of a p-y curve
Figure 3 Typical p-y curve and resulting p-y modulus
(p,y)
Epy
Epy-max
p = Epy . y
pult
Pile deflection, y (L)
So
il r
eact
ion
, p
(F
/L)
Pile deflection, y (L)
p-y
mo
du
lus,
Ep
y (
F/L
2)
Epy-max
1. Initial slope Epy-max: – Considerable scatter of reported values.
– Most Epy-max = kh x B
– Some P-Y curves have Epy-max → ∞
2. Pult (asymptotic value): – From ultimate load theories
(e.g., Broms, 1964): • Clays: 9SuB;
• Sands: 3Kps’vB or Kp2s’vB
3. Transition curve(s) from origin to Pult.
Epy-max
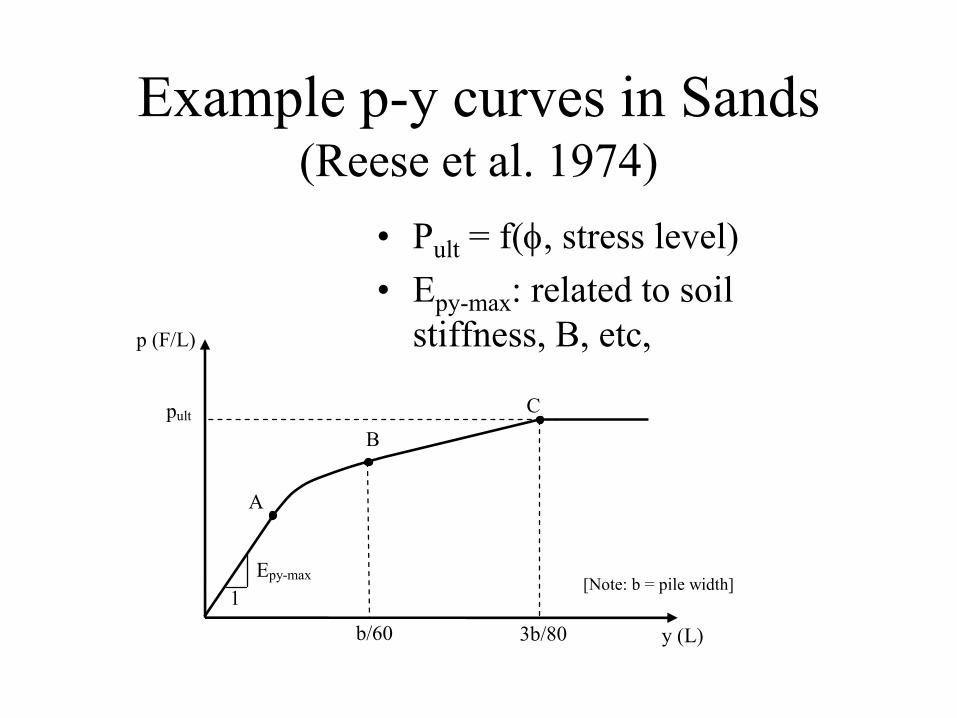
Example p-y curves in Sands (Reese et al. 1974)
• Pult = f(, stress level)
• Epy-max: related to soil
stiffness, B, etc,
Figure 5 Elements of a characteristic p-y curve for sand based on
recommendations by Reese et al. (1974)
p (F/L)
y (L) b/60 3b/80
C
B
A
Epy-max
1 [Note: b = pile width]
pult

P-Y Curves for Different Soil Types
Stiff Clay
Sand
Soil w/
Sand
Soft Clay
Lateral deflection
Soil
rea
ctio
n
Lateral deflection
Soil
rea
ctio
n

Experimental P-Y Curves
• Lateral load tests on instrumented piles
• Vey few high quality tests are available
• Basis for P-Y Curves proposed in the
literature
• Typically from deflected shape
measurements (e.g., inclinometers)
• Better if from Moment (or curvature)
measurements using closely spaced pairs of
strain gages (very few of these)
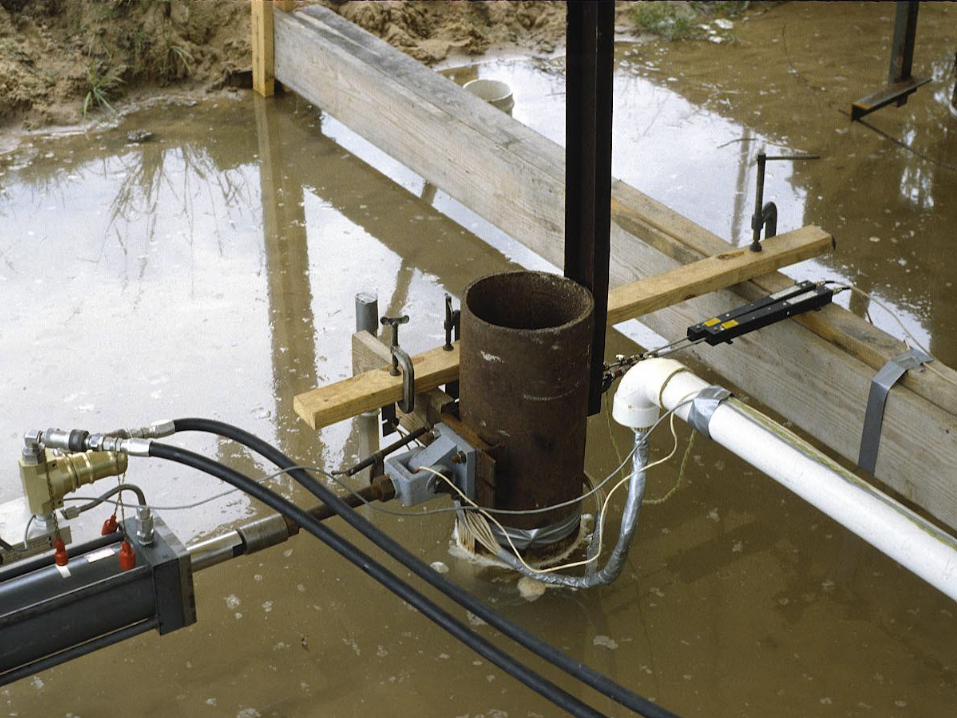

Additional Instrumentation
Front Row
0
1
2
3
4
5
6
7
8
9
10
0.0 20.0 40.0 60.0
Deflection, mm
Dep
th F
rom
To
p o
f P
ile,
m
35.6 kN
48.9 kN
66.7 kN
84.5 kN
97.9 kN
Average Load per Pile
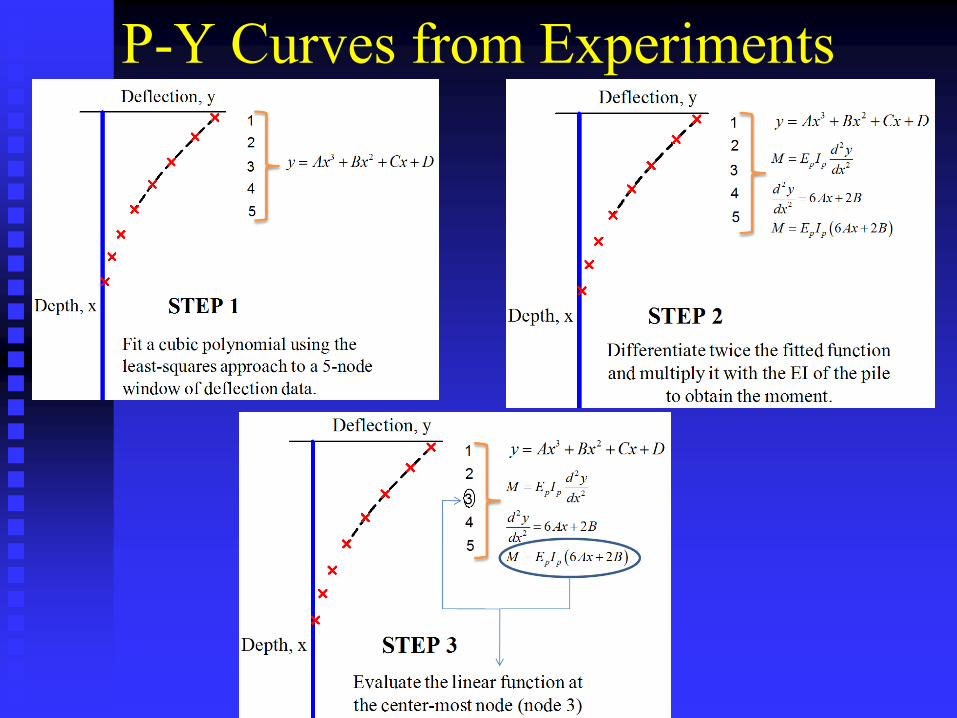
P-Y Curves from Experiments

P-Y Curves from Experiments 𝑅𝑒𝑐𝑎𝑙𝑙 𝑓𝑟𝑜𝑚 𝑏𝑒𝑎𝑚 𝑡ℎ𝑒𝑜𝑟𝑦:
𝑝 =𝑑2𝑀
𝑑𝑥2
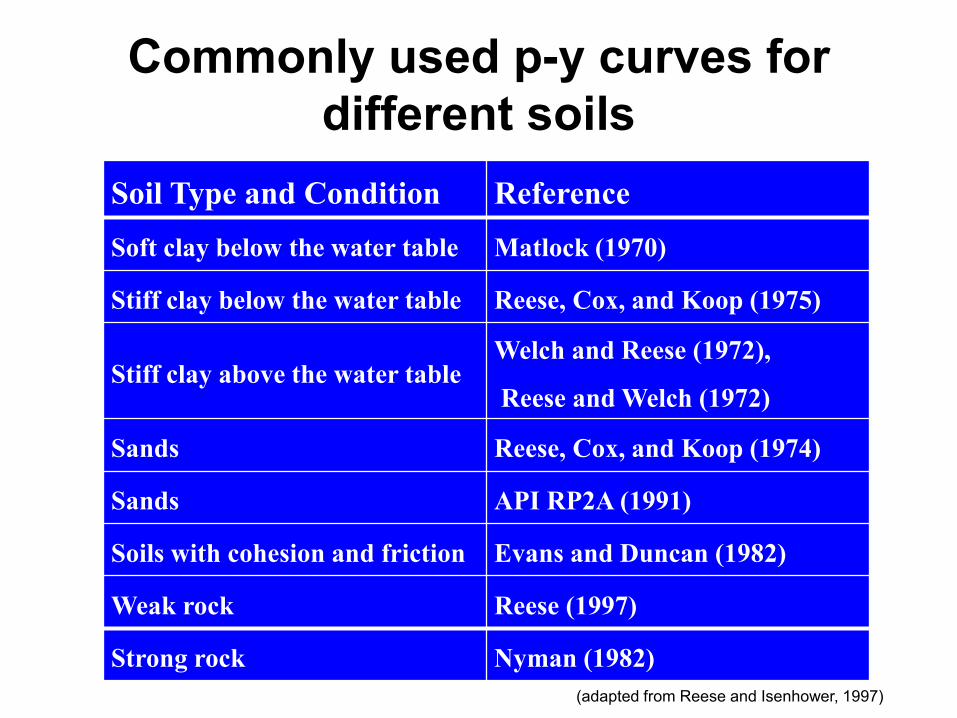
Commonly used p-y curves for
different soils
Soil Type and Condition Reference
Soft clay below the water table Matlock (1970)
Stiff clay below the water table Reese, Cox, and Koop (1975)
Stiff clay above the water table Welch and Reese (1972),
Reese and Welch (1972)
Sands Reese, Cox, and Koop (1974)
Sands API RP2A (1991)
Soils with cohesion and friction Evans and Duncan (1982)
Weak rock Reese (1997)
Strong rock Nyman (1982)
(adapted from Reese and Isenhower, 1997)

ANALYTICAL
METHODOLOGY

Software for p-y based analysis:
• Solve beam equation with finite difference
or finite elements
• COM624
• LPILE
• FB-Pier (FB-Multipier)
• Matlab or Mathcad spreadsheets
Other Methodologies
• Strain Wedge Model
• FEM
• Characteristic Load Method (LPILE based)

POSSIBLE LIMITATIONS OR
CHALLENGES

Potential Limitations P-Y Curves
• The soil is idealized as a series of
independent nonlinear springs
represented by p-y curves. Therefore, the
continuous nature of the soil is not
explicitly modeled.

Potential Limitations P-Y Curves
• The results are very sensitive to the p-y curves used. The selection of adequate p-y curves is the most crucial problem when using this methodology to analyze laterally loaded piles (Reese and Van Impe 2001).
• P-Y curves in literature are empirical in nature. Need to carefully review applicability of the selected curves.
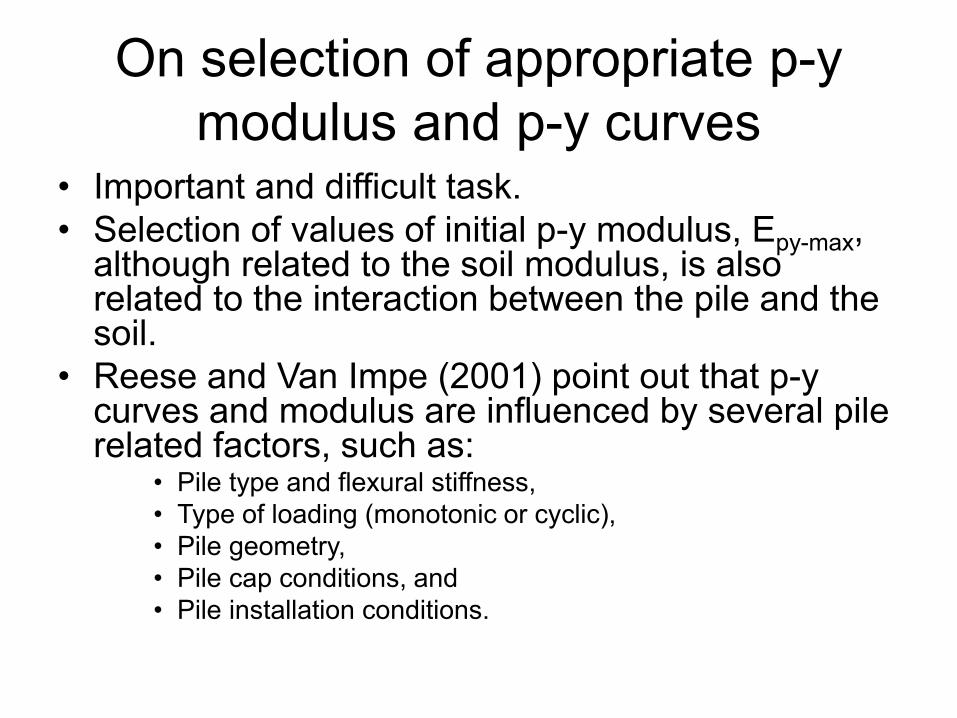
On selection of appropriate p-y
modulus and p-y curves • Important and difficult task.
• Selection of values of initial p-y modulus, Epy-max, although related to the soil modulus, is also related to the interaction between the pile and the soil.
• Reese and Van Impe (2001) point out that p-y curves and modulus are influenced by several pile related factors, such as:
• Pile type and flexural stiffness,
• Type of loading (monotonic or cyclic),
• Pile geometry,
• Pile cap conditions, and
• Pile installation conditions.
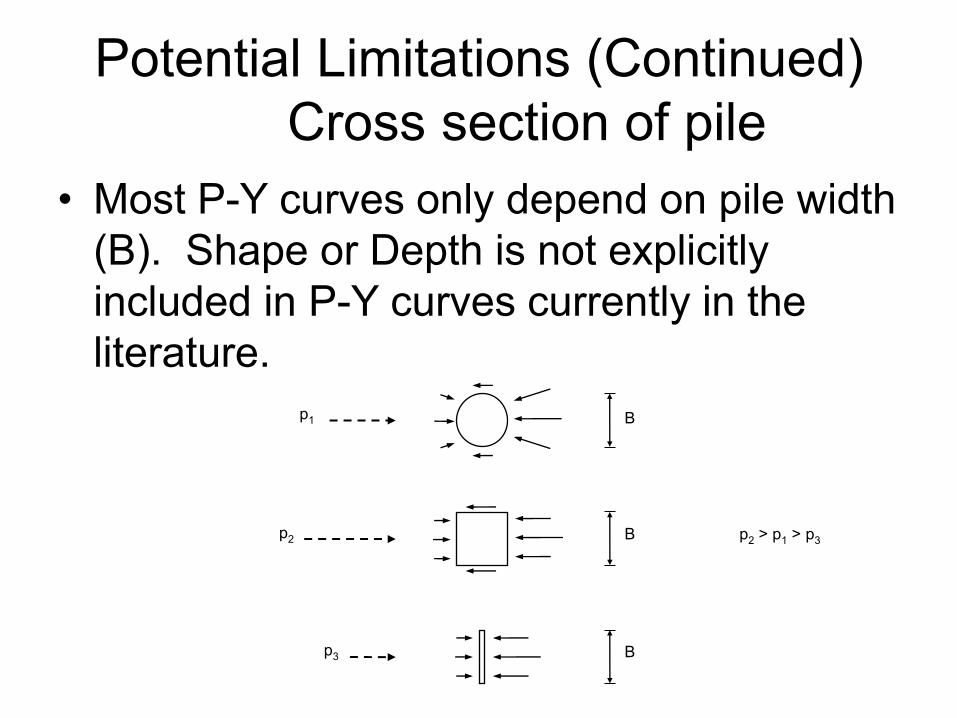
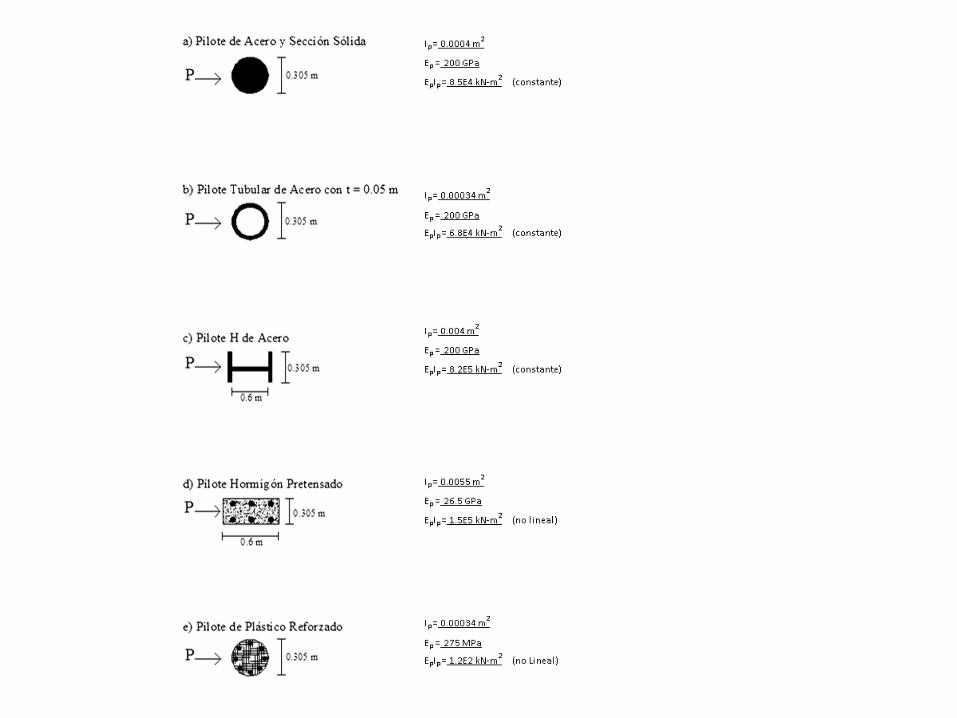
Potential Limitations (Continued)
Cross section of pile
• Most P-Y curves only depend on pile width
(B). Shape or Depth is not explicitly
included in P-Y curves currently in the
literature.
B
B
B
p1
p2
p3
p2 > p1 > p3
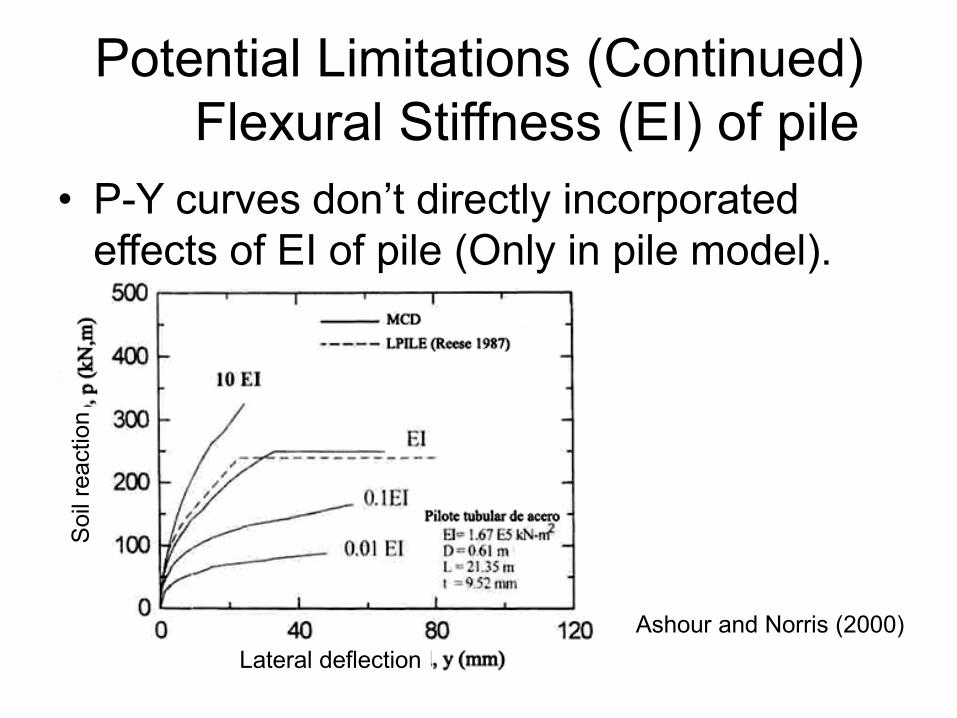
Potential Limitations (Continued)
Flexural Stiffness (EI) of pile
• P-Y curves don’t directly incorporated
effects of EI of pile (Only in pile model).
Lateral deflection
Soil
reaction
Ashour and Norris (2000)
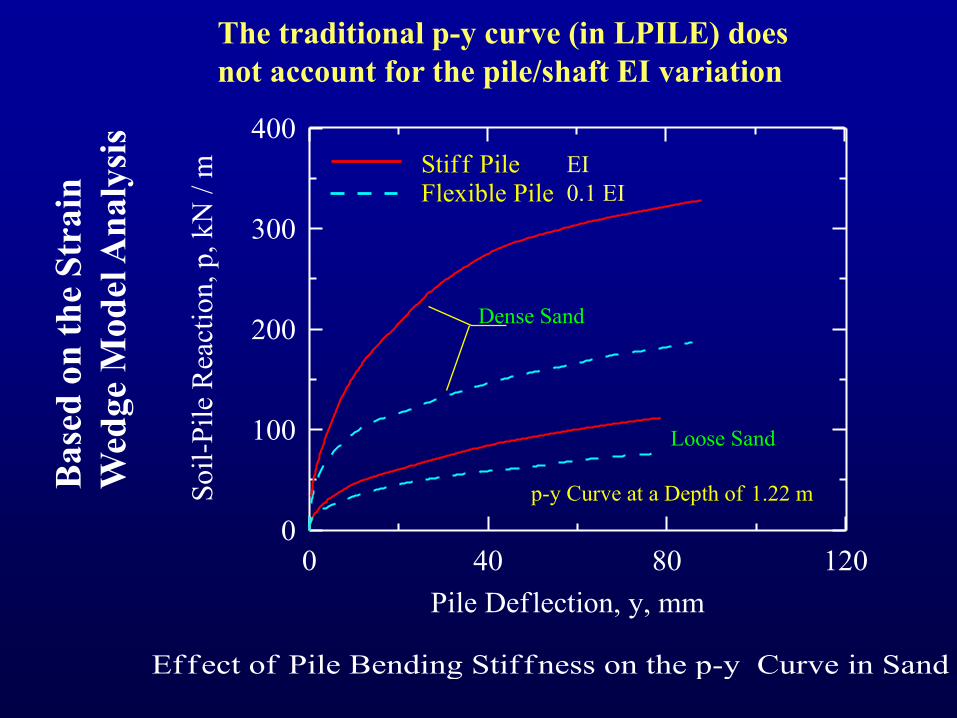
The traditional p-y curve (in LPILE) does
not account for the pile/shaft EI variation B
ase
d o
n t
he
Str
ain
Wed
ge
Mo
del
An
aly
sis
Stif f Pile Flexible Pile
p-y Curve at a Depth of 1.22 m
Dense Sand
Loose Sand
Effect of Pile Bending Stif fness on the p-y Curve in Sand
0 40 80 120
Pile Deflection, y, mm
0
100
200
300
400
Soil
-Pil
e R
eact
ion, p
, k
N /
m
EI
0.1 EI
De
pth
So
il R
ea
ctio
n, p
(kN
/m)
Lateral Deflection, y (m)
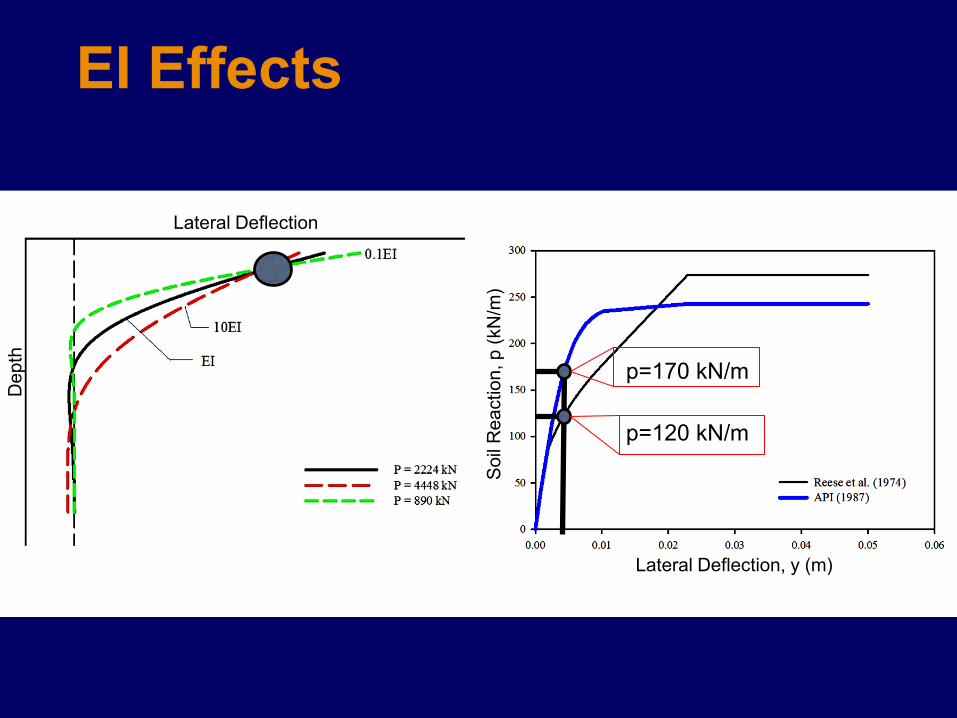
Lateral Deflection
EI Effects
p=120 kN/m
p=170 kN/m

Route 351 Bridge Case History

Route 351 Bridge Case History
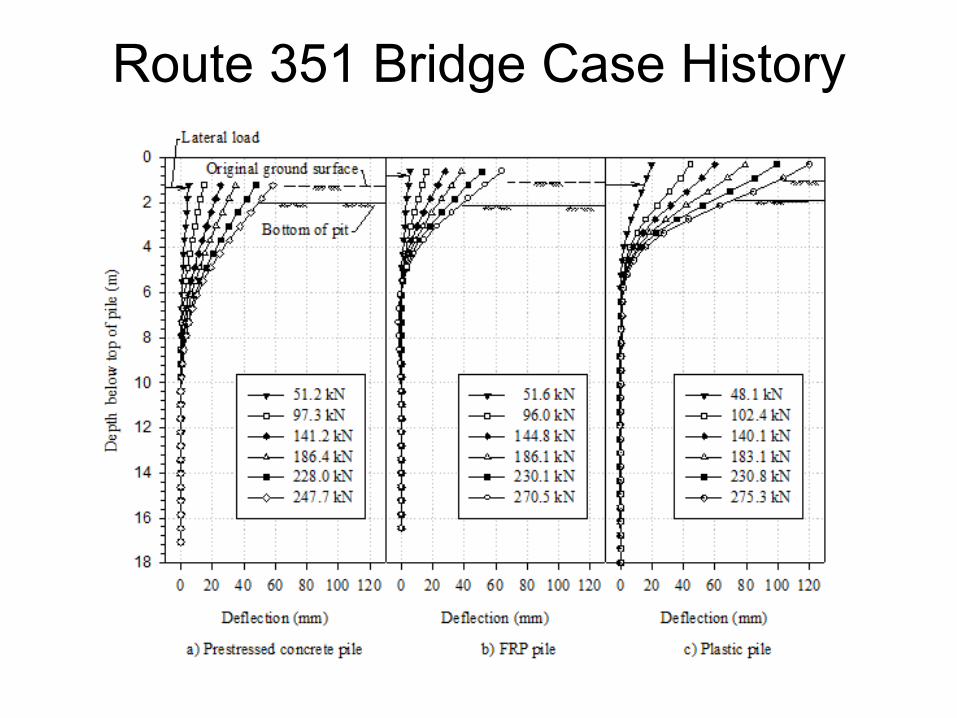
Route 351 Bridge Case History

Route 351 Bridge Case History
Lateral Cyclic loading on Piles
• Limited experimental data.
• API P-Y curves for sands suggest
incorporating 10% degradation of p-y
curve for offshore piles.
• A few experimental studies developed
cyclic P-Y curves
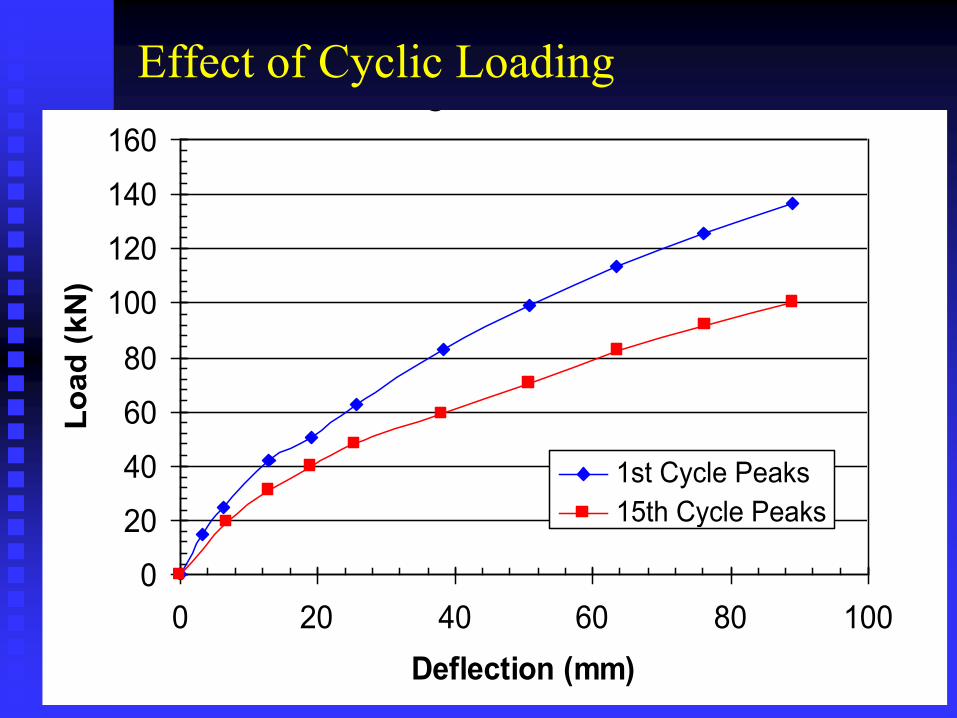
Effect of Cyclic Loading Single Pile Test
0
20
40
60
80
100
120
140
160
0 20 40 60 80 100
Deflection (mm)
Lo
ad
(kN
)
1st Cycle Peaks
15th Cycle Peaks

Cyclic P-Y Curves by Little and Briaud (1988):
• Most experiments up to 20 lateral load
cycles.
• 𝑦𝑁= 𝑦
1. 𝑁𝑎

Cyclic P-Y Curves by Long and Vanneste (1994):
• 34 experiments (some up to 500 lateral
load cycles).
• Modified Pn and Yn as follows:
• 𝑃𝑁 = 𝑃1. 𝑁−0.4𝑡
• 𝑦𝑁= 𝑦
1. 𝑁0.6𝑡

Possible limitation with cyclic
loading
• Little experience and scarce availability of experimental data.
• Available experiments very few load cycles.
• Wind action on highway signs, sound barrier foundations; Or loading on bridge piles (thermal, current, wave, etc) can involve N > 104 load cycles during pile design life.
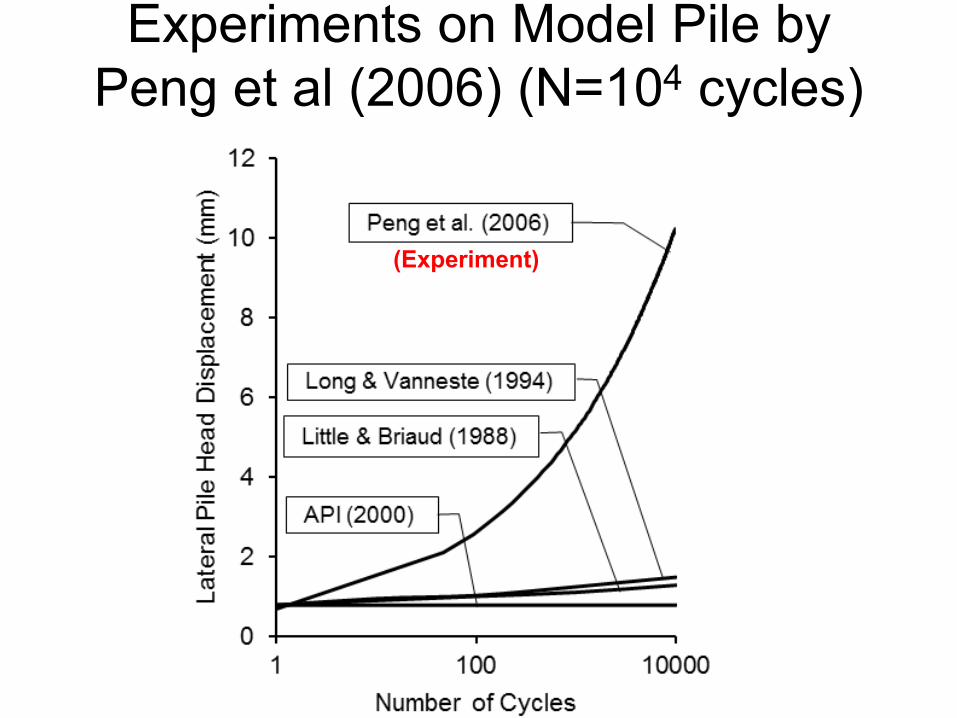
Experiments on Model Pile by
Peng et al (2006) (N=104 cycles)
(Experiment)
Summary & Conclusions
• The P-Y Curve based methodology for analysis of laterally loaded piles is easy and reliable
• Empirical in nature, but backed by decades of experience.
• However, several items may still need additional research to overcome some identified possible limitations. (i.e., still room for improvement).
• Also practitioners should be aware of alternative emerging methodologies such as the SWM (Need to incorporate into design tool box) (Several DoT’s already using).

THANK YOU!
Contact information:
Dr. Miguel A. Pando
Associate Professor
CEE Dept, UNC Charlotte