Analyses of Bering Sea bottom- trawl surveys in Norton Sound: Absence of regime shift effect on...
26
Analyses of Bering Sea Analyses of Bering Sea bottom-trawl surveys in bottom-trawl surveys in Norton Sound: Norton Sound: Absence of Absence of regime shift effect on regime shift effect on epifauna and demersal fish epifauna and demersal fish Toshihide “Hamachan” Hamazaki Toshihide “Hamachan” Hamazaki Alaska Department of Fish & Game Alaska Department of Fish & Game Division of Commercial Fisheries Division of Commercial Fisheries Anchorage Alaska Anchorage Alaska ICES Journal of Marine Science 62: 1597-1602 (2005)
-
Upload
ralph-page -
Category
Documents
-
view
218 -
download
0
Transcript of Analyses of Bering Sea bottom- trawl surveys in Norton Sound: Absence of regime shift effect on...

Analyses of Bering Sea bottom-Analyses of Bering Sea bottom-trawl surveys in Norton Sound: trawl surveys in Norton Sound: Absence of regime shift effect on Absence of regime shift effect on
epifauna and demersal fishepifauna and demersal fish
Toshihide “Hamachan” HamazakiToshihide “Hamachan” HamazakiAlaska Department of Fish & GameAlaska Department of Fish & Game
Division of Commercial FisheriesDivision of Commercial FisheriesAnchorage AlaskaAnchorage Alaska
ICES Journal of Marine Science 62: 1597-1602 (2005)

Effects of Regime Shifts are Effects of Regime Shifts are Real!Real!
Anderson 2000
Effects of Regime Shiftson the Bering Sea Ecosystem is well documentedSeveral mechanisms have been proposed-Ocean current pattern -Sea ice distribution-Location of upwelling-Bottom up vs. Top down

However, most studies are limited to However, most studies are limited to the Gulf of Alaska and Southeastern the Gulf of Alaska and Southeastern Bering Sea.Bering Sea.
GMT FEB 01 15:30:22 2000 FIGURE 1
180º
180º
160ºW
160ºW
140ºW
140ºW
120ºW
120ºW
30ºN 30ºN
40ºN 40ºN
50ºN 50ºN
60ºN 60ºN
Hare & Mantua 2000

Bering Sea Ecosystem Consists of Bering Sea Ecosystem Consists of Several Distinct Water Masses / Several Distinct Water Masses / EcosystemsEcosystems
Are the effects Are the effects of Regime Shift of Regime Shift the same the same among various among various ecosystems? ecosystems?

Norton Sound EcosystemNorton Sound Ecosystem
• Inshore water system Inshore water system isolated from major isolated from major ocean currentsocean currents
• Shallow water depth (< Shallow water depth (< 30 m)30 m)
• Ice Cover for 6 monthsIce Cover for 6 months
• Influx of freshwater and Influx of freshwater and nutrients from rivers nutrients from rivers
• Dominated by Dominated by InvertebratesInvertebrates

###
#######
#######
#############
#############
################
################
################
##############
#########
####
#
#
##
#
# #
#
#
#
#Nome
70 0 70 140 Kilometers
Alaska
63° 63°
64° 64°
65° 65°
168°
167°
167°
166°
166°
165°
165°
164°
164°
163°
163°
162°
162°
161°
161°
Norton Sound Trawl Norton Sound Trawl SurveySurvey
• One of a few long-term One of a few long-term survey data available in survey data available in the north Bering Seathe north Bering Sea
• Started 1976 for Started 1976 for development of red king development of red king crab fishery. (There has crab fishery. (There has been no major fisheries in been no major fisheries in Norton Sound)Norton Sound)
• Triennially by NMFS (76-Triennially by NMFS (76-91) and by ADF&G (96-02)91) and by ADF&G (96-02)
• Identify & weigh all Identify & weigh all vertebrates and vertebrates and invertebrates captured.invertebrates captured.

Total Biomass ChangeTotal Biomass Change
0
1000
2000
3000
4000
5000
6000
7000
8000
9000
1976 1979 1982 1985 1988 1991 1996 1999 2002
Year
CP
UE
Ind
ex
Sea stars Crabs
Snails Corals
Other invertebrates Flatfishes
Cods Sculpins
Other fishes

Increasing TrendsIncreasing Trends
R2 = 0.8085
0
1000
2000
3000
4000
5000
6000
7000
8000
9000
10000
1976 1981 1986 1991 1996 2001 2006
TotalR2 = 0.8262
0
1000
2000
3000
4000
5000
6000
7000
8000
1976 1981 1986 1991 1996 2001 2006
Sea-star
R2 = 0.5906
0
50
100
150
200
250
1976 1981 1986 1991 1996 2001 2006
CrabsR2 = 0.6231
0
100
200
300
400
500
600
700
800
1976 1981 1986 1991 1996 2001 2006
Flat fish
Total CPUE
Flat-fishesCrabs
Sea-Stars

Trends among 48 taxonomic Trends among 48 taxonomic groupsgroups
0%
5%
10%
15%
20%
25%
-0.4 -0.2 0 0.2 0.4 0.6 0.8
Pearson Coefficient
Pe
rce
nta
ge

Taxonomic CompositionTaxonomic Composition
0%
10%
20%
30%
40%
50%
60%
70%
80%
90%
100%
1976 1979 1982 1985 1988 1991 1996 1999 2002Year
CP
UE
Ind
ex
Sea stars CrabsSnails CoralsOther invertebrates FlatfishesCods SculpinsOther fishes

Bottom Water Temperature Bottom Water Temperature
0
1
2
3
4
5
6
7
8
9
10
1976 1979 1982 1985 1988 1991 1996 1999 2002
Year
Bo
tto
m W
ate
r te
mp
era
ture
(C
)

Other SpeciesOther SpeciesCoho Salmon
0
20,000
40,000
60,000
80,000
100,000
120,000
1961 1971 1981 1991 2001
Chum Salmon
0
50,000
100,000
150,000
200,000
250,000
300,000
350,000
1961 1971 1981 1991 2001
Chinook Salmon
0
5,000
10,000
15,000
20,000
25,000
1961 1971 1981 1991 2001
Sockeye Salmon
0
200
400
600
800
1,000
1,200
1,400
1961 1971 1981 1991 2001
Norm Annual Mean Temperature
-6
-5
-4
-3
-2
-1
0
1907 1917 1927 1937 1947 1957 1967 1977 1987 1997
Nome Air Temperature Coho Catch
Chinook CatchChum Catch
Sockeye Catch

ConclusionConclusion• Norton Sound benthic biomass Norton Sound benthic biomass
increased by 3 folds from 1976 to increased by 3 folds from 1976 to 2002 across major taxoninc groups. 2002 across major taxoninc groups.
• Benthic composition did not Benthic composition did not significantly change from 1976 to significantly change from 1976 to 2002.2002.
•No Apparent Regime Shifts No Apparent Regime Shifts Effects were detected. Effects were detected. – Increase of overall biomass can be Increase of overall biomass can be
attributed to temperature increase attributed to temperature increase since 1976 (Regime shifts effects?)since 1976 (Regime shifts effects?)

DiscussionDiscussion
• Norton Sound ecosystem Norton Sound ecosystem characteristics differ from SE Bering characteristics differ from SE Bering Sea, which resulted in the lack of Sea, which resulted in the lack of Regime Shift effectsRegime Shift effects
• Effects and influential mechanisms of Effects and influential mechanisms of Regime Shift would differ among Regime Shift would differ among regional ecosystemsregional ecosystems
•Need to study/monitor various Need to study/monitor various parts of Bering Seaparts of Bering Sea

FurtherFurther Study DirectionsStudy Directions•2006 Trawl Survey 2006 Trawl Survey (Pending: No bidders 2005 )(Pending: No bidders 2005 )
– This Survey may show a significant faunal change. This Survey may show a significant faunal change. – Virtual disappearance of sea star from winter king Virtual disappearance of sea star from winter king
crab survey since 2003crab survey since 2003
•Spatial-Temporal Analyses Spatial-Temporal Analyses (NPRB funding proposal)(NPRB funding proposal)– Identify areas of high biomass, species richness Identify areas of high biomass, species richness
and diversity and diversity – Examine changes in spatial distributionExamine changes in spatial distribution– Correlate spatial distribution of major species with Correlate spatial distribution of major species with
environmental variablesenvironmental variables– Construct potential habitat prediction model Construct potential habitat prediction model

##
##
##
##
##
##
##
##
##
##
##
###
##
####
#
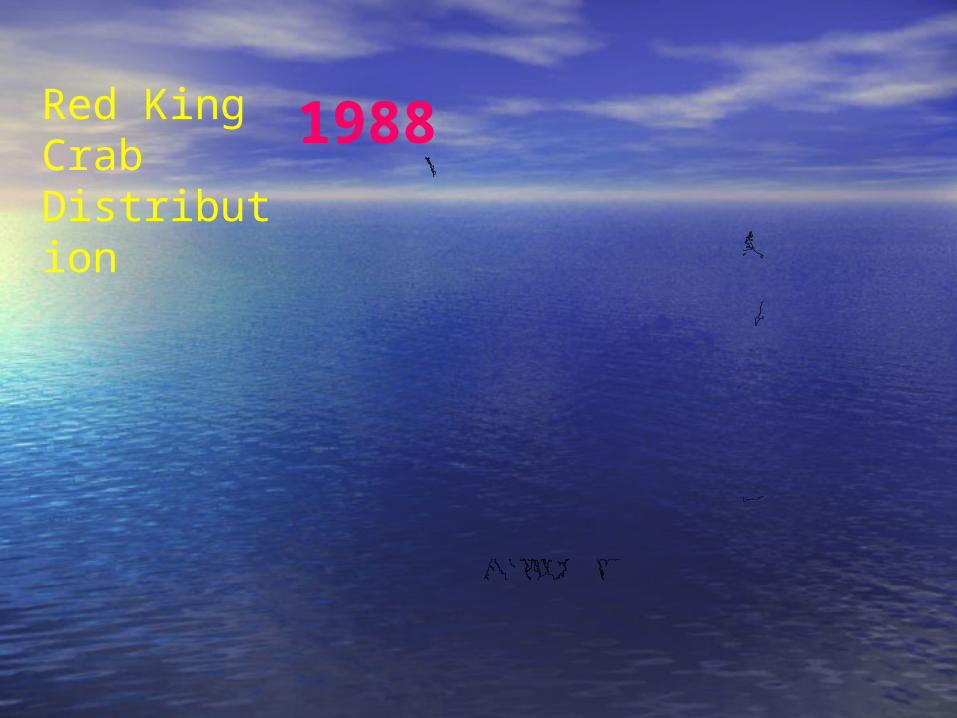
1976Red King CrabDistribution

##
##
##
#
###
##
##
#
#
#
##
##
##
##
1979Red King CrabDistribution

#
### #
##
###
#
##
##
##
##
##
##
#
1982Red King CrabDistribution

##
#
##
##
##
##
#
##
#
##
##
##
##
##
#
#
###
##
#
#
##
##
1985Red King CrabDistribution
##
#
##
##
#
#
#
#
#
###
### #
##
###
#
#
1988
Red King CrabDistribution

#
##
#
##
##
####
#
###
##
##
##
#
#
##
##
#
#
1991Red King CrabDistribution

#
#
###
##
##
#
#
##
#
##
#
##
#
##
##
#
1996Red King CrabDistribution

###
##
#
##
##
#
#
######
##
#
####
##
#
#
1999Red King CrabDistribution
##
##
#
##
#
##
#
#
##
##
####
##
#
#
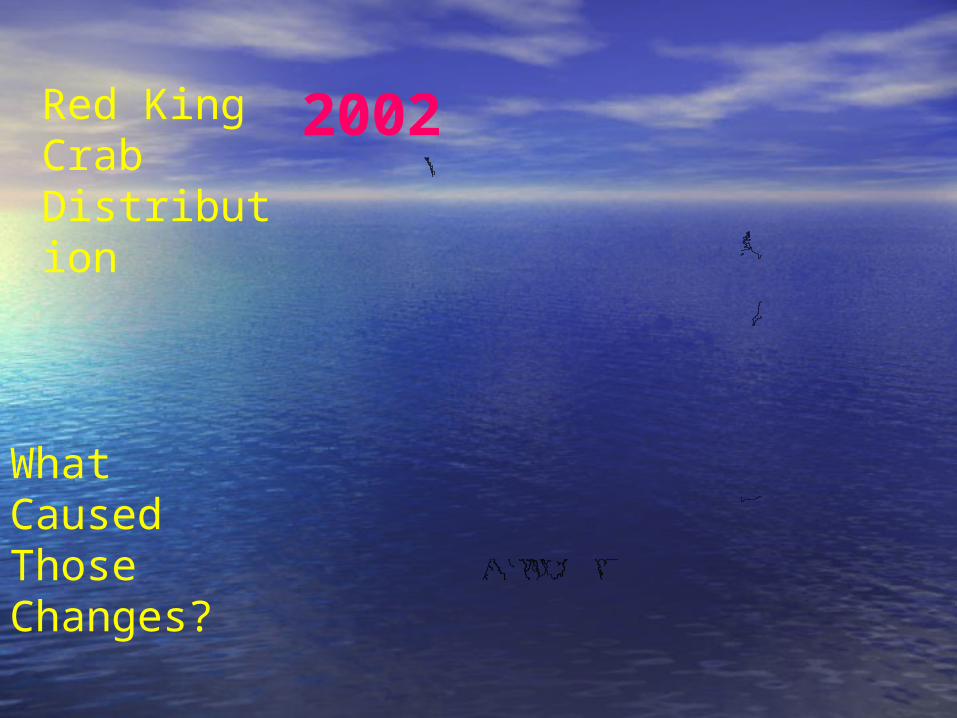
2002Red King CrabDistribution
What Caused Those Changes?

FurtherFurther Study DirectionsStudy Directions•2006 Trawl Survey 2006 Trawl Survey (Pending: No bidders 2005 )(Pending: No bidders 2005 )
– This Survey may show a significant faunal change. This Survey may show a significant faunal change. – Virtual disappearance of sea star from winter king Virtual disappearance of sea star from winter king
crab survey since 2003crab survey since 2003
•Spatial-Temporal Analyses Spatial-Temporal Analyses (NPRB funding proposal)(NPRB funding proposal)– Identify areas of high biomass, species richness Identify areas of high biomass, species richness
and diversity and diversity – Examine changes in spatial distributionExamine changes in spatial distribution– Correlate spatial distribution of major species with Correlate spatial distribution of major species with
environmental variablesenvironmental variables– Construct potential habitat prediction modelConstruct potential habitat prediction model
Q & AQ & A