Analisis de Una Roundabout
14
US-40 & Elk River Rd. Steamboat Springs, CO Roundabout Analysis Prepared by: 707 17 th Street, Suite 2300 Denver, CO 80202 Prepared for: Colorado Department of Transportation October 2009
-
Upload
camilo-gutierrez-vasquez -
Category
Documents
-
view
222 -
download
0
Transcript of Analisis de Una Roundabout
8/9/2019 Analisis de Una Roundabout
http://slidepdf.com/reader/full/analisis-de-una-roundabout 1/14
US-40 & Elk River Rd.Steamboat Springs, CO
Roundabout Analysis
Prepared by:
707 17th Street, Suite 2300Denver, CO 80202
Prepared for:
Colorado Department of Transportation
October 2009
8/9/2019 Analisis de Una Roundabout
http://slidepdf.com/reader/full/analisis-de-una-roundabout 2/14
Roundabout Analysis TOC-i
TABLE OF CONTENTS
Page No.
Introduction ................................................................................................................................. 1
Methodology................................................................................................................................ 1
Analysis Steps: .......................................................................................................................... 1
Base Data: .................................................................................................................................. 2
Default Geometric Parameters assumed for RODEL Analysis: ........................................ 2
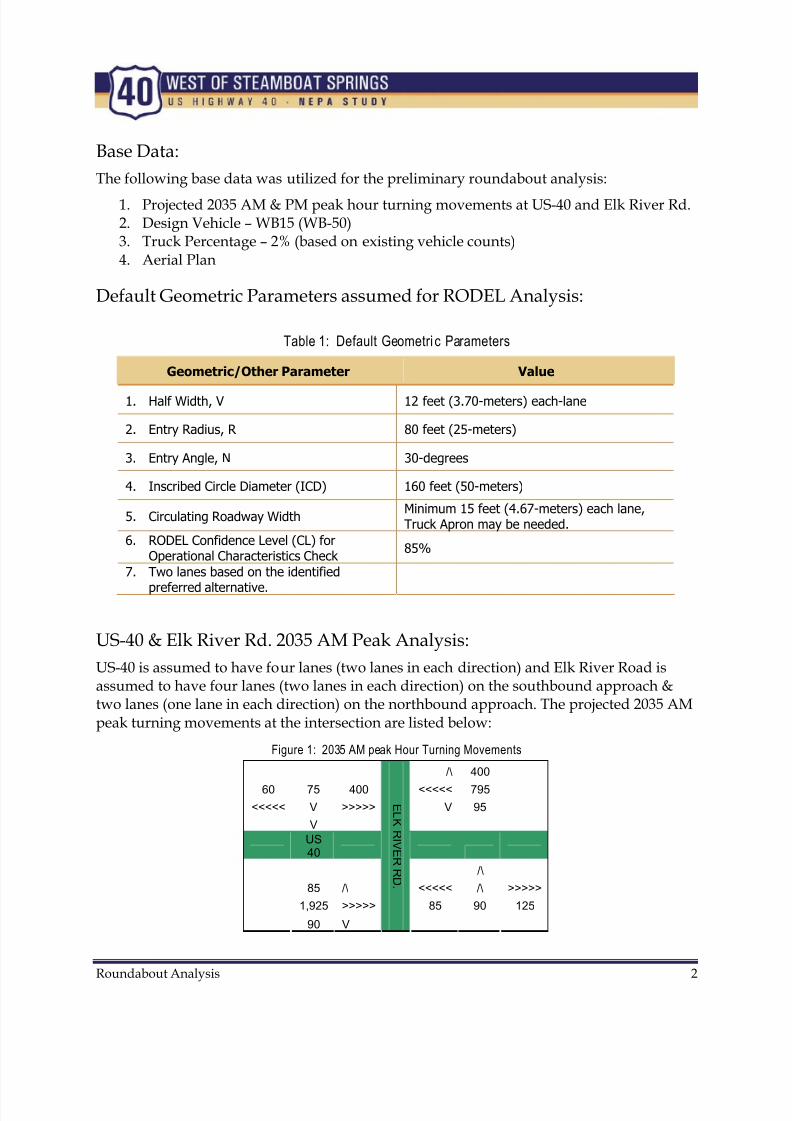
US-40 & Elk River Rd. 2035 AM Peak Analysis:.................................................................. 2
US-40 & Elk River Rd. 2035 PM Peak Analysis:................................................................... 6
Revised Geometry....................................................................................................................... 9
Conclusion.................................................................................................................................. 11
APPENDICES
LIST OF FIGURES
Figure 1: 2035 AM peak Hour Turning Movements............................................................................ 2
Figure 2: 2035 AM Peak Hour Roundabout Entering and Circulating Volumes............................. 3
Figure 3: FHWA Capacity Comparison of Single-lane and Double-lane Roundabouts................. 4
Figure 4: RODEL Analysis Results: AM - Two Lane Roundabout .................................................... 6
Figure 5: 2035 PM Peak Hour Turning Movements............................................................................. 6
Figure 6: 2035 PM Peak Hour Roundabout Entering and Circulating Volumes ............................. 7
Figure 6: RODEL Analysis Results: PM – Two Lane Roundabout .................................................... 8
Figure 7: RODEL Analysis Results: PM - Two Lane Roundabout w/ Bypass................................. 9
Figure 8: RODEL Analysis Results: AM – Three Circulating Lanes EB and WB........................... 10
Figure 9: RODEL Analysis Results: PM - Three Circulating Lanes EB and WB ............................ 10
Figure 10: RODEL Analysis Results: AM – WB RT Bypass, Three Circulating Lanes EB ............ 11
Figure 11: RODEL Analysis Results: PM – WB RT Bypass, Three Circulating Lanes EB............. 11
LIST OF TABLES
Table 1: Default Geometric Parameters ................................................................................................. 2
Table 2: Capicity Analysis........................................................................................................................ 4
Table 3: Circulating and Entering Volumes .......................................................................................... 5
Table 4: Capacity Analysis....................................................................................................................... 7
Table 5: Circulating and Entering Volumes .......................................................................................... 8
8/9/2019 Analisis de Una Roundabout
http://slidepdf.com/reader/full/analisis-de-una-roundabout 3/14
Roundabout Analysis 1
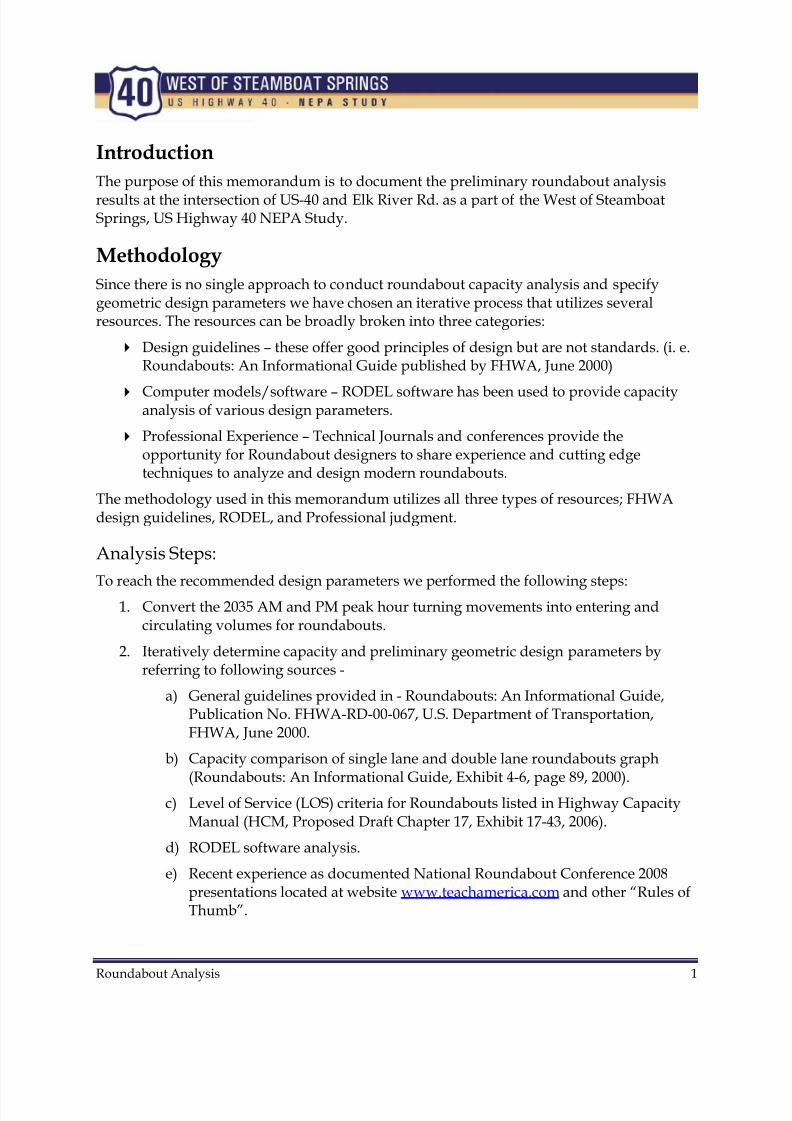
Introduction
The purpose of this memorandum is to document the preliminary roundabout analysis
results at the intersection of US-40 and Elk River Rd. as a part of the West of SteamboatSprings, US Highway 40 NEPA Study.
Methodology
Since there is no single approach to conduct roundabout capacity analysis and specifygeometric design parameters we have chosen an iterative process that utilizes severalresources. The resources can be broadly broken into three categories:
Design guidelines – these offer good principles of design but are not standards. (i. e.Roundabouts: An Informational Guide published by FHWA, June 2000)
Computer models/software – RODEL software has been used to provide capacityanalysis of various design parameters.
Professional Experience – Technical Journals and conferences provide theopportunity for Roundabout designers to share experience and cutting edgetechniques to analyze and design modern roundabouts.
The methodology used in this memorandum utilizes all three types of resources; FHWAdesign guidelines, RODEL, and Professional judgment.
Analysis Steps:
To reach the recommended design parameters we performed the following steps:1. Convert the 2035 AM and PM peak hour turning movements into entering and
circulating volumes for roundabouts.
2. Iteratively determine capacity and preliminary geometric design parameters byreferring to following sources -
a) General guidelines provided in - Roundabouts: An Informational Guide,Publication No. FHWA-RD-00-067, U.S. Department of Transportation,FHWA, June 2000.
b) Capacity comparison of single lane and double lane roundabouts graph
(Roundabouts: An Informational Guide, Exhibit 4-6, page 89, 2000).c) Level of Service (LOS) criteria for Roundabouts listed in Highway Capacity
Manual (HCM, Proposed Draft Chapter 17, Exhibit 17-43, 2006).
d) RODEL software analysis.
e) Recent experience as documented National Roundabout Conference 2008presentations located at website www.teachamerica.com and other “Rules ofThumb”.
8/9/2019 Analisis de Una Roundabout
http://slidepdf.com/reader/full/analisis-de-una-roundabout 4/14

8/9/2019 Analisis de Una Roundabout
http://slidepdf.com/reader/full/analisis-de-una-roundabout 5/14
Roundabout Analysis 3
2035 AM peak hour turning movements were then converted to roundabout volumes(entering and circulating) listed below: Entering volumes equal the total approach volumesunless a right turn bypass is provided. In that case the right turn volumes are removedfrom the calculation. For this initial analysis, no right turn bypass is assumed and allmovements will enter the roundabout. Circulating volumes equal all vehicle passing theapproach. This includes through movements and left turns from the approach immediatelyto the left of the subject approach in addition to the left turns from the opposite approach.For example for the SB Elk River Road approach entering volumes equals Right Turns +Through + Left Turns = 60 + 75 + 400 = 535. Circulating volumes for this approach equalWB US 40 Through + WB US 40 LT + NB Elk River Road LT = 795 + 95 + 85 = 975. Theconflicting volumes are the total of the entering volumes plus the circulating volumes.Again using the SB Elk River Road leg as an example, the entering 535 vehicles conflict with
975 vehicles circulating past the entry point creating a total conflicting volume of 1,510.
Figure 2: 2035 AM Peak Hour Roundabout Entering and Circulating Volumes
Entry Exit
535 575
Exit 940 1,290 Entry
Entry 2,100 2,450 Exit
260 300
Exit Entry
Capacity Analysis based on FHWA Guidelines:
The capacity at each entry is determined based on Exhibit 4-6 (Roundabouts - AnInformational Guide, page 89). This analysis is based on the relationship between entry andcirculating volumes shown in the referenced figure. Figure 3 below reproduces the FHWAfigure.
975
2,410
260
570

8/9/2019 Analisis de Una Roundabout
http://slidepdf.com/reader/full/analisis-de-una-roundabout 6/14
Roundabout Analysis 4
Figure 3: FHWA Capacity Comparison of Singl e-lane and Double-lane Roundabouts
Roundabouts are designed to operate at no more than 85% of their estimated capacity.Beyond this threshold delays and queues vary significantly from their mean values and canbreak down.
Table 2 below depicts the V/c analysis for a double-lane roundabout with a 160 footinscribed circle diameter (ICD). The analysis indicates that the eastbound US-40 entry willoperate over capacity with a V/c ratio of 1.05 (>0.85) during the AM peak hour.
Table 2: Capicity Analysis
LegCirculating Volume
(vph)
EnteringFlow(vph)
Capacityof Entry*
(vph)
V/CRatio
Remarks
Eastbound US-40 570 2,100 2,000 1.05>0.85, overcapacity
Northbound Elk River Rd. 2,410 300 700 0.43
Westbound US-40 260 1,290 2,200 0.59
Southbound Elk River Rd. 975 535 1,700 0.31
*Capacity of the Entry varies based on Circulating volumes as shown in figure __ above.

8/9/2019 Analisis de Una Roundabout
http://slidepdf.com/reader/full/analisis-de-una-roundabout 7/14
Roundabout Analysis 5
Conflicting Volumes The total circulating and entering volume on the eastbound and northbound approachesexceed the normal range (2,000 to 2,200 vehicles per hour) for a double lane roundabout.Table 3 shows the total conflicting volumes on each approach. Capacity varies as shown inthe FHWA figure shown earlier.
Table 3: Circulating and Entering Volumes
LegCirculating +
Entering Volume(vph)
Eastbound US-40 2,670
Northbound Elk River Rd. 2,710
Westbound US-40 1,550
Southbound Elk River Rd. 1,510
A three-lane approach and a third eastbound lane within roundabout will be required toaccommodate and improve the capacity during the AM peak hour. The FHWA guidehowever does not provide guidance for analyzing three lane roundabouts. Analysis of athree lane roundabout will need be conducted with RODEL only.
RODEL Analysis:Based on the default geometric parameters listed earlier, RODEL was used to determine theroundabout Level of Service (LOS) based on average vehicle delay graded A-F (similar to
reporting of other intersection types). A two-lane roundabout (160 foot ICD) was analyzedbased on the preferred alternative recommendation of four lanes on US 40. The RODELanalysis indicates that the roundabout will operate at LOS F during the AM peak period in2035. The traffic volumes at the eastbound US-40 and northbound Elk River Rd. entries willexceed capacity. Significant delay and queuing will occur at these entries.

8/9/2019 Analisis de Una Roundabout
http://slidepdf.com/reader/full/analisis-de-una-roundabout 8/14
Roundabout Analysis 6
Figure 4: RODEL Analysis Results: AM - Two Lane Roundabout
At least a third eastbound entering lane and a third circulating lane within the roundaboutwill be required at this intersection during the AM peak in 2035 to operate at an acceptableLOS. Since the directional split on US 40 is so pronounced (60/40) the PM analysis wasreviewed to determine the roundabout geometry to accommodate the 2035 PM volumes.
US-40 & Elk River Rd. 2035 PM Peak Analysis:
The preferred alternative for US-40 will have four lanes (two lanes in each direction) andElk River Road is assumed to have four lanes (two lanes in each direction) on thesouthbound approach & two lanes (one lane in each direction) on the northboundapproach. The projected 2035 PM peak turning movements at the intersection are listedbelow:
Figure 5: 2035 PM Peak Hour Turning Movements
/\ 425
95 100 475 <<<<< 1,710
<<<<< V >>>>> V 135V
US
40
/\
95 /\ <<<<< /\ >>>>>
940 >>>>> 160 100 165
105 V
E L K RI V E R RD.

8/9/2019 Analisis de Una Roundabout
http://slidepdf.com/reader/full/analisis-de-una-roundabout 9/14
Roundabout Analysis 7
2035 PM peak hour turning movements were then converted to roundabout volumes(entering and circulating) listed below:
Figure 6: 2035 PM Peak Hour Roundabout Entering and Circulating Volumes
Entry Exit
670 620
Exit 1,965 2,270 Entry
Entry 1,140 1,580 Exit
340 425
Exit Entry
Capacity Analysis based on FHWA Guidelines: The V/c analysis assuming a double-lane roundabout with a 160 foot inscribed circlediameter (ICD) indicates the westbound US-40 entry will operate over capacity with a V/cratio of 1.06 during the PM peak hour.
Table 4: Capacity Analysis
LegCirculating Volume
(vph)
EnteringFlow(vph)
Capacityof Entry*
(vph)
V/CRatio
Remarks
Eastbound US-40 710 1,140 1,900 0.54Northbound Elk River Rd. 1,510 425 1,300 0.33
Westbound US-40 355 2,270 2,150 1.06 >0.85, overcapacity
Southbound Elk River Rd. 2,005 670 1,000 0.67
*Capacity of the Entry varies based on Circulating volumes as shown in figure __ above.
1,510
355
2 005
710
8/9/2019 Analisis de Una Roundabout
http://slidepdf.com/reader/full/analisis-de-una-roundabout 10/14
Roundabout Analysis 8
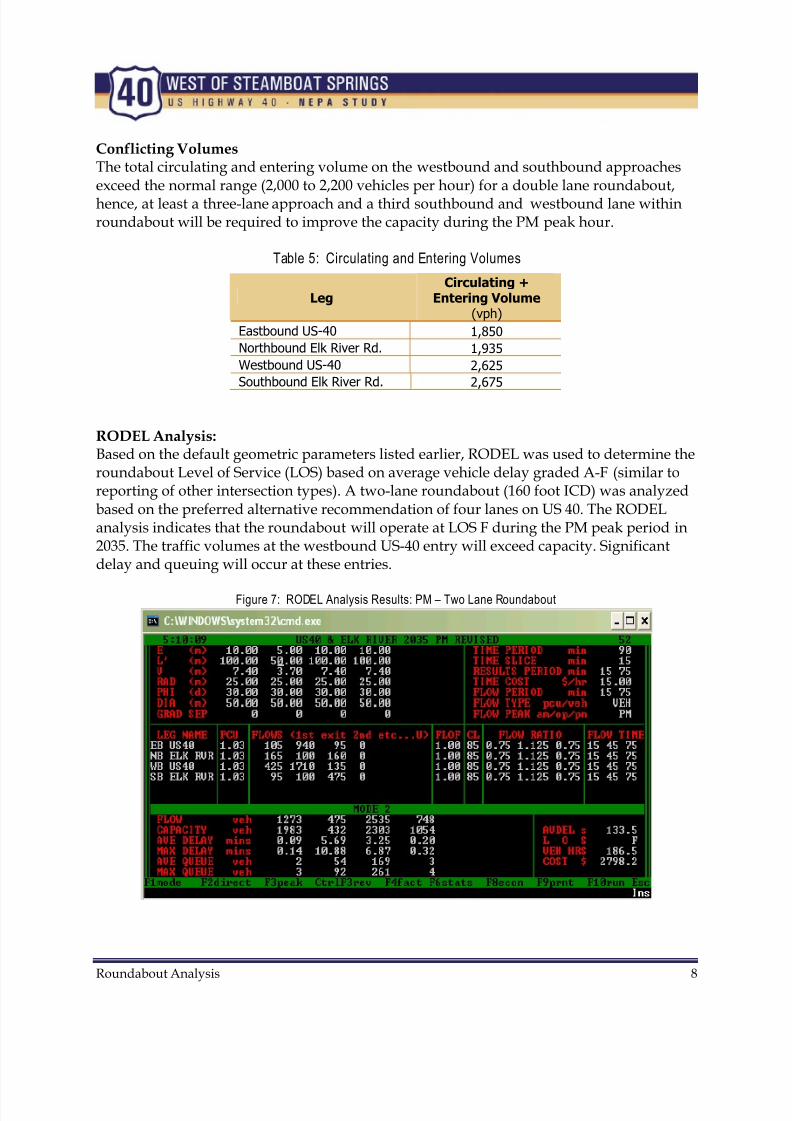
Conflicting Volumes The total circulating and entering volume on the westbound and southbound approachesexceed the normal range (2,000 to 2,200 vehicles per hour) for a double lane roundabout,hence, at least a three-lane approach and a third southbound and westbound lane withinroundabout will be required to improve the capacity during the PM peak hour.
Table 5: Circulating and Entering Volumes
LegCirculating +
Entering Volume(vph)
Eastbound US-40 1,850
Northbound Elk River Rd. 1,935
Westbound US-40 2,625
Southbound Elk River Rd. 2,675
RODEL Analysis:Based on the default geometric parameters listed earlier, RODEL was used to determine theroundabout Level of Service (LOS) based on average vehicle delay graded A-F (similar toreporting of other intersection types). A two-lane roundabout (160 foot ICD) was analyzedbased on the preferred alternative recommendation of four lanes on US 40. The RODELanalysis indicates that the roundabout will operate at LOS F during the PM peak period in2035. The traffic volumes at the westbound US-40 entry will exceed capacity. Significantdelay and queuing will occur at these entries.
Figure 7: RODEL Analysis Results: PM – Two Lane Roundabout

8/9/2019 Analisis de Una Roundabout
http://slidepdf.com/reader/full/analisis-de-una-roundabout 11/14
Roundabout Analysis 9
Because of the heavy westbound right turn volumes during the PM peak hour, awestbound right-turn bypass lane on US-40 is considered. With this improvement theintersection will operate at LOS E.
Figure 8: RODEL Analysis Results: PM - Two Lane Roundabout w / Bypass
To provide adequate capacity in the PM, at a minimum a two lane roundabout with awestbound right turn bypass would be necessary. Since this configuration would
essentially be operating at capacity, a third entering lane and third circulating lane arepreferable for WB US 40 traffic.
Revised Geometry
Based on the above presented analysis, two revised roundabout geometries were tested inRODEL to determine their capacity to handle AM and PM peak volumes.
The first is a roundabout with three circulating lanes in each direction on US-40 and a twocirculating lanes for south and north bound traffic. Given this geometry the RODELanalysis indicates that the intersection will operate at LOS B during the AM peak hour &
LOS C during the PM peak hour in 2035.

8/9/2019 Analisis de Una Roundabout
http://slidepdf.com/reader/full/analisis-de-una-roundabout 12/14
Roundabout Analysis 10
Figure 9: RODEL Analysis Results: AM – Three Circulating Lanes EB and WB
Figure 10: RODEL Analysis Results: PM - Three Circulating Lanes EB and WB
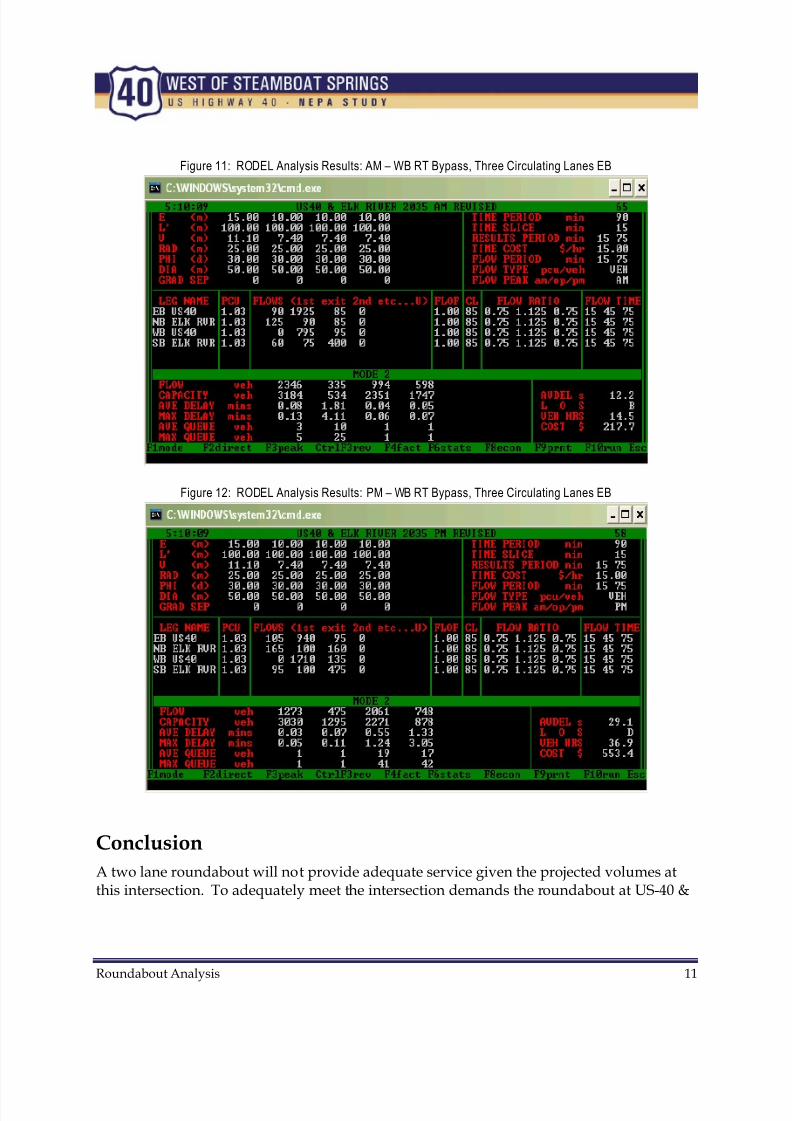
The second geometry option included a roundabout with two circulating lanes for northsouth, and west bound traffic and three circulating lanes for eastbound traffic. For thisconfiguration to work, a westbound right-turn bypass lane is provided. This configurationwill operate at LOS B during the AM peak hour & LOS D during the PM peak hour in 2035.
8/9/2019 Analisis de Una Roundabout
http://slidepdf.com/reader/full/analisis-de-una-roundabout 13/14
Roundabout Analysis 11
Figure 11: RODEL Analysis Results: AM – WB RT Bypass, Three Circulating Lanes EB
Figure 12: RODEL Analysis Results: PM – WB RT Bypass, Three Circulating Lanes EB
Conclusion
A two lane roundabout will not provide adequate service given the projected volumes atthis intersection. To adequately meet the intersection demands the roundabout at US-40 &
8/9/2019 Analisis de Una Roundabout
http://slidepdf.com/reader/full/analisis-de-una-roundabout 14/14
Roundabout Analysis 12
Elk River Road intersection will require one of the following geometric configurations tooperate at an acceptable LOS in 2035.
1. A roundabout with three circulating lanes in eastbound and westbound direction onUS-40 and two circulating lanes for the north and south bound traffic.
OR
2. A roundabout with a westbound right-turn bypass lane, two circulating lanes for alldirections except eastbound which will require three circulating lanes
This analysis shows that, to operate at an acceptable level of service, at least three lanesmust be provided in some locations within the roundabout. Three lane roundabouts do not
exhibit the same safety benefits as smaller roundabouts, especially in the off peak hours asvehicles can cut across the circulating lanes to limit their change in direction. This allowsvehicles to maintain higher speeds through larger roundabouts. Many of the safety benefitsof roundabouts are due to the reduced entry and circulating speeds.
In addition, professional experience shows that roundabouts work best when the volumeson the approaches are roughly balanced. In this case US 40 volumes are many times theapproach volumes on Elk River Road. In such situations, the large volume approaches arelikely to dominate the roundabout causing significant side street delay. The three lanes inaddition to the large US 40 volumes will combine so that the Elk River Road approacheswill operate more as a stop condition than as a yield necessary for successful roundabout
operations.
Based on this analysis a three lane roundabout was screened from consideration as analternative for the US 40 and Elk River Road intersection. Because a two lane roundaboutdoes not have adequate capacity to handle the projected volumes two lane and smallerroundabouts at this intersection were also screened from consideration.
J:\_Transportation\WVXV4800 Steamboat\Transportation Analysis\RODEL\RA_Elk River_Revised_10-12-09_fb.doc