Anaerobic co-digestion of waste activated sludge and ...
22
HAL Id: hal-00736422 https://hal.archives-ouvertes.fr/hal-00736422 Submitted on 28 Sep 2012 HAL is a multi-disciplinary open access archive for the deposit and dissemination of sci- entific research documents, whether they are pub- lished or not. The documents may come from teaching and research institutions in France or abroad, or from public or private research centers. L’archive ouverte pluridisciplinaire HAL, est destinée au dépôt et à la diffusion de documents scientifiques de niveau recherche, publiés ou non, émanant des établissements d’enseignement et de recherche français ou étrangers, des laboratoires publics ou privés. Anaerobic co-digestion of waste activated sludge and greasy sludge from flotation process: Batch versus CSTR experiments to investigate optimal design R. Girault, G. Bridoux, F. Nauleau, C. Poullain, J. Buffet, P. Peu, A.G. Sadowski, F. Béline To cite this version: R. Girault, G. Bridoux, F. Nauleau, C. Poullain, J. Buffet, et al.. Anaerobic co-digestion of waste acti- vated sludge and greasy sludge from flotation process: Batch versus CSTR experiments to investigate optimal design. Bioresource Technology, Elsevier, 2012, 105, p. 1 - p. 8. hal-00736422
Transcript of Anaerobic co-digestion of waste activated sludge and ...
HAL Id: hal-00736422https://hal.archives-ouvertes.fr/hal-00736422
Submitted on 28 Sep 2012
HAL is a multi-disciplinary open accessarchive for the deposit and dissemination of sci-entific research documents, whether they are pub-lished or not. The documents may come fromteaching and research institutions in France orabroad, or from public or private research centers.
L’archive ouverte pluridisciplinaire HAL, estdestinée au dépôt et à la diffusion de documentsscientifiques de niveau recherche, publiés ou non,émanant des établissements d’enseignement et derecherche français ou étrangers, des laboratoirespublics ou privés.
Anaerobic co-digestion of waste activated sludge andgreasy sludge from flotation process: Batch versusCSTR experiments to investigate optimal design
R. Girault, G. Bridoux, F. Nauleau, C. Poullain, J. Buffet, P. Peu, A.G.Sadowski, F. Béline
To cite this version:R. Girault, G. Bridoux, F. Nauleau, C. Poullain, J. Buffet, et al.. Anaerobic co-digestion of waste acti-vated sludge and greasy sludge from flotation process: Batch versus CSTR experiments to investigateoptimal design. Bioresource Technology, Elsevier, 2012, 105, p. 1 - p. 8. �hal-00736422�

Author-produced version of the article published in Bioresource Technology, 2012, 105, 1-8. Original publication available at www.sciencedirect.com –doi:10.1016/j.biortech.2011.11.024
Anaerobic co-digestion of waste activated sludge and greasy sludge from flotation process: batch versus CSTR experiments to investigate optimal
design Girault R.a,b, Bridoux G.c, Nauleau F.c, Poullain C.c, Buffet J.a,b, Peu P.a,b, Sadowski A.G.d, Béline F.a,b
a Cemagref, UR GERE, 17 av. de Cucillé, CS 64427, F-35044 Rennes, France. (Tel. (+33)2 23 48 21 42 – Fax: (+33)2 23 48 21 15 – e-mail: [email protected]) b Université Européenne de Bretagne, F-35044 Rennes, France c SAUR, Recherche et développement, Atlantis, 1, av. Eugène Freyssinet, F-78280 Guyancourt, France. d IMFS de Strasbourg (CNRS-UdS-ENGEES-INSA), France
Abstract
In this study, the maximum ratio of greasy sludge to incorporate with waste activated sludge
was investigated in batch and CSTR experiments. In batch experiments, inhibition occurred
with a greasy sludge ratio of more than 20-30% of the feed COD. In CSTR experiments, the
optimal greasy sludge ratio was 60% of the feed COD and inhibition occurred above a ratio of
80%. Hence, batch experiments can predict the CSTR yield when the degradation
phenomenon are additive but cannot be used to determine the maximum ratio to be used in a
CSTR configuration. Additionally, when the ratio of greasy sludge increased from 0% to 60%
of the feed COD, CSTR methane production increased by more than 60%. When the greasy
sludge ratio increased from 60% to 90% of the feed COD, the reactor yield decreased by 75%.
Keywords: anaerobic digestion, waste activated sludge, DAF sludge, LCFA, inhibition

1. Introduction
Sewage sludge management is one of the most expensive items in small wastewater
treatment plants (WWTP < 30000 p.e.). Most small WWTPs using activated sludge
technology are not equipped with a primary clarifier. As a consequence, sewage sludge from
such plants is only composed of waste activated sludge (WAS). Anaerobic digestion of
sewage sludge is a well-known technology which enables the volume of sludge produced to
be reduced, energy to be recovered and the sludge to be stabilised. However, WAS is less
biodegradable than primary sludge (Parkin & Owen, 1986) and the biochemical methane
potential (BMP) of WAS is consequently significantly lower than that of a mixture of primary
and secondary sludge (Chynoweth et al., 1993; Knezevic et al., 1995). Due to the low
methane potential and high building and operating costs, anaerobic digestion systems for
waste activated sludge are not profitable and are thus rare in small WWTPs. Pretreatment
methods can be used to optimize these processes and to increase biogas production (Appels et
al., 2008; Carrere et al., 2010) but these involve the consumption of energy and/or chemicals.
Another solution is co-digestion of WAS with one or several substrates with a higher BMP
value (Mata-Alvarez et al., 2000; Alatriste-Mondragón et al., 2006).
Lipid-rich wastes are known to combine high biodegradability and a high BMP value.
However, the degradation of such a substrate leads to the production of long chain fatty acids
(LCFAs) in the digester, which may destabilise the process in different ways (Pereira et al.,
2005): (1) adsorption of LCFAs onto the sludge can affect transport and the protective
functions of the bacteria wall and form a hydrophobic layer of LCFAs around biomass
aggregates. This phenomenon considerably reduces exchanges between the media and the
“encapsulated” bacteria; (2) entrapment of LCFAs in biomass aggregates can lead to biomass
flotation in the reactor and, as a consequence, to biomass leakage; (3) precipitation of the
LCFAs with divalent ions such as Ca2+ or Mg2+ makes them inaccessible to anaerobic biomass
and hence reduces their biodegradability. Moreover, the C/N value of lipid-rich substrates is
often above the optimal values (20-30) defined by Parkin and Owen (1986), which can lead to
a lack of nutrients when an excess of this kind of substrate is used. Inhibition of anaerobic
digestion by lipid-rich substrates and particularly LCFAs, caused by these phenomena has
been reported in the literature. Many authors mention reversible inhibition of methanogenesis
and other anaerobic digestion stages by LCFAs (Koster and Kramer, 1987; Angelidaki and
Ahring, 1992 ; Rinzema et al. 1994; Alves et al., 2001; Lalman and Bagley 2000, 2001; Cirne
et al., 2007). Most of these results were obtained in batch experiments and indicated a lag-
phase before methane production induced by LCFA inhibition. During this lag-phase, LCFA
degrading bacteria grow and allow the conversion of LCFAs, which encapsulate biomass
aggregates, into volatile fatty acids (VFAs), causing degradation of the LCFA capsule around
biomass aggregates, after which methanogenesis can take place (Pereira et al., 2005). To
avoid destabilisation of the process due to accumulation of LCFAs, the ratio of grease in the
influent has to be controlled, and the influence of this ratio on process stability and
performance needs to be investigated. In this context, Cirne et al. (2007) showed that
inhibition occurred (i.e. presence of a lag-phase) in batch experiments when triolein
represented more than 18% of the total COD of the substrate. However, due to the complex
impact of LCFA on anaerobic digestion of the biomass, many experimental factors can have a
major impact on results in terms of inhibition. Hwu et al. (1996) reported that their results
were influenced by the origin and the structure (suspended or granulated) of the inoculum,
while Lalman & Bagley (2001) reported that their results depended on the composition of the
lipid-rich substrate. Results can also be affected by possible acclimation of the biomass, the
experimental design (LCFA concentration, temperature, etc) and the concentration of divalent
ions in the medium in which the LCFAs can precipitate.
More recently, studies were made of the impact of the lipid to substrate ratio in the
influent of an anaerobic CSTR that treated a mixture of primary and secondary sludge.
Davidsson et al. (2008) showed that the reactor yield decreased when grease trap sludge (from
a municipal WWTP) represented more than 30% of the volatile solids (VS) of the influent.
Luostarinen et al. (2009) observed the same phenomenon with a proportion of grease trap
sludge from the food industry of more than 46% of the VS of the influent. Kabouris et al.
(2009) and Silvestre et al. (2011) observed that inhibition did not occur with ratios of lipid-
rich substrate in the influent of 48% and 37% of the feed VS respectively.
According to the results obtained in CSTR and comparing them to those obtained in
batch experiments, the frequently cited upper limit of 20% of greasy waste in the total influent
COD does not appear to be accurate and mainly results from batch experiments (Cirne et al.,
2007). Few data are available in the literature concerning the possible use of data from batch
for CSTR design. Consequently, in the present study, anaerobic co-digestion of WAS and

greasy sludge from a flotation process treating waste water from the meat industry was
investigated by comparing data from batch and continuous CSTR experiments. First, WAS
and greasy sludge were characterised in terms of composition, biodegradability and BMP.
Next, batch experiments were performed to investigate the effect of the ratio of greasy sludge
to WAS on methane production and inhibition. Finally, the effect of the ratio of greasy sludge
to WAS was investigated in a mesophilic CSTR. Reactor yield, VS-COD destruction and
stability parameters were determined. These results were compared with those from batch
experiments to evaluate the possibility of transposing results from batch experiments to
CSTR, in particular concerning inhibition.
2. Materials and methods
2.1. Substrates
WAS was sampled in a French activated sludge wastewater treatment plant
(Mordelles, France) whose capacity is about 10,000 p.e. After settling in the secondary
clarifier, WAS was thickened using a thickening table to reach a dry matter content of 5-6%.
For anaerobic digestion experiments (in batch or CSTR), WAS was sampled weekly and
stored at 4 °C.
Greasy sludge was sampled in the storage tank of a dissolved air flotation system that
processes wastewater from a meat industry (pork processing). Sampling was monthly and
samples were stored at 4 °C until anaerobic digestion tests.
2.2. Physical-chemical analysis
Total solids (TS), volatile solids (VS), total Kjeldhal nitrogen (TKN), total ammonia
nitrogen (TAN) and total chemical oxygen demand analysis (COD) were measured using
standard methods (APHA, AWWA, WEF, 1995). However, before COD analysis, greasy
sludge samples were saponified to improve measurement quality: 40 ml of greasy sludge were
mixed with 5 ml of NaOH (32%) and 55 ml of distilled water and heated at 60°C for 30 min
under mixing. The dilution factor was taken into account in the calculation of COD. Total
carbon was determined by elemental analysis (Thermo Flash 2000). Samples were oxidised
by flash combustion at 1800 °C and the resulting gas was analysed by gas chromatography
combined with catharometric detection.
Total lipid content was determined with a Soxhlet© extraction on substrate dry matter.
Each substrate was previously dried at 105°C and ground to a powder (1 mm). Soxhlet
extraction was carried out with a hexane/isopropanol (60/40) solvent for 5 hours. After
evaporation of the solvent, the percentage of hexane extractable materials (HEM) in TS was
determined by gravimetry.
For the biochemical fractionations, proteins (as % COD) were determined from
organic N content considering a ratio of 6.25 g of protein per g of organic N and an average
COD value of 1.42gO2/g of protein (Erreur ! Source du renvoi introuvable.) while lipids
were determined from the HEM considering an average COD value of 2.86gO2/g of lipids
(Equation 1). The remaining COD was considered as carbohydrates (Equation 2).
( )[ ] CODggOTANTKNggCODoteins proteinorganicNprotein //42.1/25.6100)(%Pr 2×−××=
Equation 1 : Equation for the calculation of the protein fraction of COD:
( ) CODHEMggOCODLipids lipid //86.2100)(% 2 ××=
Equation 2 : Equation for the calculation of the lipid fraction of COD:
)(%)(%Pr100)(% CODLipidsCODoteinsCODtesCarbohydra −−=
Equation 3 : Equation for the calculation of the carbohydrate fraction of COD:
In addition, volatile fatty acids (VFAs) and long chain fatty acids (LCFAs) were
analysed by high performance liquid chromatography (HPLC, Varian©, U3000) combined
with evaporative light-scattering detection. For VFAs, raw samples were first centrifuged and
the supernatant was used for analysis. For LCFA analysis, Soxhlet© extraction using the same
methodology as described for total lipid extraction was carried out. But to preserve LCFA
concentration and characteristics, extraction was performed on the raw sample without
previous drying. After extraction, the solvent containing LCFAs was injected into the HPLC.
2.3. Batch experiments
Batch experiments were performed to determine the biochemical methane potential
(BMP) of individual substrates and the methane production rate of mixtures of greasy sludge
and WAS to check at what ratios inhibition occurs. For this purpose, individual substrate or a
mixture of two substrates, inoculum and nutritive solution (Hach©, BOD Nutrient Buffer
Pillows) were placed in a 330-ml serum flask. The quantity of substrate was adjusted to
maintain a substrate:inoculum ratio of about 1gVSsubstrate/gVSinoculum. After filling, the bottles
were closed with a rubber cap and the atmospheric oxygen in the gas phase was purged with
N2. A batch experiment without substrate was also carried out to determine the endogenous
biogas and methane production rate of the inoculum. All batches were performed in triplicate.
All bottles containing serum were incubated at 38 °C. Biogas production was monitored daily
by pressure measurements (Digitron© 2085P). When the pressure in the bottles reached 1300
mbar, a sample of gas was removed and the pressure released. CH4/CO2 contents of gas
samples were analysed by gas chromatography (Agilent Technologies 6890N equipped with a
flame ionization detector). Biogas and methane production were monitored until the biogas
production rate of batch experiments with substrate reached endogenous levels. Finally, the
production of biogas or methane in a control without substrate was subtracted from the
production of the batch with substrate to obtain the real production rate and the potential of
the substrate.
Depending on the experiments, three different inoculums were used. The first
inoculum (inoculum 1) was sampled in a mesophilic anaerobic CSTR fed with a mixture of
pig slurry and horse feed and operating with an HRT of 27 days and an OLR of 3.9kgO2.m-
3reactor.d
-1. The second inoculum (inoculum 2) was sampled in a CSTR only fed with WAS
(HRT: 24 days, OLR=3.6kgO2.m-3
reactor.d-1). The third inoculum (inoculum 3) was sampled in
a CSTR fed with a mixture of WAS and greasy sludge (17% of the feed COD) operating with
an HRT of 24 days and an OLR of 3.8kgO2.m-3
reactor.d-1. Inoculum 1 was used for all batch
experiments including BMP determination and mixture studies while specific experiments
were carried out for mixtures using inoculums 2 and 3 to investigate the effect of inoculum
origin on inhibition results.
2.4. CSTR experiments
CSTR experiments were performed using two different digesters. The first digester
(A) was a CSTR with a working volume of 200 L. The temperature was set at 36 °C and the
reactor was fed twice a day by means of a temporized screw pump allowing the volume added
to be controlled. An overflow was used for withdrawal to ensure a fixed working volume. A
mechanical stirrer was used for mixing. Biogas production was monitored with a volumetric
gas counter and the biogas composition was analysed with an infrared analyser (GA 2000 SN,
Geotechnical Instruments©).
The second digester (B) was a CSTR with working volume of 3.4 L. Mixing was
performed by recirculating the sludge from the bottom of the reactor to the top. A peristaltic
pump ensured a fixed input volume. Biogas production was monitored with a volumetric gas
counter and biogas was analysed by gas chromatography as described in section 2.3. Other
configuration parameters were the same those used in reactor A.
All CSTR experiments were divided into nine successive runs in which increasing
greasy sludge ratios in the influent ( WAS sludgegreasy
sludgegreasy
+, expressed as a % of the total feed
COD) from 0% to 90% were evaluated. The first three runs were performed in reactor A (run
1A, 2A and 3A) and the six other runs were performed using digester B (run 4B, 5B, 6B, 7B,
8B and 9B). Between each run, a transition week was inserted with a greasy sludge ratio equal
to the mean of the former and the following ratio. To check if the results using the two
digesters could be compared, a similar run was carried out using the same ratio of greasy
sludge to WAS in the digesters feed (run 3A and run 4B).
In all cases, feedings were defined to obtain an HRT of about 25 days and an organic
loading rate (OLR) of 3kgCOD.m-3reactor.day-1. The influent mixture was designed to maintain
these parameters and the greasy sludge to WAS ratio by means of COD analyses. For high
greasy sludge ratios, the mixture was diluted with tap water to maintain a fixed total
concentration of COD in the influent.
For each greasy sludge ratio, CSTR efficiencies were calculated after a one month
period of stabilisation of the digester outputs (biogas production and effluent contents). Thus,
digester performances were calculated for a 3-week steady state period. The total duration of
CSTR experiments including all the runs was 21 months.

3. Results and discussion
3.1. Substrate characteristics
Physical-chemical properties of WAS and greasy sludge are listed in Table 1.
Parameters Units
WAS Greasy sludge
Mean value Relative standard deviation
Mean value Relative standard deviation
pH - 6.5 1.4% 5.5 2.8% TS g.kg-1 57.0 6.5% 95.8 20.1%
VS g.kg-1 45.8 9.2% 86.3 21.6% %TS 80.2 4.3% 89.8 2.8%
Total COD gO2.kg-1 75.2 5.9% 195.7 20.8%
gO2.gVS-1 1.6 5.9% 2.2 10.1% TKN gN.kg-1 4.6 12.0% 1.9 10.0% TAN gN.kg-1 0.1 75.8% 0.1 74.1%
Total C gC.kg-1 26.8 14.8% 78.2 19.4% C/N gC.gN-1 5.8 - 41.6 -
Protein %VS 60.6 - 11.4 -
%COD 51.3 - 7.5 -
Lipid %VS 9.7 - 50.1 -
%COD 17.2 - 64.1 -
Carbohydrates %VS 29.6 - 37.5 -
%COD 31.5 - 28.4 - Total P gP.kg-1 2.6 - 0.15 -
Ca2+ mgCa2+.kgTS-1 889.2 - 3171.0 - Mg2+ mgMg2
+.kgTS-1 399.0 - 98.6 -
BMPmethane NL.kg-1 11.7 22.8% 74.1 19.1%
NL.kgVS-1 255.4 17.4% 871.6 14.7% NL.kgCOD-1 155.2 17.0% 379.9 3.1%
BMPbiogaz NL.kg-1 18.6 23.9% 92.6 12.7%
NL.kgVS-1 405.7 19.0% 1096.6 14.1% Methane/biogas % 63.2 3.1% 79.6 9.2% Biodegradability %COD 44.3 - 108.5 -
Table 1 : Complete characterization of WAS and greasy sludge.
Significant differences between the two substrates were observed. TS content was
respectively 57.0g.kg-1 and 95.8g.kg-1 for WAS and greasy sludge. Major differences were
also observed in the biochemical fractionation of the organic matter in each substrate. As

expected, the majority of VS in greasy sludge is formed by lipids (50.1% of the VS and
64.1% of the total COD), whereas proteins formed the majority of the VS in WAS (60.6% of
the VS and 51.3% of the total COD). Despite the origin of the greasy sludge, the carbohydrate
fraction of the VS was significant (37.5% of the VS and 28.4% of the total COD). These
properties resulted in very different C/N values: 5.8gC.gN-1 and 41.6gC.gN-1for WAS and
greasy sludge respectively. WAS presented a BMP value of 11.7NLch4.kg-1
(155.2NLch4.kgVS-1) with a methane concentration of 63.2% in the biogas. Greasy sludge
presented a BMP value of 74.1NLch4.kg-1 (871.6NLch4.kgVS-1) and a methane content of
79.6% in the biogas. This BMP value is in accordance with values cited in the literature for
fatty sludge ranging between 430 and 990 NLch4.kgVS-1. (Luastorinen et al., 2009; Kabouris
et al., 2009; Silvestre et al., 2010). In addition to VS biochemical fractionation, differences in
biodegradability values explain the observed BMP values. In fact, the biodegradability of
greasy sludge COD is very high (slightly higher than 100% due to analysis incertitude) in
comparison with values obtained for WAS (44% on the basis of COD). Given the possible
precipitation of LCFA with Mg2+ and Ca2+ and considering theoretical stoichiometric ratios,
this phenomenon concerned a maximum of 5% of the total substrate COD for WAS and 7%
for greasy sludge. Hence, this phenomenon cannot have a significant impact on the
accessibility and biodegradability of either substrate.
In conclusion, because of its high BMP value, greasy sludge resulting from a flotation
process is a potentially usable co-substrate for co-digestion with WAS. In addition, due to its
low N and P contents and its high biodegradability, using it as a co-substrate would have only
a slight impact on the N and P loading rates of the WWTP (back to top of the liquid fraction
after dewatering) and the sludge production respectively.
3.2. Batch experiments
Batch experiments were carried out to investigate the maximum ratio of lipid-rich
effluent to incorporate in WAS. The effect of the origin of the inoculum on batch results in
terms of BMP of the mixture and inhibitions was also investigated by comparing the results of
inoculum 1, 2 and 3.
Batch experiments were carried with four different greasy sludge to WAS ratios, in
which greasy sludge represented 10, 20, 30 and 40% of the total COD of the substrates. For
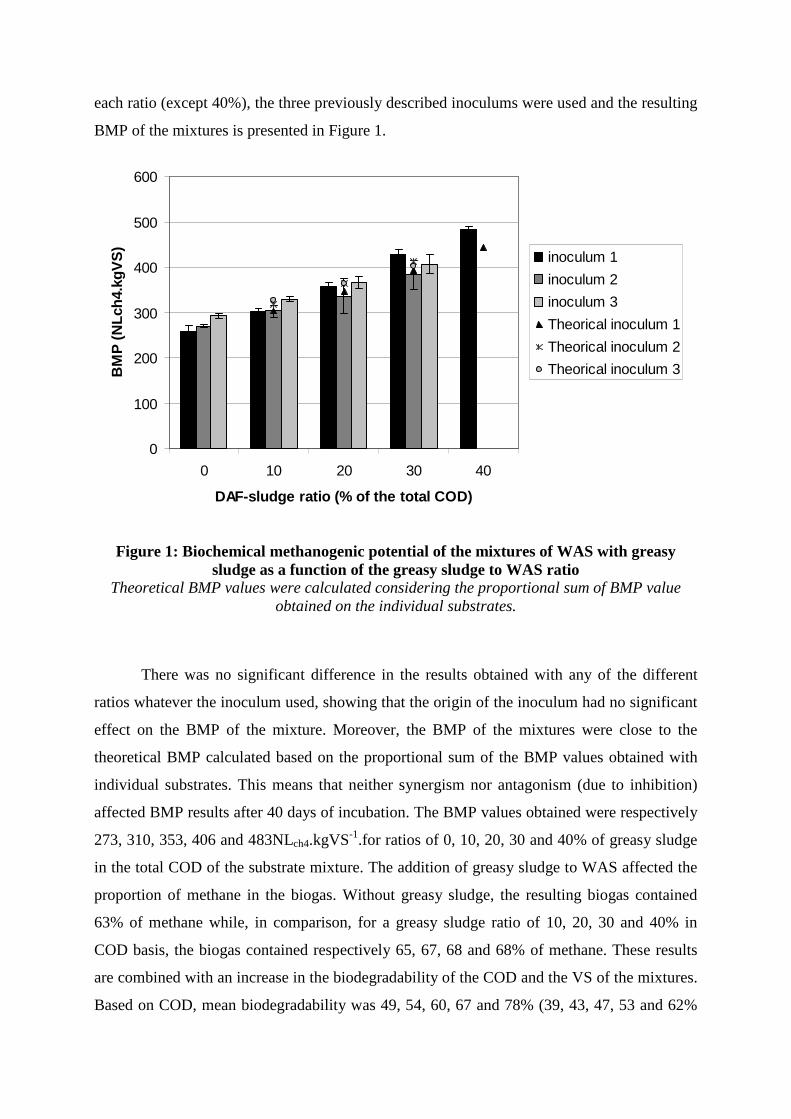
each ratio (except 40%), the three previously described inoculums were used and the resulting
BMP of the mixtures is presented in Figure 1.
0
100
200
300
400
500
600
0 10 20 30 40
DAF-sludge ratio (% of the total COD)
BM
P (
NL
ch4.
kgV
S)
inoculum 1
inoculum 2
inoculum 3
Theorical inoculum 1
Theorical inoculum 2
Theorical inoculum 3
Figure 1: Biochemical methanogenic potential of the mixtures of WAS with greasy sludge as a function of the greasy sludge to WAS ratio
Theoretical BMP values were calculated considering the proportional sum of BMP value obtained on the individual substrates.
There was no significant difference in the results obtained with any of the different
ratios whatever the inoculum used, showing that the origin of the inoculum had no significant
effect on the BMP of the mixture. Moreover, the BMP of the mixtures were close to the
theoretical BMP calculated based on the proportional sum of the BMP values obtained with
individual substrates. This means that neither synergism nor antagonism (due to inhibition)
affected BMP results after 40 days of incubation. The BMP values obtained were respectively
273, 310, 353, 406 and 483NLch4.kgVS-1.for ratios of 0, 10, 20, 30 and 40% of greasy sludge
in the total COD of the substrate mixture. The addition of greasy sludge to WAS affected the
proportion of methane in the biogas. Without greasy sludge, the resulting biogas contained
63% of methane while, in comparison, for a greasy sludge ratio of 10, 20, 30 and 40% in
COD basis, the biogas contained respectively 65, 67, 68 and 68% of methane. These results
are combined with an increase in the biodegradability of the COD and the VS of the mixtures.
Based on COD, mean biodegradability was 49, 54, 60, 67 and 78% (39, 43, 47, 53 and 62%
based on VS) for ratios of 0, 10, 20, 30 and 40% of greasy sludge in the total COD. As
expected, the addition of greasy sludge increased the total biodegradability of the mixture due
to the high biodegradability of this substrate (close to 100%, as highlighted in table 1).
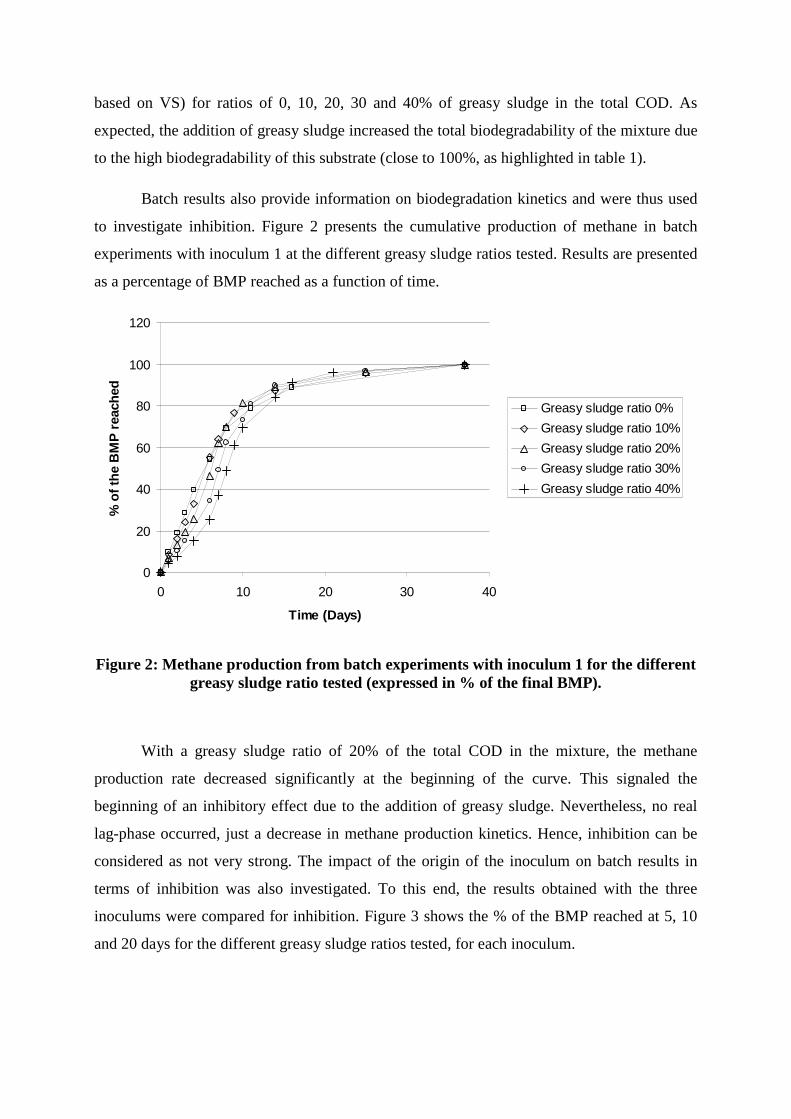
Batch results also provide information on biodegradation kinetics and were thus used
to investigate inhibition. Figure 2 presents the cumulative production of methane in batch
experiments with inoculum 1 at the different greasy sludge ratios tested. Results are presented
as a percentage of BMP reached as a function of time.
0
20
40
60
80
100
120
0 10 20 30 40
Time (Days)
% o
f th
e B
MP
rea
ched
Greasy sludge ratio 0%
Greasy sludge ratio 10%
Greasy sludge ratio 20%
Greasy sludge ratio 30%
Greasy sludge ratio 40%
Figure 2: Methane production from batch experiments with inoculum 1 for the different greasy sludge ratio tested (expressed in % of the final BMP).
With a greasy sludge ratio of 20% of the total COD in the mixture, the methane
production rate decreased significantly at the beginning of the curve. This signaled the
beginning of an inhibitory effect due to the addition of greasy sludge. Nevertheless, no real
lag-phase occurred, just a decrease in methane production kinetics. Hence, inhibition can be
considered as not very strong. The impact of the origin of the inoculum on batch results in
terms of inhibition was also investigated. To this end, the results obtained with the three
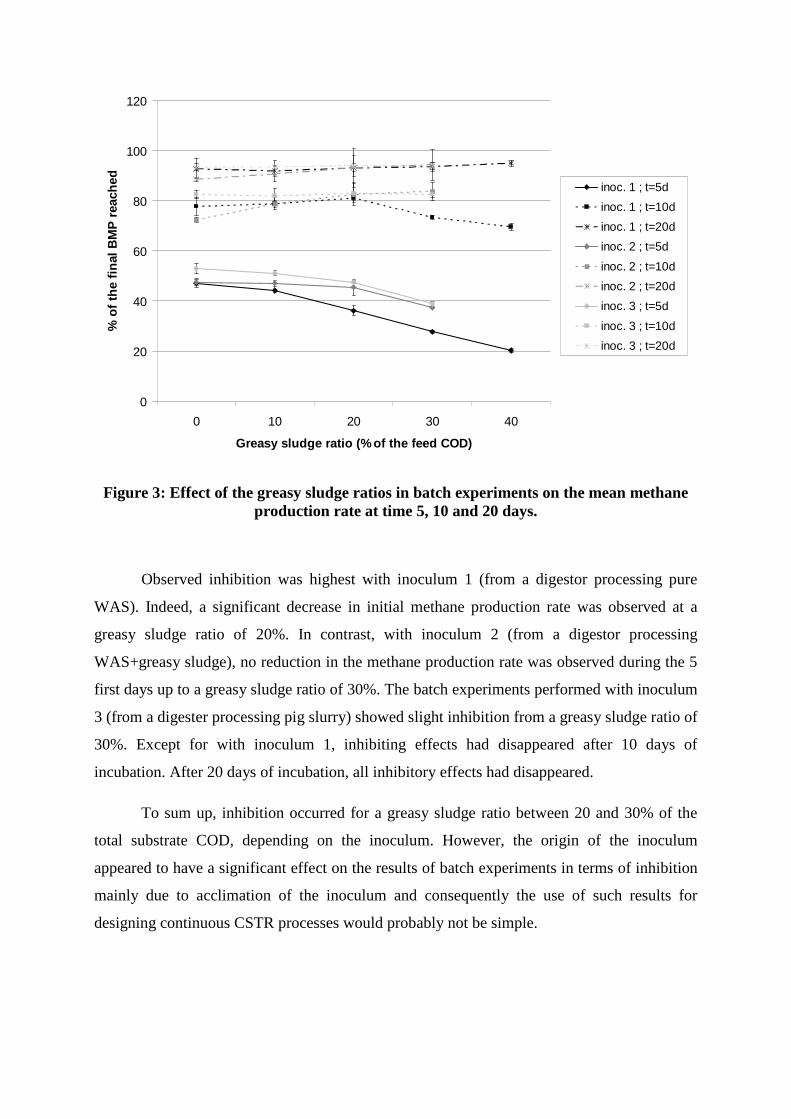
inoculums were compared for inhibition. Figure 3 shows the % of the BMP reached at 5, 10
and 20 days for the different greasy sludge ratios tested, for each inoculum.
0
20
40
60
80
100
120
0 10 20 30 40
Greasy sludge ratio (% of the feed COD)
% o
f th
e fi
nal
BM
P r
each
ed inoc. 1 ; t=5d
inoc. 1 ; t=10d
inoc. 1 ; t=20d
inoc. 2 ; t=5d
inoc. 2 ; t=10d
inoc. 2 ; t=20d
inoc. 3 ; t=5d
inoc. 3 ; t=10d
inoc. 3 ; t=20d
Figure 3: Effect of the greasy sludge ratios in batch experiments on the mean methane production rate at time 5, 10 and 20 days.
Observed inhibition was highest with inoculum 1 (from a digestor processing pure
WAS). Indeed, a significant decrease in initial methane production rate was observed at a
greasy sludge ratio of 20%. In contrast, with inoculum 2 (from a digestor processing
WAS+greasy sludge), no reduction in the methane production rate was observed during the 5
first days up to a greasy sludge ratio of 30%. The batch experiments performed with inoculum
3 (from a digester processing pig slurry) showed slight inhibition from a greasy sludge ratio of
30%. Except for with inoculum 1, inhibiting effects had disappeared after 10 days of
incubation. After 20 days of incubation, all inhibitory effects had disappeared.
To sum up, inhibition occurred for a greasy sludge ratio between 20 and 30% of the
total substrate COD, depending on the inoculum. However, the origin of the inoculum
appeared to have a significant effect on the results of batch experiments in terms of inhibition
mainly due to acclimation of the inoculum and consequently the use of such results for
designing continuous CSTR processes would probably not be simple.

3.3. CSTR experiments
3.3.1. Biogas production
The maximum ratio of lipid rich effluent to incorporate with WAS was also
investigated in a CSTR configuration. For this purpose, nine different greasy sludge ratios
(from 0% to 90%) were evaluated based on total COD. CSTR experiments were carried out
with an increasing ratio of greasy sludge to allow biomass acclimation in the reactor. To avoid
effects of other configuration parameters than the greasy sludge ratio in the influent, OLR and
the HRT were maintained as constant as possible during the experimental runs. However, due
to variations in substrate contents and in operational conditions, some variations were
observed. HRT ranged between 24 and 30 days with a mean value of 25 days. OLR ranged
between 2.5 and 3.8kgCOD.m-3reactor.day-1 with a mean value of 3.1 kgCOD.m-3
reactor.day-1.
The substrate mixture was designed to maintain these two parameters as constant as possible.
As a result, due to the different ratios of COD to VS for each substrate (1.6 and 2.3 for WAS
and greasy sludge respectively), the OLR based on VS decreased with an increase in the
greasy sludge ratio in the mixture. This parameter decreased from 1.9 to 1.0kgVS.m-
3reactor.day-1 for a greasy sludge ratio of 0 and 90% respectively. Biogas and methane
production were monitored.
First, COD mass balance was calculated for each run considering the input COD
stream in the digester and the output COD stream in the digester (CH4 and effluent) from
Equation 4 in order to check the reliability of each experiment. For the COD of CH4, a
theoretical value of 350NLch4.kgCODdegraded-1 was used.
COD mass balance (%) = CODCH4+CODeffluent/CODinfluent
Equation 4 : Calculation of total mass balance of the COD.
Except for the period corresponding to a greasy sludge ratio of 90%, the COD mass
balance obtained ranged from 89% to 122%. Thus, a maximum difference of 22% was
observed with the theoretical value of 350NLch4.kgCODdegraded-1. Considering measurement
uncertainty, these results confirm that the experimental reactor was equilibrated when the
calculations were made for each ratio. For a greasy sludge ratio of 90%, the mass balance of
the COD was significantly less than 100% (54%). This difference can be explained by
instabilities due to inhibition or problems involved in measuring COD.

Experimental results in terms of reactor yield and biogas production are presented in Table 2
Run 1A 2A 3A 4B 5B 6B 7B 8B 9B Configuration parameters
Greasy sludge ratio
%COD 0% 10% 17% 19% 28% 42% 60% 80% 90% %VS 0% 7% 13% 15% 22% 34% 52% 74% 87%
HRT days 24 30 24 25 26 25 24 24 25
OLR kgO2.m
-3reactor.d
-1 3.6 2.9 3.8 3.2 2.9 3.0 3.0 2.7 2.5 kgVS.m-3
reactor.d-1 1.9 1.8 2.0 1.7 1.6 1.4 1.2 1.0 0.8
Biogas production COD mass
balance % 107 97 118 122 89 102 105 95 54
Methane produced
NLch4.kgCODintroduced-1 136 138 174 172 162 185 215 171 53
NLch4.kgVSintroduced-1 264 180 333 324 292 398 546 454 158
NLch4.m-3
reactor.d-1 490 399 658 549± 43 464± 23 576± 18 669± 41 468± 35 135± 16
NLch4.m-3
reactor.d-1
(OLR=3kgO2.m-
3reactor.d
-1)* 408 413 520 516± 40 482± 24 576± 18 662± 41 518± 39 164± 19
Biogas produced
NLbiogas.kgCODintroduced-
1 207 166 252 258 242 275 312 252 85
NLbiogas.kgVSintroduced-1 400 274 480 486 437 591 793 669 262
NLbiogas.m-3
reactor.d-1 744 607 945 823± 63 694± 35 857± 36 972± 56 690± 48 214± 24
NLbiogas.m-3
reactor.d-1
(OLR= 3kgO2.m
-3reactor.d
-1)* 620 628 746 773± 59 721± 36 858± 36 964± 56 764± 53 261± 29
CH4 content % 66± 2 66± 21 69± 2 67± 1 67± 1 67± 2 69± 1 69± 1 63± 1 Material destruction
VS destruction
% 29 43 36 42 42 39 44 33 17
COD destruction
% 36 39 42 40 52 52 59 51 28
Protein destruction
% 40 - - 43 37 28 30 13 16
Stability parameters pH 7.3 7.3 7.3 7.4 7.3 7.2 7.2 7.2 6.9
LCFAs
mgac.-oleic.kg-1 <30 - - 31 147 nd. 182 579 253 mgac.-stearic.kg-1 <30 - - 75 244 246 590 1739 1562 mgac.-linoleic.kg-1 <30 - - <30 <30 <30 <30 <30 <30 mgac.-palmitic.kg-1 <30 - - 247 506 552 2150 4733 4152
mgac.-palmitoleic.kg-1 <30 - - <30 <30 <30 <30 <30 33 VFAs mgacetate.kg-1 <50 <50 <50 <50 <50 <50 69 589 331
Maximum VFA
accumulation during the loading phase
mgacetate.kg-1 <50 - - <50 105 <50 1201 599 640
C/N of the influent
gC.gN-1 6.0 - - 7.2 7.8 9.4 13.6 20.1 26.8
TAN in the effluent
gN.kg-1 1.4 - - 1.4 1.1 0.9 0.8 0.7 0.5
Table 2: Process parameters and results obtained for co-digestion of WAS with greasy sludge in CSTR.
*: Reactor yield was proportionally corrected to convert experimental yield into a
standardized yield considering an OLR of 3kgO2.m-3
reactor.d-1.
Even if some variations were observed due to slight variations in substrate properties
over time (contents and biodegradability), methane and biogas production increased up to a
greasy sludge ratio of 60%. In order to compare the results of all the experiments, a
normalised reactor yield for methane production was calculated based on the experimental
results and a fixed OLR (3kgO2.m-3.d-1). For this calculation, the reactor yield was considered
as proportional to the OLR in the range of variation observed in the CSTR reactor. Hence, the
normalised reactor yield increased from 408 to 662NLch4.m3reactor.day-1 with a greasy sludge
ratio which increased from 0% to 60%. The same results were observed for biogas production
associated with an increase in the methane content in the biogas from 66% to 69% at the same
greasy sludge ratios. The increase in methane production and in reactor yield was mainly due
to the increase in the overall biodegradability of the substrate mixture, as greasy sludge is
more biodegradable than WAS. These results can be linked with the increase in the
destruction of COD from 36% to 59% with an increase in the greasy sludge ratio from 0% to
60%. An increase in VS destruction was also observed, but due to variations in the ratio of
influent COD to VS, the trend was less clear. When the greasy sludge ratio increased from
60% to 80% and 90% based on COD, the trend was reversed and the normalized reactor yield
decreased from 662 to 518 and finally to 164NLch4.m3reactor.day-1 respectively. These results
can be linked with biogas production and COD or VS destruction measurements. In addition,
the increase in the greasy sludge ratio influenced the protein destruction rate, which decreased
slightly from a greasy sludge ratio of 42% of the feed COD (from 40% for a greasy sludge
ratio of 0% to 28% for a greasy sludge ratio of 42%, see Table 2). A greasy sludge ratio of
more than 60% of the feed COD, strongly reduced the protein degradation rate which can be
linked with the decrease in the VS destruction rate. This phenomenon was already observed
by Ponsà et al. (2011) during co-digestion of the organic fraction of municipal solid waste
with vegetable oil. Concerning the biogas characteristics, even when the methane content was
maintained at 69% with a greasy sludge ratio of 80%, it decreased to 63% with a greasy
sludge ratio of 90%.
These results are in agreement with those obtained by Luostarinen et al. (2009) during
co-digestion of sewage sludge (mixture of primary sludge and WAS) and grease trap sludge
from a meat processing plant. These authors report an optimal co-digestion reactor yield for a
grease-trap sludge ratio of 46% of the VS. With higher ratios, the reactor yield decreased. In
our study, based on VS, the optimal greasy sludge ratio was 52%. Reduction of VS in
Luostarinen et al. (2009) was higher than in our case due to the higher biodegradability of
primary sludge in comparison to WAS. Davidsson et al. (2008) investigated the feasibility of
co-digestion of grease trap sludge with sewage sludge and observed a decrease in CSTR yield
above a grease trap sludge ratio in the influent of 30% based on VS. The discrepancy between
these results and the results of the present study can be explained by the difference in the
reactor configuration (HRT =13 days) and the different characteristics of the sewage sludge
(50% of primary sludge + 50% of WAS) and of the fatty substrate. It raises the question of the
choice of an accurate indicator of the fatty substrate ratio in the influent. Ratios based on VS
or COD are commonly used. Nevertheless, in the present study, lipids represented only 50%
of the VS of greasy sludge (see Table 1). Hence, taking into account the lipid content of
greasy sludge and WAS, the optimal lipid ratio in the influent would be 31% based on VS.
This highlights the importance of combining experimental evaluations with complete
characterization of the substrates used to obtain consistent results.
3.3.2. Process stability
In addition to reactor yield, different parameters were monitored during each run to
provide information on process stability and on the origin of any inhibition. All these data are
presented in Table 2. During all experimental periods, the pH value remained relatively stable
even if a slight decrease (from 7.2 to 6.9) was observed with an increase in the greasy sludge
ratio from 80 to 90% in the feed COD. During the experiments, no accumulation of VFAs
was observed when the greasy sludge ratio did not exceed 60%. With greasy sludge ratios of
80 and 90%, a slight accumulation of acetate was observed (589 and 331 mgacetate.kg-1,
respectively). These accumulations revealed the instability of the process and an inhibition of
acetotrophic methanogenesis. However, the accumulations were not very high and did not
seriously affect pH as the substrates were buffered by ammonia and carbonate concentrations.
Working on a mixture of primary sludge, WAS and grease-trap sludge, Luostarinen et al.
(2009) observed total VFA accumulation of not more than 430mg.L-1 with a high ratio of
grease trap sludge in the influent mixture (71% of the feed VS).
On the contrary, monitoring of LCFA concentrations in the effluent revealed
significant accumulations. The main LCFAs that accumulated were palmitic, stearic and oleic
acids. The concentration of palmitic acid increased from 247mg.L-1 to 4733 with an increase
in greasy sludge ratio from 19 to 80% of the feed COD. The same phenomenon was observed
for stearic acid whose concentration in the effluent was 75mg.L-1 for a greasy sludge ratio of
19% and reached 1739 mg.L-1 for a greasy sludge ratio of 80%. Oleic acid accumulation was
lower and reached a maximum value of 426mg.L-1 for a greasy sludge ratio of 80%. Palmitic
acid has already been identified as the main accumulated LCFA in batch experiments using
fatty poultry slaughterhouse wastes (Salminen et al., 2000). On the other hand, Lalman and
Bagley (2000, 2001) reported that palmitic acid accumulated during the degradation of oleic
and linoleic acids. Beccari et al. (1998) observed that the conversion of stearic acid (C18:0)
into palmitic acid (C16:0) is very rapid. As VFA accumulation was not particularly high,
methanogenesis cannot be considered as the only stage to be impacted and at least
acidogenesis and acetogenesis were impacted too. So, by inducing an excess of lipids, too
much greasy sludge in the reactor feed leads to an overall decrease in degradation kinetics.
The observed accumulation of LCFAs at greasy sludge ratios of 80 and 90% was significantly
higher than IC50 values in the literature, i.e., between 30 and 1350mgLCFA.kg-1 depending on
the LCFA concerned, as well as on the origin of the biomass and its physical structure (Koster
and Kramer, 1987; Hwu et al., 1996; Alves et al., 2001). Our results are in agreement with
those in the literature where methanogenesis is not the only stage affected (Alves et al., 2001;
Lalman and Bagley 2002; Cirne et al., 2007). This phenomenon cannot be explained by a lack
of mineral nitrogen for biomass growth because the C/N ratio inferior to 30, as recommended
by Parkin and Owen (1986). Moreover, for greasy sludge ratios of more than 60% of the feed
COD, the presence of fatty materials is visible in the reactor effluent and biomass aggregates
tend to float. As a result, the inhibition effects observed in this study are probably due to mass
transfer limitation due to LCFA accumulation on and in the biomass aggregates as highlighted
by Pereira et al. (2005). The resulting encapsulation limited the exchange between the reactor
media (including substrate) and biomass, hence reducing the degradation kinetics.
3.5. CSTR versus batch experiments
A comparison of the effect of the greasy sludge ratio on the reactor yield obtained
from CSTR experiments and calculated from batch experiments without considering
inhibition is presented in Figure 4.

0
100
200
300
400
500
600
700
800
900
1000
0 20 40 60 80 100
Greasy sludge ratio (% of the total feed COD)
Rea
cto
r yi
eld
(Nlc
h4.
m-3
reac
tor.d
ay-1
)
Theorical results equal to 80% of the substrate BMPs
Experimental CSTR results : run 1
Experimental CSTR results : run 2
Figure 4: Effect of the greasy sludge ratio on the reactor yield: CSTR versus batch results.
Error bars represent standard deviation on the calculation period.
The reactor yield estimated from batch experiments was calculated as 80% of the
arithmetic sum of the BMP of each substrate. Considering the standard deviation of the
experimental CSTR results, batch experiments allowed accurate estimation of the reactor
yield as the greasy sludge ratio did not exceed 60% of the feed COD. Concerning inhibition,
in the batch experiments, a greasy sludge ratio of between 20 and 30% (depending on the
inoculum) was sufficient to induce an significant reduction in the degradation kinetics of the
mixture of greasy sludge and WAS. In the CSTR experiments, significant consequences of the
inhibition were observed with a greasy sludge ratio higher than 60%.
As a result, batch experiments can be considered as an accurate way to estimate the
methane production related to co-digestion, if the degradation phenomena are additive.
However, batch experiments do not allow determination of the maximum ratio of lipid rich
effluent to incorporate for anaerobic digestion of a mixture of substrates. Indeed, in this case,
negative substrate interactions observed in the batch experiments were over-estimated. This
phenomenon can be explained by the acclimation phenomenon as highlighted by Silvestre et

al. (2011). Acclimation can occur due to two main phenomena: (1) the growth of biomass able
to degrade LCFAs and (2) shifts in biomass populations which increase the number of
bacteria acclimated to higher LCFA concentrations in the reactor. Palatsi et al. (2010)
demonstrated the predominance of the first phenomenon. Moreover, as demonstrated
previously in this study and in the literature (Hwu et al., 1996; Alves et al., 2001; Lalman and
Bagley 2002), batch results in terms of inhibitions are strongly dependant on the origin of the
inoculum, its physical structure and the operational conditions of the experiment. Modelling
could be a useful way to extrapolate batch results in designing data for CSTR co digestion,
taking into account specific biomass growth and specific inhibitions.
4. Conclusion
CSTR experiments indicated that co-digestion of greasy sludge with WAS is optimal
with a greasy sludge ratio of 60% of the feed COD (lipids representing 31% of the feed VS).
With higher ratios, accumulations of LCFAs (palmitic, stearic and oleic acids) were observed.
In batch experiments, a reversible inhibition occurred with a greasy sludge ratio between 20
and 30% of the feed COD. Hence, batch experiments can predict methane production in a
CSTR when the degradation phenomenon are additive (without inhibition). But when
inhibitions occur, it is not possible to directly extrapolate batch observations to design data for
co-digestion in CSTR.
5. Acknowledgments
The authors thank Saur Research and Development for funding this study.
6. References
Alatriste-Mondragón, F., Samar, P., Cox, H.H.J., Ahring, B.K., Iranpour, R., 2006. Anaerobic codigestion of municipal, farm, and industrial organic wastes: A survey of recent literature. Water Environment Research. 78 (6), 607-636.
Alves, M.M., Vieira, J.A.M., Pereira, R.M.A., Pereira, M.A., Novais, J.M., Mota, M., 2001. Effects of lipids and oleic acid on biomass development in anaerobic fixed reactors. Part II: oleic acid toxicity and biodegradability. Water Research. 35, 264–270

Angelidaki, I., Ahring, B.K. 1992. Effects of free long-chain fatty acids on thermophilic anaerobic digestion. Applied Microbiololgy and Biotechnololgy. 37, 808–812.
APHA, 1998. Standard Methods for the Examination of Water and Wastewater, 20th ed. American Public Health Association, Washington DC, USA.
Appels, L., Baeyens, J., Degrève, J., Dewil, R. 2008. Principles and potential of the anaerobic digestion of waste-activated sludge. Progress in Energy and Combustion Science. 34 (6), 755-781
Beccari, M., Majone, M., Torrisi, L. 1998. Two-reactor system with partial phase separation for anaerobic treatment of olive oil mill effluents. Water Science Technology. 38, 53–60.
Broughton, M.J., Thiele, J.H., Birch, E.J., Cohen, A. 1998. Anaerobic batch digestion of sheep tallow. Water Research. 32, 1423–1428.
Carrère, H., Dumas, C., Battimelli, A., Batstone, D.J., Delgenès, J.P., Steyer, J.P., Ferrer, I. 2010. Pretreatment methods to improve sludge anaerobic degradability: A review. Journal of Hazardous Materials. 183 (1-3), 1-15
Chynoweth, D. 1993. Biochemical methane potential of biomass and waste feedstocks. Biomass And Bioenergy. 5 (1), 95-111
Cirne, D.G., Paloumet, X., Björnsson, L., Alves, M.M., Mattiasson, B. 2007. Anaerobic digestion of lipid-rich waste-Effects of lipid concentration. Renewable Energy. 32 (6), 965-975
Davidsson, Å., Lövstedt, C., la Cour Jansen, J., Gruvberger, C., Aspegren, H. 2008. Co-digestion of grease trap sludge and sewage sludge. Waste Management. 28 (6), 986-992
Hwu, C-S., Tseng, S.K., Yuan, C.Y., Kulik, Z., Lettinga, G. 1998. Biosorption of long-chain fatty acids in UASB treatment process. Water Research. 32, 1571–1579.
Kabouris, J.C., Tezel, U., Pavlostathis, S.G., Engelmann, M., Dulaney, J., Gillette, R.A., Todd, A.C. 2009. Methane recovery from the anaerobic codigestion of municipal sludge and FOG. Bioresource Technology. 100 (15), 3701-3705.
Knezevic, Z., Mavinic, D.S., Anderson, B.C. 1995. Pilot scale evaluation of anaerobic codigestion of primary and pretreated waste activated sludge. Water Environment Research. 67 (5), 835-841.
Koster, I.W., Cramer, A. 1987. Inhibition of methanogenesis from acetate in granular sludge by long-chain fatty acids. Applied Environmental Microbiology. 53, 403–409.
Lalman, J.A., Bagley, D.M. 2000. Anaerobic degradation and inhibitory effects of linoleic acid. Water Research. 34, 4220–4228.
Lalman, J.A., Bagley, D.M. 2001. Anaerobic degradation and methanogenic inhibitory effects of oleic and stearic acids. Water Research. 35, 2975–2983.
Luostarinen, S., Luste, S., Sillanpää, M. 2009. Increased biogas production at wastewater treatment plants through co-digestion of sewage sludge with grease trap sludge from a meat processing plant. Bioresource Technology. 100 (1), 79-85.
Mata-Alvarez, J., Mace, S., Llabrés, P., 2000. Anaerobic digestion of organic solid wastes. An overview of research achievements and perspectives. Bioresource Technology. 74, 3–16.
Palatsi, J., Illa, J., Prenafeta-Boldú, F.X., Laureni, M., Fernandez, B., Angelidaki, I., Flotats, X. 2010. Long-chain fatty acids inhibition and adaptation process in anaerobic thermophilic digestion: Batch tests, microbial community structure and mathematical modelling. Bioresource Technology. 101 (7), 2243-2251.
Parkin, G.F, Owen W.F. 1986. Fundamentals of Anaerobic Digestion of Wastewater Sludges. Journal of Environmental Engineering .12(5), 867-912.
Pereira, M.A., Pires, O.C., Mota, M., Alves, M.M. 2005. Anaerobic biodegradation of Oleic and Palmitic Acids: Evidence of Mass Transfer Limitations Caused by Long Chain Fatty Acid Accumulation onto the Anaerobic Sludge. Biotechnology and Bioengineering. 92(1), 15-23.
Ponsá, S., Gea, T., Sánchez, A. 2011. Anaerobic co-digestion of the organic fraction of municipal solid waste with several pure organic co-substrates. Biosystems Engineering. 108 (4), 352-360.
Rinzema, A., Boone, M., van Knippenberg, K., Lettinga, G. 1994. Bactericidal effect of long chain fatty acids in anaerobic digestion. Water Environment Research. 66, 40–49.
Salminen, E., Rintala, J., Lokshina, L.Ya., Vavilin, V.A., 2000. Anaerobic batch degradation of solid poultry slaughterhouse waste. Water Science and Technology. 41 (3), 33-41
Silvestre, G., Rodríguez-Abalde, A., Fernández, B., Flotats, X., Bonmatí, A. 2011. Biomass adaptation over anaerobic co-digestion of sewage sludge and trapped grease waste. Bioresource Technology. In Press