Ana medica 2007
79
Analytica Medica ISSN:0974-4142 Volume10 No.2 July-Dcember 2007 Journal of Scientific & Research Society BLDEA’s Shri B.M.Patil Medical College, Bijapur-586 103 (Karnataka) PDF Composer - unlicensed version Get a licence at www.pdf-composer.com
-
Upload
guruindia2012 -
Category
Documents
-
view
154 -
download
4
description
Transcript of Ana medica 2007

Analytica MedicaISSN:0974-4142
Volume10 No.2 July-Dcember 2007
Journal of Scientific & Research Society
BLDEA’sShri B.M.Patil Medical College,Bijapur-586 103 (Karnataka)
PDF Composer - unlicensed versionGet a licence at www.pdf-composer.com

ISSN:0974-4142Analytica MedicaVolume10 No.2 July-Dcember 2007
Analy
tica Me
dica
Editorial Board Editor Dr J G Ambekar Professor, Dept. of BiochemistryAssociate Editors Dr Aparna Palit - Asso. Prof. Skin & VD Dr Ravi Madraki - Asso. Prof. Nephrology Dr Surekha Arakeri - Prof. Pathology Dr Praveen Shahapur - Asso. Prof. MicrobiologyAdvisory Board Dr Satish S Jigjini - Director Dr R C Bidri - PrincipalMembers Dr Smt SB Thamagond Dr S P Choukimath HOD, Anasthesia HOD, Psychaitry Dr S D Desai Dr Anand Dharwadkar HOD, Anatomy HOD, Physiology Dr O B Pattanashetti Dr B B Devaranavadagi HOD, Orthopaedics HOD, Biochemistry Dr M M Angadi Dr A S Akki HOD, Comm. Med. HOD, Paediatrics Dr C S Kapse Dr M S Biradar HOD, Forensic Medicine HOD, Medicine Dr B R Yelikar Dr P L Kariholu HOD, Pathology HOD, Surgery Dr R S Wali Dr P B Jaju HOD, Pharmacology HOD, Obg & Gyne. Dr B V Peerapur Dr Arun Inamdar HOD, Microbiology HOD, Dermatology Dr Smt Vijaya Ganju Dr M H Patil HOD, Med. Edn. HOD, Opthalomology Dr N H Kulkarni HOD, Otorhenolyrangeology
Disclaimer:
Statementsandopinionsexpressedinthearticlespublishedinthejournalarethoseof authorsandnotnecessarilyoftheEditor.NeithertheEditornorthePublisherguarantees,warrantsorendorsesanyproductorserviceadvertisedinthejournal.
Publishedby:Scientific&ResearchSocietyBLDEA’sShriB.M.PatilMedicalCollege,Bijapur-586103,Karnataka,INDIAPrintedby:BLDEAOffsetPrinters,Bijapur
PDF Composer - unlicensed versionGet a licence at www.pdf-composer.com
Original ArticlesClinical Study of Bacterial Vaginosis in Reproductive Age Group Women.S. V. Reddy, B.V.Peerapur and Shilpa.V ..........................................................1Endoscopic Findings and Radiological Appearances in Paranasl Sinus Disease: A Comparative Study.Lathadevi.H.T, Kulkarni N.H, and Guggarigoudar.S.P. .......................................5Oxidative stress and Antioxidants in CRF before and after dialysis.Satishkumar D, M.V.Kodliwadmath, B. B. Deveranavadgi, Chandrakanth K H ................................................................................................13Renal Biopsies In Glomerular Diseases- A Two Years Study.Attar AH, Jadhav MN, Madraki RM and Yelikar BR ...........................................18Study of Dermatoglyphics in Patients with Type II Diabetes Mellitus Essential Hypertension in the Age Group between 35-55 Years.Sumathi S and Desai SD .......................................................................................22Cytological Evaluation Of Oral Mucosa In Habitual Pan Masala Eaters: A Comparative Study.Patil P. M., Yelikar B.R. and Jigjini S.S. ...............................................................29A study to assess catastrophic household expenditure on childhoodillness in urban slum of Bijapur.Shailaja Patil, Aditya S Berad and M M Angadi...................................................38Drug Purchasing Pattern in Rural Field Practice Area.Veena S. Algur, P.B.Jagirdar,.M.M.Angadi & Vijaya Sorganvi .............................42Refractive Errors in School Children Data from aSchool Screening Programme.Gaurav Arora and Nitin Batra ............................................................................46 Clinical profile of Attempted Suicide in Elderly compared to Adolescent group.Ambali AP and Bidri RC .....................................................................................51 cont.....
Analytica Medica July-December 2007 CONTENTS Volume 10, Number 2
PDF Composer - unlicensed versionGet a licence at www.pdf-composer.com

Mini ReveiwsFluoride A double edged swordB B Devaranavadgi, Satishkumar D & Chandrakanth K H................................57Case ReportsPrimary Transitional Cell Carcinoma of Ureter and Bladder -A Rare Case ReportTophakhane MR , Arakeri SU & Yelikar BR........................................................61Giant Pleomorphic Adenoma of Parotid Gland A Rare Case Report.Mahesh Kumar U., Meena N Jadhav and BR Yelikar........................................64SRS proceedings 2007-08 ..............................................................................68Instructions to Auther ....................................................................................70
PDF Composer - unlicensed versionGet a licence at www.pdf-composer.com

1
Original ArticleClinical Study of Bacterial Vaginosis in Reproductive
Age Group Women.S V Reddy, B V Peerapur and Shilpa V
Department of Obstetrics GynecologyShri B.M.Patil Medical College, Hospital & Research Centre, Bijapur.
AbstractIn this study, 100 women of the reproductive age group attending the OPD of
OBG department, BLDEA’s Medical College and Research Centre, during the period of October 2005 to May 2007 were considered for the varied clinical presentation of Bacterial Vaginosis.(BV). In our study, BV was found to have a prevalence of 35%.Majority of them (45.7%) were asymptomatic. Evidence of PID was seen in 31.4% of BV positive women.22.8%of BV positive women presented with pre term labour. BV has been identified as an important risk factor for the development of multiple obstetric and gynecological conditions which can be prevented by effectively treating BV.
Keywords: BV Bacterial vaginosis INTRODUCTION
Vaginal discharge is one of the most common and nagging problems faced by women from menarche to menopause. It may be either due to physiological or pathological causes. Pathological vaginal discharge occurs due to vaginal infection by bacterial, fungal or parasitic agents1,2. BV is a polymicrobial syndrome in which the normal vaginal lactobacilli, particularly those producing hydrogen peroxide, are replaced by a variety of anaerobic bacteria and mycoplasma. Common agents of BV include Gardenella Vaginalis, Mobilincus species, Bacteroides and Mycoplasma hominis3. There are 3 areas of potential health gains from intervention for BV ; treating the symptomatic cases, reducing the sequelae such as Infertility, PID, HIV transmission, CIN and reducing infant mortality and morbidity associated with pre term births4,5. But the wide range of symptoms displayed in cases of BV and the high proportion of asymptomatic infections makes it a difficult syndrome to diagnose. Thus, the true burden of BV has often been underestimated.
Objectives was to study the varied clinical presentation of Bacterial Vaginosis in reproductive age group women.MATERIALS AND METHODS
This study was conducted on 100 women in the reproductive age group, attending the OPD, of the department of Obstetrics & Gynecology, in BLDEA’s Shri B.M.Patil Medical College & Research Centre, Bijapur. A complete history of the patient was taken and relevant examination done.
PDF Composer - unlicensed versionGet a licence at www.pdf-composer.com
2
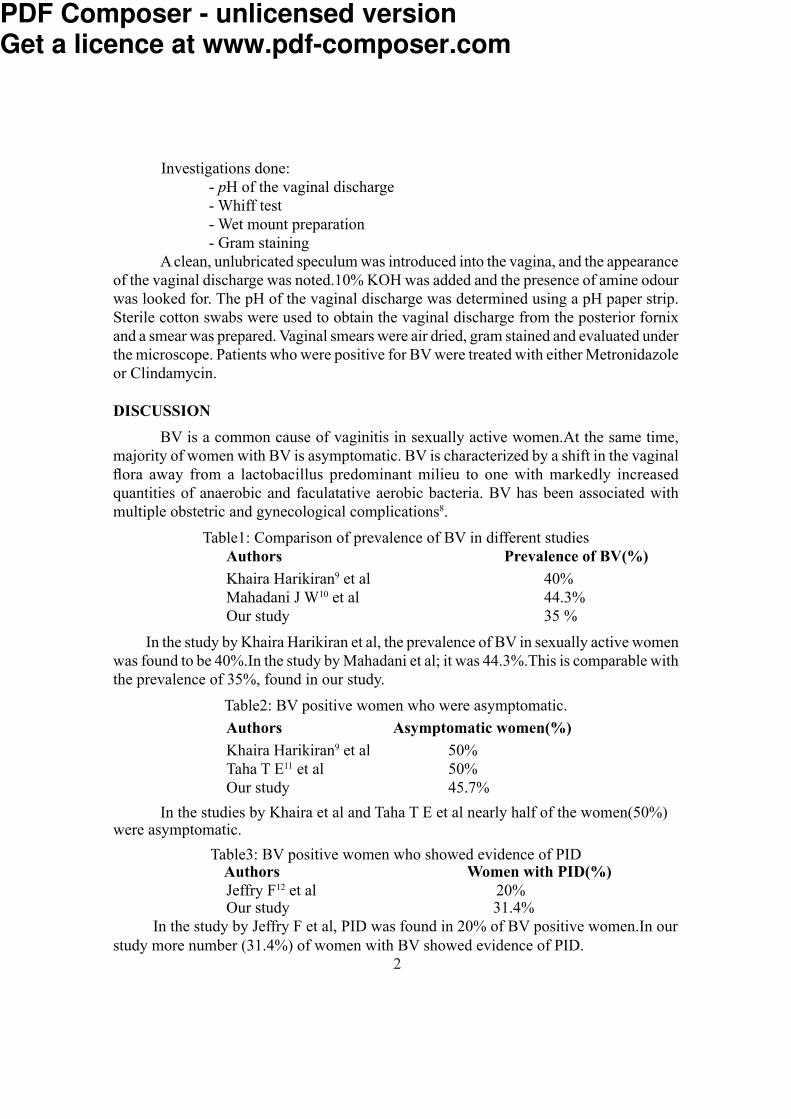
Investigations done: - pH of the vaginal discharge - Whiff test - Wet mount preparation - Gram staining
A clean, unlubricated speculum was introduced into the vagina, and the appearance of the vaginal discharge was noted.10% KOH was added and the presence of amine odour was looked for. The pH of the vaginal discharge was determined using a pH paper strip. Sterile cotton swabs were used to obtain the vaginal discharge from the posterior fornix and a smear was prepared. Vaginal smears were air dried, gram stained and evaluated under the microscope. Patients who were positive for BV were treated with either Metronidazole or Clindamycin.DISCUSSION
BV is a common cause of vaginitis in sexually active women.At the same time, majority of women with BV is asymptomatic. BV is characterized by a shift in the vaginal flora away from a lactobacillus predominant milieu to one with markedly increased quantities of anaerobic and faculatative aerobic bacteria. BV has been associated with multiple obstetric and gynecological complications8.
Table1: Comparison of prevalence of BV in different studiesAuthors Prevalence of BV(%)Khaira Harikiran9 et al 40%Mahadani J W10 et al 44.3%Our study 35 %
In the study by Khaira Harikiran et al, the prevalence of BV in sexually active women was found to be 40%.In the study by Mahadani et al; it was 44.3%.This is comparable with the prevalence of 35%, found in our study.
Table2: BV positive women who were asymptomatic.Authors Asymptomatic women(%)Khaira Harikiran9 et al 50%Taha T E11 et al 50%Our study 45.7%
In the studies by Khaira et al and Taha T E et al nearly half of the women(50%) were asymptomatic.Table3: BV positive women who showed evidence of PID Authors Women with PID(%)
Jeffry F12 et al 20%Our study 31.4% In the study by Jeffry F et al, PID was found in 20% of BV positive women.In our study more number (31.4%) of women with BV showed evidence of PID.
PDF Composer - unlicensed versionGet a licence at www.pdf-composer.com

3
Table4: Pre term labour in women with BV Authors Women with Pre term labour (%)
Phillip E Hay13 et al 24%Our study 22.8%
In the study by Phillip E Hay, 24% of women with BV had evidence of pre term labour. In our study, 22.8% of the women with BV had pre-term labour.
Table5: Infertility in women with BV Authors Women with Infertility (%)
Deborah C M14 et al NilOur study Nil
In our study, none of the women with BV had any history of Infertility, which is comparable to the study by Deborah et al. CONCLUSION
BV is a common condition of unknown etiology in which the complex balance of vaginal microflora experiences a profound alteration. This results in a clinical syndrome of malodourous vaginal discharge, elevated vaginal pH>4.5, and the presence of clue cells in wet smear light microscopy examination. Thus, BV can be reliably diagnosed by the clinical criteria described by Amsel et al. BV has been identified as an important risk factor for the development of multiple obstetrical and gynecological conditions, though a direct cause-effect relationship has not been clearly established. However, effective antibiotic treatment of BV can prevent its gynecological and obstetrical implications.SUMMARY
This study was done to know the varied clinical presentation of BV in reproductive age group women. It was carried out in the department of Obstetrics & Gynecology of BLDEA’s Shri B.M.Patil Medical College & Research Centre, Bijapur from October 2005 to May 2007. Among 100 women of the reproductive age group, who were included in the study, 35 were diagnosed as BV positive. Prevalence of BV was 35%. 16 (45.7%) women with BV were asymptomatic.11 (31.4%) women with BV had features suggestive of PID. 8(22.8%) women with BV had evidence of Pre term labour. Thus, women with BV should be treated effectively in order to avoid its complications.REFERENCES 1. David A Eschenbach. Bacterial Vaginosis: Emphasis on Upper Genital Tract
Complications. Obstet Gynecol Clin North Am 1989; 16: 593-609.2. Bacterial Vaginosis : A Public Health Review. Br J Obstet Gynacol 2001; 108:
439-450.
PDF Composer - unlicensed versionGet a licence at www.pdf-composer.com

4
3. Wilson J D , Lee R A , Balen A H et al. Bacterial Vaginal flora in relation to changing Estrogen levels . Int J STD AIDS 2007; 18(5): 308-11.
4. Joesoef M R , Karundeng A , Runtupalit et al. High rate of Bacterial Vaginosis among women with Intrauterine devices in Manado , Indonesia . Contraception 2001; 64 (3): 169-72.
5. Briselden A M , Monila B J , Stevens C E et al. Sialidase (Neuraminidases ) in BV and Bacterial Vaginosis associated microflora . J Clin Microbiol 1992; 30 (3) : 663-66.
6. Pavlova S I, Tao L. Induction of Vaginal Lactobacillus Phages by the Cigarette smoke chemical benzo(a)pyrene diol epoxide . Mutat Res 2000; 466 (1): 57-62.
7. Sharon L Hillier, Marijane A Krohn et al.The Relationship of Hydrogen Peroxide producing Lactobacilli to BV and Genital microflora in pregnant women. Obstet Gynacol 1992; 79: 369-73.
8. Koneman‘s Colour Atlas and Textbook of Diagnostic Microbiology Sixth Edition. 2006; 835-36.
9. Kaira Harikiran Kaur, Puri KJPS, Madan Anitha et al Prevaginosis of bactrial vaginosis in sexually active females. J. Obstet Gynacol 2003; 52:(2): 178-180.
10. Mahadani JW, Dekate RR, Shrikade AV et al. Cytodiagnosis of discharge per vaginum.Ind J Pathol Microbiol, 1998; 41:403-411.
11. Taho TE, Grey RH, Kumwend NI et al. HIV Infection and disturbunces of vagina flora during pregancy. J Aquire immune defic dyndr Hum Retrovirol. 1990; 20(1):52-59.
12. Jefry F, Peipert, Andrea et al. BV as rsik factor for upper genital tract infection. Am J Obstet Gynecol 1997;177:1184-87.
13. Philip E Hey. Ronald F, Ramont et al Abnormal Bacterial Collonisation of the Genital tract and Subsequent per term delivery and late miscarriage. Br. Med J 1994 ; 208: 295-98.
14. Deborah CM, Boyle, Paul E, Adinkara et al. Bacterial Vaginosis. John Studd’s Progress in obstetric and Gyneacology. 2003:15: 185-202.
PDF Composer - unlicensed versionGet a licence at www.pdf-composer.com

5
Original ArticleEndoscopic Findings and Radiological Appearances in
Paranasal Sinus Disease: A Comparative StudyLathadevi H T, Kulkarni N H, and Guggarigoudar S P
Department of OtorhinolaryngologyShri B.M.Patil Medical College, Hospital & Research Centre, Bijapur.
Abstract A prospective study of 50 patients having chronic sinusitis who did not respond to
medical line of treatment was done to compare diagnostic endoscopic findings, Computed Tomography(CT) scan of paranasal sinus (PNS) appearances and operative findings (fess).
The study was conducted in department of ENT, B.L.D.E.A’s Shri.B.M.Patil’s medical college and hospital, Bijapur, Karnataka. The results were analysed statistically for sensitivity and specificity of diagnostic endoscopy, CT scan and operative findings.
Results showed high association between diagnostic endoscopy and CT. (p<0.05).Correlation between CT and operative findings were found to be good.
Diagnostic endoscopy and CT correlated very well with operative findings. CT helped in finding the extent of disease. But false positives are more common. Hence both diagnostic endoscopy and CT scan should be done prior to any endoscopic sinus surgery.
Key words: ostiomeatal unit, paranasal sinuses, complicationsINTRODUCTION
Infection of paranasal sinuses is one of the commonest causes of patient’s visit to the otolaryngologist. Around one in five cases of outpatient department is concerned with sinus disease. Surgical clearance of these chronically infected sinuses is the treatment of choice. Over the past few decades, both CT and nasal endoscopy have been used successfully as diagnostic modalities in sinus disease. The principle of surgery is to overcome impaired mucociliary clearance and relieve any obstruction in drainage of sinuses.
Stammberger1 proposes that stenosis of osteomeatal complex from either the anatomical variation or hypertrophied mucosa can cause obstruction and stagnation of secretions which may then lead to infection.
To perform endoscopic sinus surgery, surgeon should have detailed knowledge of anatomy of lateral nasal wall, fissures and spaces that comprise ostiomeatal unit 2.
Technology has revolutionized sinus disease management in recent years by improved radiographic evaluation (CT scan) and methods of intranasal visualization [nasal telescopes].
Computed tomography of sinuses delineates the extent of disease, anatomical variation and landmarks. Surgeons individualize their surgical approach according to extent and location of disease seen on CT scan.
PDF Composer - unlicensed versionGet a licence at www.pdf-composer.com
6
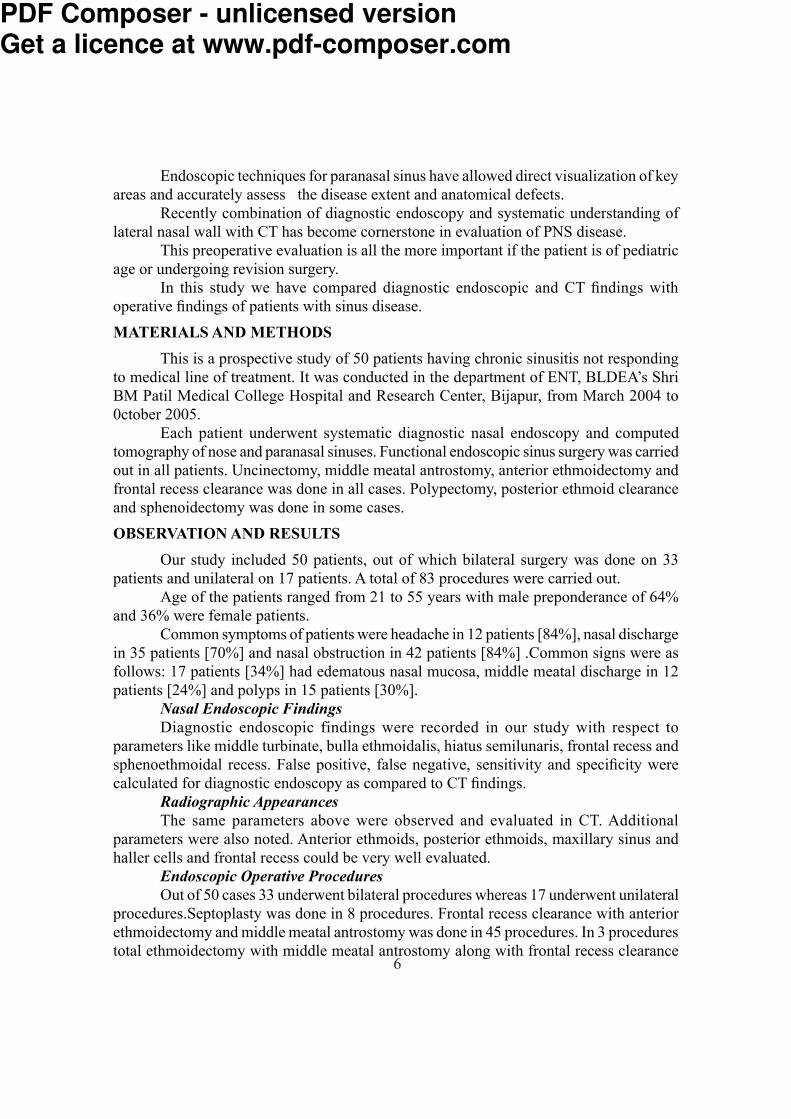
Endoscopic techniques for paranasal sinus have allowed direct visualization of key areas and accurately assess the disease extent and anatomical defects.
Recently combination of diagnostic endoscopy and systematic understanding of lateral nasal wall with CT has become cornerstone in evaluation of PNS disease.
This preoperative evaluation is all the more important if the patient is of pediatric age or undergoing revision surgery.
In this study we have compared diagnostic endoscopic and CT findings with operative findings of patients with sinus disease.MATERIALS AND METHODS
This is a prospective study of 50 patients having chronic sinusitis not responding to medical line of treatment. It was conducted in the department of ENT, BLDEA’s Shri BM Patil Medical College Hospital and Research Center, Bijapur, from March 2004 to 0ctober 2005.
Each patient underwent systematic diagnostic nasal endoscopy and computed tomography of nose and paranasal sinuses. Functional endoscopic sinus surgery was carried out in all patients. Uncinectomy, middle meatal antrostomy, anterior ethmoidectomy and frontal recess clearance was done in all cases. Polypectomy, posterior ethmoid clearance and sphenoidectomy was done in some cases.OBSERVATION AND RESULTS
Our study included 50 patients, out of which bilateral surgery was done on 33 patients and unilateral on 17 patients. A total of 83 procedures were carried out.
Age of the patients ranged from 21 to 55 years with male preponderance of 64% and 36% were female patients.
Common symptoms of patients were headache in 12 patients [84%], nasal discharge in 35 patients [70%] and nasal obstruction in 42 patients [84%] .Common signs were as follows: 17 patients [34%] had edematous nasal mucosa, middle meatal discharge in 12 patients [24%] and polyps in 15 patients [30%].
Nasal Endoscopic FindingsDiagnostic endoscopic findings were recorded in our study with respect to
parameters like middle turbinate, bulla ethmoidalis, hiatus semilunaris, frontal recess and sphenoethmoidal recess. False positive, false negative, sensitivity and specificity were calculated for diagnostic endoscopy as compared to CT findings.
Radiographic AppearancesThe same parameters above were observed and evaluated in CT. Additional
parameters were also noted. Anterior ethmoids, posterior ethmoids, maxillary sinus and haller cells and frontal recess could be very well evaluated.
Endoscopic Operative ProceduresOut of 50 cases 33 underwent bilateral procedures whereas 17 underwent unilateral
procedures.Septoplasty was done in 8 procedures. Frontal recess clearance with anterior ethmoidectomy and middle meatal antrostomy was done in 45 procedures. In 3 procedures total ethmoidectomy with middle meatal antrostomy along with frontal recess clearance
PDF Composer - unlicensed versionGet a licence at www.pdf-composer.com
7
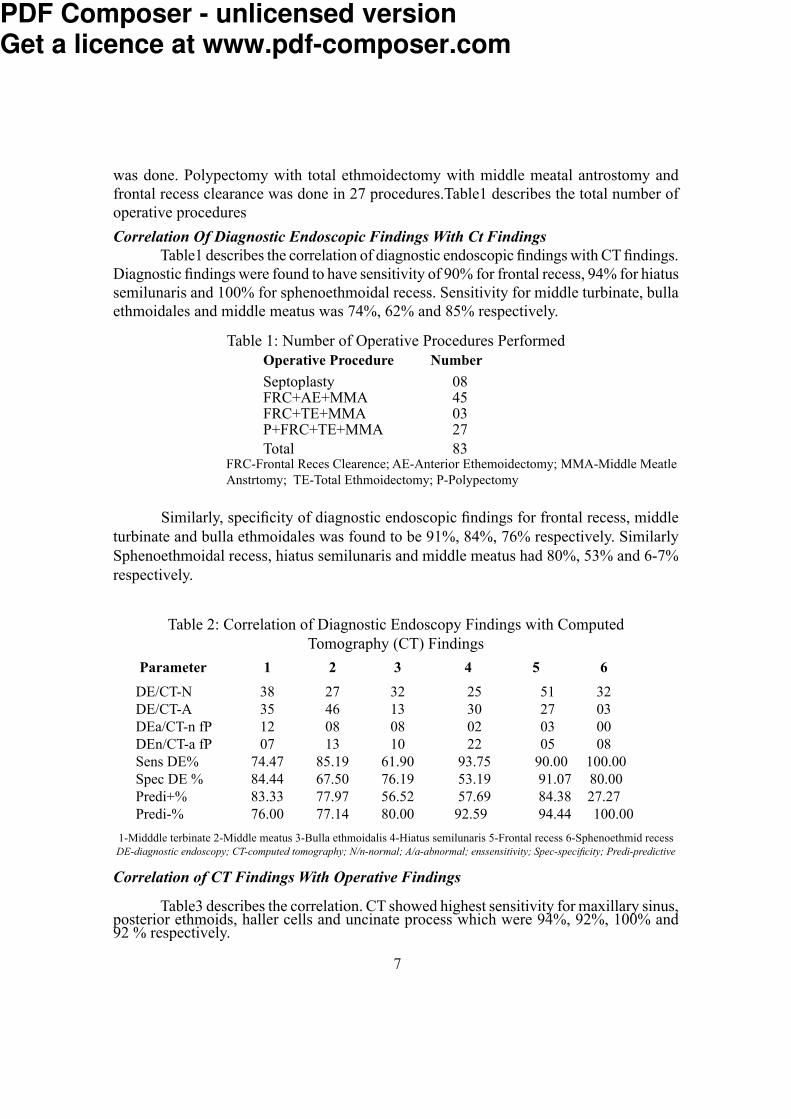
was done. Polypectomy with total ethmoidectomy with middle meatal antrostomy and frontal recess clearance was done in 27 procedures.Table1 describes the total number of operative procedures Correlation Of Diagnostic Endoscopic Findings With Ct Findings
Table1 describes the correlation of diagnostic endoscopic findings with CT findings.Diagnostic findings were found to have sensitivity of 90% for frontal recess, 94% for hiatus semilunaris and 100% for sphenoethmoidal recess. Sensitivity for middle turbinate, bulla ethmoidales and middle meatus was 74%, 62% and 85% respectively.
Table 1: Number of Operative Procedures PerformedOperative Procedure NumberSeptoplasty 08FRC+AE+MMA 45FRC+TE+MMA 03P+FRC+TE+MMA 27Total 83FRC-Frontal Reces Clearence; AE-Anterior Ethemoidectomy; MMA-Middle Meatle
Anstrtomy; TE-Total Ethmoidectomy; P-Polypectomy Similarly, specificity of diagnostic endoscopic findings for frontal recess, middle
turbinate and bulla ethmoidales was found to be 91%, 84%, 76% respectively. Similarly Sphenoethmoidal recess, hiatus semilunaris and middle meatus had 80%, 53% and 6-7% respectively.
Table 2: Correlation of Diagnostic Endoscopy Findings with Computed Tomography (CT) Findings
Parameter 1 2 3 4 5 6 DE/CT-N 38 27 32 25 51 32 DE/CT-A 35 46 13 30 27 03 DEa/CT-n fP 12 08 08 02 03 00 DEn/CT-a fP 07 13 10 22 05 08 Sens DE% 74.47 85.19 61.90 93.75 90.00 100.00 Spec DE % 84.44 67.50 76.19 53.19 91.07 80.00 Predi+% 83.33 77.97 56.52 57.69 84.38 27.27 Predi-% 76.00 77.14 80.00 92.59 94.44 100.00 1-Midddle terbinate 2-Middle meatus 3-Bulla ethmoidalis 4-Hiatus semilunaris 5-Frontal recess 6-Sphenoethmid recessDE-diagnostic endoscopy; CT-computed tomography; N/n-normal; A/a-abnormal; enssensitivity; Spec-specificity; Predi-predictiveCorrelation of CT Findings With Operative Findings
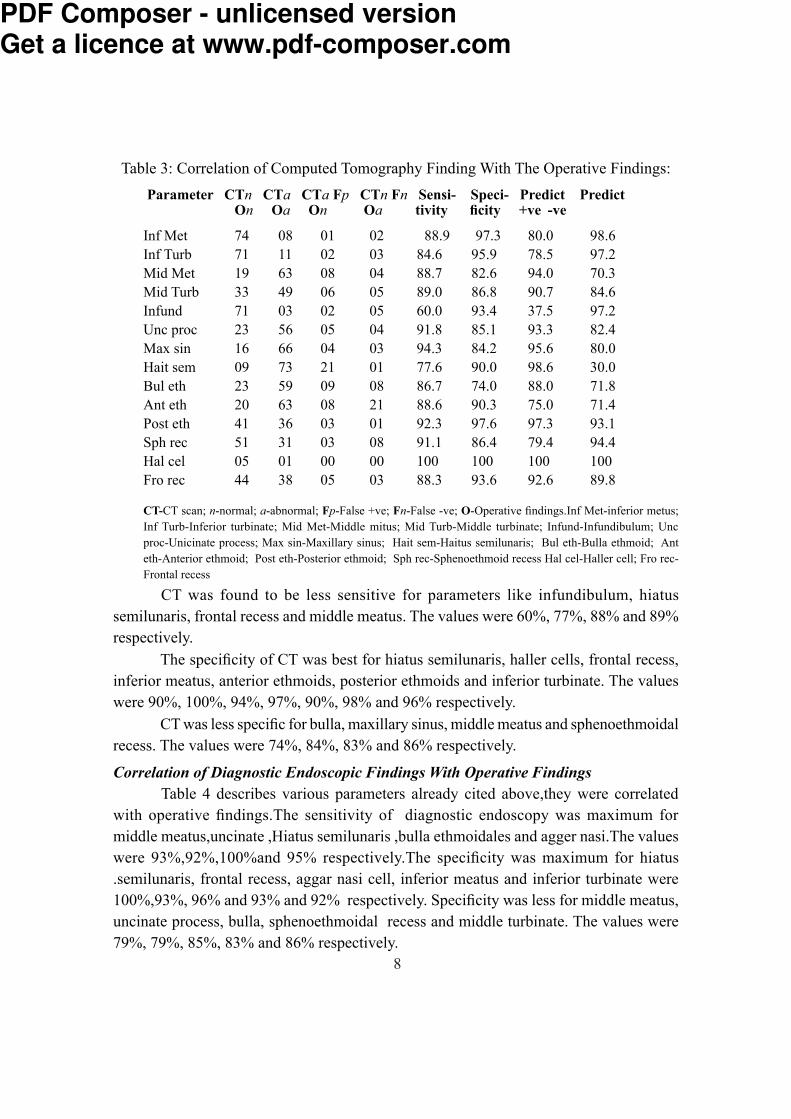
Table3 describes the correlation. CT showed highest sensitivity for maxillary sinus, posterior ethmoids, haller cells and uncinate process which were 94%, 92%, 100% and 92 % respectively.
PDF Composer - unlicensed versionGet a licence at www.pdf-composer.com
8
Table 3: Correlation of Computed Tomography Finding With The Operative Findings: Parameter CTn CTa CTa Fp CTn Fn Sensi- Speci- Predict Predict On Oa On Oa tivity ficity +ve -veInf Met 74 08 01 02 88.9 97.3 80.0 98.6Inf Turb 71 11 02 03 84.6 95.9 78.5 97.2Mid Met 19 63 08 04 88.7 82.6 94.0 70.3Mid Turb 33 49 06 05 89.0 86.8 90.7 84.6Infund 71 03 02 05 60.0 93.4 37.5 97.2Unc proc 23 56 05 04 91.8 85.1 93.3 82.4Max sin 16 66 04 03 94.3 84.2 95.6 80.0Hait sem 09 73 21 01 77.6 90.0 98.6 30.0Bul eth 23 59 09 08 86.7 74.0 88.0 71.8Ant eth 20 63 08 21 88.6 90.3 75.0 71.4Post eth 41 36 03 01 92.3 97.6 97.3 93.1Sph rec 51 31 03 08 91.1 86.4 79.4 94.4Hal cel 05 01 00 00 100 100 100 100Fro rec 44 38 05 03 88.3 93.6 92.6 89.8CT-CT scan; n-normal; a-abnormal; Fp-False +ve; Fn-False -ve; O-Operative findings.Inf Met-inferior metus; Inf Turb-Inferior turbinate; Mid Met-Middle mitus; Mid Turb-Middle turbinate; Infund-Infundibulum; Unc proc-Unicinate process; Max sin-Maxillary sinus; Hait sem-Haitus semilunaris; Bul eth-Bulla ethmoid; Ant eth-Anterior ethmoid; Post eth-Posterior ethmoid; Sph rec-Sphenoethmoid recess Hal cel-Haller cell; Fro rec-Frontal recess
CT was found to be less sensitive for parameters like infundibulum, hiatus semilunaris, frontal recess and middle meatus. The values were 60%, 77%, 88% and 89% respectively.
The specificity of CT was best for hiatus semilunaris, haller cells, frontal recess, inferior meatus, anterior ethmoids, posterior ethmoids and inferior turbinate. The values were 90%, 100%, 94%, 97%, 90%, 98% and 96% respectively.
CT was less specific for bulla, maxillary sinus, middle meatus and sphenoethmoidal recess. The values were 74%, 84%, 83% and 86% respectively.Correlation of Diagnostic Endoscopic Findings With Operative Findings
Table 4 describes various parameters already cited above,they were correlated with operative findings.The sensitivity of diagnostic endoscopy was maximum for middle meatus,uncinate ,Hiatus semilunaris ,bulla ethmoidales and agger nasi.The values were 93%,92%,100%and 95% respectively.The specificity was maximum for hiatus .semilunaris, frontal recess, aggar nasi cell, inferior meatus and inferior turbinate were 100%,93%, 96% and 93% and 92% respectively. Specificity was less for middle meatus, uncinate process, bulla, sphenoethmoidal recess and middle turbinate. The values were 79%, 79%, 85%, 83% and 86% respectively.
PDF Composer - unlicensed versionGet a licence at www.pdf-composer.com

9
Table 4: Correlation of Diagnostic Endoscopy Findings with the Operative findings.Parameter DEn DEa DEa Fp DEn Fn Sensi- Speci- Predict Predict On On On Oa tivity ficity +ve -veInf Met 74 08 01 05 88.9 93.7 61.5 98.6Inf Turb 71 11 02 06 84.6 92.2 64.7 97.2Mid Met 23 54 04 06 93.1 99.3 90.0 85.1Mid Turb 31 43 03 04 93.5 88.5 91.4 91.1Unc proc 23 48 04 06 92.3 79.3 88.9 85.2Hait sem 29 31 00 00 100 100 100 100Bul eth 24 21 02 04 91.3 85.7 84.0 92.3Sph rec 26 03 01 05 75.0 83.9 37.5 96.3Nas phar 31 43 03 05 93.4 86.1 89.5 91.2Fro rec 41 29 06 03 82.8 93.1 90.6 87.3Ag ns c 29 21 01 01 95.4 96.6 95.4 96.7DE-Diagnostic Endoscopy; n-normal; a-abnormal; Fp-False +ve; Fn-False -ve; O-Operative findings.Inf Met-inferior metus; Inf Turb-Inferior turbinate; Mid Met-Middle mitus; Mid Turb-Middle turbinate; Unc proc-Unicinate process; Hait sem-Haitus semilunaris; Bul eth-Bulla ethmoid; Sph rec-Sphenoethmoid recess; Nas phar-Naso pharynx; Fro rec-Frontal recess; Ag ns c-Aggar nasi cell.
Table 5: Correlation of Diagnostic Endoscopic,Computed Tomographic and Operative Findings.
Parameter Diagnostic Endoscopy Computed Tomography Operative findings n a Fp Fn n a Fp Fn n aInf Met 74 08 01 05 74 08 03 04 74 08 Inf Turb 71 11 02 06 71 11 04 08 71 11 Mid Met 23 54 04 06 19 63 08 04 28 54Mid Turb 31 43 03 04 33 49 06 05 33 49Infund 00 00 00 00 71 03 02 05 71 03Unc proc 23 48 05 06 23 56 06 07 23 56 Max sin 00 00 00 00 16 66 04 03 18 64Hait sem 29 31 00 00 09 73 21 01 29 53Bul eth 24 21 02 04 23 59 09 08 24 58Ant eth 00 00 00 00 20 00 08 21 00 00Post eth 00 00 00 00 41 36 03 01 43 34Sph rec 26 03 01 05 51 31 03 08 43 39Nas phar 31 43 03 05 33 45 05 04 00 00Hal cel 00 00 00 00 05 01 00 00 00 00Fro rec 41 29 06 03 44 38 05 03 41 41Ag ns c 29 21 01 01 29 33 00 00 29 33
n-normal; a-abnormal; Fp-False +ve; Fn-False -ve; O-Operative findings.Inf Met-inferior metus; Inf Turb-Inferior turbinate; Mid Met-Middle mitus; Mid Turb-Middle turbinate; Infund-Infundibulum; Unc proc-Unicinate process; Max sin-Maxillary sinus; Hait sem-Haitus semilunaris; Bul eth-Bulla ethmoid; Ant/Post eth- Anterior/Posterior ethmoid; Sph rec-Sphenoethmoid recess; Nas phar-Naso pharynx; Hal cel-Haller cell; Fro rec-Frontal recess; Ag ns c-Aggar nasi cell.
PDF Composer - unlicensed versionGet a licence at www.pdf-composer.com
10
Correlation of Diagnostic Endoscopic Findings, Computed Tomographic Findings And Operative FindingsTable5 describes the above related findings. In our study diagnostic nasal endoscopic findings and CT findings correlated well with operative findings.But CT findings were better correlated with operative findings in uncinate process, hiatus semilunaris, frontal recess, sphenoethmoidal recess and inferior meatus. There were some false positive and false negative findings particularly with CT findings.DISCUSSION
This was a comparative study conducted in 50 patients of chronic sinusitis undergoing 83 procedures of functional endoscopic sinus surgery. Clinical features of these patients showed nasal obstruction and headache as commonest symptoms (present in 42 patients, i.e. 84%).other major symptoms were post nasal discharge in 22 patients (44%). In the study conducted by Kirtane et al(1991)3,commonest complaints were nasal discharge in 25 patients(78.1%),headache in 22 patients(68.7%) and nasal obstruction in 22 patients(68.7%). The commonest sign was oedematous nasal mucosa in 17 patients (34%), sinus tenderness was seen in 18(36%) patients followed by purulent middle meatal discharge in 12(24%) and nasal polyps in 15(30%) patients. Hypertrophied middle turbinate was found in 8(20%) whereas non-purulent middle meatal discharge was seen in 15(30%) of patients.In the study by venkatachalam V P et al (march 2000)4, clinical findings were hypertrophied inferior turbinate(10%),hypertrophied middle turbinate (17.14%), congested mucosa (15.71%), sinus tenderness(7.14%)and ethmoidal polyps(12.8%). In our study these parameters are on higher side.Correlation Of Diagnostic Endoscopic Findings With CT Findings
When correlation of diagnostic findings with CT findings(table II) were observed, diagnostic endoscopy was to be found to be most sensitive investigation for hiatus semilunaris, sphenoethmoid recess and frontal recess with sensitivity of 94%,100% and 90% respectively.Specificity of these parameters were 53.19%,80% and 91.7%.The above said parameters are the key areas where all the major sinuses drain. It can be inferred that the diagnostic endoscopy can be definitely used as a very sensitive tool towards diagnosing the infections of sinuses.
Various parameters like middle meatus, frontal recess, bulla could not be visualized in some cases since endoscope could not be passed beyond certain point either due to gross pathology or anatomical abnormalities (deviated nasal septum,concha bullosa etc).CT scan definitely proved to be helpful in these cases.The diagnostic endoscopic findings correlated well with CT findings.
Correlation of CT Findings with Operative Findings (Table 3)CT is effective in demonstrating predisposing causes of chronic sinusitis (eg. anatomical variants) and provides precise guidance for therapeutic endoscopic
PDF Composer - unlicensed versionGet a licence at www.pdf-composer.com
11
instrumentation. CT with its excellent capability for displaying bone and soft tissues is the current diagnostic modality of choice for evaluating the ostiomeatal complex.Sensitivity was found to be good for almost all parameters i.e., maxillary sinus (94.3%), frontal recess (84%) and posterior ethmoids(92%).Similar observation was done by Kaluskar and Patil(19925). when they compared sinus disease radiologically (plain x-ray and coronal CT) .The specificity of the CT scan was found to be good for anterior ethmoid(90.38%) and sphenoid sinus (92.3%) than for maxillary sinus (84.2%).
Hence CT is also a very specific investigation for the disease in all the sinuses, except maxillary sinus and its ostium.Correlation of Diagnostic Endoscopic , Computed Tomographic and Operative Findings
Table 5 shows only the confirmed findings at operation of being either normal or abnormal and correlated with both diagnostic endoscopy and CT scan.As with Table 5, diagnostic endoscopy of cases in whom gross pathology and/ or anatomical abnormality was present, all the parameters could not be visualized.The association between diagnostic endoscopy and CT was calculated using the chi square test. Chi square= x2= 77.3 P value, P=1E- 11< 0.05 indicates that there is a high association between diagnostic endoscopy and CT.Advantages of diagnostic endoscopy are optical brilliance, clear field of vision, very economical, can be done under local anaesthesia, documentation and ability to visualize directly. But its limitations are difficulty in passing during gross septal deviation, extensive polyposis etcCT has highest advantages in analyzing deeper inaccessible structures like anterior and posterior ethmoids,ground lamella,sphenoid sinus etc. Relationship of lamina papyracea, course of anterior ethmoidal artery and skull base are better evaluated.Hence, CT scan serves as a road map for the surgeon as he negotiates into potentially hazardous clefts of PNS unit. It is noninvasive, rapid and convenient investigation. But its disadvantages are radiation to cornea and lens, inability to differentiate between fibrous tissue (post-op) and inflammatory mucosal disease. (Specificity of CT is lower than sensitivity of CT).It is an expensive investigation.
CONCLUSIONBoth diagnostic nasal endoscopy and computed tomography of para nasal sinus are important preoperative evaluation tools in detecting pathology .They are complementary to each other.
Diagnostic endoscopy correlated very well with operative findings (better than CT) but could not visualize all parameters because of gross anatomical variations or pathologies. Extent of disease in sinuses is well recognized in CT although false positives are more common as compared to diagnostic endoscopy.
PDF Composer - unlicensed versionGet a licence at www.pdf-composer.com
12
REFERENCES1. Stammberger.H.An endoscopic study of tubal function and diseased ethmoid sinus. Arch Otolaryngol, 1986; 243:254-2592. Housefield.WE .Anatomy of paranasal sinuses. Otolaryngol Clin North Am 1996;29:57-733. Kirtane.M.V.et al Functional endoscopic sinus surgery(A preliminary study). Indian j Otolaryngol 1991; 43:126-1294. Venkatachalam.V P, Bhat. A Functional Endoscopic sinus surgery-A new surgical concept in management of sinusitis. Indian j Otolaryngol Head Neck Surg 2000;52:3-165. Kaluskar.S.K, Patil N.P . Value of CT in the evaluation of chronic sinus disease. I ndian j Otolaryngol Head Neck Surg 1992; 4:188-192.
PDF Composer - unlicensed versionGet a licence at www.pdf-composer.com

13
Original ArticleOxidative stress and Antioxidants in CRF before and after dialysis
Satishkumar D, M V Kodliwadmath, B B Deveranavadgi and Chandrakanth K HDepartment of Biochemistry
Shri B M Patil Medical College, Hospital and Research Centre,BijapurAbstract
CRF is debilitating condition responsible for high mortality& morbidity. Tissue injury due to free radicals is commonly seen in variety of disease processes. Aim of present study was to investigate the possible free radical mediated tissue damage in CRF and dialysis, by measuring MDA which is marker of oxidative stress. Antioxidants like Vit A, Vit E, and Vit C, which prevent oxidative damage were also measured. The study includes 30 healthy person as controls, 30 patients of chronic renal failure (CRF) before dialysis and after dialysis. All parameters were assessed by chemical methods.
MDA levels were significantly increased in pre dialysis compared to controls (P< 0.001) and levels further increased in post dialysis compared to pre dialysis (P <0.001). Levels of antioxidants like Vit A, Vit E, Vit C were significantly decreased in pre dialysis compared to controls (P=<0.001),and values further significantly decreased in post dialysis compared to pre dialysis(P<0.001).
Study indicates oxidative stress in pts with CRF which further exacerbated by Hemo dialysis, as evidenced by increased lipid peroxidation and low antioxidant levels. Key words: chronic renal failure, dialysis, melondialdihyde, antioxidants.INTRODUCTION
Chronic renal failure is a debilitating condition responsible for high morbidity and mortality and is a financial burden on government and society. Reliable data on the true incidence and prevalence of end stage renal disease (ESRD) in India are lacking because no national registries exist. A high incidence of ESRD has also been noted in Asians of Indian origin in the United Kingdom. If the incidence of ESRD is indeed 100 pts/ million population/ year, this would mean » 100,000 new patients every year for a population of 1 billion in India.1 The sources of FR are activated macrophages, vascular cells, and various glomerular cells including fibroblasts and renal interstitial cells. Different cellular enzymes including mitochondrial oxidases, lipooxygenases, carbon monoxide, myeloperoxidase, NADPH oxidase, xanthine oxidase and nitric oxide synthase have been identified as cellular sources of ROS formation.2
Generation of OFR is increased in many pathological conditions. The cellular constituents and biomolecules are potentially subject to free radical attack. Polyunsaturated fatty acid (PUFA) present in cell membrane are readily attacked by oxygen free radicals. The oxidative destruction of polyunsaturated fatty acids is known as lipid peroxidation. It is very destructive chain-reaction that can damage other cell components by production
PDF Composer - unlicensed versionGet a licence at www.pdf-composer.com
14
of reactive aldehyde.3 Lipid peroxidation has been implicated in a wide range of tissue injuries and diseases.4 a) Proteins are subject to free radical mediated destruction which may lead to structural loss or enzymatic deactivation. b) Nucleic acid are prone to base hydroxylation, cross linking or stand scission, which may result in mutation or even cell death.5 a) Extracellular tissue components including hyaluronic acid and collagen are vulnerable to injury by toxic free radical (FR) resulting in damage to the architectural integrity of tissues.6 The present study was planned to investigate the possible FR mediated injury in CRF patients undergoing hemodialysis by measuring the oxidative stress. Oxidative stress is assessed by measuring malondialdehyde (MDA) a marker and product of lipid peroxidation. The study also includes assessment of non-enzymatic antioxidants vitamin A, vitamin E, vitamin C in CRF patients (before and after) dialysis, which prevents oxidative damage and scavange or neutralizes free radicals as they are produced in disease processes. MATERIALS AND METHODS Sample Size: The sample includes 60 subjects.Normal healthy controls 30. Chronic renal failure patients (before & after dialysis) 30. Exclusion Criteria:
Reversible renal involvement, advanced form of major extra renal complications, cerebro vascular accidents, coronary artery disease, neoplasia and active infection elsewhere in the body Sample Collection: 10 ml of blood was drawn by vene puncture from controls and CRF patients attending for dialysis (before and immediately after dialysis) and was collected in heparinized tube (5 units/ml of blood) under aseptic precautionary measures. The study involved the analysis of various parameters from whole blood & plasma are as follows;I. Whole blood: Malondialdehyde Thiobarbituric acid method 7II. Plasma: Non-enzymatic antioxidants a) Vitamin E (α-tocopherol): Quaife et al. method8
b) Vitamin A (Retinol): Bessay et al method 9c) Vitamin C (Ascorbic acid): Colorimetric method by Evelyn & Malloy 10Statistical analysis of all the obtained parameters in patients with chronic renal failure (before and after dialysis) and control groups were done using paired and unpaired student’s ‘t’ test.
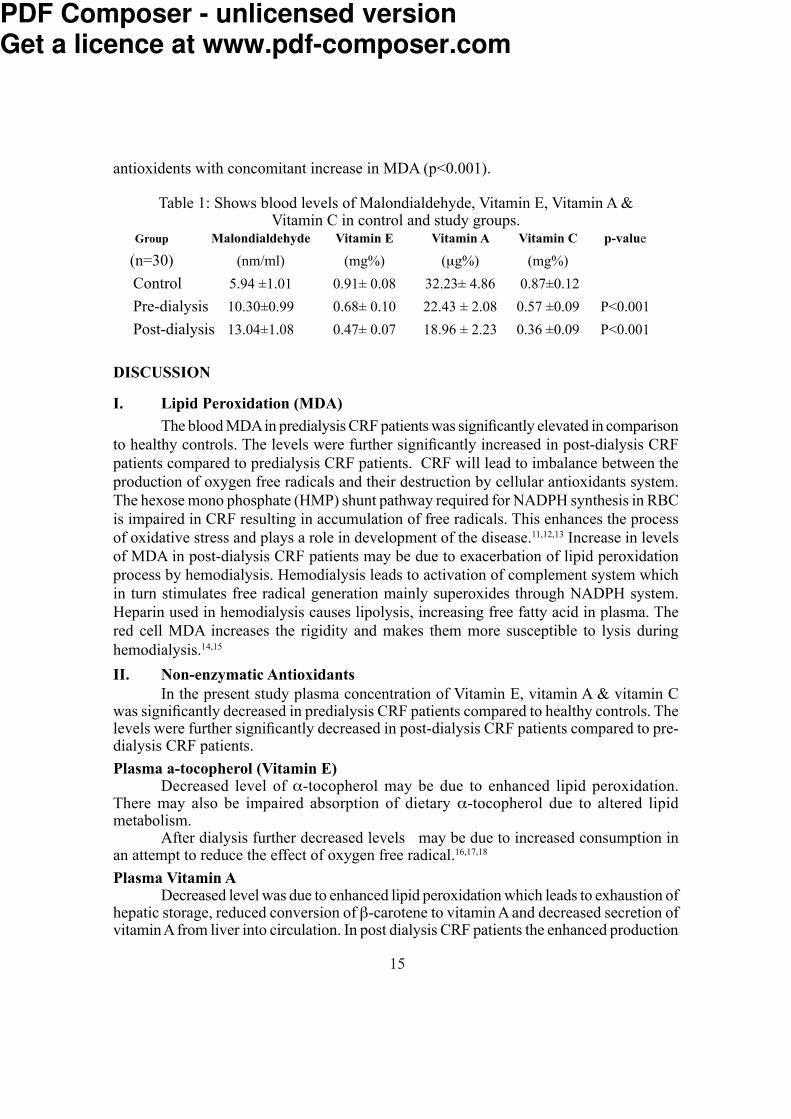
RESULTS Table 1 shows levels of Malondialdehyde, Vitamin E, Vitamin A & Vitamin C in control and study groups. CRF group showed increase in MDA & decrease in antioxident levels compared with control (Tab. 1). In post-dialysis group, we observed, decrease in
PDF Composer - unlicensed versionGet a licence at www.pdf-composer.com
15
antioxidents with concomitant increase in MDA (p<0.001).Table 1: Shows blood levels of Malondialdehyde, Vitamin E, Vitamin A & Vitamin C in control and study groups. Group Malondialdehyde Vitamin E Vitamin A Vitamin C p-value
(n=30) (nm/ml) (mg%) (μg%) (mg%) Control 5.94 ±1.01 0.91± 0.08 32.23± 4.86 0.87±0.12 Pre-dialysis 10.30±0.99 0.68± 0.10 22.43 ± 2.08 0.57 ±0.09 P<0.001 Post-dialysis 13.04±1.08 0.47± 0.07 18.96 ± 2.23 0.36 ±0.09 P<0.001
DISCUSSIONI. Lipid Peroxidation (MDA)
The blood MDA in predialysis CRF patients was significantly elevated in comparison to healthy controls. The levels were further significantly increased in post-dialysis CRF patients compared to predialysis CRF patients. CRF will lead to imbalance between the production of oxygen free radicals and their destruction by cellular antioxidants system. The hexose mono phosphate (HMP) shunt pathway required for NADPH synthesis in RBC is impaired in CRF resulting in accumulation of free radicals. This enhances the process of oxidative stress and plays a role in development of the disease.11,12,13 Increase in levels of MDA in post-dialysis CRF patients may be due to exacerbation of lipid peroxidation process by hemodialysis. Hemodialysis leads to activation of complement system which in turn stimulates free radical generation mainly superoxides through NADPH system. Heparin used in hemodialysis causes lipolysis, increasing free fatty acid in plasma. The red cell MDA increases the rigidity and makes them more susceptible to lysis during hemodialysis.14,15
II. Non-enzymatic Antioxidants In the present study plasma concentration of Vitamin E, vitamin A & vitamin C was significantly decreased in predialysis CRF patients compared to healthy controls. The levels were further significantly decreased in post-dialysis CRF patients compared to pre-dialysis CRF patients.
Plasma a-tocopherol (Vitamin E) Decreased level of α-tocopherol may be due to enhanced lipid peroxidation. There may also be impaired absorption of dietary α-tocopherol due to altered lipid metabolism. After dialysis further decreased levels may be due to increased consumption in an attempt to reduce the effect of oxygen free radical.16,17,18
Plasma Vitamin A Decreased level was due to enhanced lipid peroxidation which leads to exhaustion of hepatic storage, reduced conversion of β-carotene to vitamin A and decreased secretion of vitamin A from liver into circulation. In post dialysis CRF patients the enhanced production
PDF Composer - unlicensed versionGet a licence at www.pdf-composer.com

16
of oxygen free radical leads to increased utilization of vitamin A and its microsomal degradation resulting in reduced levels.14
Plasma Vitamin C Decrease level may be due to utilization of ascorbic acid to generate α-tocopherol from α-tocopheroxyl radical at water lipid interface. The ascorbate may be reduced because it is an efficient quencher of superoxide peroxyl and hydroxyl radicals. In addition to above there may be associated nutritional deficiency of ascorbate to limit potassium intake in CRF patients. During hemodialysis there may be additional loss of ascorbic acid from plasma as it is water soluble vitamin.14,16,17 CONCLUSION
The result of the present study indicates oxidative stress in patients with CRF which is further exacerbated by hemodialysis, as evidenced by increased lipid peroxidation and low antioxidant levels. Malondialdehyde (MDA) a reliable marker and product of lipid peroxidation was increased in CRF and dialysis patients indicates the existence of oxidative stress. The decreased levels of non-enzymatic antioxidants i.e., Vitamin E, Vitamin A and Vitamin C indicate the increase in oxidative stress. Inflammatory process during dialysis appears to be the main factor involved in oxidative stress. Exogenous supplementation of non-enzymatic antioxidants may decrease the damage to renal tissue by quenching and preventing the free radical action, which are responsible for the disease process. REFERENCES1. Sakhuja V, Kohli SH. End-stage renal disease in India and Pakistan: Incidence, cause and management. Ethnicity and Disease 2006; 16:S2-20.2. Galle Jan. Oxidative stress in chronic renal failure. Nephrol Dial Transplant, 2001; 6:2135-37.3. Porter NA. Autoxidation of polyunsaturated fatty acids: Initiation, propogation and product distribution. In Membrane lipid peroxidation. Vigo-Pelfrey C, Boca Raton :CRC. 1990. 4. Esterbauer H, Cheeseman KH. Lipid peroxidation : Pathological implication. Chem Phys Lipids, 1987; 45:103-370. 5. Imlay JA, Linn S. DNA damage and oxygen radical toxicity. Science, 1988; 240:1302. 6. Green RA, Moy WW. Effect of oxygen derived free radicals on hyaluronic acid. Arthritis Rheum, 1980; 23:455-463 7. Placer ZA, Linda L, Crushman JBC. Estimation of product of lipid peroxidation (MDA) in biochemical system. Annal Biochem, 1966; 16:359-64. 8. Quaife ML, Scrimshaw NS, Lowry OH. A micromethod for assay of total tocopherols in blood serum. J Biol Chem, 1949; 80:1229-1235. 9. Bessey OA, Lowry OH, Brock MJ and Lopez JA. The determination of vitamin A
carotene in small quantities of blood serum. J Biol Chem, 1946; 186:177-189.
PDF Composer - unlicensed versionGet a licence at www.pdf-composer.com
17
10. Evelyn KA, Malloy HT, Rosen C. The determination of ascorbic acid in urine with the photoelectric colorimeter. J Biol Chem, 1938; 126:645-654. 11. I Durak, M Kacmaz, S Elgun HS Ozturk. Oxidative stress in patients with chronic renal failure: effect of hemodialysis. Med Princ Pract 2004 Mar-April; 13(12):84-87. 12. Y Yawata, H. Jacob. Abnormal red cell metabolism in patients with chronic uremia:nature of the defect and its persistence despite adequate hemodialysis. Blood, 1975;45:231-239.13. M Daschner, H Lenhartz, D Botticher, F Schaefer, M Wollschlager, O Mehls, et al. Influence of dialysis on plasma lipid peroxidation products and antioxidant levels. Kidney Int, 1996; 50:1268-1272. 14. Galli F, Ronco C. Oxidant stress in hemodialysis. Nephron, 2000; 84:1-5. 15. M Ozden, H Maral, D Akaydin, P Cetinalp, B Kalender. Erythrocyte glutathione peroxidase activity, plasma melondialdehyde and erythrocyte glutathione levels in hemodialysis and CAPD patients. Clin Biochem, 2002 Jun; 35(4):269-73 . 16. M Taccone Gallucci, R Lubrano, C Meloni. Vitamin E as antioxidant agent; in Ranco C, La Greca G; Vit E bonded membrane. A further step in dialysis optimization. Contrib. Nephrol (Basel, Karger), 1999; 127:32-43. 17. AT Diplock, JL Chaleux, G Crozier-Welli, FS Kok, C Rice-evans, and M Roberfroid et al. Functional food sciences and defense against reactive oxygen species. Br J Nutr, 1998; 80:s77-s112. 18. P Jackson, CM Laughrey, JH Lightbody, PT McNamee, IS Young. Effect of hemodialysis on total antioxidant capacity and serum antioxidants in patients with chronic renal failure. Clin Chem, 1995; 41:1135-1138s
PDF Composer - unlicensed versionGet a licence at www.pdf-composer.com

18
Original ArticleRenal Biopsies In Glomerular Diseases- A Two Years Study
Attar AH, Jadhav MN, Madraki RM and Yelikar BRDepartment of Pathology & Medicine,
Shri B.M. Patil Medical College, Hospital & Research Centre, Bijapur.Abstract To study the spectrum of glomerular diseases which require renal biopsy A total of 40 renal biopsies received in the department of pathology in our institute were studied over a period of 2 years which was performed by 18 gauze bard’s ‘ bioptic gun’ under real time ultra sound guidance and a renal tissue ranging from 2 -3cm was obtained. Sections were studied with H&E, special stains like PAS, Silver and Congo-red. Immunofluorescence was done wherever necessary. The study showed 10 case(25%) of FSGS, 9 cases(22.5%) of mesangioproliferative GN, 5 cases(12.5%) of membranoproliferative GN, 4 cases(10%) of amyloidosis of kidney, 3cases(7.5%) of membranous nephropathy, 3 cases(7.5%) of proliferative GN, 2 cases(5%) of IgA nephropathy, 2 cases(5%) of crescentic GN and 2 cases(5%) of lupus nephritis. Renal biopsy is the corner stone for diagnosing the glomerular diseases with fewer complications. FSGS and Mesangioproliferative GN were the commonest glomerular diseases and amyloidosis of kidney is not an uncommon entity in our study.Keywords: Renal biopsy, glomerular diseases.INTRODUCTION
The incidence of glomerular diseases is 78%. Renal biopsy is the corner stone for diagnosing the glomerular diseases, providing not only precise diagnosis, but also helps in treatment and assessing the prognosis. Percutaneous gun biopsies has got higher diagnostic yield with fewer complications. The diseases like MCD, Mesangio-PGN, FSGS, MPGN, MN and Amyloidosis of kidney can be diagnosed by Light microscopy with more reproducibility. The present work was undertaken to study the spectrum of glomerular diseases which require renal biopsy.MATERIALS & METHODS
40 renal biopsies which were received in the department of pathology, Shri. B.M. Patil Medical College, Hospital & Research Centre, Bijapur over a period of 2 years (1st Aug 2005-1st Aug 2007). Percutaneous renal biopsies of glomerular diseases were included and non glomerular, neoplastic diseases were excluded. Adequate tissue was obtained in 97.5% patients, which was performed by 18 Gauze ‘Bard’s bioptic gun’. Sections were stained with H&E, Special stains and Immunofluorescence was done wherever necessary.RESULTS Incidence of primary and secondary glomerular diseases in our study,
PDF Composer - unlicensed versionGet a licence at www.pdf-composer.com

19
Table1: Showing Incidence of primary and secondary glomerular diseases in our studySl. No. Primary glomerular No. of Incidence
diseases cases % 1 FSGS 10 25.0 2 Mesangio-PGN 09 22.5 3 MPGN 05 12.5 4 MN 03 7.5 5 Proliferative GN 03 7.5 6 IgA Nephropaty 02 5.0 7 Crescentic GN 02 5.0 8 Amyloydosis of Kidney 04 10.0 9 Lupus Nephritis 02 5.0
Fig-1: Photomicrograph of glomerulus showing sclerosis -FSGS (H&E, 400X).
Fig-2: Photomicrograph of glomerulus showing lobular accenttuations- MPGN (H&E, 100X)
Fig 3.Immunofluorescence of MPGN showing subendothelial deposits of IgG & C3
Fig 4.Photomicrograph of glomerulus showing thickened capillary lumens -MN (PAS, 400X)
PDF Composer - unlicensed versionGet a licence at www.pdf-composer.com

20
DISCUSSIONNephrotic syndrome is the commonest presentation in primary glomerular diseases. Incidence of FSGS is increasing over past two decades and the commonest cause of nephrotic syndrome in adults is FSGS. Age/Sex distribution & percentage of BPRD in Adults: Among 40 Adults, a) 25% of cases were of FSGS (10 35 years). b) Mesangio-PGN in 22.5% of cases. c) Minimal change disease is common below the age of 10 years followed by FSGS. d) Males>female in all BPRD except for Lupus nephritis & Cortical necrosis. Incidence of FSGS in various studies: Winn PM & Daskalakis study revealed 35%. Abrantes M M et al study revealed 32%. And the present study revealed 25% cases of FSGS. Overall incidence of renal amyloidosis is 3% and the nephrotic syndrome is the commonest presentation in patients with renal amyloidosis and the chronic inflammatory
Fig -5:Photomicrograph of glomer ulus showing diffuse mesangial proliferation-
LN IV (H&E, 400X)Fig -6: .Immunofluorescence of LN
IV showing diffuse granular deposits of IgG
Fig-7: Photomicrograph of glomerulus acellular Eosinophilic deposits-
Amyloidosis(H&E,400X) Fig -8: Photomicrograph of glomeru
lus showing pink-red deposits-Amyloidosis (Congo-red, 100X)
PDF Composer - unlicensed versionGet a licence at www.pdf-composer.com

21
conditions were commonest cause for renal amyloidosis.
CONCLUSIONSRenal biopsy is the corner stone for diagnosing the glomerular diseases with fewer complications.Nephrotic syndrome is the commonest presentation for both primary and secondary glomerular diseases.FSGS is the commonest disease seen in primary glomerular diseases (25%) followed by Mesangio-PGN ( 22.5%).Renal amyloidosis is not an uncommon causefor nephrotic syndrome(10%).
ACKNOWLEDGEMENT: Dr. Karnik’s laboratory, Pune for Immunofluorescence study.REFERENCES
1. Balakrishnan N, John GT, Korula A, Visalakshi J, Talaulikar GS, Thomas PP et al. Spectrum of biopsy proven renal disease and changing trends at a tropical tertiary
PDF Composer - unlicensed versionGet a licence at www.pdf-composer.com

22
Original ArticleStudy of Dermatoglyphics in Patients with Type II Diabetes Mellitus
Essential Hypertension in the Age Group between 35-55 YearsSumathi S and Desai SDDepatrment of Anatyomy
Shri B.M. Patil Medical College, Hospital and Research Centre, Bijapur
Abstract Dermatoglyphics is the study of fingertips and palm region. It has been well established as a diagnostic aid in a number of diseases having hereditary basis. Finger print (dactylography/dermatoglyphic) is considered as the best tool of identification. Diabetes mellitus with hypertension is the most important cause of morality and morbidity in the world. The etiology of diabetes with hypertension which is believed to be as a consequence of genetic and environmental factors. Because nothing much can be done parentally, researches have resorted to studying physical variables like dermatoglyphics. Dermatoglyphic patterns form on the finger pad and the palm parentally and remain unchanged throughout life; these features may serve as markers for fetal origin of adult disease like diabetes and hypertension. No studies have been reported on palmar dermatogyphics in diabetes mellitus type II with hypertension. Palmar dermatoglyphic features derived from qualitative and quantitative parameters in dermatoglyphics of diabetes mellitus type II with hypertension may throw light on fetal origins of an adult disease. Hence the study has been undertaken. The present syudy aims at deriving palmar dermatoglyphic features from quantitative and qualitative parameters in dermatoglyphics of diabetes type II with hypertension compared to controls. Bilateral rolled finger and palm prints of 100 diabetes with hypertension patients were compared to 100 controls, of either sex or age group between 35-55 years. Palmar dermatoglyphic features derivied from quantitative parameters (TFRC, AFRC, ‘a-b’ ridge count and atd’ angles) and qualitative parameters (fingertips pattern, palmar pattern-interdigital areas abnormal palmar creases, ridges dissociation, total tri-radii palm) were analysed. Comparisons were made in all parameters between homologous fingers of both hands and also the palm. Analysis was done using mean, standard deviation and z-test. Statistical analysis of the data of the study showed: 1) Increased in frequency of ulnar loops and whorls in both hands of females. 2) Decreased in frequency of whorls in both hands of males. 3) Presence of decreased I1 pattern in the left hand and increased I3 pattern in the left hand of both sexes. 4) Presence of simian line in the left hand of females. 5) Presence of decreased ‘a-b’ ridge count of females.
PDF Composer - unlicensed versionGet a licence at www.pdf-composer.com
23
Overall measures of the dermatoglyphic parameters were prominent features of diabetes and hypertension.Key words: Dermatoglyphics; Diabetes mellitus type II; Hypertension; fingerprints.INTRODUCTION Dermatoglyphics (coined by Cummins and Midlo, 1926) is a branch of genetics dealing with the skin ridge system. The word dermatoglyph is composed of two words, “Derma” which means skin and “gltph” means carving. Thus the study of epidermal ridges, patterns, formed by them and flexion creases are known as Dermatoglyphics. This term Dermatoglyphics was introduced for the first time in 1926 by the Anatomist Harold Cummins of Tulane University in the United States. The significance of Dermatoglyphics science is based upon two facts.
1. The ridges remain throught life and survive superficial injury, in other words they are age stable, permanent and also environment stable after 21st week of intrauterine life.
2. The ridges are slighty different for each finger and differ from person to person. Diabetes mellitus type II and hypertension are common diseases that co-exist at a greater frequency than chance alone would predict. Diabetes mellitus type II and hypertension are not only one of the major risk factor for various diseases, they are also condition with their own risk factors like stroke, heart attack, atherosclerosis etc. Diabetes mellitus and hypertension have been reffere to as the genetists’ nightmare. This is because even though familial aggregation of these have been known for over 200 years the exact pattern of inheritance and the specific nature of the genetic factor involved is not fully known. This study attempts to analyse, where there exists any pattern specific for diabetes mellitus and whether that serves as a diagnostic tool for early diagnosis of diabetes and hypertension. To find out various Dermatoglyphic features in patients suffering from diabetes mellitus type II and hypertension in the age group between 35-55 years. To compare Dermatoglyphics features of normal and diabetes mellitus type II with hypertension in the age group between 35-55 years.MATERIALS & METHODS A total of hundred diagnosed patients of diabetes mellitus Type II and hypertension, of either sex or age group of 35-55 years from the diabetic clinic of B.L.D.E.A Shri.B.M.Patil Medical College Hospital and Research Centre were studied. A screening questionnaire excluded participants with diseases or congenital abnormalities belived to be associated with fingerprint or other dermatoglphic abnormalities. They were matched with hundred controls of identical age and either sex having no family history of diabetes and hypertension or any other inheritable disease. Dermatoglyphic patterns were recorded with ink, rolled prints being taken of all the fingerprints of both hands on white paper, all beings labeled accordingly, Identification and classification of prints was with help of a
PDF Composer - unlicensed versionGet a licence at www.pdf-composer.com

24
magnifying glass and other parameters were measured using protractor and scale. The prints were subsequently qualitatively and quantttatively analysed. Each finger was classified as having pattern of one of the main types-arches, loops or whorls. This based on number of points called tri radii were ridge system meet. Arches have no triradius, loops have one and whorls have two. After grouping those into different patterns were analysed.Statistical analysis The arithmetic mean and standard deviation were calculated. Z-test was applied.Significance: For the value of Z, the critical value of P is obtained from the normal table for 5% level of significance.Laboratory tests Fasting blood sugar, post prandial blood sugar, fasting urine sugar and post prandial urine sugar.Inclusion criteria Patients diagnosed with type II diabetes based on American Diabetic Association (ADA) criteria for diabetes mellitus (fasting blood sugar ›126mg/dl post prandial blood sugar›200 mg/dl with symptoms of polyuria and polydipsia) and patients diagnosed with hypertension based on joint National Committee (JNC) criteria VII for hypertension (systolic blood pressure/diastolic blood pressure mm of Hg-› 140/90mm of Hg) were included in the study. Maturity onset diabetes mellitus was also included in the study.Exclusion Criteria Patients with deformed finger and palm prints, infection and injuries like burns of fingers and palms, scars of burns of finger and palm of both hands were excluded for the study, patients with type I diabetes mellitus were excluded from the study by history. Patients with only type II diabetes mellitus without hypertension and patients with only hypertension without type II diabetes mellitus were excluded from the study. Other genetic disorders were also excluded.RESULTS The following significant parameters have been found in the present study in the palmar dermatoglyphics in type II diabetes with hypertension. In both male and female patients there is presence of decreased I1 pattern in the left hand and presence of increased I3 pattern in the left hand. In male patients presence of decreased whorls with both hands combined. In female patients presence of increase ulnar loops and whorls with both hands combined, presence of increased simian line in the left hand presence of decreased ‘a-b’ ridge count in the left hand.
PDF Composer - unlicensed versionGet a licence at www.pdf-composer.com
25
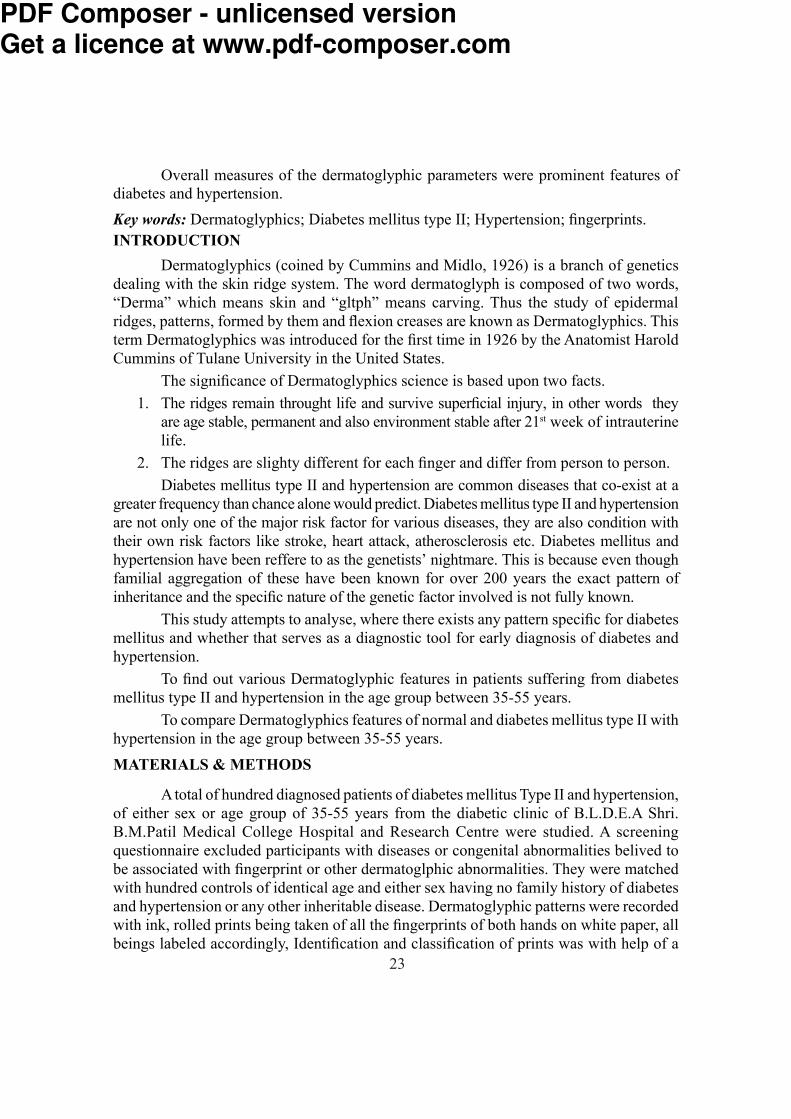
Table 1: Frequency of patterns in male study group and controls (both hands)Pattern Controls Study grp Arch 14 18Radial Loop 04 05Ulnar Loop 350 237Whorl 262 140
Graph 1: Frequency of patterns in male study gp & control (both hands)
Table 2: Frequency of patterns in female study group and controls (both hands)Pattern Control Study gpArch 04 16Radial Loop 11 09Ulnar Loop 222 316Whorls 133 252 Graph 2: Frequency of patterns in female study gp & control (both hands)
PDF Composer - unlicensed versionGet a licence at www.pdf-composer.com

26
Table 3: Presence of pattern I1 (male and females) Hand Control (%) Study Gp (%) Right 03 (3.03) 07 (7.07) Left 06 (6.06) 14 (14.14) Graph 2: Presence of pattern I1 (male and females)
Table 4: Presence of pattern I3 (male and females)Hand Control (%) Study Gp (%) Right 58 (58.58) 69 (69.69) Left 27 (27.27) 50 (50.50)Graph 4: Presence of pattern I3 (male and females)
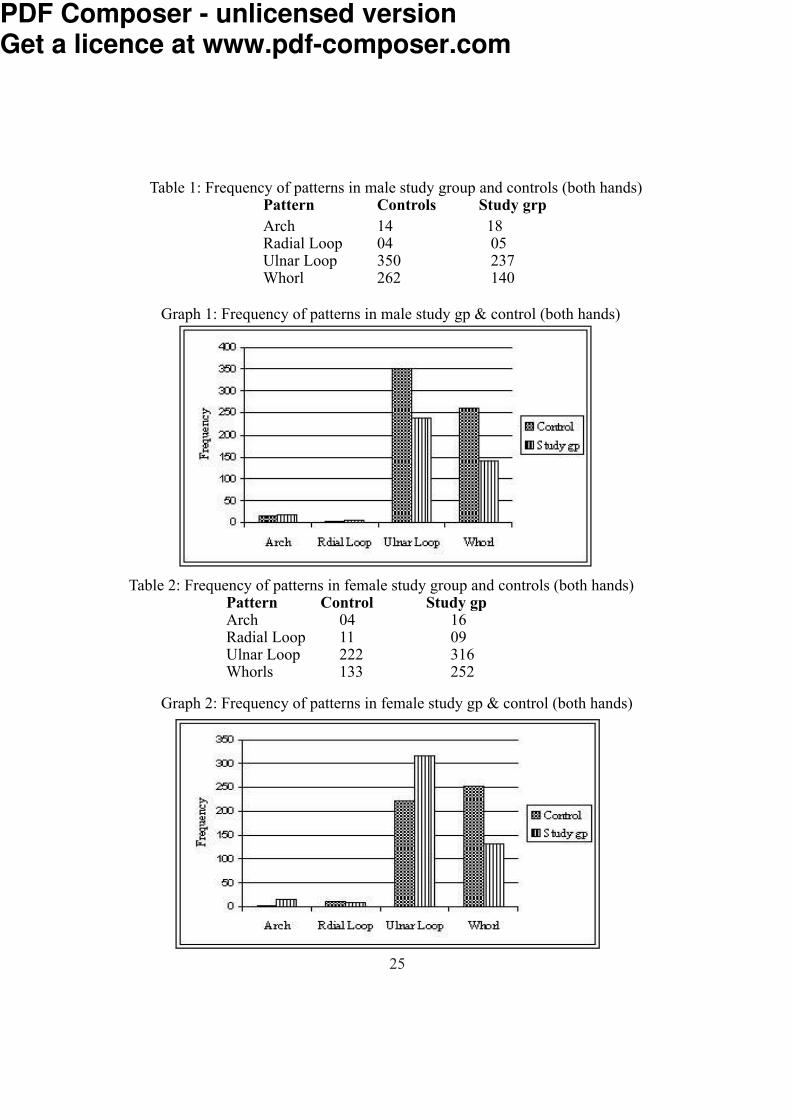
Table 5: Presence of simian line in femalesHand Control (%) Study Gp (%) Right 3 (3.03) 04 (4.04) Left 04 (4.04) 12 (12..12)
PDF Composer - unlicensed versionGet a licence at www.pdf-composer.com
27
Graph 5: Presence of simian line in females
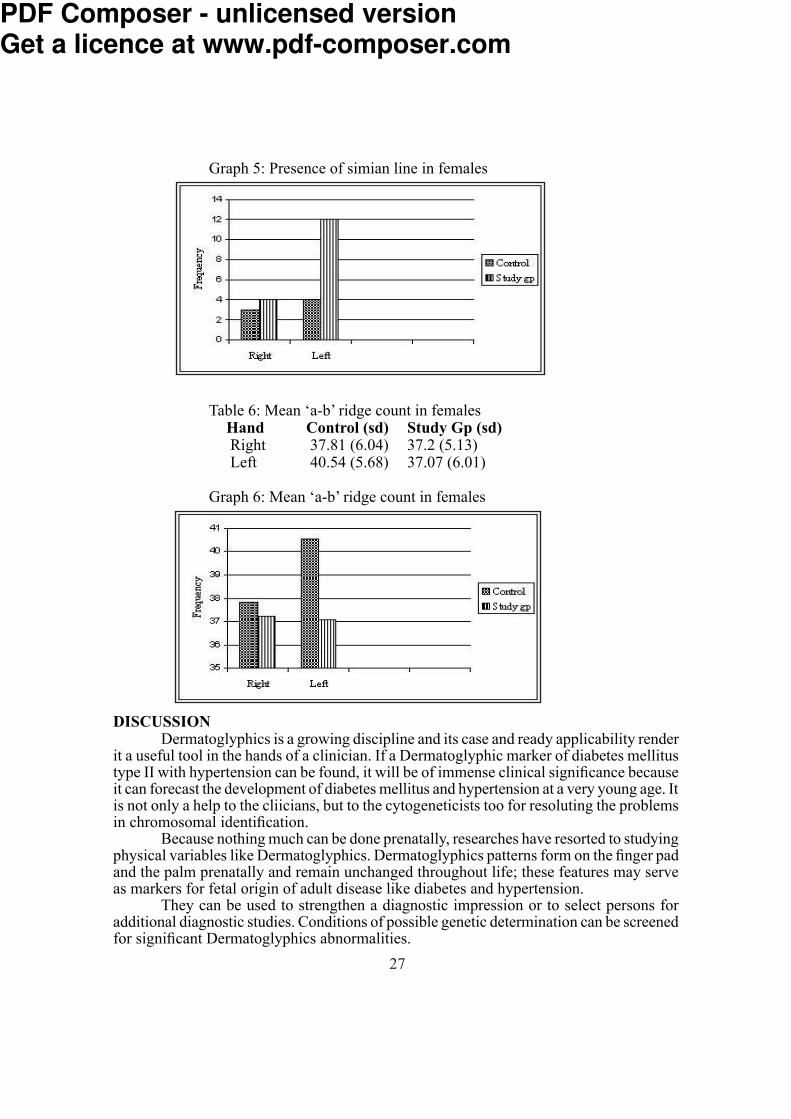
Table 6: Mean ‘a-b’ ridge count in femalesHand Control (sd) Study Gp (sd) Right 37.81 (6.04) 37.2 (5.13) Left 40.54 (5.68) 37.07 (6.01) Graph 6: Mean ‘a-b’ ridge count in females
DISCUSSION Dermatoglyphics is a growing discipline and its case and ready applicability render it a useful tool in the hands of a clinician. If a Dermatoglyphic marker of diabetes mellitus type II with hypertension can be found, it will be of immense clinical significance because it can forecast the development of diabetes mellitus and hypertension at a very young age. It is not only a help to the cliicians, but to the cytogeneticists too for resoluting the problems in chromosomal identification. Because nothing much can be done prenatally, researches have resorted to studying physical variables like Dermatoglyphics. Dermatoglyphics patterns form on the finger pad and the palm prenatally and remain unchanged throughout life; these features may serve as markers for fetal origin of adult disease like diabetes and hypertension. They can be used to strengthen a diagnostic impression or to select persons for additional diagnostic studies. Conditions of possible genetic determination can be screened for significant Dermatoglyphics abnormalities.
PDF Composer - unlicensed versionGet a licence at www.pdf-composer.com
28
CONCLUSION The present study indicate therefore that there is some genetic basis for type II diabetes mellitus with hypertension and it is possible to certain extent to predict from Dermatoglyphics individuals proclivity for acquiring diabetes mellitus with hypertension. It is a hope that like the clinical history, signs and symptoms and other tests, Dermatoglyphics will also play an important role in diagnosis of type II diabetes mellitus with hypertension.ACKNOWLEDGEMENT With proud privilege and sense of respect, I am extremely grateful to my guide and teacher Dr.S.D. Desai, for his valuable guidance and support in completion of this dissertation.REFERENCES1. Bharadwaj A, Saraswat PK, Aggarwal SK, Banerji P, Bharadwaj S, Pattern of finger prints in different ABO blood groups. J Indian Forensic Sci, 2004; 26 (1): 6-9.2. Holt SB, The siginificance of Dermatoglyphics in medicine. Clin Pediatr, 1973; 12(8): 471-84.3. Penrose LS. Medical significance of finger prints and related phenomena. Br Med J,1968; 2: 321-25.4. After M. Dermatoglyphics Analysis as a Diagnostic Tool. Medicine (Baltimore) 1967; 46 (1): 35-56.5. Schaumannn B & Alter M: Embryogenesis and genetics of epidermal ridges. Dermatoglyphics in Medical Disorders, SpringerVerlag, New York, USA, 1976; 1-113.6. The exert committee on the diagnosis and classification of diabetes mellitus. Diabetes
Care 1997; 20: 1183-97.7. Sood R, Sood AK. The JNC 7 Reprt on Hypertension Critical Analysis. Medicine Update 2005; 151-52.
PDF Composer - unlicensed versionGet a licence at www.pdf-composer.com
29
Original ArticleCytological Evaluation Of Oral Mucosa In Habitual Pan Masala Eaters: A Comparative StudyPatil P M, Yelikar B R and Jigjini S S
Department of Pathology Shri. B.M.Patil Medical College Hospital & Research Centre, BijapurAbstract
The study was undertaken to evaluate cytological changes that occur in the oral mucosa of habitual Pan Masala eaters from 250 individuals who were eating pan masala for more than 6 months and 250 non-eaters by cotton tipped applicator by scraping the buccal mucosa. Smears were prepared and stained by Papanicolou’s method. Atleast 1000 cells were scanned per slide under high power. Total 1,76,530 and 1,26,869 cells were counted in all Study slides and control slides respectively. Statistically high significant difference was found between Study and control group. Finding are accumulating regarding the local genotoxic effect such as occurance of micronucleated cells, cells with multiple nuclei, cells with broken egg nuclei, binucleated, and hyperkeratotic cells. These cells were increased according to duration and frequency of pan masala eating.
The significance of occurrence of these cells and development of oral cancers requires further studies. Can these parameters be used for early detection of oral cancers? This study might answer this question and may help in reducing the number of oral cancers. INTRODUCITON
In recent years, the habit of panmasala chewing is increasing, owing to its social acceptance and the assumption that, it is safe alternative to tobacco1 which is a known carcingoen.2,3
Panmasala is a dry powered complex mixture of various constituents which include arecanut, catechu, lime, cardamom, menthol, sandal oil, spices and unspecified flavouring agent. Panmasala is available as i) Panmasala plain ii) Sweet panmasala iii) Panmasala with tobacco. The harmful effects of areca nut, catechu and lime have been well documented. The chemical analysis of the different brands of panmasala has shown the presence of polycyclic aromatic hydrocarbons, nitrosamines, toxic metals and residual pesticides which are known pro-carcinogens.
Already incidence of oral cancer is increasing day by day with as many as 17% to 48% of all cancer found in oral cavity with such a major health problem already on hand, in recent years, the habit of panmasala eating (chewing) is increasing. The constitutent, of panmasala are having genotoxic effect, one of the cytogenetic end point of this effect is micronucleated cells.
PDF Composer - unlicensed versionGet a licence at www.pdf-composer.com

30
For the assessment of the genotoxicity of various chemicals, the demonstration of chromosomal aberretion (CA) or sister chromatied exchange or percentage of micro nucleated cells, which are cytogenetic end points are used as markers. Out of these three markers, demonstration of the micronucleated cells does not require cell culture and the preparation of meatphase spreads. This phenomenon of micronuleus formation also has been studied on exfoliated human bucccal cells.
The significance of micronuclei, binucleation, broken egg nuclei and hyperkeratotic cells and development of oral cancer requires further studies. Can these parameters be used for early detection of oral cancers? This study might answer this question and may help in reducing the number of oral cancer.
With this background the present study was undertaken to find the various morphological changes that occur in the oral mucosa of habitual panmasala eaters. The samples were obtained by exfoliated cytology which is a rapid, non-invasive, inexpensive procedure.Aims of Study: To study the cytological changes that occur in the oral mucosa of habitual pan masala eaters and to evaluate and correlate the cytological changes with duration and frequency of pan masala eating. MATERIALS AND METHODS
Samples from the oral cavity of 250 habitual pan masala eaters; consuming 2-6 saches per day for >6 months and 250 normal (pan masala non-eaters) individuals with comparable age and sex as control group.
A cotton tipped applicator was used to take the samples is used for scraping the oral mucosa by means of linear and rotational movements. Then smeared on to a clean oil free glass slide. Then fix in absolute alchol for 15 to 30mins and stained with papanicolau’s method. OBSERVATION
The habit is more prevalent amongst the younger population aged 21-25 and 26-30. The study gp comprising 250subjects, 192 were without lesion & 58 with lesion. The values in tables given in brackets are range & mean±SD. Table1: Shows Cellularity & nuclear charecterisics in study & control group
Parameters Study Group Control GroupTotal no. of cells counted 176530 126869Nucleated cells 147625 99806Hyperkeratotic cells 38905 27063Micro nucleated cells 25562 10440Micronuclei 139873 61741Broken egg nuclei 909 323Binucleated cells 15755 9417
PDF Composer - unlicensed versionGet a licence at www.pdf-composer.com

31
Table 2: Showing Cellularity ( Micronucleated cell -[CMi] ) in Study Group with Lesions and without Lesions
Parameters Study Group Study Group with lesion without lesionCMi 15368 10194Total No micronuclei 77886 61987Broken egg nuclei 81 828Binucleate cells 4004 11751Hyperkeratotic cells 22543 16362Nucleated cells 51083 96542
In our study, in study group with lesion, we found 58 cases out of 250 and 192 cases in study group without lesion.
Table 3: Shows No. & count of Micronucleated Cells (CMi). Parameters Study Group Control Group
Total number of cells 25562 10440C M i/100 cells 14.48% (22-121) 8.2% (23-63) ( 21.41±2.25*) (41.76±8.66) C M i/100 NC 17..31% 10.46%
Z = 14.03, P < 0.01, HS*
Table 4: Comparision of count of Micronucleated Cells between Study Group with Lesions & without Lesions and control
Parameters Control SL SWL N= 250 N=58 N=192Total number of CMi 10440 15368 10194C M i/ 100 cells 8.2% 8.70% (18-700) 5.77% (59-125) (264.97±51.72*) ( 53.09±13.43*)C M i/ 100 NC 10.46% 10.41% 6.90%
SL-Study gp with lesions ; SLW-Study gp without lesions Z = 6.69, P < 0.01 HS*Table 5: Comparative count of micronucleated cells[CMi] in Study & Control Group
Parameters Study Group Control GroupTotal number of cells 139873 61741M i/1000 cells 792.3 (26-906) 486.65 (73-400) (559.49±146.68)* (246.96±47)M i/1000 NC 947.4 618.6
Z = 15.66, P = < 0.01 HS*
PDF Composer - unlicensed versionGet a licence at www.pdf-composer.com
32
Table 6: Showing the Comparative count of Micronuclei in Study Group with Lesions and without Lesions. Parameters Control SL SWL N= 250 N=58 N=192
Total no. of micronuclei 61741 61987 77886M i/ 100 cells 486.6 351.1 441M i/ 100 NC 618.6 419.8 527.5
SL-Study gp with lesions ; SLW-Study gp without lesions
Table 7: Comparative count of broken egg nuclei(B-egg) in Study & Control group Parameters Study Group Control Group
Total number B-egg 909 323B-egg/1000 cells 5.14(0-14) 2.54(0-7) (3.04±2.91)* (1.3±1.398)B-egg/1000 NC 6.15 3.2
Z = 11.9, P = < 0.01 HS*Table 8: Comparison of broken egg nuclei count in Study group with
lesions and without lesions Parameters Control SL SWL N=250 N=58 N=192
Total no. of B-egg 323 81 828B-egg / 1000 cells 2.54 0.68 (0-3) 4.69 (0-21) (0.324±0.57)# (3.31±4.67)B-egg / 1000 NC 3.2 0.81 5.6
SL-Study gp with lesions ; SLW-Study gp without lesions #Z + 10.05 No significant difference at P + <0.01Table 9: Comparison binucleated cell (Bin) count in Study & control group
Parameters SL SWL n1 +250 n2 + 250
Total no. of Bin 15755 9417Bin / 1000 cells 89.2(40-90) 74.2 (30-64) (63.02±8.7) (37.7±9.4)*Bin / 1000 NC 106.7 94.3
SL-Study gp with lesions ; SLW-Study gp without lesions. Z + 25.35, P <0.01 HS*
PDF Composer - unlicensed versionGet a licence at www.pdf-composer.com

33
Table10: Comparison of binucleated cell count in Study group with lesions and without lesions Parameters Control SL SWL n1+58 n2+192
Total no. of Bin 9417 4004 11771Bin / 1000 cells 74.2 22.68(41-62) 66.67 (40-72) (69.03±13.52)# (61.2±6.52)Bin / 1000 NC 94.3 27.12 79.73
Z +7.83 +4.36 There is no significant difference at P= <0.01
Table11: Comparison of Nucleated cell (NC) & hyperkeratotic cells (H) count in Control gp & Study gpParameters Study Group Control Group n1 +250 n2 + 250No. of H cells 38905 27063No. of NC cells 147625(219-934) 99806(48-769) (590.5±179.1) (399.0±124.05)% of H Cells 22.04% (65-221) 21.3% (82-199) (155.62±29.69) (108.3±21.93)
No. of H cells Z = 3.16 P<0.01 HS* No. of N cells Control S user group Z + 13.88 P<0.01 HS*
Table 12: Comparison of Nucleated cells & hyperkeratotic cells in Study group with lesion and without lesions Parameters Control SL SWL n1=58 n1=58
No. of H cells 27063 22543 16362No. of NC 99806 51083 96542 (880.7±71.03) (502.8±123)% of H cells 21.3% 12.77% (39-710) 9.27% (32-201) (388.67±66.24) (85.22±32.99)
No. of H cells Z = 2.60 Significant at = 0.05; No. of N cells Z = 29.35 P < 0.05 HS*
PDF Composer - unlicensed versionGet a licence at www.pdf-composer.com
34
Table 13: Correlation between the average numbers of packets consumed per day and occurrence of Micronucleated cells.Duration in year Packets per day Micronucleated cells
½ - 5 yrs 2 -6 / day 35736 - 10 yrs 6 - 10 / day 978911 -15 yrs 10 -14 / day 12200
We observed correlation between duration, consumption (no. of saches/d)and CMi count.With increase in duration and consumption there is increase in CMi count. This was consistant with Ghose et.al. who found in their study increased frequency of micronuleated cells to be higher in user group4.
In 1991 Mukherju et.al. observed that there was high frequency of microuncleated cells among Indians chewing betel quid, arecanut and tobacco5. In our study we found that there was increased number of micronucleated cells in user group as compared to the control group.
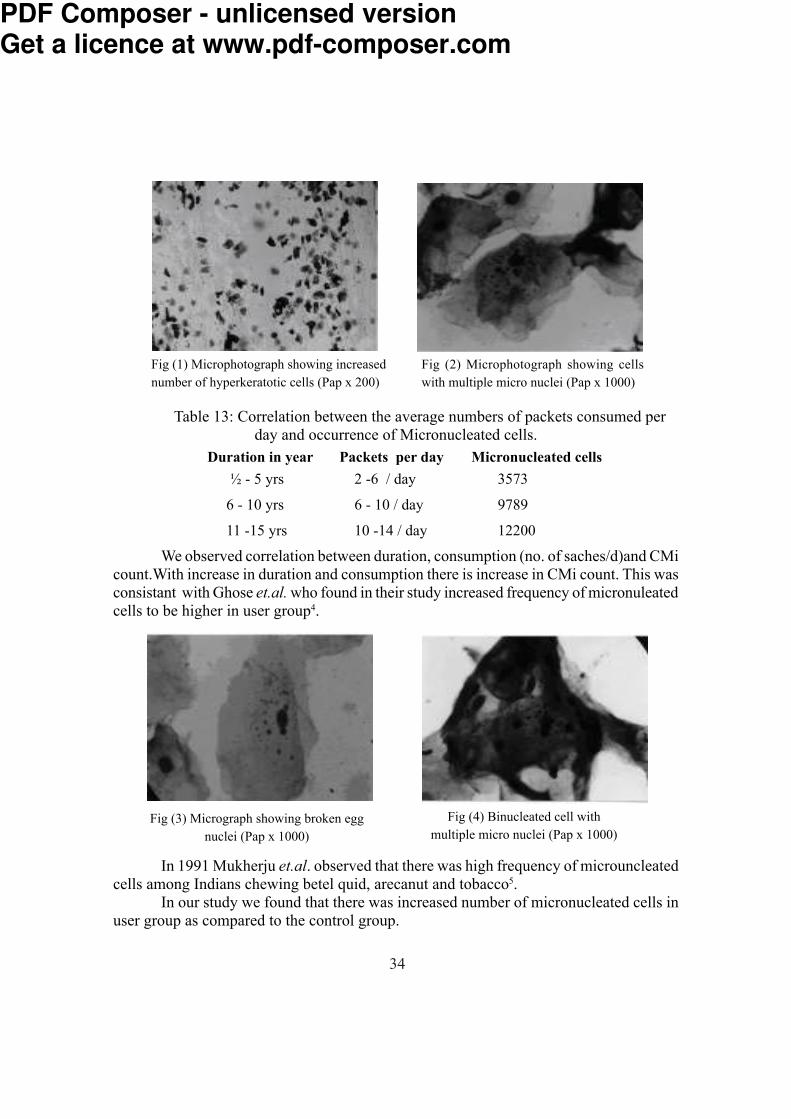
Fig (3) Micrograph showing broken egg nuclei (Pap x 1000)
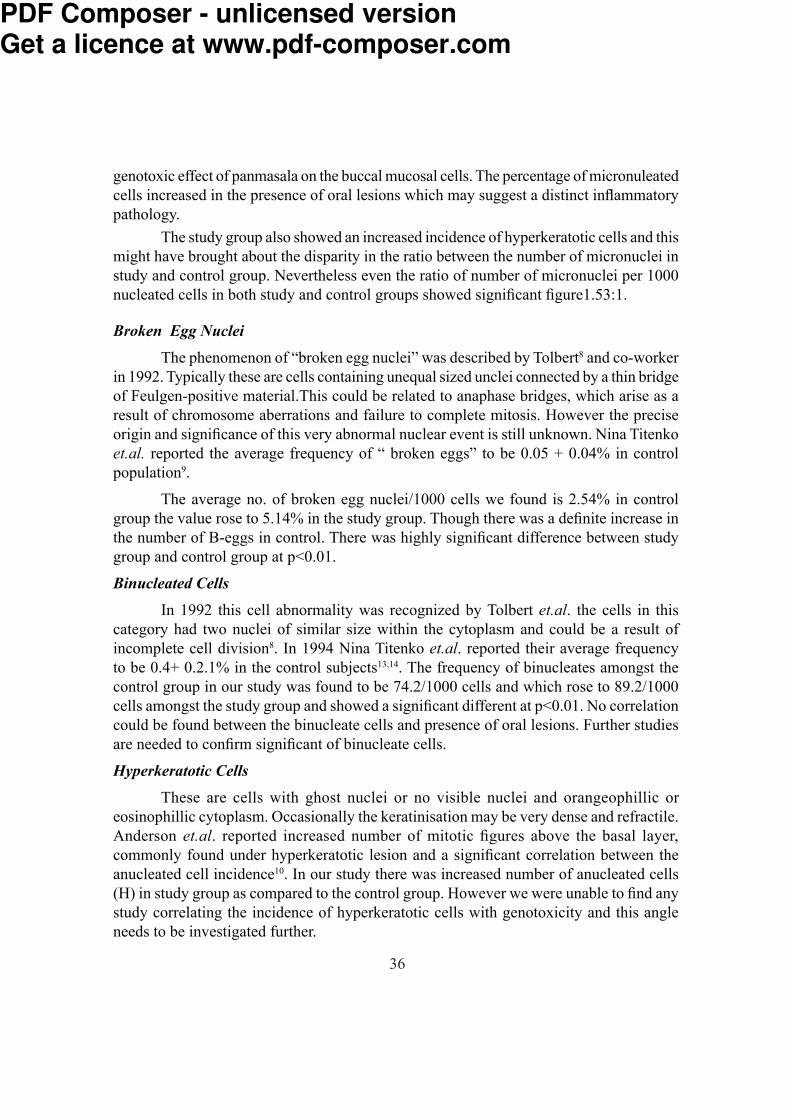
Fig (4) Binucleated cell with multiple micro nuclei (Pap x 1000)
Fig (1) Microphotograph showing increased number of hyperkeratotic cells (Pap x 200)
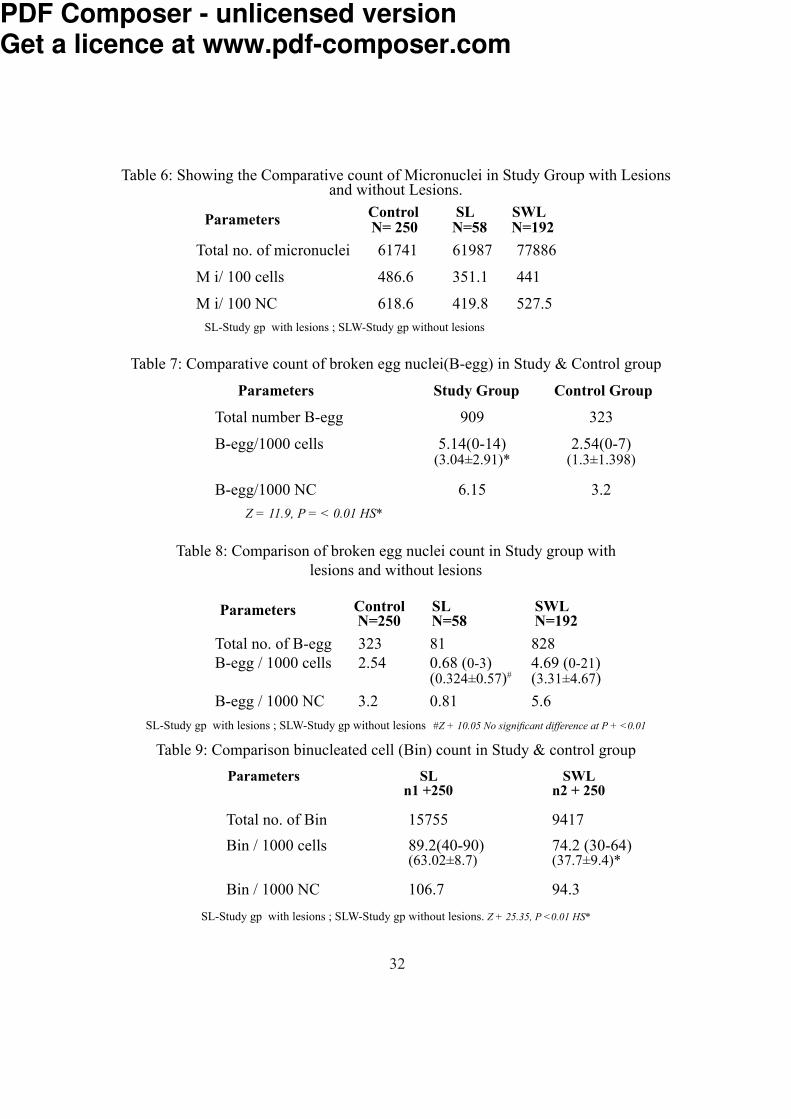
Fig (2) Microphotograph showing cells with multiple micro nuclei (Pap x 1000)
PDF Composer - unlicensed versionGet a licence at www.pdf-composer.com

35
DISCUSSION Findings of various independent studies show cumulative and local gentoxic effects of various “chewable substances” like tobacco, arecanut, catechu, lime. Panmasala being a complex mixture of ingredients like tobacco, arecanut, catecue, lime etc; poses a problem in this regard since all these components can have an antagonistic or synergistic effect. Though we did find several invitro studies demonstrating the genotoxic and the clastogenic effect of panmasala extract, we found very few invitro studies have directly assessed its local gentoxicity. With this background, present study was undertaken to evaluate the cytological changes in the oral mucosa of habitual panmasala eaters (Study group). In our present study, the cytological changes examined as markers, were the occurrence of micronuclei, broken-eggnuclei, binucleated cells and hyperkeratotic cells.Micro-Nuclei Micronuclei are considered to be markers of abnormal mitosis. This involves chromosomal breakage and misaggregated chromatin, which results in the formation of a separate smaller nuclei. We found few studies have reported such cytological markers2,6. In 1996 Trivedi et.al. have reported a significantly higher frequency of micronuleated cells in exfoliated buccal mucosa in users of both plain panmasala and panmasala with tobacco when compared with control population2. Our study was consistent with this finding since it was observed that 8.8% of the cells were micronucleated in the study group, only 8.2% were micronucleated in the controls. The CMi ratio of user: control thus up to 1.07:1. These values, however, are very high when compared to the result of Stich et.al. who found 0.47% of buccal mucosal cells contained micronuclei in the control Indian population; and that this level is increased to 2.2% in betel quid tobacco chewers, but the background levels of micronuclei in exfoliated buccal cells reported in the literature vary between 0.03% and 0.47%16, more than a ten fold variation.
The high variability in background levels reported may be due to several factors including.
1. Scoring criteria2. Staining intensity3. Number of cells scored per individual
Nevertheless a very high significant difference existed between the number of micronucleated cells amongst user and control group at p<0.01.
The percentage of micronucleated cells was found to be much higher among the study group than control group. This finding is consistent with the finding of Patel et.al. which states that ethanol potentiates the gentoxic effects of panmasala. The finding further led to its conclusion that smoking, alcohal and tobacco in any other form potentiates the
PDF Composer - unlicensed versionGet a licence at www.pdf-composer.com
36
genotoxic effect of panmasala on the buccal mucosal cells. The percentage of micronuleated cells increased in the presence of oral lesions which may suggest a distinct inflammatory pathology. The study group also showed an increased incidence of hyperkeratotic cells and this might have brought about the disparity in the ratio between the number of micronuclei in study and control group. Nevertheless even the ratio of number of micronuclei per 1000 nucleated cells in both study and control groups showed significant figure1.53:1.Broken Egg Nuclei The phenomenon of “broken egg nuclei” was described by Tolbert8 and co-worker in 1992. Typically these are cells containing unequal sized unclei connected by a thin bridge of Feulgen-positive material.This could be related to anaphase bridges, which arise as a result of chromosome aberrations and failure to complete mitosis. However the precise origin and significance of this very abnormal nuclear event is still unknown. Nina Titenko et.al. reported the average frequency of “ broken eggs” to be 0.05 + 0.04% in control population9. The average no. of broken egg nuclei/1000 cells we found is 2.54% in control group the value rose to 5.14% in the study group. Though there was a definite increase in the number of B-eggs in control. There was highly significant difference between study group and control group at p<0.01.Binucleated Cells In 1992 this cell abnormality was recognized by Tolbert et.al. the cells in this category had two nuclei of similar size within the cytoplasm and could be a result of incomplete cell division8. In 1994 Nina Titenko et.al. reported their average frequency to be 0.4+ 0.2.1% in the control subjects13,14. The frequency of binucleates amongst the control group in our study was found to be 74.2/1000 cells and which rose to 89.2/1000 cells amongst the study group and showed a significant different at p<0.01. No correlation could be found between the binucleate cells and presence of oral lesions. Further studies are needed to confirm significant of binucleate cells.Hyperkeratotic Cells These are cells with ghost nuclei or no visible nuclei and orangeophillic or eosinophillic cytoplasm. Occasionally the keratinisation may be very dense and refractile. Anderson et.al. reported increased number of mitotic figures above the basal layer, commonly found under hyperkeratotic lesion and a significant correlation between the anucleated cell incidence10. In our study there was increased number of anucleated cells (H) in study group as compared to the control group. However we were unable to find any study correlating the incidence of hyperkeratotic cells with genotoxicity and this angle needs to be investigated further.
PDF Composer - unlicensed versionGet a licence at www.pdf-composer.com

37
Other nuclear changes like karyorrhexis, bare nuclei karyolysis and pyknosis were observed but not quantified.REFERENCES1. Jaju RJ., Patel RK, Bakshi SR, Trivedi AH, Dave BJ, Adhvaryu SH. Chromosome
damaging effects of panmasala. Cancer Lett, 1992; 65: 221226.2. Trivedi AH, Balart DB, Shah PM, Patel RK et al. Carcinogenic and genotoxic effects
of the tobacco substitute pan masala: Present status and likely future impact on the Indian Population. Cancer Treat Rev, 1996; 22: 345354.
3. Roberts DM. Comparative cytology of the oral cavities of snuff users. Acta Cytol, 1997; 41: 10081014.
4. Ghosh UR, Parida BB.Cytological study of exfoliated buccal mucosa cells of tribes in Orissa state (India) with high risk for oral cancer. Indian J Cancer,1995; 32: 95-99.
5. Mukherjee A, Chakraharti J, Chakrabarti A, Banerjee T, and Sarma A Effect of “panmasala” of germ cells of male mice. Cancer Lett, 58: 161165.
6. WHO invitro cytogenetics and Sister chromatid exchange in: Guide to short term tests for detecting mutagenetic and carcinogenic chemicals in environmental health criteria 51. World Health Organization, 1985; 5767.
7. Stich HF, Stch W & Parida BB. Eleveted frequency of micronucleated cells in the buccal mucosa of individuals at high risk for oral cancer in betal quid chewers. Cancer Lett, 1982; 17:125-134.
8. Tolbert PE, Shy CM & Allen JW. Micronuclei and other anamolies in buccal smear. Mutation Res, 1992; 271:69-77.
9 TitenkoN, MooreLE & Smith MT. Measurement and charecterization of micronuclei in exfoliated human cells by fluoscence in situ hybridization with centromeric probe. Mutation res, 1994; 312:39-50.
10. Anderson G, Axell T & Larsson A. Clinical classification of Swedish snuff dippers lesions supported by histology. J Oral Pathol Med, 1991; 20: 253-257.
PDF Composer - unlicensed versionGet a licence at www.pdf-composer.com

38
Original ArticleA study to assess catastrophic household expenditure on childhood
illness in urban slum of Bijapur.Shailaja Patil, A S Berad and M M Angadi
Department of Community Medicine Shri. B. M. Patil Medical College Hospital & Research Centre, Bijapur
AbstractIn the study the following factors determining the out of pocket spending on child
health care by households to answer following questions: How much are households currently spending on child health care? Is there role of socio-economic status of households on expenditure on child health care? What percentage of their income is spent on child health care and is it catastrophic?
Four slums with total population of 7000. Households where there is history of illness/ sickness in under 5 children in last one month were included in the study.
There were total 218 episodes of child illness in the households. The household’s belonging to socio- economic class I & II had higher spending on child’s illness per episode as compared to households of socio- economic class III, IV & V. Socioeconomic status was key determinant of health care expenditure. In the study it has been found that almost all the households suffered from catastrophic health expenditureKey words: catastrophic, expenditure, childhood illnessINTRODUCTION
The relationship between poverty and ill-health is indisputable. There is more recent evidence to show the effect of illness on poverty. 1 Even relatively small expenditure on health can be financially disastrous for poor households. This is because almost all their financial resources are used for basic needs and they are thus less able to cope with even very low expenditure compared to richer households.2 In developing countries , high out of pocket payment, an absence of risk pooling mechanism in health financing systems and high level of poverty can result in catastrophic health expenditure.3
India has adopted the tax-based model of financing health care. However, decades of under-funding have resulted in poor infrastructure, vacant posts and poor quality health care. This makes the patients seek private health care for their needs, with its associated out-of-pocket payments. Studies show that about a quarter of Indians who are hospitalised are impoverished because of the medical costs .4
We tried to study the following factors determining the out of pocket spending on child health care by households to answer following questions: How much are households currently spending on child health care? Is there role of socio-economic status of households on expenditure on child health care? What percentage of their income is spent on child health care and is it catastrophic?
PDF Composer - unlicensed versionGet a licence at www.pdf-composer.com

39
MATERIALS & METHODS Four slums with total population of 7000 adjoining urban health training centre
were selected for the study. 658 children under the age of five years reside in the area. All the households having children aged less than 5 years were visited. Only those households where there is history of illness/ sickness in under 5 children in last one month were included in the study to minimize the recall bias. The head of households and the mothers of the sick children were interviewed by using pretested and prestructured questionnaire. Questions were asked on the type of illness the child was suffering, place where treatment was sought and information on expenditure incurred. The socio- economic classification of household’s was done using modified Prasad’s scale according to current consumer price index. The data so collected was analyzed using EPI6 software in the department of Community Medicine.RESULTS
Data from 190 households was collected and analyzed, where at least one child aged less than 5 years was ill in the past one month period. There were total 218 episodes of child illness in the households. The mean duration of each episode was 4.6 days. 158 episodes were treated at private hospitals, 53 episodes at public hospitals whereas for 7 episodes no treatment was sought. Out of 190 households only 13 households were having some form of health insurance. 30 households (16%) had some plan for health insurance.Table 1: Out of pocket spending (in INR Median [95% CI])on child’s illness per episode
according to socio-economic (SE) class of households.S E Class Hospital fees Drugs Travel Total Spending I 75 (20-150) 150 (65-450) 20 (10-40) 327 (145-1730)
II 40 (15-100) 100 (50-200) 20 (0-40) 140 (110-400)III 25 (15-50) 70 (50-100) 20 (0-30) 120 (80-160)IV 20 (5-40) 52 (30-82) 20 (0-20) 100 (71-145)V 20 (0-40) 55 (20-90) 20 (10-35) 105 (72-150)
P value p<0.01 p<0.001 p<0.01 p<0.01Table 1 provides the results of spending on child illness. The household’s belonging
to socio- economic class I & II had higher spending on child’s illness per episode as compared to households of socio- economic class III, IV & V. This difference in the level of spending according to different socio- economic class of household’s was found to be significant in all sub groups of expenditure. This difference may be due to the fact that Socio- economic class I & II availed services from private practitioners where the hospital fees & drug prescription amounts were considerably higher.
PDF Composer - unlicensed versionGet a licence at www.pdf-composer.com
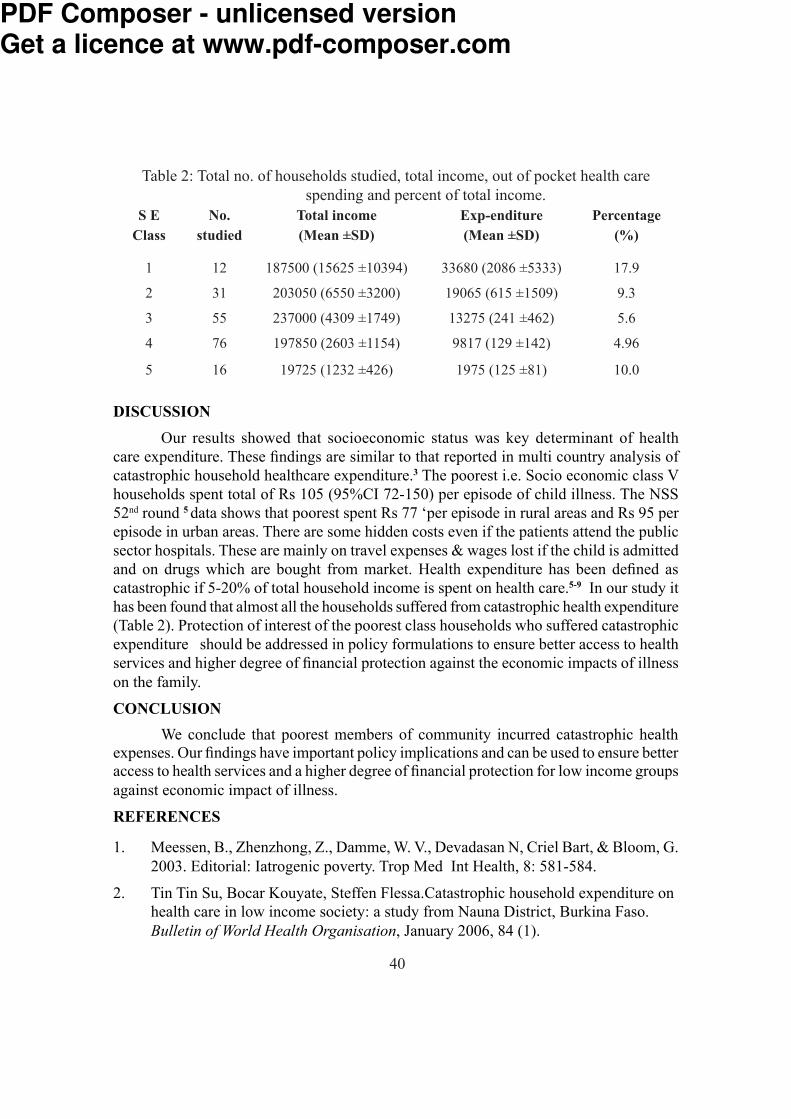
40
Table 2: Total no. of households studied, total income, out of pocket health care spending and percent of total income.
S E No. Total income Exp-enditure Percentage Class studied (Mean ±SD) (Mean ±SD) (%) 1 12 187500 (15625 ±10394) 33680 (2086 ±5333) 17.9 2 31 203050 (6550 ±3200) 19065 (615 ±1509) 9.3 3 55 237000 (4309 ±1749) 13275 (241 ±462) 5.6 4 76 197850 (2603 ±1154) 9817 (129 ±142) 4.96 5 16 19725 (1232 ±426) 1975 (125 ±81) 10.0DISCUSSION
Our results showed that socioeconomic status was key determinant of health care expenditure. These findings are similar to that reported in multi country analysis of catastrophic household healthcare expenditure.3 The poorest i.e. Socio economic class V households spent total of Rs 105 (95%CI 72-150) per episode of child illness. The NSS 52nd round 5 data shows that poorest spent Rs 77 ‘per episode in rural areas and Rs 95 per episode in urban areas. There are some hidden costs even if the patients attend the public sector hospitals. These are mainly on travel expenses & wages lost if the child is admitted and on drugs which are bought from market. Health expenditure has been defined as catastrophic if 5-20% of total household income is spent on health care.5-9 In our study it has been found that almost all the households suffered from catastrophic health expenditure (Table 2). Protection of interest of the poorest class households who suffered catastrophic expenditure should be addressed in policy formulations to ensure better access to health services and higher degree of financial protection against the economic impacts of illness on the family. CONCLUSION
We conclude that poorest members of community incurred catastrophic health expenses. Our findings have important policy implications and can be used to ensure better access to health services and a higher degree of financial protection for low income groups against economic impact of illness.REFERENCES1. Meessen, B., Zhenzhong, Z., Damme, W. V., Devadasan N, Criel Bart, & Bloom, G.
2003. Editorial: Iatrogenic poverty. Trop Med Int Health, 8: 581-584.2. Tin Tin Su, Bocar Kouyate, Steffen Flessa.Catastrophic household expenditure on
health care in low income society: a study from Nauna District, Burkina Faso. Bulletin of World Health Organisation, January 2006, 84 (1).
PDF Composer - unlicensed versionGet a licence at www.pdf-composer.com

41
3. Ke Xu, David B Evans, Kei Kawabata, Riadh Zermdini, Jan Klavus, Cristopher JL Murray. Household catastrophic health care expenditure: a multy country analysis. Lancet, 2003; 362: 111-117.
4. Peters, D., Yazbeck, A., Sharma, R., Ramana, G., Pritchett, L., & Wagstaff, A. Better Health Systems for India’s poor. Washington: World Bank.2002: 347.
5. NSS 1996, Report No 441, 52nd Round, New Delhi: NSSO, Govt of India, 1998.6. Wyszewianski L. Families with catastrophic health care expenditure. Health Service
Research, 1986; 21: 617-34.7. Berki SE. A look at catastrophic medical expenses & the poor. Health Affairs
(Millwood). 1986; 5:138-45.8. Ranson MK. Reduction of catastrophic health care expenditures by a community- based
health insurance scheme in Gujarat, India: Current experiences and challenges. Bulletin of World Health Organization, 2002; 80:613-21.
9. Waters HR, Anderson GF, Mays J. Measuring financial protection in health in the ‘United States: Health Policy’. 2004; 69:339-49.
PDF Composer - unlicensed versionGet a licence at www.pdf-composer.com
42
Original ArticleDrug Purchasing Pattern in Rural Field Practice Area
Veena S Algur, P B Jagirdar, M M Angadi & Vijaya Sorganvi Department of Community Medicine
Shri. B. M. Patil Medical College Hospital & Research Centre, BijapurINTRODUCTION It is known fact that India is in the pangs of poverty & illiteracy which are the two dimensions of same coin, in such a socio economic scenario of our nation the goal Health for All is a mirage as the underlying root causes are complex in nature & need flexible strategies to tackle them. Morbidity & Mortality can be curbed noteably by the patients compliance to the prescribed regimen of drugs. As a basis for this, the drug purchasing pattern which is influenced by economic factors, literacy level & individual habit will play an important role in non-compliance to complete compliance through various degrees of partial compliance(1). Both partial & non-compliance lead to unsuccessful treatment, a significant problem faced by the health care professionals today. The non-compliance rates vary from 15% to as much as 90%(2). The reasons for poor compliance are mainly discontinuation of treatment say when patient is unable to buy or unfortunately most patient declare themselves as cured once their symptoms decrease or lack of knowledge regarding completing prescribed regimen. Either of the reasons are based on deliberate action, misinterpretation or inadequate information 3. An attempt has been made to analyze drug purchasing pattern which is root cause of non-compliance andthe relevance of socio economic class & literacy status on drug purchasing practices. Very few studies have taken place in India (4,5) and therefore more research is essential in this area.MATERIAL & METHODS Study area was Rural Health Training Centre (RHTC) Shivanagi rural field practice area of Shri.B.M.Patil Medical College Hospital & Research Centre, Bijapur. Study Design was Cross Sectional and the participants were adult patients attending RHTC- OPD; during the period from 1st July to 31st July 2007 (one month). The sample size was 369 OPD patients of RHTC. The method used was interview technique using pretested proforma. The data were analysised using Percentage & Chi-square Test.RESULTS Out of 369 respondents total no. of male patients were 159 & 210 females. During study period maximum of 145 (39%) patients were in the age group of 18-30 yrs who have attended OPD & only 36 (10%) belonged to 61 & above age group.
PDF Composer - unlicensed versionGet a licence at www.pdf-composer.com
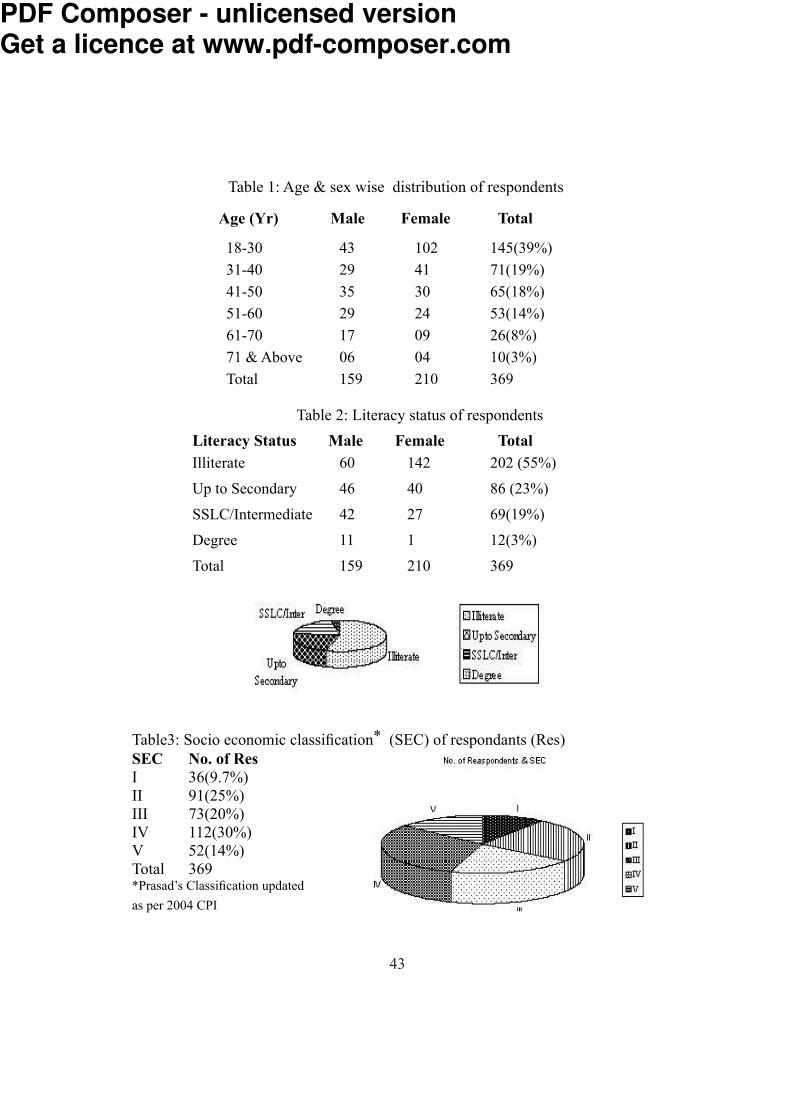
43
Table 1: Age & sex wise distribution of respondentsAge (Yr) Male Female Total18-30 43 102 145(39%)31-40 29 41 71(19%)41-50 35 30 65(18%)51-60 29 24 53(14%)61-70 17 09 26(8%)71 & Above 06 04 10(3%)Total 159 210 369
Table 2: Literacy status of respondentsLiteracy Status Male Female TotalIlliterate 60 142 202 (55%)Up to Secondary 46 40 86 (23%)SSLC/Intermediate 42 27 69(19%)Degree 11 1 12(3%)Total 159 210 369
Table3: Socio economic classification* (SEC) of respondants (Res)SEC No. of ResI 36(9.7%)II 91(25%)III 73(20%)IV 112(30%)V 52(14%)Total 369*Prasad’s Classification updatedas per 2004 CPI
PDF Composer - unlicensed versionGet a licence at www.pdf-composer.com
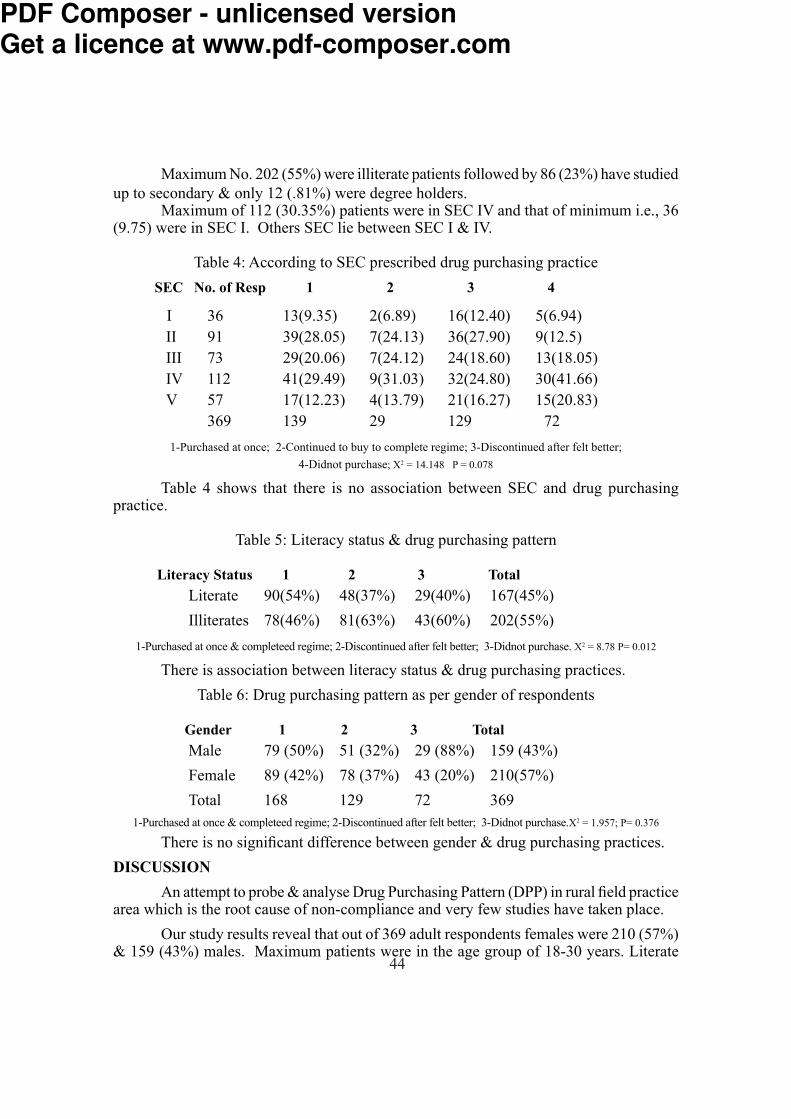
44
Maximum No. 202 (55%) were illiterate patients followed by 86 (23%) have studied up to secondary & only 12 (.81%) were degree holders. Maximum of 112 (30.35%) patients were in SEC IV and that of minimum i.e., 36 (9.75) were in SEC I. Others SEC lie between SEC I & IV.
Table 4: According to SEC prescribed drug purchasing practiceSEC No. of Resp 1 2 3 4 I 36 13(9.35) 2(6.89) 16(12.40) 5(6.94)
II 91 39(28.05) 7(24.13) 36(27.90) 9(12.5)III 73 29(20.06) 7(24.12) 24(18.60) 13(18.05)IV 112 41(29.49) 9(31.03) 32(24.80) 30(41.66)V 57 17(12.23) 4(13.79) 21(16.27) 15(20.83) 369 139 29 129 721-Purchased at once; 2-Continued to buy to complete regime; 3-Discontinued after felt better;
4-Didnot purchase; X2 = 14.148 P = 0.078 Table 4 shows that there is no association between SEC and drug purchasing practice. Table 5: Literacy status & drug purchasing pattern Literacy Status 1 2 3 Total
Literate 90(54%) 48(37%) 29(40%) 167(45%)Illiterates 78(46%) 81(63%) 43(60%) 202(55%)
1-Purchased at once & completeed regime; 2-Discontinued after felt better; 3-Didnot purchase. X2 = 8.78 P= 0.012 There is association between literacy status & drug purchasing practices.
Table 6: Drug purchasing pattern as per gender of respondents Gender 1 2 3 Total
Male 79 (50%) 51 (32%) 29 (88%) 159 (43%)Female 89 (42%) 78 (37%) 43 (20%) 210(57%)Total 168 129 72 369
1-Purchased at once & completeed regime; 2-Discontinued after felt better; 3-Didnot purchase.X2 = 1.957; P= 0.376 There is no significant difference between gender & drug purchasing practices.DISCUSSION An attempt to probe & analyse Drug Purchasing Pattern (DPP) in rural field practice area which is the root cause of non-compliance and very few studies have taken place. Our study results reveal that out of 369 adult respondents females were 210 (57%) & 159 (43%) males. Maximum patients were in the age group of 18-30 years. Literate
PDF Composer - unlicensed versionGet a licence at www.pdf-composer.com
45
patients constituted 167 (45%) were as 202 (55%) were illiterates. Among SEC grouping 112 (30% patients belonged to class IV & only 36 (10%) belonged to class I. It is found that there is no association between SEC & Drug Purchasing Pattern, but there is association between literacy status & DPP & there is no significant difference between gender & DPP.CONCLUSION This study concludes that literacy is the only tool which can help us to fight the battle “Health For All” there is utter need for health education specially for the category of the patients who are unable to buy & who are totally dependent on freely supplied drugs and also part buyers who discontinue to buy remaining course to complete regimen will be more at risk of developing drug resistance, in turn they need more expensive treatments. Only key to break such vicious cycle which an developing nation like India can afford & adopt to reduce DALY (Disability Adjusted Life Years) is creating awareness among general public. There is need to focus more attention & give priority for this dimension of health care. Suggestions
Free & compulsory education should include health education at all levels.More IEC activities to through light on hazards of incomplete treatment or drug resistance.
REFERENCE1. J.P.Acharya, & I.Acharya, A study on compliance and behavioural responses of patients in an out-patient clinic. Indian J Community Med, 27(1); 2003:19.2. Davis MS. Variation in patient’s compliance with Doctor’s advice. An empirical analysis of patterns of communication. Am J Public Health, 1968; 58(2): 274-88.3. Moulding T, Onstad 4D, Starlarlo JA. Supervision of out patient drug therapy with the Medication Monitors. Ann Intern Med, 1970; 73:559-64.4. Jain L, Saxena S, Sen S. The fate of your prescription. Indian Pediatrics 1985;2:367-70.5. Arya S, Naidu AN. Community awareness, attitudes and utilization of Primary Health Centre in rural Hyderabad. Indian J Community Med, 1983; 8 (2): 13-21.
PDF Composer - unlicensed versionGet a licence at www.pdf-composer.com
46
Original ArticleRefractive Errors in School Children Data from aSchool Screening Programme
Gaurav Arora and Nitin Batra Department of OphthalmologyChristian Medical College, Ludhiana Abstract Reduced vision because of uncorrected refractive error is a major public health problem in school children in India (Dandona et al, 2002).Vision screening should be done to identify children with unsuspected remediable conditions, so that treatment can be offered before educational and social progress is affected. The conditions that are commonly detected in eye screening in school children are refractive errors (myopia, astigmatism and hypermetropia) and amblyopia, apart from other ocular diseases. Refractive errors are common in children and easily correctable, usually with the use of spectacles (Kalikivayi et al, 1997). It is the commonest cause of visual impairment around the world and the second leading cause of treatable blindness (Dandona et al, 2001). According to the 1989 National Blindness Survey, 1.4% of the population of India has social blindness (visual acuity <6/60 in the better eye with best correction) of which 7.35% is caused by uncorrected refractive error (Limburg et al, 1999). Most of the refractive errors can usually be corrected with the use of spectacles or contact lenses (Dandona et al, 1999). School screening programmes have been an established part of the school health service since 1907 and remain universally recommended. These programmes are primarily aimed at detecting amblyopia and refractive errors (Spoward et al, 1998). In this 3-year study, we are presenting the results of the ongoing School Screening programme in the Department of Ophthalmology, Christian Medical College, Ludhiana. INTRODUCTION The importance of early detection and treatment of visual impairment in children is obvious. In most countries school screening programmes are done routinely. The objective of school screening programme is to find cases of refractive errors, amblyopia, strabismus and other ocular diseases. Early correction of refractive error results in a reduction in the number of school children with poor sight (Jensen and Goldschmidt, 1986). Vision defects due to myopia typically appear during school years (Mantyjarvi, 1983). It is the commonest refractive error in school going children and its timely and proper correction saves permanent disability (Chandra et al, 1982). On the other hand, hyperopia also known as hypermetropia can be considered the opposite of myopia in a strict optical sense. The child’s eyecan easily increase its refractive power by 10 or more diopters with accommodation, so that except in rare, extreme degrees of hyperopia, visual acuity remains normal (Greenwald, 2003). Astigmatism is the second commonest refractive cause of reduced vision in childhood. It is optically correctable by cylindrical lenses, which have power that is concentrated in one meridian? (Greenwald, 2003). Amblyopia is reduced visual acuity; even with proper optical correction in one or
PDF Composer - unlicensed versionGet a licence at www.pdf-composer.com
47
both eyes, resulting from altered visual development despite ophthalmoscopically normal retinal and opticnerve anatomy (Rubin & Nelson, 1993). Anisometropia is one of the leading causes of amblyopia (Townsend et al, 1993). In a study done by Dandona et al in 2002 in the rural population of Andhra Pradesh, the prevalence of uncorrected vision was 2.7%. Refractive error was the cause in 61% of the eyes with visual impairment and amblyopia in 12%. Myopia of -0.50D or more was seen in 4.1% of the cases. There was a gradual shift towards myopia with increasing age in both boys and girls. Myopia risk was associated with female gender and having a father with higher level of schooling. Hyperopia of 2D or more was seen in 0.8% of children, with no significant predictors. Prevalence of astigmatism was 2.8%. Another study done by Murthy et al, in the same year in the urban population of New Delhi showed that refractive error was the cause in 81.7% of eyes with visual impairment; amblyopia in 4.4%. Hyperopia accounted for 7.7% of visual impairment. A higher prevalence oh hyperopia was observed in girls in the 11-13 year age group. Prevalence of myopia was 7.4%. Fathers with higher levels of education were more likely to have children with myopia, a finding that was also true in rural India. Incidence of astigmatism was 5.4%. A study done on visual impairment in school children in Southern India by Kalikivayi et al in 1997 revealed prevalence rate of myopia to be 8.6%; hyperopia 22.6%; astigmatism 10.3% and amblyopia to be 1.1%. There are reports on the prevalence of refractive errors from other populations. Population based data concerning the prevalence of visual impairment due to uncorrected refractive errors and ocular diseases in children are not available for India (Kalikivayi et al 1997). MATERIALS AND METHODS This study was done on students aged 5yrs to 15yrs from - randomly selected urban as well as rural schools in and around Ludhiana city , Punjab. Formal permission was taken from the principals of these schools. The list of all the students was taken from the attendance registers along with their age, address, telephone number , parents occupation, and whether they were immigrants or not. All students aged 5-15 yrs (class 1 to 10) in these schools were screened. A detailed ocular history was taken about present and past ocular problems along with history of use of spectacles .Visual acuity unaided and aided (if spectacles were being used by the subject) was a recorded using standard technique for distance and near. The visual status of those children who were already wearing glasses was also assessed for further improvement. Students who were found to have a visual acuity equal to or less than 6/9 were given a letter asking the parents to get their children to the Department of Ophthalmology, Christian Medical College, Ludhiana for further evaluation. At the base hospital, visual acuity was assessed again and a complete eye examination was done. A written consent was taken from the parents for cycloplegic retinoscopy. Post mydriatic refraction was done after one week of cycloplegic retinoscopy and appropriate spectacles were prescribed to the children, as per the protocol. Appropriate statistical methods were employed to assess the data obtained.
PDF Composer - unlicensed versionGet a licence at www.pdf-composer.com
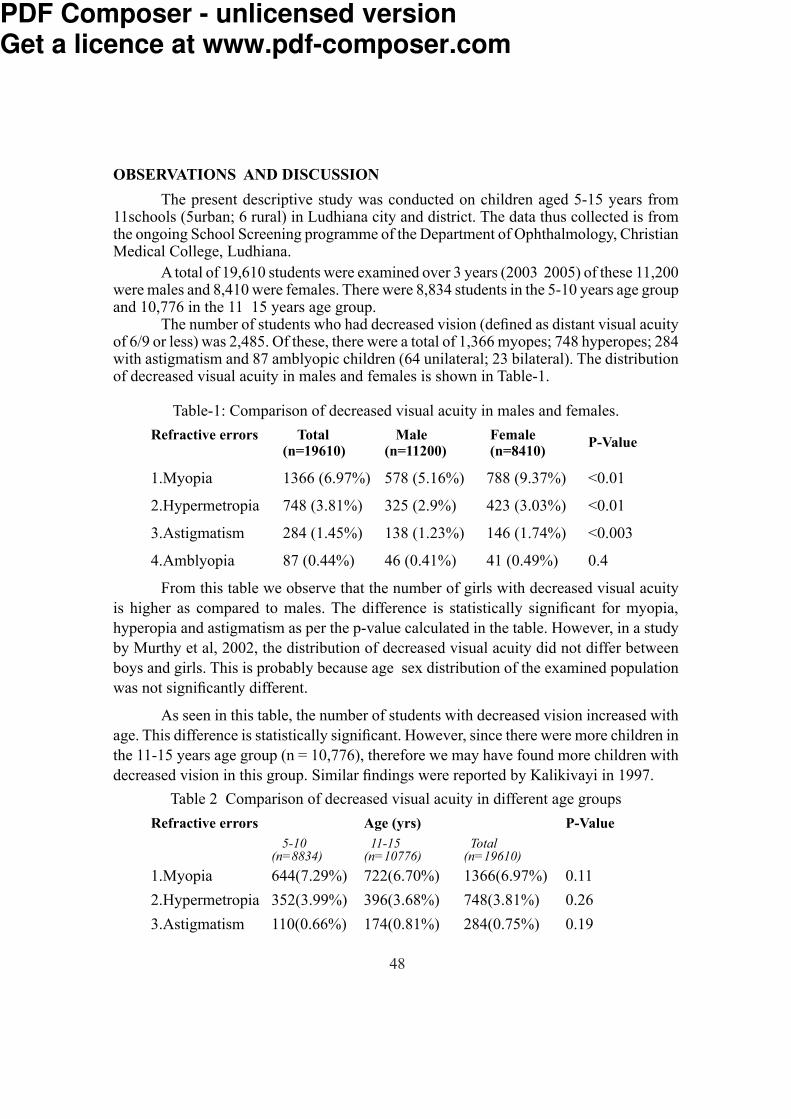
48
OBSERVATIONS AND DISCUSSION The present descriptive study was conducted on children aged 5-15 years from 11schools (5urban; 6 rural) in Ludhiana city and district. The data thus collected is from the ongoing School Screening programme of the Department of Ophthalmology, Christian Medical College, Ludhiana. A total of 19,610 students were examined over 3 years (2003 2005) of these 11,200 were males and 8,410 were females. There were 8,834 students in the 5-10 years age group and 10,776 in the 11 15 years age group. The number of students who had decreased vision (defined as distant visual acuity of 6/9 or less) was 2,485. Of these, there were a total of 1,366 myopes; 748 hyperopes; 284 with astigmatism and 87 amblyopic children (64 unilateral; 23 bilateral). The distribution of decreased visual acuity in males and females is shown in Table-1.
Table-1: Comparison of decreased visual acuity in males and females.Refractive errors Total Male Female P-Value (n=19610) (n=11200) (n=8410) 1.Myopia 1366 (6.97%) 578 (5.16%) 788 (9.37%) <0.012.Hypermetropia 748 (3.81%) 325 (2.9%) 423 (3.03%) <0.013.Astigmatism 284 (1.45%) 138 (1.23%) 146 (1.74%) <0.0034.Amblyopia 87 (0.44%) 46 (0.41%) 41 (0.49%) 0.4
From this table we observe that the number of girls with decreased visual acuity is higher as compared to males. The difference is statistically significant for myopia, hyperopia and astigmatism as per the p-value calculated in the table. However, in a study by Murthy et al, 2002, the distribution of decreased visual acuity did not differ between boys and girls. This is probably because age sex distribution of the examined population was not significantly different. As seen in this table, the number of students with decreased vision increased with age. This difference is statistically significant. However, since there were more children in the 11-15 years age group (n = 10,776), therefore we may have found more children with decreased vision in this group. Similar findings were reported by Kalikivayi in 1997.
Table 2 Comparison of decreased visual acuity in different age groups Refractive errors Age (yrs) P-Value 5-10 11-15 Total (n=8834) (n=10776) (n=19610)1.Myopia 644(7.29%) 722(6.70%) 1366(6.97%) 0.112.Hypermetropia 352(3.99%) 396(3.68%) 748(3.81%) 0.263.Astigmatism 110(0.66%) 174(0.81%) 284(0.75%) 0.19
PDF Composer - unlicensed versionGet a licence at www.pdf-composer.com
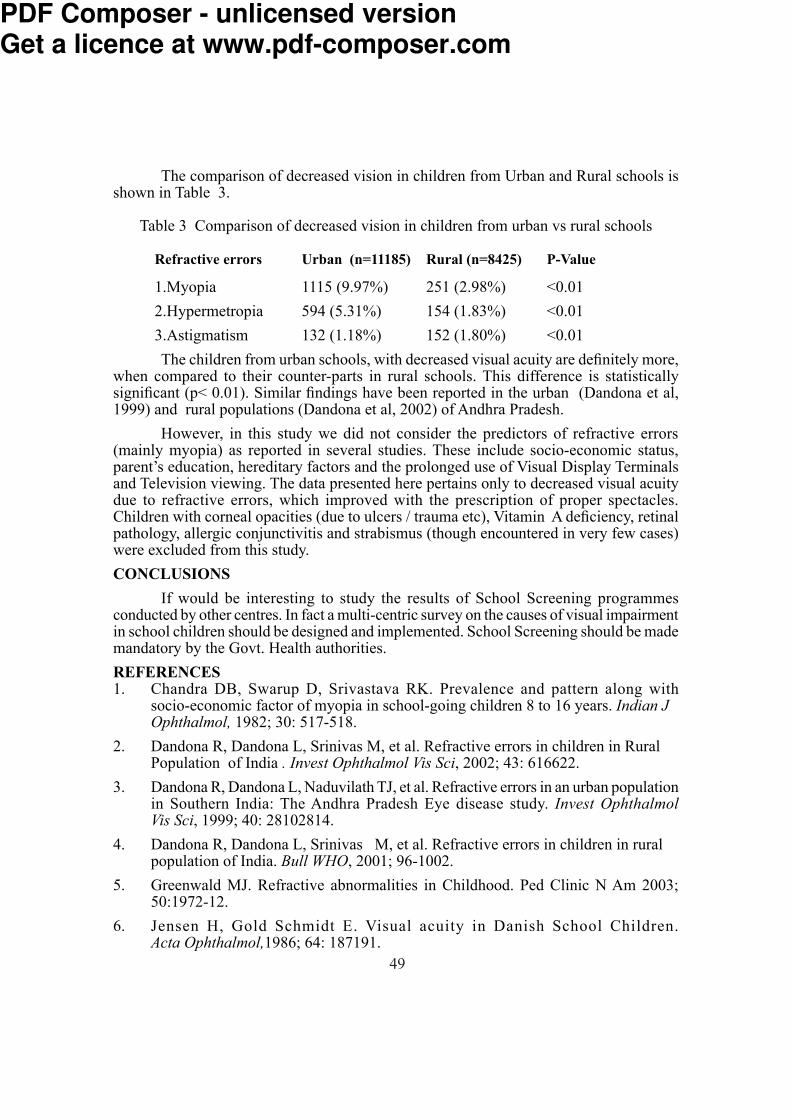
49
The comparison of decreased vision in children from Urban and Rural schools is shown in Table 3.Table 3 Comparison of decreased vision in children from urban vs rural schools
Refractive errors Urban (n=11185) Rural (n=8425) P-Value1.Myopia 1115 (9.97%) 251 (2.98%) <0.012.Hypermetropia 594 (5.31%) 154 (1.83%) <0.013.Astigmatism 132 (1.18%) 152 (1.80%) <0.01
The children from urban schools, with decreased visual acuity are definitely more, when compared to their counter-parts in rural schools. This difference is statistically significant (p< 0.01). Similar findings have been reported in the urban (Dandona et al, 1999) and rural populations (Dandona et al, 2002) of Andhra Pradesh. However, in this study we did not consider the predictors of refractive errors (mainly myopia) as reported in several studies. These include socio-economic status, parent’s education, hereditary factors and the prolonged use of Visual Display Terminals and Television viewing. The data presented here pertains only to decreased visual acuity due to refractive errors, which improved with the prescription of proper spectacles. Children with corneal opacities (due to ulcers / trauma etc), Vitamin A deficiency, retinal pathology, allergic conjunctivitis and strabismus (though encountered in very few cases) were excluded from this study.CONCLUSIONS If would be interesting to study the results of School Screening programmes conducted by other centres. In fact a multi-centric survey on the causes of visual impairment in school children should be designed and implemented. School Screening should be made mandatory by the Govt. Health authorities. REFERENCES1. Chandra DB, Swarup D, Srivastava RK. Prevalence and pattern along with socio-economic factor of myopia in school-going children 8 to 16 years. Indian J Ophthalmol, 1982; 30: 517-518. 2. Dandona R, Dandona L, Srinivas M, et al. Refractive errors in children in Rural Population of India . Invest Ophthalmol Vis Sci, 2002; 43: 616622.3. Dandona R, Dandona L, Naduvilath TJ, et al. Refractive errors in an urban population in Southern India: The Andhra Pradesh Eye disease study. Invest Ophthalmol Vis Sci, 1999; 40: 28102814.4. Dandona R, Dandona L, Srinivas M, et al. Refractive errors in children in rural population of India. Bull WHO, 2001; 96-1002.5. Greenwald MJ. Refractive abnormalities in Childhood. Ped Clinic N Am 2003; 50:1972-12.6. Jensen H, Gold Schmidt E. Visual acuity in Danish School Children. Acta Ophthalmol,1986; 64: 187191.
PDF Composer - unlicensed versionGet a licence at www.pdf-composer.com

50
7. Kalikivayi V, Opt B, Naduvilath TJ, et al. Visual impairment in school children in Southern India . Indian J Ophthalmol, 1997; 45: 129134.8. Limburg H, Kansara HT, D’ Souza S. Results of School eye screening of 5.4 Million children in India a 5 year follow up study. Acta Ophthalmol Scand, 1999; 77: 310314. 9. Murthy GVS, Gupta SK, Ellwein LB, et al. Refractive error in children in an urban population in New Delhi . Invest Ophthalmol Vis Sci, 2002; 43: 623631. 10. Rubin SE, Nelson LB. Amblyopia Diagnosis and management. Ped Clinic N Am, 1993; 40: 727735. 11. Spoward KM Simmers A, Tappin DM. Vision testing in school: an evaluation of personnel, tests and premises. J Med Screening, 1998; 5: 131 132.12. Townshend AM, Holmes JM, Evans LS. Depth of Anisometropic Amblyopia and difference in refraction. Am J Ophthalmol, 1993; 116: 431436.
PDF Composer - unlicensed versionGet a licence at www.pdf-composer.com
51
Original ArticleClinical profile of Attempted Suicide in Elderly compared to Adolescent group
Ambali AP and Bidri RCDepartment of MedicineShri. B. M. Patil Medical College Hospital & Research Centre, Bijapur
INTRODUCTIONEldery people have a higher risk of completed Suicide than any other age group
worldwide.1 Among the dismal statistics; overall elderly accounts for 11percent of the population and 17percent of all suicides.2 A universal finding is the strong association with psychiatric illness, particularly depression. The prevalence of suicidal feelings in mentally healthy elderly people has been reported to be as low as 4%.3 Suicide attempts in elderly is characterized by less warning, higher lethality, and greater prevalence of depression and physical illness. Among people who deliberately harm themselves, the elderly attempt suicide less often than younger people, but trend to succeed more often in their first attempt.4
In adolescent age group, self inflicted injuries are fourth leading cause of death in the world. 5 The risk factors that contribute to suicidal idea are fundamentally different in both age groups. 6 In western countries, violent methods like hanging are preferred by elderly 7 while violent and nonviolent methods are preferred by adolescents. In India, adolescents also prefer violent methods like hanging, next to poisoning 8, while less or no data available regarding elderly population.
The reasons to end life varies from Psychological, Environmental factor and medical illness. Also they differ in Adolescent and Elderly age group. Crisis such as death of a loved ones, retirement, and one’s own physical decline contribute to attempt suicide in older people.9 Decreased social support and social isolation are generally associated with increased suicidal feelings in elderly people.10 Depressive disorder is common in elderly who attempt suicide or complete the act at time of death.11 The risk and rate of Suicide is significantly increased in people suffering from HIV infection.12
In Indian context, suicide attempts in elderly is least reported or most of studies does not include elderly population or may be the incidence is low in Indian elderly population.
This study explores the incidence of attempt suicide in elderly population in this part of India, and has compared the results with adolescent age group, with interesting results.
PDF Composer - unlicensed versionGet a licence at www.pdf-composer.com
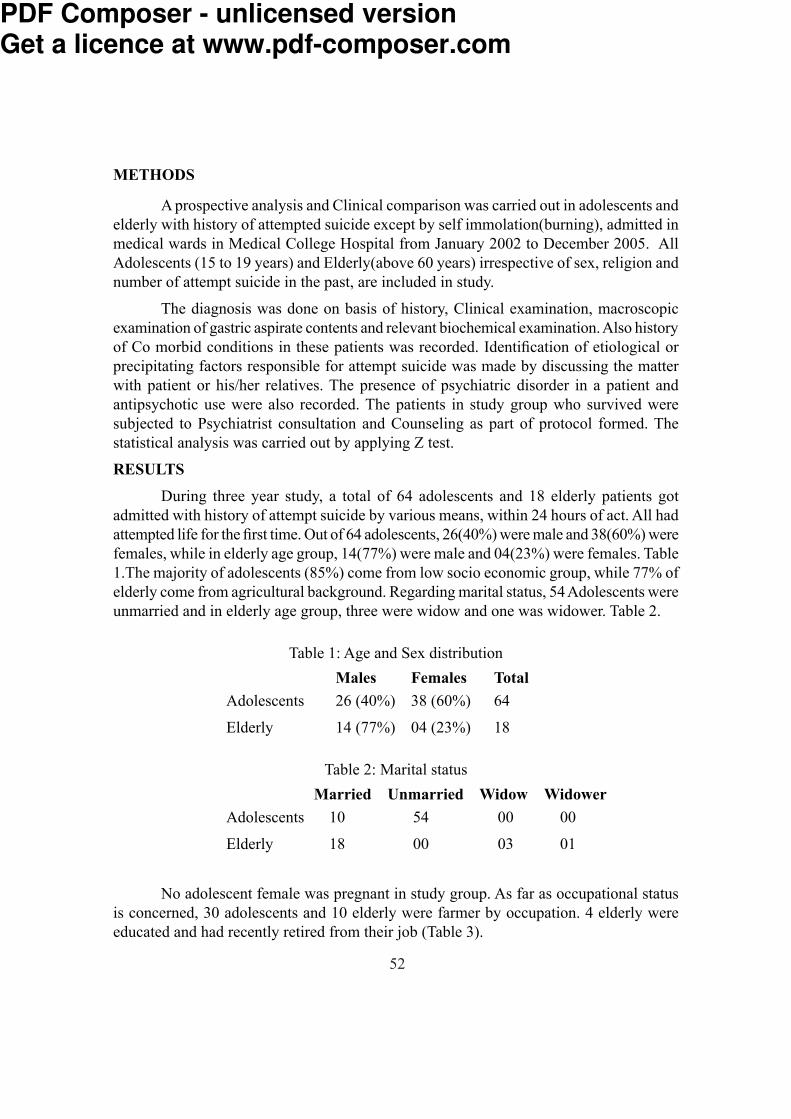
52
METHODSA prospective analysis and Clinical comparison was carried out in adolescents and
elderly with history of attempted suicide except by self immolation(burning), admitted in medical wards in Medical College Hospital from January 2002 to December 2005. All Adolescents (15 to 19 years) and Elderly(above 60 years) irrespective of sex, religion and number of attempt suicide in the past, are included in study.
The diagnosis was done on basis of history, Clinical examination, macroscopic examination of gastric aspirate contents and relevant biochemical examination. Also history of Co morbid conditions in these patients was recorded. Identification of etiological or precipitating factors responsible for attempt suicide was made by discussing the matter with patient or his/her relatives. The presence of psychiatric disorder in a patient and antipsychotic use were also recorded. The patients in study group who survived were subjected to Psychiatrist consultation and Counseling as part of protocol formed. The statistical analysis was carried out by applying Z test.RESULTS
During three year study, a total of 64 adolescents and 18 elderly patients got admitted with history of attempt suicide by various means, within 24 hours of act. All had attempted life for the first time. Out of 64 adolescents, 26(40%) were male and 38(60%) were females, while in elderly age group, 14(77%) were male and 04(23%) were females. Table 1.The majority of adolescents (85%) come from low socio economic group, while 77% of elderly come from agricultural background. Regarding marital status, 54 Adolescents were unmarried and in elderly age group, three were widow and one was widower. Table 2.
Table 1: Age and Sex distribution Males Females TotalAdolescents 26 (40%) 38 (60%) 64Elderly 14 (77%) 04 (23%) 18
Table 2: Marital status Married Unmarried Widow Widower
Adolescents 10 54 00 00Elderly 18 00 03 01
No adolescent female was pregnant in study group. As far as occupational status is concerned, 30 adolescents and 10 elderly were farmer by occupation. 4 elderly were educated and had recently retired from their job (Table 3).
PDF Composer - unlicensed versionGet a licence at www.pdf-composer.com

53
The means to end life differed in both age groups. Adolescent had preferred for both violent (hanging) and non violent (poisoning) methods, where as elderly preferred only non violent methods (Table 4).
Table 3: Occupational status Student Farmer House wife Retired officer
Adolescents 24 30 10 00Elderly 00 10 04 04
Table 4: Mode of attempted suicide Pesticides Drug over dosage Hanging
Adolescents 57 (89.5%) 06 (9%) 01(1.5%)Elderly 15 (83%) 03 (17%) 00 P-0.5 NS P-0.4 NS P-0.6 NS
Also 33% of elderly and 2% of adolescent were suffering from Psychiatric illness, and taking anti psychotic drugs at time of admission. This group of patients preferred the same drugs in overdosage as means to end life. Table 5. When interviewed to know the cause to attempt life, the reasons were different in both age groups. Table 6. Loss in business due to drought, physical suffering, loss of loved ones were common reasons in elderly age group, while simple quarrel in house was reason to end life in adolescent age group.14 adolescents didn’t wish to reason the cause. One elderly detected HIV infection, tried to end life.
Table 5: Psychiatric Co Morbidity Adolescents Elderly
Known case 03 06 (33%)Detected at discharge 02 04 (22%)Psychiatry opinion not possible (death) 03 04
The mortality rate was high in elderly (27%) compared to adolescents (4.6%). Table 7. Respiratory failure and upper gastrointestinal bleed were common cause of death.
Table 6: Reason to end lifeElderly Adolescents
Loss in business- 08 Quarrel in house 16 Physical illness- 06 Not to reason 14Loss of loved ones- 03 Love failure 10HIV positive- 01 Loss of parents- 10 Exam failure- 09 Psychiatric illness- 05
PDF Composer - unlicensed versionGet a licence at www.pdf-composer.com

54
Table 7: Comparision of elderly & adolescent and the outcome. Total Deaths %Adolescents 64 03 4.6%Elderly 18 05 27% P <0.005
DISCUSSION According to WHO estimates in year 2000,there was one attempted suicide every 3 second world wide.13 It is common myth that suicidal ideation decreases with ageing, but if older people have suicidal thoughts they are at high risk of actually committing suicide than younger people. 14 Adolescents attempting suicide is a major health problem. The average suicide rates among adolescents in developing countries is about 50 70 times higher for girls and about 4 times higher for boys than the rates in USA and UK.15.24.
The number of male attempting suicide out numbered female in elderly age group in this study. Conwell et al 16 and Harwood et al 11 showed similar male predominance. In adolescent age group,females outnumbered males in our study. Similar observation noted by P.N.Sureshkumar 17 and Joseph 18.
Rita Aaron 8 showed equal sex ratio in developing countries. In our study 44% elderly attempted suicide due to loss in business. Agriculture being main source of income in this area, frequent drought, and subsequent crop failure makes people vulnerable to end life. While 25% of adolescents attempted suicide due to family conflicts,15% due to losing their parents and another 15% due to love failure. This is in line reported by Rita Aaron et al. 8
Regarding occupational status, 46% in adolescent and 55% in elderly age group come from agricultural background, and they reside in rural areas, have easy access to pesticides stored in their house. Abeysinge RM 19 in his study revealed that farmers in developing countries keep their own supply of pesticides, commonly within, or close, to the household. 22% in elderly age group were ex professionals. Murphy (1986) 20 has 10% ex professionals in their study.
In elderly group, 33% had depressive disorder at time of admission and were on anti depressants, while 22% were diagnosed having depression at time of discharge. Cattell and Jolley 21 found that 60% of their sample was clinically depressed, while Harwood et al 11 found that 77% of their elderly suicide sample suffered from a Psychiatric disorder. 16% attempted suicide in view of being widow or widower. The association of widowhood with elderly suicide is already well recognized. 22% in elderly group in this study were in widowhood. Cattell and Jolly, 21 and Kelly and Bunting, 22 had higher rate of widowhood in their series. 84% of adolescents were unmarried. This can be explained as the age limit for marriage is above18 years.
PDF Composer - unlicensed versionGet a licence at www.pdf-composer.com

55
As far as methods to end life are concerned, 100% elderly preferred non violent methods like drug overdosage and insecticide poisoning. This is in contrast with western reports where elderly prefer violent methods like hanging and fire arms. Hanging was preferred in 26% of elderly in series by Harwood et al. 11 Pesticides are easily available in most of the houses , hence elderly preferred it as means to end life in this study. Out of 33% elderly who were on Anti Psychotics, 17% preferred to self poison with same drugs. Cattell and Jolley 21 series have shown higher rates of 44% of self poisoning with drugs already taking. In adolescent age group, majority (89.5%) preferred non violent methods in this study.Pesticides are easily available to this group also. While Rita Aaron 8 reported 44% of their cases preferred hanging as mean to end life.
The overall mortality is very high in elderly group (22%) with significant P value, compared to 4.6% in adolescent group. Jason Hepple and Catherine Quinton 23 showed high mortality rates in elderly, in their series.AKNOWLEDGEMENT I thank Dr Medha Rao for her guidance, Professor Yadrami, statistician, and I am indebt to all patients in this study group.REFERENCES1. WHO, 2002.www.who.int/Mental_health/Prevention/Suicide (2004).2. Thomas P.: Depressed elderly’s best hope. Medical World News.13 July 1987.3. Kriby M et al.: Hopelessness and suicide ideation among the community dwelling
elderly in Dublin. Ir J Psychol Med, 1997; 14:124-74. De Leo et al.: Attempted suicide and completed suicide in older subjects. Int. J
Geriatr Psychiatry, 2001; 16:300-16.5. WHO, 1999.Injury: a leading cause of global burden of disease. Geneva WHO, 1999
document. WHO/HSC/PVI/9911.6. Tadros G, and Salib E.: Suicide within 12 months of contact with mental health
service. Elderly people should be regarded as a separate group. Br Med J, 1999; 319:1434.
7. Salib et al.: Elderly suicide: An analysis of coroner’s insights in to two hundred cases in che shine.1989-2001. Med Sci Law, 2005; 5 (1):71-80.
8. Rita Aaron et al.: Suicides in young people in rural Southern India. Lancet, 2004; 363:1117-1118.
9. Blumenthal SJ: An overview of suicide risk factor research. Presented at the annual meeting of the ‘American Psychiatric Association’, Los Angeles, May 1984.
10. Rubenowith E et al.: Life events and Psychosocial factors in elderly suicides -case -control study. Psychol Med, 2001:31:1193-202.
PDF Composer - unlicensed versionGet a licence at www.pdf-composer.com
56
11. Harwood D et al.: Psychiatric disorder and personality factors associated with suicide in older people: A desprictive and case control study. Int J Geriatric Psyhiatry, 2001; 16:155-65.
12. Marzuk PM,Tierney H, Tardiff EB et al: increased risk of suicide in persons with AIDS. JAMA, 1988; 259:1333-1337.
13. WHO. Figures and facts about suicide. Geneva1999.14. Mc Clure GM.Suicide in children and adolescents in England and Wales 1970-1998.
Br J Psychiatry, 2001; 178:469-74.15. Gould MS et al. Youth suicide risk and preventable interventions: a review of the past 10 years. J.Am Acad Child Adolesc Psychiatry, 2003; 42:386-40516. Conwell Y et al.: Relation ship of age and diagnosis in victims of completed
suicide. A Psychological Autopsy Study. Am.J.Psychiatry, 2001; 153:1001-8.17. P.N.Suresh kumar: An analysis of suicide attempters versus completers in Kerala.
Indian J Psychiatry, 2004; 46(2)144-149.18. Joseph A et al. ;Evaluation of suicide rates in rural India using verbal autopsies,1994-
9.Br Med J, 2003;326:1121-22.19. Abeysinghe RM.: A study of pesticide poisoning in an agricultural community.
‘MSc Community Medicine Thesis’, University of Colombo 1992.20. Murphy E. (1986): Affective disorders in the Elderly.London.Churchill
Livingstone.21. Cattell H.and Jolley D.J.: One hundred cases of suicide in elderly people.
Br.J.Psychiatry, 1995; 166:451-7.22. Kelly S, and Bunting J.: Trends in suicide in England and Wales (1982-1996).
Population Trends 1998; 92:29-41.23. Jason Hepple and Catherine Quinton.: One hundred cases of attempted suicide in
the elderly. Br J Psychiatry, 1997; 171:42-46.24. Conwell Y et al.: Age differences in behaviours leading to completed suicide. Am J
Geriatr Psychiatry, 1998; 6:122-26.
PDF Composer - unlicensed versionGet a licence at www.pdf-composer.com

57
Mini ReveiwFluoride A double edged sword
B B Devaranavadgi, Satishkumar D & Chandrakanth K HDepartment of Biochemistry
Shri. B. M. Patil Medical College Hospital & Research Centre, Bijapur
INTRODUCTION Fluorine is the most electronegative of all chemical elements and is therefore never encountered in nature in the elemental form. Combined chemically in the form of fluorides, fluorine is the 17th in order of frequency of all the elements, representing about 0.06 0.09% of the earth’s crust.Fluoride in rocks and soil In rock and soil, fluorine may occure in combined form in a wide variety of minerals, including fluorspar,cryolite, apatite, mica, hornblende and a number of pegmatites such as topaz and tourmaline. Volcanic and hypabyssal rocks, as well as salts deposits of marine origin also contain significant amounts of fluoride up to 2500mg/kg. . The availability of free fluoride ions in the soil is governed by the natural solubility, acidity of the soil, the presence of other minerals or chemical compounds and the amount of water present. The fluoride concentration in soil increases with depth and decreases relatively as we go to high mountain areas. Owing to the constant erosion of the mountains, the fluoride is removed and transferred to a lower plateau or to the sea via streams or rivers, which is probably the reason why sea water has a relatively high fluoride content (1-1.4mg/litre) (1).Fluorides in water Owing to the universal presence of fluorides in the earth’s crust, all water contains fluorides in varying concentrations. Sea water contains significant quantities of fluoride at levels of 0.8 1.4mg/kg where as water obtained from lakes, rivers, well is below 0.5mg/kg. Water trapped in sediments, thermal water associated with volcanoes and epithermal mineral deposits usually have fluoride levels of 3-6mg/kg. (2)Fluorides in air Fluoride is widely distributed in the atmosphere originating from the dusts of fluoride containing soils, gaseous industrial wastes, burning of coal fires and gases emitted in areas of volcanic activity. The fluoride content in the air surrounding some factories can reach levels as high as 1.4mg of Fluoride per m3 and in the neighbourhood of such factories levels in of 0.2mg of Fluoride-per m3 may be attained.In non industrial areas, its level is found to be from 0.05 to 1.90mg of Fluoride per m3.
PDF Composer - unlicensed versionGet a licence at www.pdf-composer.com

58
Fluoride ingestion by man fluoride in solid food There does not appear to be a relationship between the fluoride content of most plants and that of the water or soil in the locality. However plants grown in acidic soil generally have higher fluoride concentrations. Vegetables and fruits that are consumed by man normally have fluoride contents of the order of 0.1-0.4mg/kg and are therefore of little concern. However surprisingly high levels of fluoride have been found in cereals. Tea leaves also contain rather high levels of fluoride. The fluoride content of meat is low (o-2-1.0mg/kg) except for chicken, meat. The meals of fish are relatively low in fluoride content. However, even with relatively high fish consumption in a mixed diet, the fluoride intake from fish alone would seldom exceed 0.2 mg of Fluoride - per day. There is a great variation in the daily intake of fluorides from solid food (0.2-3.4mg/day/person) have been reported, depending upon the composition of the diet and the fluoride content of the water in which the food has been prepared.Fluorides in drinks Drinking water is commonly the largest single contributor to the daily fluoride intake. The fluoride intake from water will depend upon (1) The fluoride concentration of the water (2) The age of the person (3) climatic condition (4) dietary habits. Human breast milk has a low fluoride content, less than 0.02mg/litre, cow’s milk it is re[ported to be 0.02 0.05mg/litre, Tea will have fluoride concentration of 0.5 1.5mg/litre. Fresh fruit juices have low fluoride content from 0.1 to 0.3mg/litre. Beer is normally low in fluorides ranging from 0.3 to 0.8mg/litre, in contrast to wine which can have fluoride levels of the order of 6-8mg/litre.Fluoride intake from the air The range of fluoride in air in non-industrial areas has been found to be from 0.05 to 1.89mg/m3. Since an individual inhale about 20 m3 of air per day. Heavy dust pollution from special industrial plants, airborne fluorides can be the main contributor to the occurance of dental fluorosis or even skeletal fluorosis.Total intake of fluorides by man The available data indicate that total daily intake by individuals varies from country to country. Although there is no consensus as to the maximum safe daily dosage of fluoride, total intake of between 0.05 to 0.07mg of fluoride per kg body weight has been suggested as optimum. On the basis of extensive analysis reported by several authors, the total daily fluoride intake may vary from 0.2mg of fluoride per day in infants & 5.0mg of fluoride per day in adults (4).FLUORIDE METABOLISMFluoride absorption in man Fluoride is passively absorbed mainly from stomach. Maximum plasma fluoride concentration following oral intake on a fasting stomach is reached within 30 minutes, when
PDF Composer - unlicensed versionGet a licence at www.pdf-composer.com
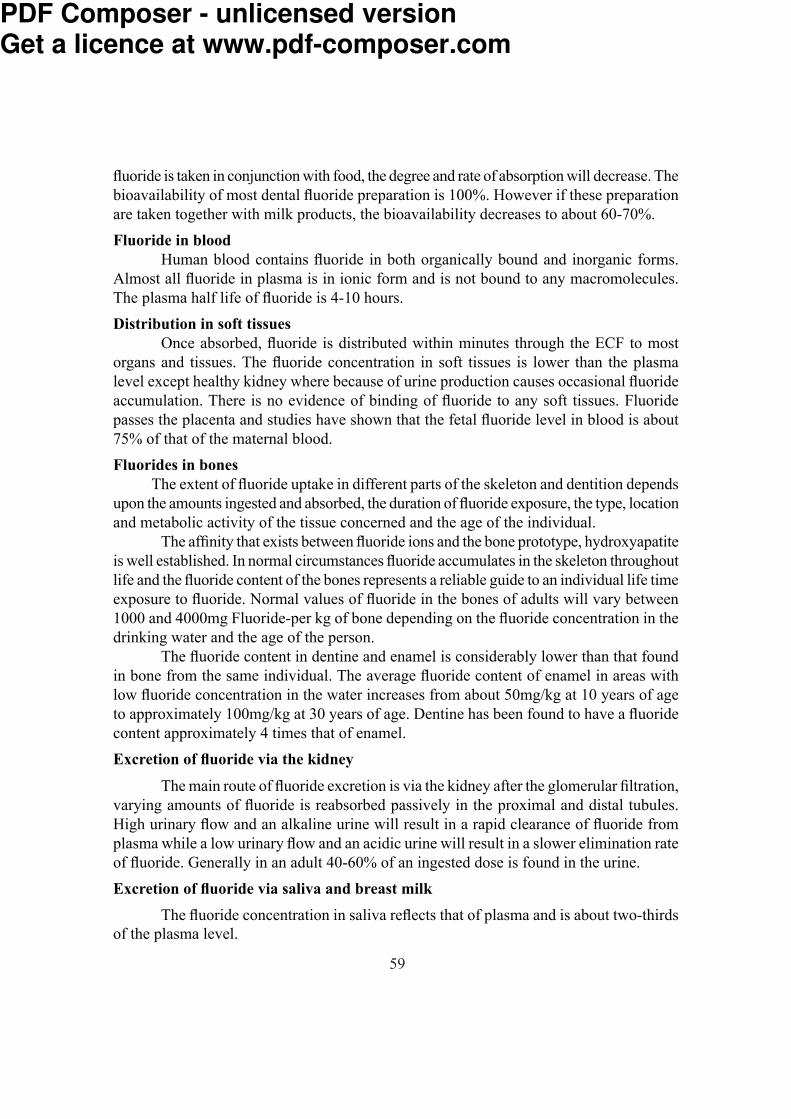
59
fluoride is taken in conjunction with food, the degree and rate of absorption will decrease. The bioavailability of most dental fluoride preparation is 100%. However if these preparation are taken together with milk products, the bioavailability decreases to about 60-70%.Fluoride in blood Human blood contains fluoride in both organically bound and inorganic forms. Almost all fluoride in plasma is in ionic form and is not bound to any macromolecules. The plasma half life of fluoride is 4-10 hours.Distribution in soft tissues Once absorbed, fluoride is distributed within minutes through the ECF to most organs and tissues. The fluoride concentration in soft tissues is lower than the plasma level except healthy kidney where because of urine production causes occasional fluoride accumulation. There is no evidence of binding of fluoride to any soft tissues. Fluoride passes the placenta and studies have shown that the fetal fluoride level in blood is about 75% of that of the maternal blood.Fluorides in bones The extent of fluoride uptake in different parts of the skeleton and dentition depends upon the amounts ingested and absorbed, the duration of fluoride exposure, the type, location and metabolic activity of the tissue concerned and the age of the individual. The affinity that exists between fluoride ions and the bone prototype, hydroxyapatite is well established. In normal circumstances fluoride accumulates in the skeleton throughout life and the fluoride content of the bones represents a reliable guide to an individual life time exposure to fluoride. Normal values of fluoride in the bones of adults will vary between 1000 and 4000mg Fluoride-per kg of bone depending on the fluoride concentration in the drinking water and the age of the person. The fluoride content in dentine and enamel is considerably lower than that found in bone from the same individual. The average fluoride content of enamel in areas with low fluoride concentration in the water increases from about 50mg/kg at 10 years of age to approximately 100mg/kg at 30 years of age. Dentine has been found to have a fluoride content approximately 4 times that of enamel.Excretion of fluoride via the kidney The main route of fluoride excretion is via the kidney after the glomerular filtration, varying amounts of fluoride is reabsorbed passively in the proximal and distal tubules. High urinary flow and an alkaline urine will result in a rapid clearance of fluoride from plasma while a low urinary flow and an acidic urine will result in a slower elimination rate of fluoride. Generally in an adult 40-60% of an ingested dose is found in the urine.Excretion of fluoride via saliva and breast milk The fluoride concentration in saliva reflects that of plasma and is about two-thirds of the plasma level.
PDF Composer - unlicensed versionGet a licence at www.pdf-composer.com

60
There is a limited transfer of fluoride from blood to breast milk.Deficiency and Toxicity When fluorine content is lower than 0.5 parts per one million parts (0.5 ppm) of drinking water, particularly infants and children suffer from dental caries. In this fluoride deficiency disease, the dental enamel decays and gets eroded due to acids produced on tooth surface by bacterial fermentation of food remnants. Certain bacteria which are normal inhabitants of the oral cavity and which act on dietary carbohydrates and convert them into lactic acid. The latter corrodes the enamel of the teeth and produces cavities. This leads to the exposure of dental pulp resulting in inflammation of inner tissues and toothache. Addition of very little fluoride to the drinking water, topical application of a very dilute fluoride solution or the regular use of fluoridated toothpaste prevents dental caries and maintains the normal dental enamel. For exerting this cariostatic effect.Fluoride first diffuses into the hydration layer around calcium hydroxyapatie crystal on the enamel surface and then gets incorporated in the calcium apatite crystals in exchange of their anions to form calcium fluorapatite crystals which harden and protect the enamel surface from bacterial attack. However fluoride does not seem to be cariostatic for permanent teeth. On the contrary dental fluorosis may result from fluoride toxicity, particularly in infants and children, if fluoride concentration exceeds 1.2 ppm in drinking water. In this disease fluoride content is increased and calcium deposition is reduced in enamel and dentin and new permanent teeth show a mottling of enamel, the enamel gets discoloured, corroded, stratified and pitted. Still higher fluoride intake mottles the enamel even in deciduous teeth and produce abnormalities in teeth eruption. A trace of fluoride in food or drinking water has a catalytic effect on the formation of calcium apatites in bones, enhances thereby the retention of calcium, and phosphates, stimulates osteoblast activity, hardens the bones and prevents old age osteoporosis. On the contrary skeletal fluorosis affects the bones if fluoride intake is high (more than 20ppm). Fluoride accumulation in bones leads to abnormal and irregular calcium deposition resulting in alternate dense and denuded patches of osteosclerosis and osteoporosis calcification of tendons and ligaments, even brittleness of bones due to weak bone matrix and even osteomalacia. Fluorosis is endemic in patiala, Karnataka and Nalgonda. (Andhra Pradesh)REFERENCES1. National Research Council, Biological effects of atmospheric pollutants: Fluorides.
Washington, DC, National Academy of Sciences 1971, PP. 369-400, 433-435, 474-487.
2. World health organization, fluorides and human health, Geneva. 1970 (WHO monograph series No. 59)
3. Leverett.D.H. Fluorides and changing prevalence of dental caries science, 217: 26- 30 (1982).
4. Myers.H.M. Fluorides and Dental Fluorsis, Basel, Karger, 1978.
PDF Composer - unlicensed versionGet a licence at www.pdf-composer.com

61
Case ReportPrimary Transitional Cell Carcinoma of Ureter and Bladder
-A Rare Case ReportTophakhane MR , Arakeri SU & Yelikar BR
Department of PathologyShri. B.M.Patil Medical College and Research Centre, Bijapur.
Abstract Transitional cell carcinoma of ureter is rare constituting to 1% of tumors of
upper urinary tract and 2% of all urothelial neoplasms. We are presenting a rare case of primary Transitional cell carcinoma of ureter and bladder in a 74 year male patient who presented with complaints of hematuria. CT scan showed growth in the left lower ureter. Nephroureterectomy was done and diagnosis of high grade TCC of ureter and bladder was given. INTRODUCTION
Transitional cell carcinoma of ureter is rare constituting to 1% of tumors of upper urinary tract and 2% of all urothelial neoplasms. Peak age incidence 6th -7th decade. M: F 3:1 60-70% involve the lower third of ureter. Occupational exposure to dye stuff, rubber, cigarette smoking, analgesics, cyclophosphamide are important etiological factors.1,2,3Case summary:
A 74 yrs old male patient complains of intermittent painless hematuria since 3 months. He was a farmer by occupation and a chronic smoker. His Physical examination and vital parameters are within normal limits. Following investigations were carried out:
1. Ultrasound abdomen Left hydronephrosis with hydroureter.2. Intravenous pyelogram Non visualization of left kidney3. CT scan Growth in left lower ureter.4. Cystoscopy Multiple small papillary structures in bladder with growth in left lower ureter.
Left nephroureterectomy with bladder cuff removal was done and specimen sent for histopathological study.Gross features: Nephroureterectomy specimen with bladder cuff. Kidney measures 8x4x3cm External surface Bosselated with areas of congestion Cut surface Dilated pelvis and calyces with total obliteration of pyramids
PDF Composer - unlicensed versionGet a licence at www.pdf-composer.com
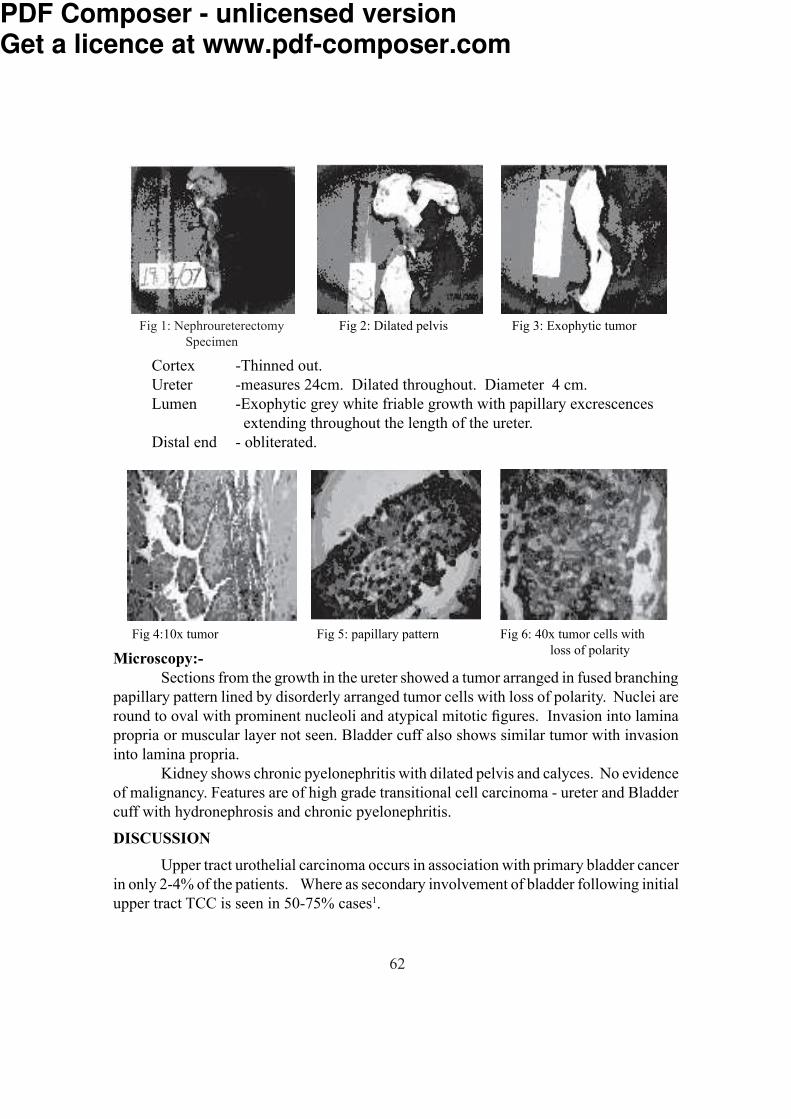
62
Cortex -Thinned out. Ureter -measures 24cm. Dilated throughout. Diameter 4 cm. Lumen -Exophytic grey white friable growth with papillary excrescences extending throughout the length of the ureter. Distal end - obliterated.
Microscopy:- Sections from the growth in the ureter showed a tumor arranged in fused branching papillary pattern lined by disorderly arranged tumor cells with loss of polarity. Nuclei are round to oval with prominent nucleoli and atypical mitotic figures. Invasion into lamina propria or muscular layer not seen. Bladder cuff also shows similar tumor with invasion into lamina propria. Kidney shows chronic pyelonephritis with dilated pelvis and calyces. No evidence of malignancy. Features are of high grade transitional cell carcinoma - ureter and Bladder cuff with hydronephrosis and chronic pyelonephritis.DISCUSSION Upper tract urothelial carcinoma occurs in association with primary bladder cancer in only 2-4% of the patients. Where as secondary involvement of bladder following initial upper tract TCC is seen in 50-75% cases1.
Fig 4:10x tumor Fig 5: papillary pattern Fig 6: 40x tumor cells with loss of polarity
Fig 2: Dilated pelvis Fig 3: Exophytic tumorFig 1: Nephroureterectomy Specimen
PDF Composer - unlicensed versionGet a licence at www.pdf-composer.com
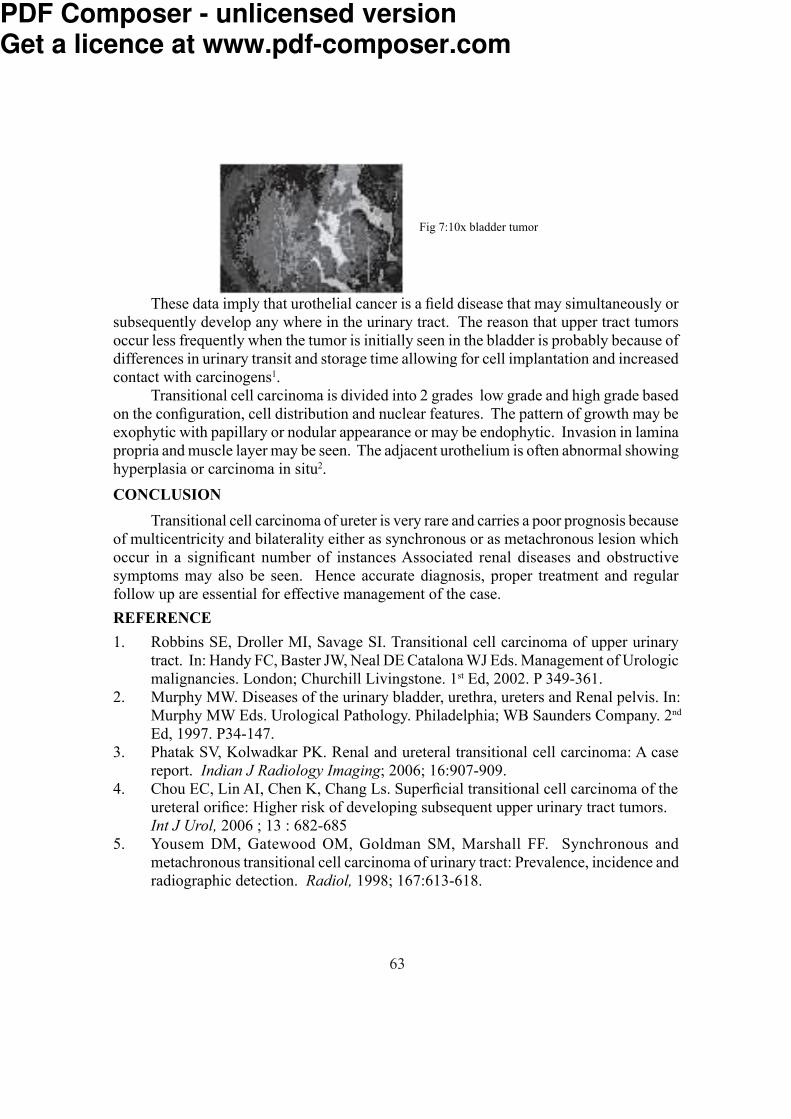
63
These data imply that urothelial cancer is a field disease that may simultaneously or subsequently develop any where in the urinary tract. The reason that upper tract tumors occur less frequently when the tumor is initially seen in the bladder is probably because of differences in urinary transit and storage time allowing for cell implantation and increased contact with carcinogens1.Transitional cell carcinoma is divided into 2 grades low grade and high grade based on the configuration, cell distribution and nuclear features. The pattern of growth may be exophytic with papillary or nodular appearance or may be endophytic. Invasion in lamina propria and muscle layer may be seen. The adjacent urothelium is often abnormal showing hyperplasia or carcinoma in situ2.CONCLUSION
Transitional cell carcinoma of ureter is very rare and carries a poor prognosis because of multicentricity and bilaterality either as synchronous or as metachronous lesion which occur in a significant number of instances Associated renal diseases and obstructive symptoms may also be seen. Hence accurate diagnosis, proper treatment and regular follow up are essential for effective management of the case.REFERENCE 1. Robbins SE, Droller MI, Savage SI. Transitional cell carcinoma of upper urinary tract. In: Handy FC, Baster JW, Neal DE Catalona WJ Eds. Management of Urologic malignancies. London; Churchill Livingstone. 1st Ed, 2002. P 349-361.2. Murphy MW. Diseases of the urinary bladder, urethra, ureters and Renal pelvis. In: Murphy MW Eds. Urological Pathology. Philadelphia; WB Saunders Company. 2nd Ed, 1997. P34-147.3. Phatak SV, Kolwadkar PK. Renal and ureteral transitional cell carcinoma: A case report. Indian J Radiology Imaging; 2006; 16:907-909.4. Chou EC, Lin AI, Chen K, Chang Ls. Superficial transitional cell carcinoma of the ureteral orifice: Higher risk of developing subsequent upper urinary tract tumors. Int J Urol, 2006 ; 13 : 682-6855. Yousem DM, Gatewood OM, Goldman SM, Marshall FF. Synchronous and metachronous transitional cell carcinoma of urinary tract: Prevalence, incidence and radiographic detection. Radiol, 1998; 167:613-618.
Fig 7:10x bladder tumor
PDF Composer - unlicensed versionGet a licence at www.pdf-composer.com
64
Case Report Giant Pleomorphic Adenoma of Parotid Gland A Rare Case ReportMahesh Kumar U, Meena N Jadhav and BR YelikarDepartment of PathologyShri B.M.Patil Medical College, Hospital and Research Centre, Bijapur, Karnataka.
Abstract Pleomorphic adenomas are the most common benign neoplasms of the parotid gland. The vast majority are 2-6cms in size. Untreated pleomorphic adenomas can enlarge in size and weigh several kilograms. There are few cases of giant pleomorphic adenomas reported in the literature. Here we present one of such case.A 65years old lady presented with a huge swelling over left side of the face, which enlarged gradually over a period of 30years. There was no history of pain or discharge. There were no features suggestive of facial palsy. The chest x-ray findings were also normal.The excised specimen was 19x15x8cms in dimensions and 1.7kg in weight. Histopathology revealed pleomorphic adenoma without malignant change.The case is being presented for its rarity. As some of these tumors may show malignant change, so early diagnosing and treatment is essential. Key words: Pleomorphic adenoma, Parotid gland.INTRODUCTION Pleomorphic adenomas are the most common benign neoplasms of the parotid gland. The vast majority are 2-6 cms in size, when resected1. Untreated pleomorphic adenomas can enlarge in size and weigh several kilograms2. There are few cases of giant pleomorphic adenomas reported in the literature. Here we present one of such case. Case Summary A 65 years old lady presented with a huge swelling over left side of the face (fig-1), which enlarged gradually over a period of 30 years. There was no history of pain or discharge. There were no features suggestive of facial palsy. Fine needle aspiration cytology was advised (fig- 2, 3).PathologyMacroscopy: Received single nodular mass measuring 19x15x8 cms in dimensions and 1.7 kgs in weight (fig- 4). Outer surface is bosselated and partially covered by skin with no areas of ulceration. Cut surface showed partly encapsulated, solid, pale-white areas with many tiny cysts (fig- 5). Mucoid and chondroid areas were also seen with no areas of hemorrhage and necrosis.
PDF Composer - unlicensed versionGet a licence at www.pdf-composer.com

65
Microscopy: Multiple sections studied showed tumor tissue arranged in biphasic pattern composed of epithelial component and stromal component (fig- 6). Predominantly myoepithelial cells are seen (fig- 7) myxohyaline and chondroid stroma. Cystic change is also noted. No nuclear atypia and atypical mitosis seen. One of the sections shows oncocytic change.
Diagnosis: Giant pleomorphic adenoma with extensive myoepithelial change.DISCUSSION
Pleomorphic adenomas usually present as slow growing asymptomatic discrete swellings which gradually increase in size. Large tumors often form a single but irregular nodular mass which stretches the underlying skin or mucosa. The weight of the tumor can vary from several grams to more than 8 kgs and the weight appears to increase with duration of tumor1. The largest benign mixed tumor recorded in the modern language English literature is 26 cms in diameter3. In our case the resected tumor was measuring 19x15x8 cms in dimensions and weighing 1.7 kgs.
Fig-1 Photograph showing huge swelling over left
side of the face
Fig- 3 Photomicrograph showing cluster of benign epithelial cells.
Fig - 2 Photomicrograph showing benign tumor composed of epithelial and mesenchymal component.
PDF Composer - unlicensed versionGet a licence at www.pdf-composer.com

66
Malignant change was found in only 10% of 31 giant pleomorphic adenoma cases reviewed by Schultz-Coulon1. The incidence of malignancy frequently shows a correlation between the length of the history of pleomorphic adenoma (average-23 years) and the development of carcinoma4.
Generally malignant transformation can be suspected with a sudden increase in growth and local signs of malignancy including pain, ulceration, spontaneous bleeding and superficial and deep tissue invasion1. Our patient did not have any of the above clinical characteristics of malignant transformation and histopathology also revealed no evidence of malignant change.CONCLUSION
Untreated pleomorphic adenomas can enlarge gradually up to several centimeters in dimensions and several kilograms in weight and some of these long standing tumors may show malignant change. Therefore, early diagnosis and treatment of pleomorphic adenoma is essential.
Fig-4 Photograph of gross specimen showing partly encapsulated, nodular pale-white mass which is partly
covered by skin measuring 19x15x8 cms.Fig-5 Cut surface showing predominantly solid,
pale-white, lobulated areas with focal translucent appearance and tiny cysts.
Fig-6 Photomicrograph showing biphasic pattern comprising of epithelial component & stromal
component. (H&E 200x) Fig-7 Photomicrograph showing extensive myo- epithelial component. (H&E 400x)
PDF Composer - unlicensed versionGet a licence at www.pdf-composer.com
67
REFERENCES1. De Silva MN, Kosgoda KMS, Tilakaratne WM, Murugadas P. Oral Oncol Extra 2004; 40:43-45.2. Ansari MA, Muhammad IA, Farrukh S, Alam J. Pakistan J Otolaryngol 2003; 19:7-15.3. Buenting JE, Smith TL, Holmes DK. . Ear Nose Throat J 1998; 77: 634-640.4. Przewozny T, Stankiewiez C. Otolaryngol Pol 2003; 57:691-700.5. Honda, Takashi, Yamamoto, Yusuke, Isago, et al. An Plast Surg,2005; 55:524-527.
PDF Composer - unlicensed versionGet a licence at www.pdf-composer.com

68
Shri B.M.Patil Medical College, Hospital and Research Centre, Bijapur, Karnataka.SCIENTIFIC AND RESEARCH SOCIETY
Clinical Meet Proceedings of 2007-08 Date Topic Department Author
14.06.2007 “Unusual cause of paraplegia in Orthopaedics Dr. Kiran S.Patil. infective Spondylodiscitis of spine”. 28.06.2007 “Neurobrucellosis 4 rare case report.” Paediatrics Dr. Santosh V. “Multiple exostoses rare site of Orthopaedics Dr. Krishna. S. presentation Calcaneum Singh 12.07.2007 “Adenocarcinoma of celon in young Pathology Dr. Abdul adult A case repor” Hakeem Attar 09.08.2007 “Laperoscopic closure of D.U. Surgery .Dr. G.M.Jalihal. perforation.” “Role of imprint cytology in the Pathology Dr. Sanjeev diagnosis of upper GIT lesions & Reddy its correlation with Histopathology 13.09.2007 “Role of FNAC in nuclear grading Pathology Dr. Ashwin of malignant breast aspirates by Kageshan simplified blach grading system”. “PPH series of complications against Obst. & Gyn. Dr. Archana. all odds” R Patil.11.10.2007 “GIST A mimicker”. Pathology Dr U. SK Swami. “Laproscopic inguinal hernia repair”. Surgery Dr. G.M. Jalihal.25.10.2007 “Palmar dermatoglyphics in patients Anatomy Dr. Sumati. S with diabetes mellitus Type ll and hypertention in the age goup between 35-55 yrs”. “Two Cases of soft tissue sarcoma. Surgery Dr. Pavankumar. N. Patil.22.11.2007 “Progonstic importance of hypo- Medicine Dr. A.B natrumia in acute ST elevation Mahabalshetti myocardial infarction”. “Levels of plalsma fibrinogen Medicine. Dr. Amitkumar in stroke. ..
PDF Composer - unlicensed versionGet a licence at www.pdf-composer.com
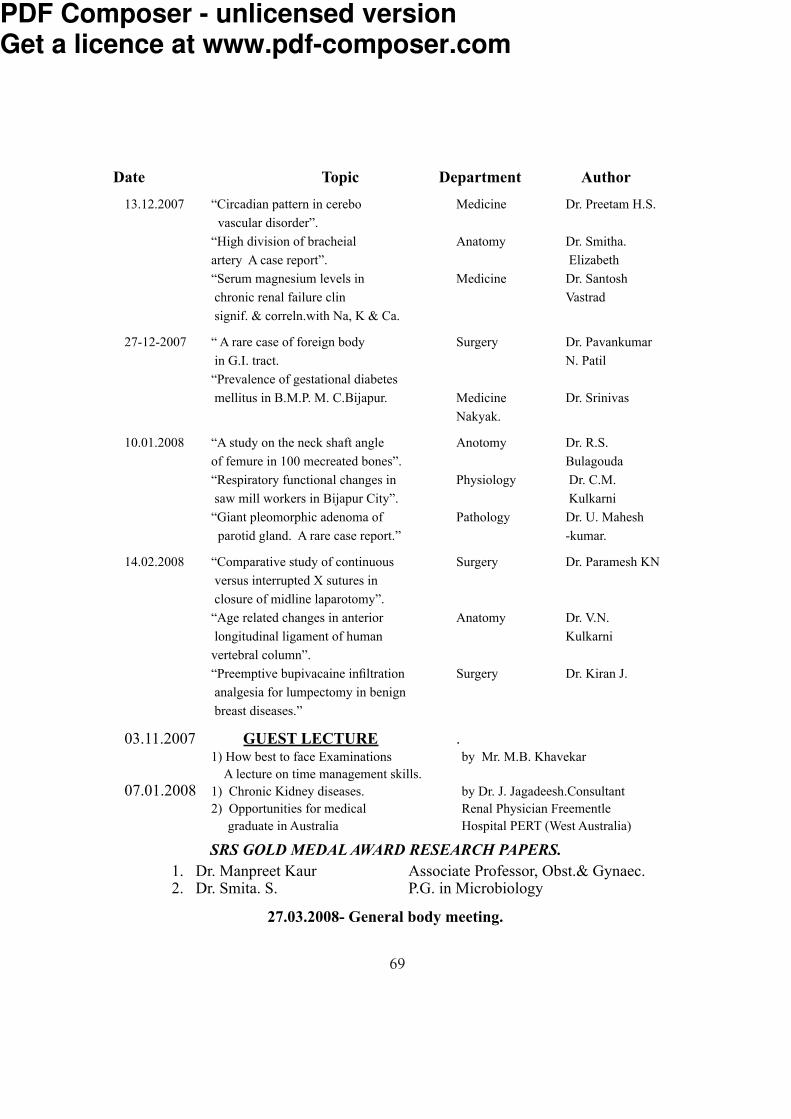
69
Date Topic Department Author13.12.2007 “Circadian pattern in cerebo Medicine Dr. Preetam H.S. vascular disorder”. “High division of bracheial Anatomy Dr. Smitha. artery A case report”. Elizabeth “Serum magnesium levels in Medicine Dr. Santosh chronic renal failure clin Vastrad signif. & correln.with Na, K & Ca. 27-12-2007 “ A rare case of foreign body Surgery Dr. Pavankumar in G.I. tract. N. Patil “Prevalence of gestational diabetes mellitus in B.M.P. M. C.Bijapur. Medicine Dr. Srinivas Nakyak.10.01.2008 “A study on the neck shaft angle Anotomy Dr. R.S. of femure in 100 mecreated bones”. Bulagouda “Respiratory functional changes in Physiology Dr. C.M. saw mill workers in Bijapur City”. Kulkarni “Giant pleomorphic adenoma of Pathology Dr. U. Mahesh parotid gland. A rare case report.” -kumar. 14.02.2008 “Comparative study of continuous Surgery Dr. Paramesh KN versus interrupted X sutures in closure of midline laparotomy”. “Age related changes in anterior Anatomy Dr. V.N. longitudinal ligament of human Kulkarni vertebral column”. “Preemptive bupivacaine infiltration Surgery Dr. Kiran J. analgesia for lumpectomy in benign breast diseases.” 03.11.2007 GUEST LECTURE . 1) How best to face Examinations by Mr. M.B. Khavekar A lecture on time management skills. 07.01.2008 1) Chronic Kidney diseases. by Dr. J. Jagadeesh.Consultant 2) Opportunities for medical Renal Physician Freementle graduate in Australia Hospital PERT (West Australia)
SRS GOLD MEDAL AWARD RESEARCH PAPERS. 1. Dr. Manpreet Kaur Associate Professor, Obst.& Gynaec. 2. Dr. Smita. S. P.G. in Microbiology 27.03.2008- General body meeting.
PDF Composer - unlicensed versionGet a licence at www.pdf-composer.com

70
Instructions to Authors The Analytica Medica is an official publication of the Scientific and Research Soci-ety of B. L. D. E. Association’s Shri B. M. Patil Medical College, Bijapur, Karnataka State, India. Printed at BLDEA Offset Printers, Bijapur. The Journal will consider for publication manuscripts suitable as original papers, reviews and other special category articles.Manuscripts should addressed to ; Professor J. G. Ambekar, Department of Biochemistry, Shri B. M. Patil Medical College, BIJAPUR -586 103 Karnataka, INDIAEditorial Policiesl The Analytica Medica strongly disapproves of submission of the same article simul-tane-
ously to different journals for consideration as well as duplicate publication and will decline to accept fresh manuscripts submitted by authors who have done so.
l No portion of the article is under consideration elsewhere for publication or has been previously published. (This restriction does not apply to abstracts published in connection with scientific meetings)
l Acceptance of the manuscript for publication implies transfer of copyright to the Analytica Medica.
l Statements and opinions expressed in the articles published in the journal are those of authors and not necessarily of the Editor. Neither the Editor nor the Publisher guarantees, warrants or endorses any product or service advertised in the journal.
l If accepted for publication, the manuscript may be edited, without altering the meaning to improve clarity and understanding.
l Two or more referees scrutinize every original or review article submitted to the Analytica Medica
l Covering letter should accompany each material sent for publication. The covering letter should explain if there is any deviation from the standard IMRAD (Introduc-tion, Methods, Results and Discussion) format and should outline the importance and uniqueness the work.
l All authors must sign the covering letter with the understanding that: -All authors have reviewed the article and agree with its contents. -The article is entirely original
PDF Composer - unlicensed versionGet a licence at www.pdf-composer.com

71
Guidelines for Manuscript Preparation1. Original Articles: The manuscript should be prepared in accordance with the ‘Uniform requirements for manuscripts submitted to biomedical journals’ compiled by the International Committee of Medical Journal Editors Update 2008. One complete set of the manuscript as ONE SOFT (CD) & ONE HARD (print) copy should be submitted typed -Title page, Abstract, Introduction, Methods, Results, Discussion, acknowledgments, References, Tables, and Legends to Illustrations, For text, use font Times New Roman -regular, size 12, for photo & illustrations use photoshop and save as jpeg or tiff file & tables & diagram use excel in seperate folder.Title page (Page 1) This should contain the Title, Short Title, Names of all the Authors written in continuation, Name(s) of institution(s) they are affiliated to, name and Address of the Corresponding Author and Acknowledgment of financial support.Full Title: should represent the major theme of the manuscript, A subtitle can be added if necessary. The title should be brief and comprehensive. The first letter of all the words should be typed in capitals.Short Title: not more than 25 characters (including interword spaces) should be included for use as a running head.Names (first name, initial of middle name, followed by surname) of all the authors (without degrees or diplomas)Name and full location of the department/institution/laboratory where the work was per-formed.The Name, Telephone number, Fax number, e-mail and Postal Address of the author to whom communications and requests for reprints are to be sent.Abstract (Page2)Should be typed on a separate sheet. The abstract (250 words maximum) should be struc-tured and divided into three section namely, Background, Methods & Results and Con-clusions. It should not contain abbreviations, footnotes of references. The data should be presented as numbers rather than percentages.Also provide 3 to 5 key words/Terms from the medical subjects headings (MCSH) list of Index Medicus should be used.Text (page 3 onwards)The text should be divided into Introduction, Methods, Results and Discussion. If possible no statement should be supported by more than three references.Units of measurement should be given in metric units. All bioclinical measurements should be given in conventional units with Systeme International d’unites (SI) units given in parenthesis. Give generic rather than trade names of drugs.Avoid the use of full stops in between abbreviations (TMT, not T.M.T).
PDF Composer - unlicensed versionGet a licence at www.pdf-composer.com

72
Introduction: The introduction should state why the study was carried out and what were its specific aims.Methods: These should be described in sufficient detail to permit evaluation and duplication of the work. This section may be divided into subsections. if required, Ethical guidelines followed by the investigators should be described. Statistical details should be provided where applicable.Results: These should be concise and include tables and figures necessary to enhance the understanding of the text.Discussion: This should consist of a review of the literature and relate the major findings of the article to other publication the subject Conclusions drawn should be based on the data obtained in the study.References: Analytica Medica follows Vancour System. References should be numbered consecutively in the order in which they are first mentioned in the text. Identify references in text, tables, and legends by Arabic numerals in parentheses. References cited only in tables or figure legends should be numbered in accordance with the sequence established by the first identification in the text of the par-ticular table or figure. Use the style of the examples below, which are based on the formats used by the NLM in Index Medicus. The titles of journals should be abbreviated according to the style used in Index Medicus. Consult the List of Journals Indexed in Index Medicus, published annually as a separate publication by the library and as a list in the January issue of Index Medicus orPubMed. The list can also be obtained through the library’s web site (http://www.nlm.nih.gov/). Avoid using abstracts as references. References to papers accepted but not yet published should be designated as “in press” or “forthcoming”; authors should obtain written permission to cite such papers as well as verification that they have been accepted for publication. Information from manuscripts submitted but not accepted should be cited in the text as “unpublished observations” with written permission from the source. Avoid citing a “personal communication” unless it provides essential information not available from a public source, in which case the name of the person and date of com-munication should be cited in parentheses in the text. For scientific articles, authors should obtain written permission and confirmation of accuracy from the source of a personal communication. The references must be verified by the author(s) against the original documents.
PDF Composer - unlicensed versionGet a licence at www.pdf-composer.com

73
The Uniform Requirements style (the Vancouver style) is based largely on an ANSI standard style adapted by the NLM for its databases. Notes have been added where Vancouver style differs from the style now used by NLM.Articles in Journals1. Standard journal article List the first six authors followed by et al. (Note: NLM now
lists up through 25 authors; if there are more than 25 authors, NLM lists the first 24, then the last author, then et al.)
* Vega KJ, Pina I, Krevsky B. Heart transplantation is associated with an increased risk for pancreatobiliary disease. Ann Intern Med 1996 Jun 1;124 (11):980-3.
As an option, if a journal carries continuous pagination throughout a volume (as many medical journals do) the month and issue number may be omitted.
(Note: For consistency, the option is used throughout the examples in Uniform Require-ments. NLM does not use the option.) Vega KJ, Pina I, Krevsky B. Heart transplanta-tion is associated with an increased risk for pancreatobiliary disease. Ann Intern Med 1996;124:980-3.
More than six authors: Parkin DM, Clayton D, Black RJ, Masuyer E, Friedl HP, Iva-nov E, et al. Childhood leukaemia in Europe after Chernobyl: 5 year follow-up. Br J Cancer 1996;73:1006- 12.
2. Organization as author The Cardiac Society of Australia and New Zealand. Clinical exercise stress testing. Safety and performance guidelines. Med J Aust 1996; 164: 282-4.
3. No author given Cancer in South Africa [editorial]. S Afr Med J 1994;84:15.4. Article not in English (Note: NLM translates the title to English, encloses the trans-
lation in square brackets, and adds an abbreviated language designator.) Ryder TE, Haukeland EA, Solhaug JH. Bilateral infrapatellar seneruptur hostidligere frisk kvinne.Tidsskr Nor Laegeforen 1996;116:41-2.
5. Volume with supplement Shen HM, Zhang QF. Risk assessment of nickel carcino-genicity and occupational lung cancer. Environ Health Perspect 1994;102 Suppl 1:275-82.
6. Issue with supplement Payne DK, Sullivan MD, Massie MJ. Women’s psychological reactions to breast cancer. Semin Oncol 1996;23(1 Suppl 2):89-97.
7. Volume with part Ozben T, Nacitarhan S, Tuncer N. Plasma and urine sialic acid in non-insulin dependent diabetes mellitus. Ann Clin Biochem 1995;32(Pt 3):303-6.
8. Issue with part Poole GH, Mills SM. One hundred consecutive cases of flap lacera-tions of the leg in ageing patients. N Z Med J 1994;107(986 Pt 1):377-8.
9. Issue with no volume Turan I, Wredmark T, Fellander-Tsai L. Arthroscopic ankle arthrodesis in rheumatoid arthritis. Clin Orthop 1995;(320):110-4.
PDF Composer - unlicensed versionGet a licence at www.pdf-composer.com

74
10. No issue or volume Browell DA, Lennard TW. Immunologic status of the cancer patient and the effects of blood transfusion on antitumor responses. Curr Opin Gen Surg 1993:325-33.
11. Pagination in Roman numerals Fisher GA, Sikic BI. Drug resistance in clinical on-cology and hematology. Introduction. Hematol Oncol Clin North Am 1995 Apr;9(2):xi-xii.
Books and Other Monographs(Note: Previous Vancouver style incorrectly had a comma rather than a semicolon between
the publisher and the date.)12. Personal author(s) Ringsven MK, Bond D. Gerontology and leadership skills for
nurses. 2nd ed. Albany (NY): Delmar Publishers; 1996.13. Editor(s), compiler(s) as author Norman IJ, Redfern SJ, editors. Mental health care
for elderly people. New York: Churchill Livingstone; 1996.14. Organization as author and publisher Institute of Medicine (US). Looking at the
future of the Medical program. Washington: The Institute; 1992.Ma book (Note: Previous Vancouver style had a colon rather than a p before pagination.)
Phillips SJ, Whisnant JP. Hypertension and stroke. In: Laragh JH, Brenner BM, editors. Hypertension: pathophysiology, diagnosis, and management. 2nd ed. New York: Raven Press; 1995. p. 465-78.
16. Conference proceedings Kimura J, Shibasaki H, editors. Recent advances in clinical neurophysiology. Proceedings of the 10th International Congress of EMG and Clini-cal Neurophysiology; 1995 Oct 15-19; Kyoto, Japan. Amsterdam: Elsevier; 1996.
17. Conference paper Bengtsson S, Solheim BG. Enforcement of data protection, privacy and security in medical informatics. In: Lun KC, Degoulet P, Piemme TE, Rienhoff O, editors. MEDINFO 92. Proceedings of the 7th World Congress on Medical In-formatics; 1992 Sep 6-10; Geneva, Switzerland. Amsterdam: North-Holland; 1992. p. 1561-5.
18. Scientific or technical report Issued by funding/sponsoring agency: Smith P, Golla-day K. Payment for durable medical equipment billed during skilled nursing facility stays. Final report. Dallas (TX): Dept. of Health and Human Services (US), Office of Evaluation and Inspections; 1994 Oct. Report No.: HHSIGOEI69200860. Issued by performing agency: Field MJ, Tranquada RE, Feasley JC, editors. Health services research: work force and educational issues. Washington: National Academy Press; 1995. Contract No.: AHCPR282942008. Sponsored by the Agency for Health Care Policy and esearch.
19. Dissertation Kaplan SJ. Post-hospital home health care: the elderly’s access and utilization [dissertation]. St. Louis (MO): Washington Univ.; 1995.
20. Patent Larsen CE, Trip R, Johnson CR, inventors; Novoste Corporation, assignee.
PDF Composer - unlicensed versionGet a licence at www.pdf-composer.com

75
Methods for procedures related to the electrophysiology of the heart. US patent 5,529,067. 1995 Jun 25.
2. Brief Reports: Brief reports should be limited to 1200 words, should not have more than 5 au-thors and should contain only 2 to 3 illustrations and a maximum of 15 references. A brief summary should be followed by an introduction, the report and discussion. Case reports should also conform to these guidelines.3. Review Articles: The Analytica Medica also solicits comprehensive review articles on topics of current biomedical interest in cardiology. The entire manuscript should not exceed 20 typed pages and should not contain more than 50 references.4. Selected Summaries: These should provide a short summary of important articles published elsewhere in the reviewers (not the author’s) words followed by comments,. A copy of the paper discussed should accompany the selected summary.5. Letter to the Editor: This should not exceed more than 500 words and can be on any topic of biomedi-cal interest. It may be related to any material published previously in the journal; should be sent in immediately following the publication of the article. The Editor will try to get authors comments on this letter and attempt to publish both together. The first reference quoted should be the article in response to which the letter is being written.
PDF Composer - unlicensed versionGet a licence at www.pdf-composer.com