ANA HOLDINGS INC. 2 】 Ⅱ . FY2014 Financial Results 《 Details 》 【 Part 1 】 Ⅰ. FY2014...
48
©ANAHD2015 1 ANA HOLDINGS INC. Financial Results FY2014 ended March 31, 2015 April 30, 2015 Senior Vice President and CFO President and CEO Yuji Hirako Shinya Katanozaka
Transcript of ANA HOLDINGS INC. 2 】 Ⅱ . FY2014 Financial Results 《 Details 》 【 Part 1 】 Ⅰ. FY2014...
©ANAHD2015
1
ANA HOLDINGS INC. Financial Results FY2014 ended March 31, 2015
April 30, 2015
Senior Vice President and CFO
President and CEO
Yuji Hirako
Shinya Katanozaka
©ANAHD2015
Outline of FY2014 Financial Results and FY2015 Earnings Forecast Outline of FY2015 ANA Group Network Plan FY2015 ANA Group Network plan (International Business) Major Approach of ANA Group in FY2015 Value Creation Goals
P. 4 P. 5 P. 6 P. 7 P. 8
Highlights of FY2014 Consolidated Financial Summary Income Statements Consolidated Financial Position Consolidated Statements of Cash Flow Results by Segment Air Transportation Business Operating Revenues and Expenses Changes in Operating Income Passenger Operations Cargo Operations LCC Operations Results by Segment
P. 10 P. 11 P. 12 P. 13 P. 14 P. 15 P. 16 P. 17-22 P. 23-26 P. 27 P. 28
2
Contents
【Part 2】 Ⅱ. FY2014 Financial Results 《Details》
【Part 1】 Ⅰ. FY2014 Financial Results and FY2015 Earnings Forecast
P. 42 P. 43 P. 44
Aircraft in Service International Passengers Results by Destination International Cargo Results by Destination
Ⅳ. Supplemental Reference
P. 30 P. 31 P. 32 P. 33-34 P. 35 P. 36 P. 37 P. 38 P. 39
Consolidated Earnings Forecast Earnings Forecast by Segment Air Transportation Business Operating Revenues and Expenses Earnings Forecast Assumptions Consolidated Financial Position (Estimate) Consolidated Cash Flow (Estimate) Status of Fuel and Currency Hedging Impact of Foreign Currency Cost Restructuring and CASK of Air Transportation Business
Ⅲ. FY2015 Earnings Forecast 《Details》
©ANAHD2015
【Part 1】
3
Ⅰ. FY2014 Financial Results and FY2015 Earnings Forecast
©ANAHD2015
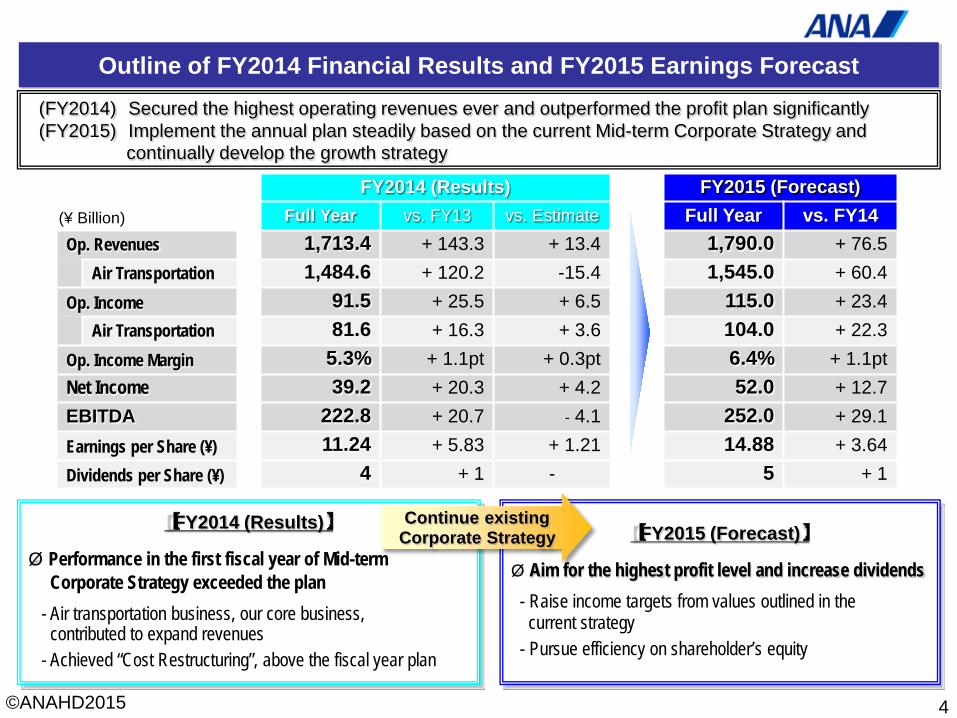
(FY2014) Secured the highest operating revenues ever and outperformed the profit plan significantly (FY2015) Implement the annual plan steadily based on the current Mid-term Corporate Strategy and continually develop the growth strategy
Outline of FY2014 Financial Results and FY2015 Earnings Forecast
4
FY2014 (Results) FY2015 (Forecast)
Full Year vs. FY13 vs. Estimate Full Year vs. FY14 Op. Revenues 1,713.4 + 143.3 + 13.4 1,790.0 + 76.5
Air Transportation 1,484.6 + 120.2 -15.4 1,545.0 + 60.4 Op. Income 91.5 + 25.5 + 6.5 115.0 + 23.4
Air Transportation 81.6 + 16.3 + 3.6 104.0 + 22.3 Op. Income Margin 5.3% + 1.1pt + 0.3pt 6.4% + 1.1pt Net Income 39.2 + 20.3 + 4.2 52.0 + 12.7 EBITDA 222.8 + 20.7 - 4.1 252.0 + 29.1 Earnings per Share (¥) 11.24 + 5.83 + 1.21 14.88 + 3.64 Dividends per Share (¥) 4 + 1 - 5 + 1
【FY2014 (Results)】
Ø Performance in the first fiscal year of Mid-term Corporate Strategy exceeded the plan - Air transportation business, our core business, contributed to expand revenues - Achieved “Cost Restructuring”, above the fiscal year plan
【FY2015 (Forecast)】
Ø Aim for the highest profit level and increase dividends - Raise income targets from values outlined in the current strategy - Pursue efficiency on shareholder’s equity
Continue existing Corporate Strategy
(¥ Billion)
©ANAHD2015
95
5
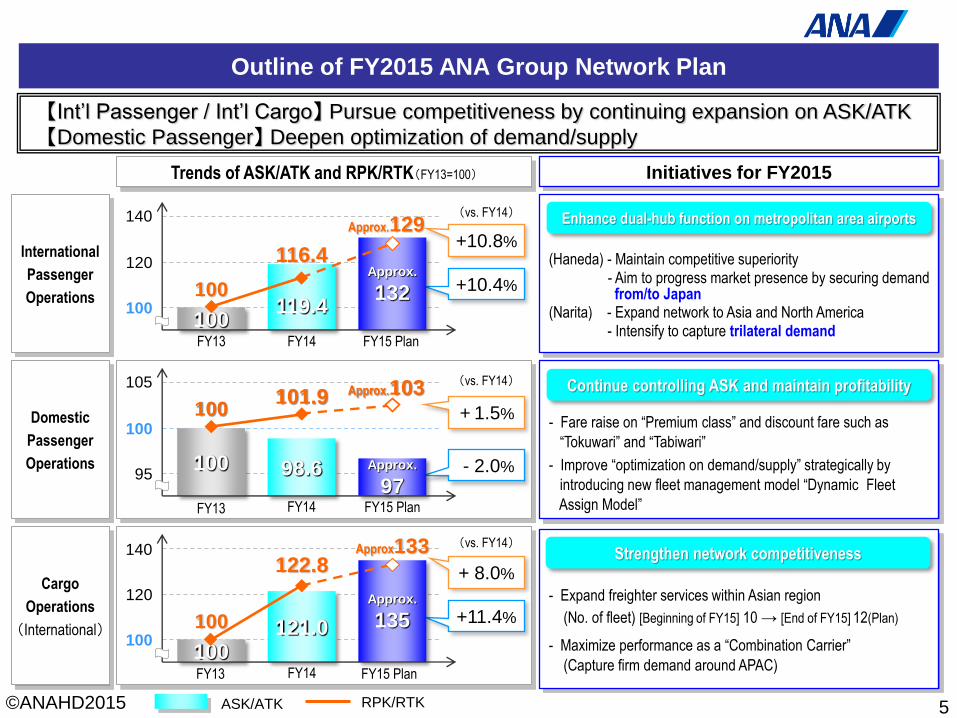
Outline of FY2015 ANA Group Network Plan
【Int‟l Passenger / Int‟l Cargo】 Pursue competitiveness by continuing expansion on ASK/ATK
【Domestic Passenger】 Deepen optimization of demand/supply
International
Passenger
Operations
Domestic
Passenger
Operations
Cargo
Operations
(International)
140
120
100 100
119.4
140
120
100 100
121.0
100
(Haneda) - Maintain competitive superiority - Aim to progress market presence by securing demand from/to Japan (Narita) - Expand network to Asia and North America - Intensify to capture trilateral demand
- Fare raise on “Premium class” and discount fare such as
“Tokuwari” and “Tabiwari”
- Improve “optimization on demand/supply” strategically by
introducing new fleet management model “Dynamic Fleet
Assign Model”
FY13 FY14 FY15 Plan
Trends of ASK/ATK and RPK/RTK(FY13=100) Initiatives for FY2015
116.4
Approx.129
122.8
RPK/RTK ASK/ATK
100
100 101.9 Approx.103
+10.8%
(vs. FY14)
+10.4%
+ 8.0%
+11.4%
Continue controlling ASK and maintain profitability
Enhance dual-hub function on metropolitan area airports
Strengthen network competitiveness
100
100
105
+ 1.5%
- 2.0%
(vs. FY14)
(vs. FY14)
FY13 FY14 FY15 Plan
FY15 Plan FY13 FY14
- Expand freighter services within Asian region
(No. of fleet) [Beginning of FY15] 10 → [End of FY15] 12(Plan)
- Maximize performance as a “Combination Carrier”
(Capture firm demand around APAC)
Approx.
132
98.6 Approx.
97
Approx.
135
Approx133
©ANAHD2015
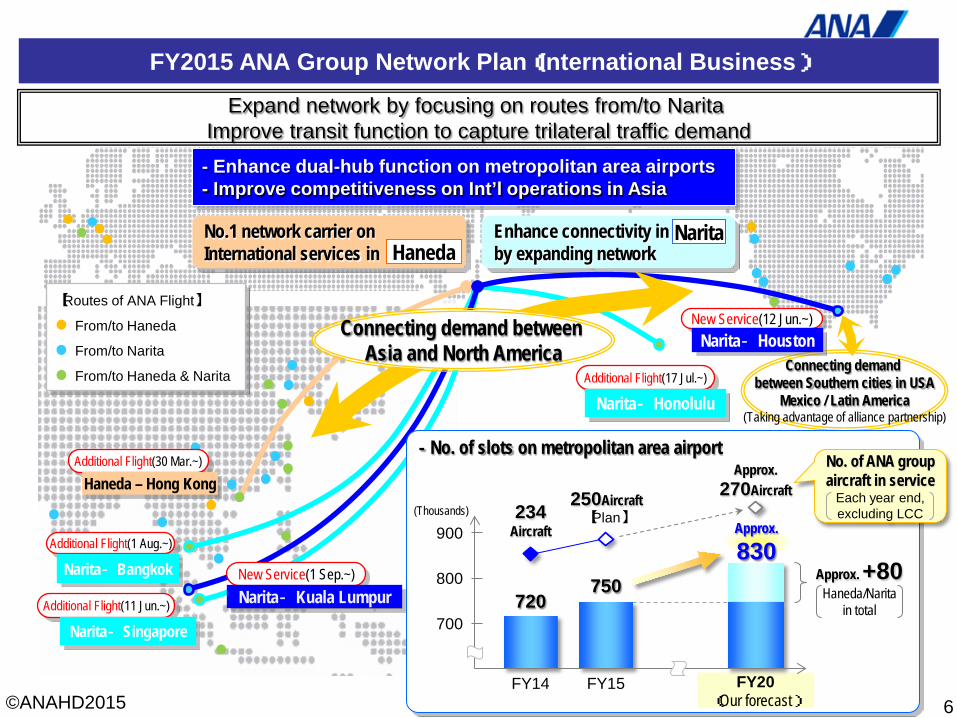
FY2015 ANA Group Network Plan(International Business)
- Enhance dual-hub function on metropolitan area airports - Improve competitiveness on Int’l operations in Asia
Enhance connectivity in by expanding network
6
Expand network by focusing on routes from/to Narita Improve transit function to capture trilateral traffic demand
Connecting demand between Southern cities in USA
Mexico / Latin America (Taking advantage of alliance partnership)
Connecting demand between Asia and North America
Narita
【Routes of ANA Flight】
From/to Haneda
From/to Narita
From/to Haneda & Narita
Additional Flight(30 Mar.~)
Additional Flight(1 Aug.~)
Additional Flight(11 Jun.~)
New Service(12 Jun.~)
Additional Flight(17 Jul.~)
No.1 network carrier on International services in Haneda
New Service(1 Sep.~)
Approx.
830
- No. of slots on metropolitan area airport
(Thousands) 234 Aircraft
250Aircraft 【Plan】
Approx. 270Aircraft
No. of ANA group aircraft in service
Each year end, excluding LCC
750 720
(Our forecast)
Approx. +80 Haneda/Narita
in total
FY14 FY15
700
800
900
FY20
Narita‐Kuala Lumpur Narita‐Bangkok
Narita‐Singapore
Haneda – Hong Kong
Narita‐Honolulu
Narita‐Houston
©ANAHD2015
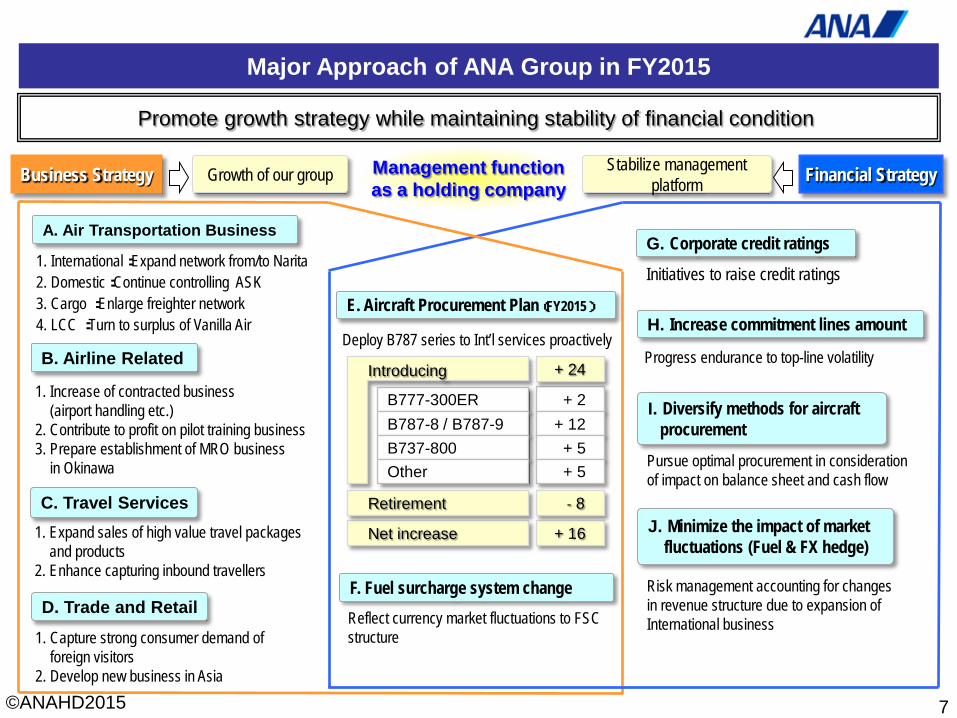
Major Approach of ANA Group in FY2015
Promote growth strategy while maintaining stability of financial condition
7
Financial Strategy Business Strategy
1. Expand sales of high value travel packages and products 2. Enhance capturing inbound travellers
A. Air Transportation Business
B. Airline Related
C. Travel Services
D. Trade and Retail
1. International:Expand network from/to Narita 2. Domestic:Continue controlling ASK 3. Cargo :Enlarge freighter network 4. LCC :Turn to surplus of Vanilla Air
1. Increase of contracted business (airport handling etc.) 2. Contribute to profit on pilot training business 3. Prepare establishment of MRO business in Okinawa
1. Capture strong consumer demand of foreign visitors 2. Develop new business in Asia
G. Corporate credit ratings
Initiatives to raise credit ratings
H. Increase commitment lines amount
Progress endurance to top-line volatility
I. Diversify methods for aircraft procurement
Pursue optimal procurement in consideration of impact on balance sheet and cash flow
E. Aircraft Procurement Plan(FY2015)
Reflect currency market fluctuations to FSC structure
Growth of our group
F. Fuel surcharge system change
J. Minimize the impact of market fluctuations (Fuel & FX hedge)
Risk management accounting for changes in revenue structure due to expansion of International business
Stabilize management platform
Management function as a holding company
Deploy B787 series to Int’l services proactively
Net increase
B777-300ER + 2
Retirement
+ 16
B787-8 / B787-9 B737-800 Other
+ 12 + 5 + 5
+ 24
- 8
Introducing
©ANAHD2015
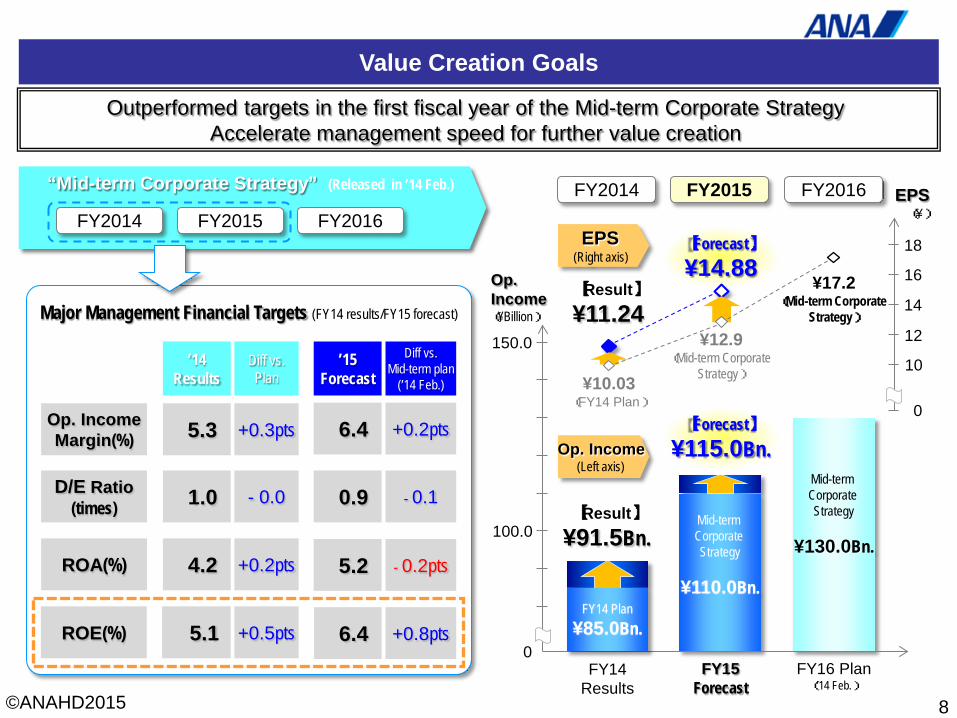
Value Creation Goals
8
Major Management Financial Targets (FY14 results/FY15 forecast)
Op. Income Margin(%) 5.3 6.4 +0.3pts +0.2pts
D/E Ratio (times) 1.0 - 0.0 0.9 - 0.1
ROA(%) 4.2 +0.2pts 5.2 - 0.2pts
’14 Results
Diff vs. Plan
’15 Forecast
Diff vs. Mid-term plan
(’14 Feb.)
ROE(%) 5.1 +0.5pts 6.4 +0.8pts
【Forecast】 ¥14.88
100.0
FY14 Results
FY15 Forecast
FY16 Plan (’14 Feb.)
¥12.9 (Mid-term Corporate
Strategy) ¥10.03 (FY14 Plan)
¥17.2 (Mid-term Corporate
Strategy)
【Result】 ¥11.24
0
12
10
14
16
18
0
Mid-term Corporate Strategy
¥110.0Bn.
Op. Income (¥Billion)
EPS (¥)
150.0
EPS (Right axis)
Op. Income (Left axis)
【Forecast】 ¥115.0Bn.
【Result】 ¥91.5Bn.
FY2014 FY2015 FY2016
Mid-term Corporate Strategy
¥130.0Bn.
FY14 Plan ¥85.0Bn.
Outperformed targets in the first fiscal year of the Mid-term Corporate Strategy Accelerate management speed for further value creation
“Mid-term Corporate Strategy” (Released in ’14 Feb.)
FY2016 FY2014 FY2015
©ANAHD2015
9
【Part2】 Ⅱ. FY2014 Financial Results 《Details》
©ANAHD2015
-400-200
0200400600800
1,000
1Q 2Q 3Q 4Q 1Q 2Q 3Q 4Q
営業利益 当期純利益 EBITDA
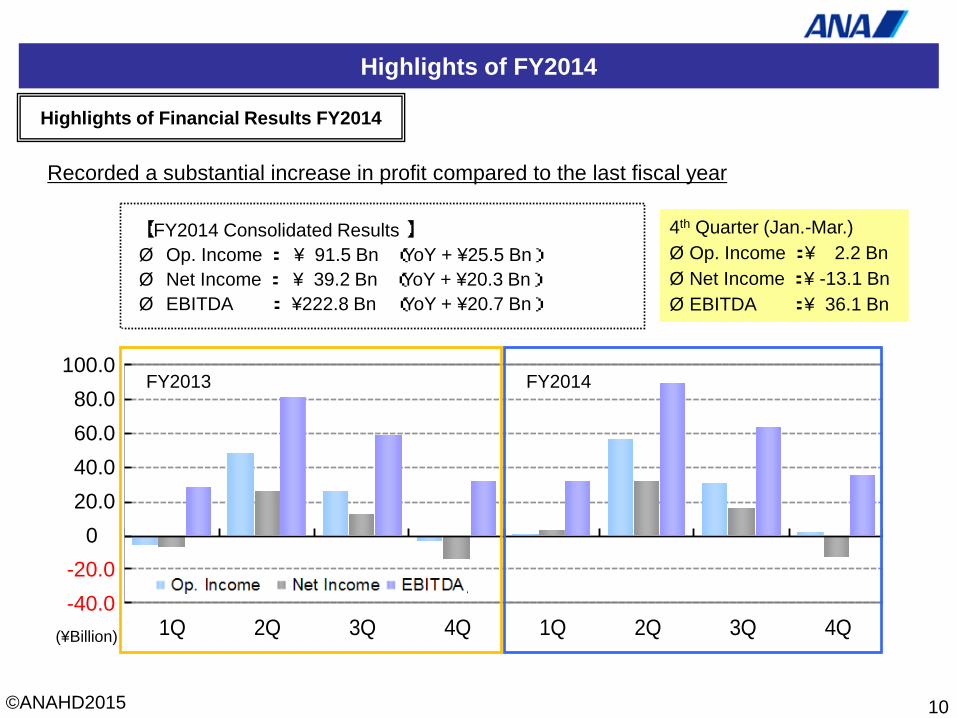
Highlights of FY2014
Highlights of Financial Results FY2014
FY2013 FY2014
(¥Billion)
【 FY2014 Consolidated Results 】 Ø Op. Income : ¥ 91.5 Bn (YoY + ¥25.5 Bn) Ø Net Income : ¥ 39.2 Bn (YoY + ¥20.3 Bn) Ø EBITDA : ¥222.8 Bn (YoY + ¥20.7 Bn)
10
Recorded a substantial increase in profit compared to the last fiscal year
4th Quarter (Jan.-Mar.) Ø Op. Income : ¥ 2.2 Bn Ø Net Income : ¥ -13.1 Bn Ø EBITDA : ¥ 36.1 Bn
100.0 80.0 60.0 40.0 20.0
0 -20.0 -40.0
©ANAHD2015
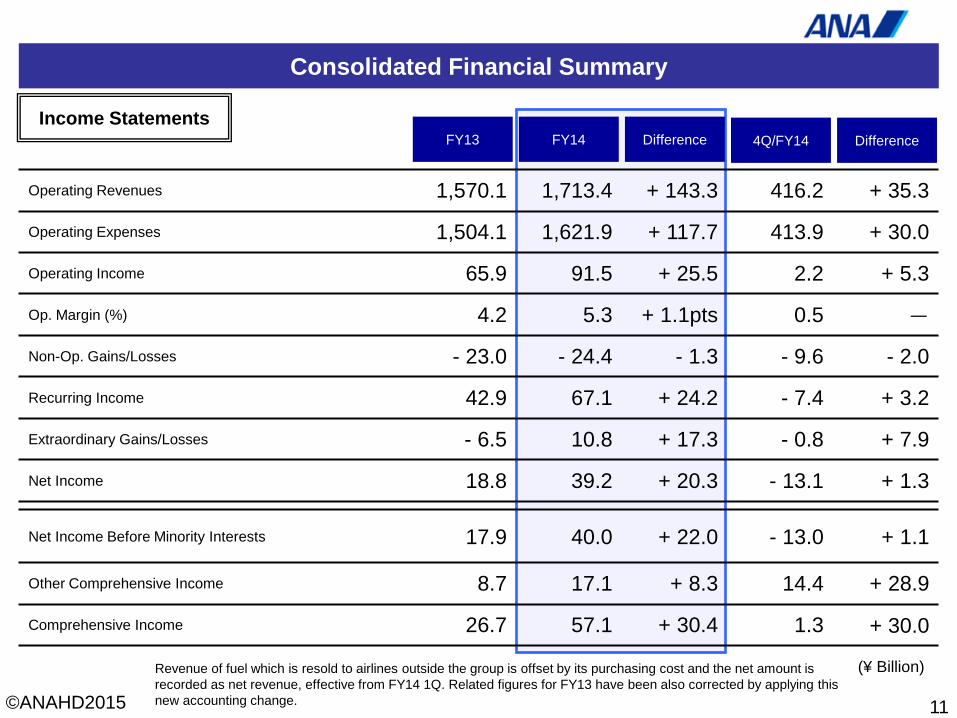
Consolidated Financial Summary
Income Statements Difference FY14 FY13
Operating Revenues 1,570.1 1,713.4 + 143.3 416.2 + 35.3
Operating Expenses 1,504.1 1,621.9 + 117.7 413.9 + 30.0
Operating Income 65.9 91.5 + 25.5 2.2 + 5.3
Op. Margin (%) 4.2 5.3 + 1.1pts 0.5 -
Non-Op. Gains/Losses - 23.0 - 24.4 - 1.3 - 9.6 - 2.0
Recurring Income 42.9 67.1 + 24.2 - 7.4 + 3.2
Extraordinary Gains/Losses - 6.5 10.8 + 17.3 - 0.8 + 7.9
Net Income 18.8 39.2 + 20.3 - 13.1 + 1.3
Net Income Before Minority Interests 17.9 40.0 + 22.0 - 13.0 + 1.1
Other Comprehensive Income 8.7 17.1 + 8.3 14.4 + 28.9
Comprehensive Income 26.7 57.1 + 30.4 1.3 + 30.0
11
Difference 4Q/FY14
(¥ Billion) Revenue of fuel which is resold to airlines outside the group is offset by its purchasing cost and the net amount is recorded as net revenue, effective from FY14 1Q. Related figures for FY13 have been also corrected by applying this new accounting change.
©ANAHD2015
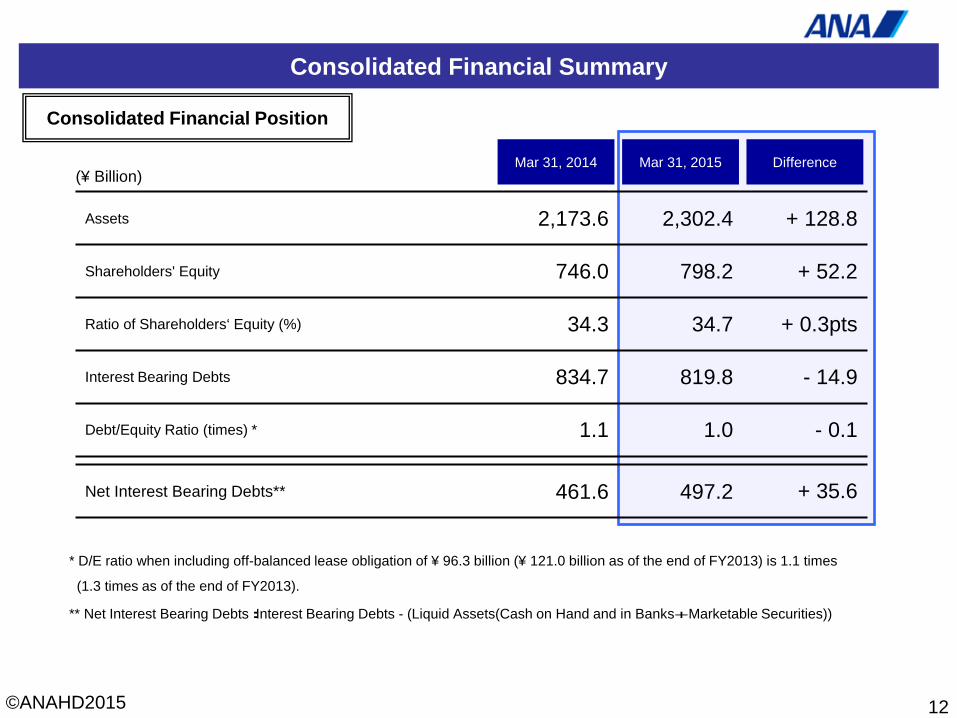
Consolidated Financial Summary
Consolidated Financial Position
Assets 2,173.6 2,302.4 + 128.8
Shareholders' Equity 746.0 798.2 + 52.2
Ratio of Shareholders‘ Equity (%) 34.3 34.7 + 0.3pts
Interest Bearing Debts 834.7 819.8 - 14.9
Debt/Equity Ratio (times) * 1.1 1.0 - 0.1
Net Interest Bearing Debts** 461.6 497.2 + 35.6
12
Difference Mar 31, 2015 Mar 31, 2014
* D/E ratio when including off-balanced lease obligation of ¥ 96.3 billion (¥ 121.0 billion as of the end of FY2013) is 1.1 times
(1.3 times as of the end of FY2013).
** Net Interest Bearing Debts:Interest Bearing Debts - (Liquid Assets(Cash on Hand and in Banks+Marketable Securities))
(¥ Billion)
©ANAHD2015
Consolidated Financial Summary
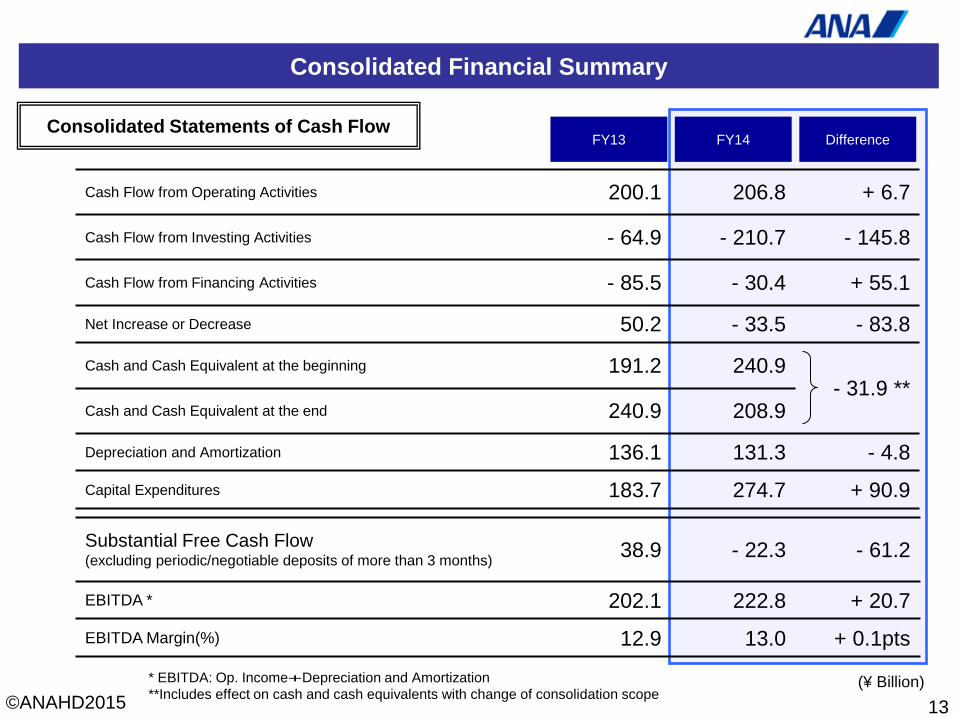
Consolidated Statements of Cash Flow
Substantial Free Cash Flow (excluding periodic/negotiable deposits of more than 3 months) 38.9 - 22.3 - 61.2
EBITDA * 202.1 222.8 + 20.7
EBITDA Margin(%) 12.9 13.0 + 0.1pts
Cash Flow from Operating Activities 200.1 206.8 + 6.7
Cash Flow from Investing Activities - 64.9 - 210.7 - 145.8
Cash Flow from Financing Activities - 85.5 - 30.4 + 55.1
Net Increase or Decrease 50.2 - 33.5 - 83.8
Cash and Cash Equivalent at the beginning 191.2 240.9 - 31.9 **
Cash and Cash Equivalent at the end 240.9 208.9
Depreciation and Amortization 136.1 131.3 - 4.8
Capital Expenditures 183.7 274.7 + 90.9
13
Difference FY14 FY13
(¥ Billion) * EBITDA: Op. Income+Depreciation and Amortization **Includes effect on cash and cash equivalents with change of consolidation scope
©ANAHD2015
Consolidated Financial Summary
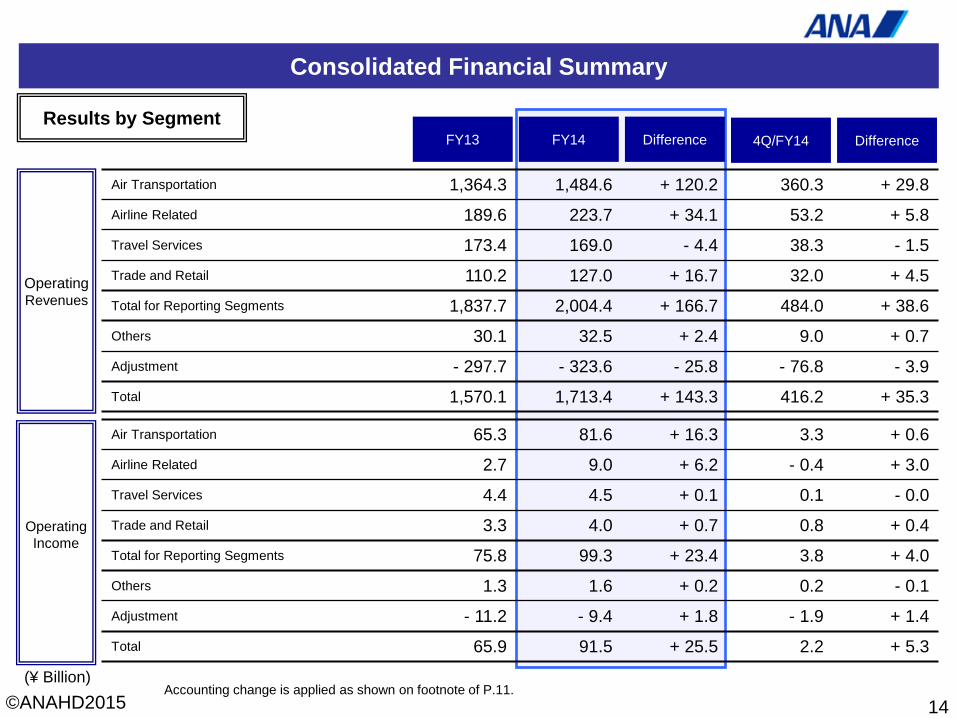
Results by Segment
Air Transportation 1,364.3 1,484.6 + 120.2 360.3 + 29.8
Airline Related 189.6 223.7 + 34.1 53.2 + 5.8
Travel Services 173.4 169.0 - 4.4 38.3 - 1.5
Trade and Retail 110.2 127.0 + 16.7 32.0 + 4.5
Total for Reporting Segments 1,837.7 2,004.4 + 166.7 484.0 + 38.6
Others 30.1 32.5 + 2.4 9.0 + 0.7
Adjustment - 297.7 - 323.6 - 25.8 - 76.8 - 3.9
Total 1,570.1 1,713.4 + 143.3 416.2 + 35.3
Air Transportation 65.3 81.6 + 16.3 3.3 + 0.6
Airline Related 2.7 9.0 + 6.2 - 0.4 + 3.0
Travel Services 4.4 4.5 + 0.1 0.1 - 0.0
Trade and Retail 3.3 4.0 + 0.7 0.8 + 0.4
Total for Reporting Segments 75.8 99.3 + 23.4 3.8 + 4.0
Others 1.3 1.6 + 0.2 0.2 - 0.1
Adjustment - 11.2 - 9.4 + 1.8 - 1.9 + 1.4
Total 65.9 91.5 + 25.5 2.2 + 5.3
Operating Revenues
Operating Income
14
Difference FY14 FY13 Difference 4Q/FY14
(¥ Billion) Accounting change is applied as shown on footnote of P.11.
©ANAHD2015
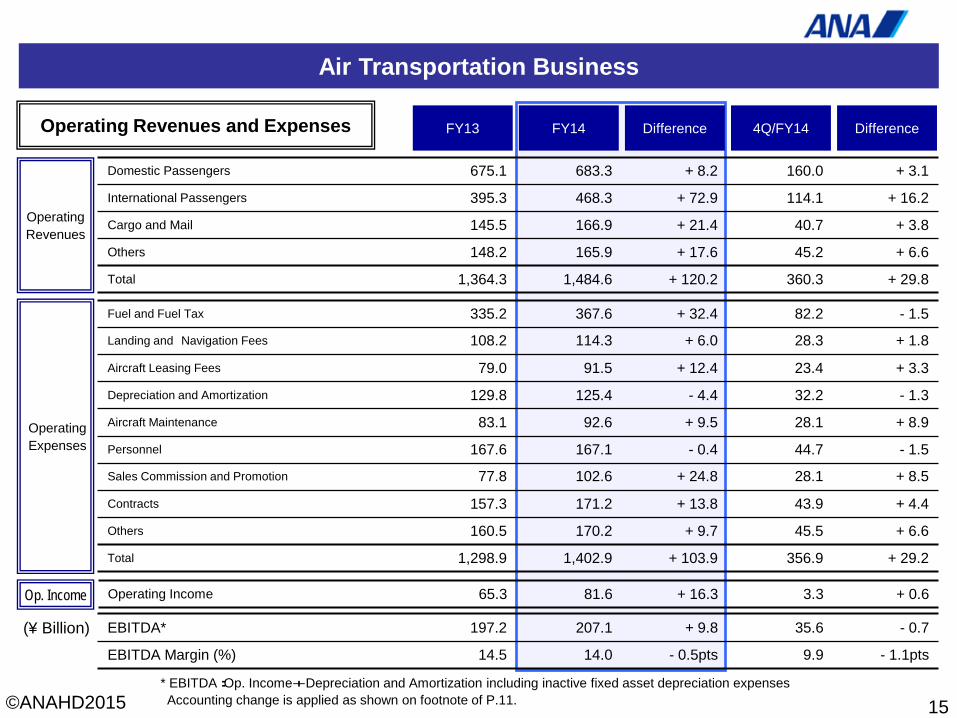
Air Transportation Business
Domestic Passengers 675.1 683.3 + 8.2 160.0 + 3.1
International Passengers 395.3 468.3 + 72.9 114.1 + 16.2
Cargo and Mail 145.5 166.9 + 21.4 40.7 + 3.8
Others 148.2 165.9 + 17.6 45.2 + 6.6
Total 1,364.3 1,484.6 + 120.2 360.3 + 29.8
Fuel and Fuel Tax 335.2 367.6 + 32.4 82.2 - 1.5
Landing and Navigation Fees 108.2 114.3 + 6.0 28.3 + 1.8
Aircraft Leasing Fees 79.0 91.5 + 12.4 23.4 + 3.3
Depreciation and Amortization 129.8 125.4 - 4.4 32.2 - 1.3
Aircraft Maintenance 83.1 92.6 + 9.5 28.1 + 8.9
Personnel 167.6 167.1 - 0.4 44.7 - 1.5
Sales Commission and Promotion 77.8 102.6 + 24.8 28.1 + 8.5
Contracts 157.3 171.2 + 13.8 43.9 + 4.4
Others 160.5 170.2 + 9.7 45.5 + 6.6
Total 1,298.9 1,402.9 + 103.9 356.9 + 29.2
Operating Revenues
Operating Expenses
Op. Income Operating Income 65.3 81.6 + 16.3 3.3 + 0.6
EBITDA* 197.2 207.1 + 9.8 35.6 - 0.7
EBITDA Margin (%) 14.5 14.0 - 0.5pts 9.9 - 1.1pts
15
Difference FY14 FY13 Difference 4Q/FY14
(¥ Billion)
Operating Revenues and Expenses
* EBITDA:Op. Income+Depreciation and Amortization including inactive fixed asset depreciation expenses Accounting change is applied as shown on footnote of P.11.
©ANAHD2015
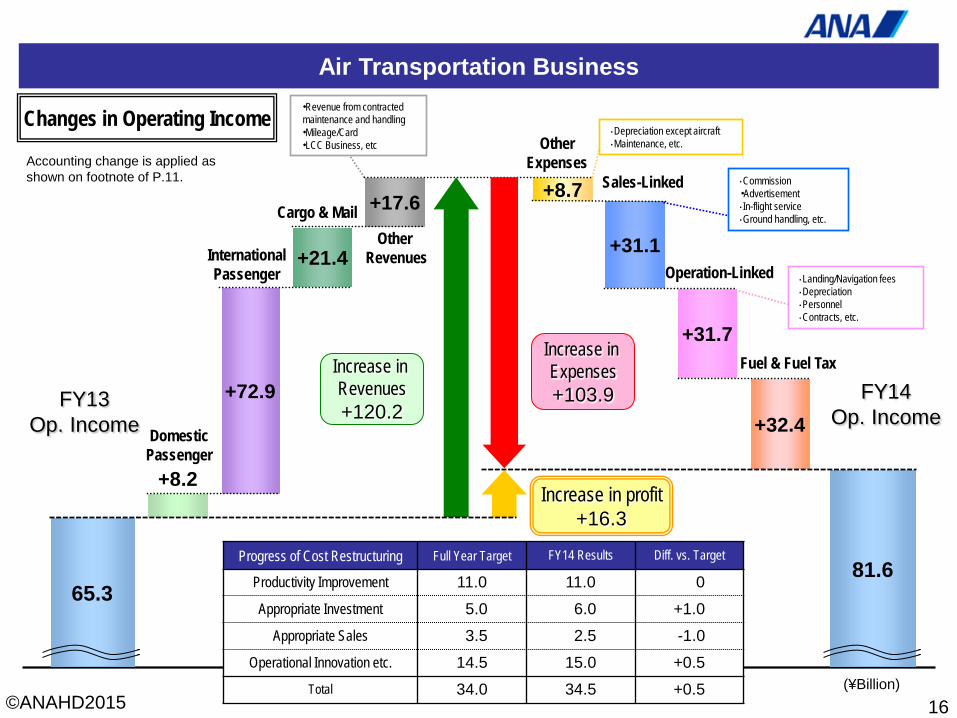
FY13 Op. Income
FY14 Op. Income
+8.2
+21.4
+17.6
+31.7
+31.1
+8.7
Increase in Revenues +120.2
Increase in Expenses +103.9
16
Air Transportation Business
65.3 81.6
+72.9 +32.4
Increase in profit +16.3
Changes in Operating Income
Accounting change is applied as shown on footnote of P.11.
(¥Billion)
Domestic Passenger
International Passenger
Cargo & Mail Other
Revenues
・Revenue from contracted maintenance and handling ・Mileage/Card ・LCC Business, etc Other
Expenses Sales-Linked
Operation-Linked
Fuel & Fuel Tax
・Depreciation except aircraft ・Maintenance, etc.
・Commission ・Advertisement ・In-flight service ・Ground handling, etc.
・Landing/Navigation fees ・Depreciation ・Personnel ・Contracts, etc.
Progress of Cost Restructuring Full Year Target FY14 Results Diff. vs. Target
Productivity Improvement 11.0 11.0 . 0
Appropriate Investment 05.0 06.0 +1.0
Appropriate Sales 03.5 02.5 -1.0
Operational Innovation etc. 14.5 15.0 +0.5 Total 34.0 34.5 +0.5
©ANAHD2015
Air Transportation Business
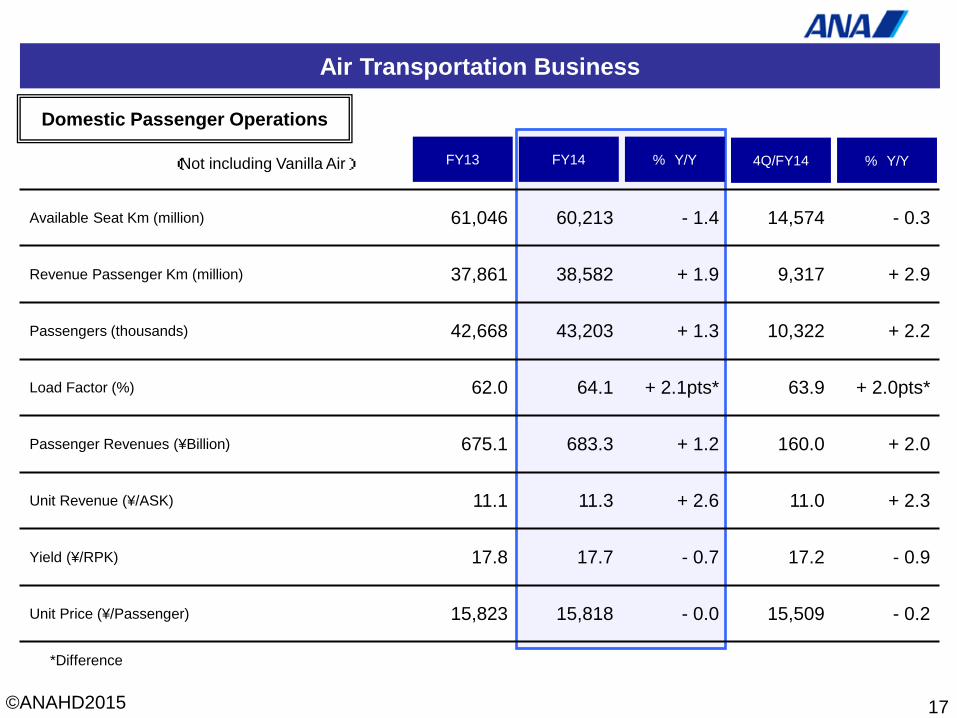
Available Seat Km (million) 61,046 60,213 - 1.4 14,574 - 0.3
Revenue Passenger Km (million) 37,861 38,582 + 1.9 9,317 + 2.9
Passengers (thousands) 42,668 43,203 + 1.3 10,322 + 2.2
Load Factor (%) 62.0 64.1 + 2.1pts* 63.9 + 2.0pts*
Passenger Revenues (¥Billion) 675.1 683.3 + 1.2 160.0 + 2.0
Unit Revenue (¥/ASK) 11.1 11.3 + 2.6 11.0 + 2.3
Yield (¥/RPK) 17.8 17.7 - 0.7 17.2 - 0.9
Unit Price (¥/Passenger) 15,823 15,818 - 0.0 15,509 - 0.2
17
% Y/Y FY14 FY13 % Y/Y 4Q/FY14
Domestic Passenger Operations
*Difference
(Not including Vanilla Air)
©ANAHD2015
90
100
110
120
130
140
150
160
-30
-20
-10
0
10
20
30
40
1Q 2Q 3Q 4Q 1Q 2Q 3Q 4Q 1Q 2Q 3Q 4Q
FY12 FY13 FY14
総旅客単価 総旅客数 個人 プロモーション 旅行
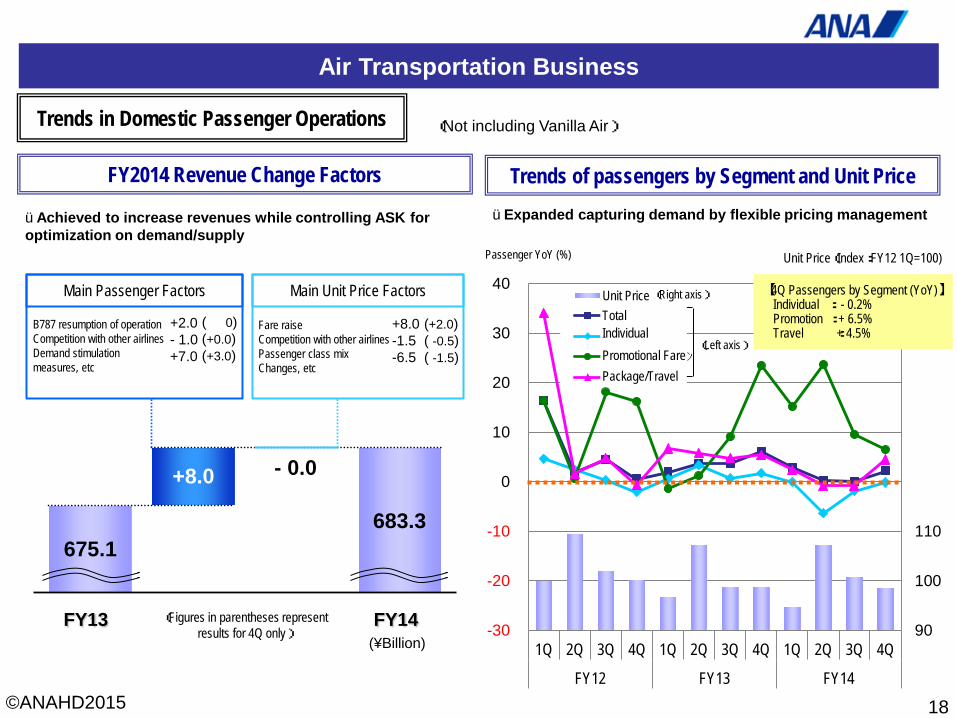
Air Transportation Business
Trends of passengers by Segment and Unit Price FY2014 Revenue Change Factors
18
üExpanded capturing demand by flexible pricing management
Trends in Domestic Passenger Operations (Not including Vanilla Air)
【4Q Passengers by Segment (YoY)】 Individual : - 0.2% Promotion : + 6.5% Travel : + 4.5%
Unit Price(Index:FY12 1Q=100) Passenger YoY (%)
(Left axis)
Unit Price Total
Individual
Promotional Fare
Package/Travel
(Right axis)
675.1
683.3
+8.0
FY13 FY14
- 0.0
üAchieved to increase revenues while controlling ASK for optimization on demand/supply
Main Passenger Factors Main Unit Price Factors
B787 resumption of operation Competition with other airlines Demand stimulation measures, etc
Fare raise Competition with other airlines Passenger class mix Changes, etc
+2.0 - 1.0 +7.0
( 0) (+0.0) (+3.0)
+8.0 -1.5 -6.5
(+2.0) ( -0.5) ( -1.5)
(Figures in parentheses represent results for 4Q only)
(¥Billion)
©ANAHD2015
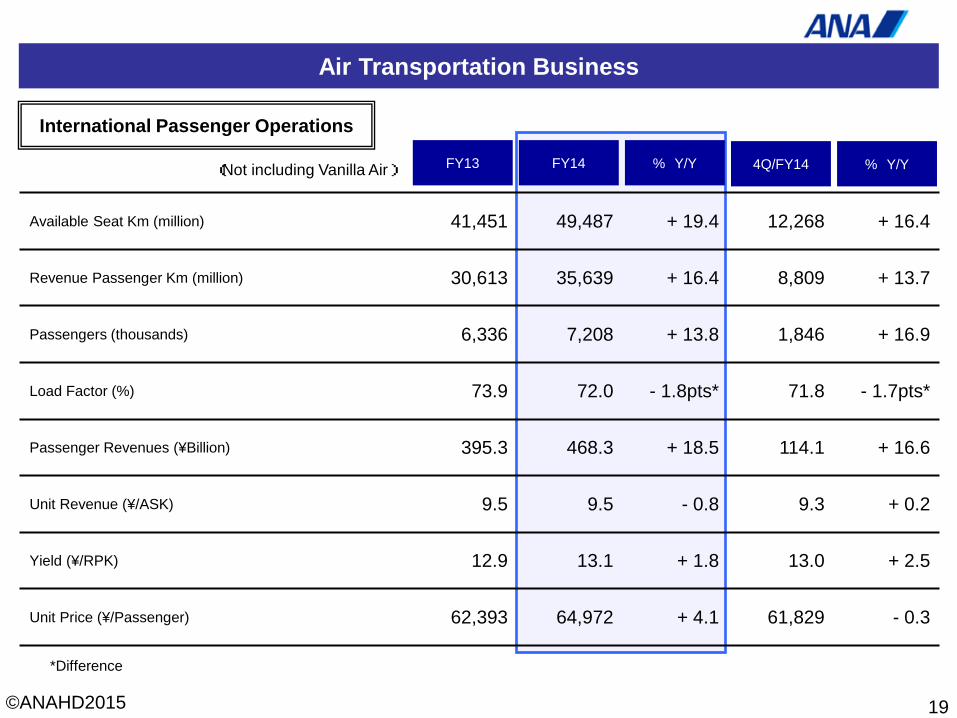
Air Transportation Business
19
% Y/Y FY14 FY13 % Y/Y 4Q/FY14
Available Seat Km (million) 41,451 49,487 + 19.4 12,268 + 16.4
Revenue Passenger Km (million) 30,613 35,639 + 16.4 8,809 + 13.7
Passengers (thousands) 6,336 7,208 + 13.8 1,846 + 16.9
Load Factor (%) 73.9 72.0 - 1.8pts* 71.8 - 1.7pts*
Passenger Revenues (¥Billion) 395.3 468.3 + 18.5 114.1 + 16.6
Unit Revenue (¥/ASK) 9.5 9.5 - 0.8 9.3 + 0.2
Yield (¥/RPK) 12.9 13.1 + 1.8 13.0 + 2.5
Unit Price (¥/Passenger) 62,393 64,972 + 4.1 61,829 - 0.3
International Passenger Operations
*Difference
(Not including Vanilla Air)
©ANAHD2015
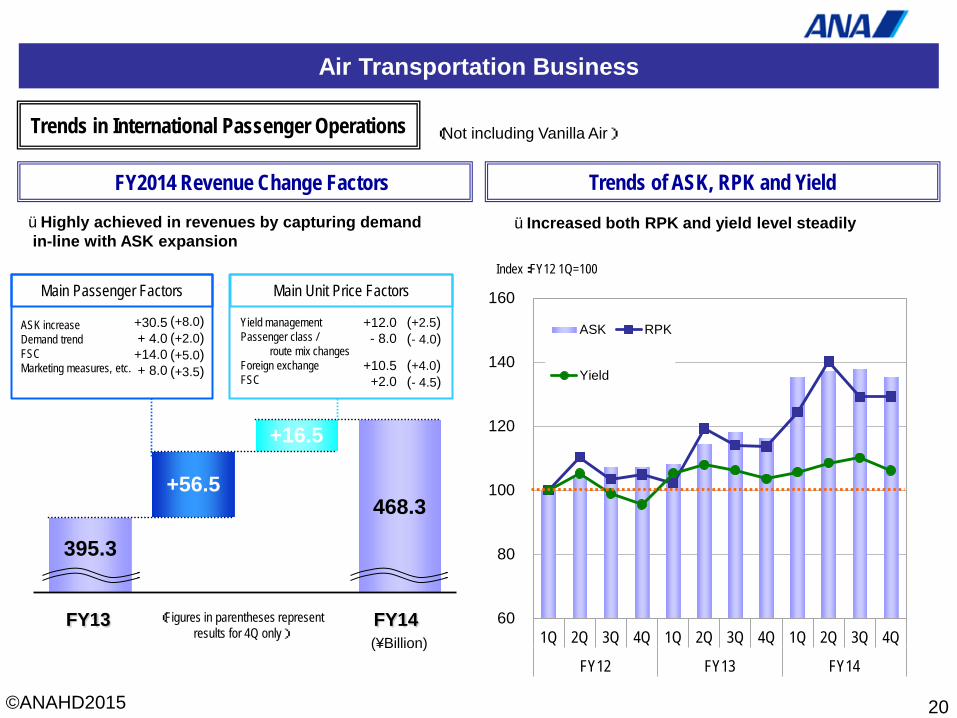
Air Transportation Business
20
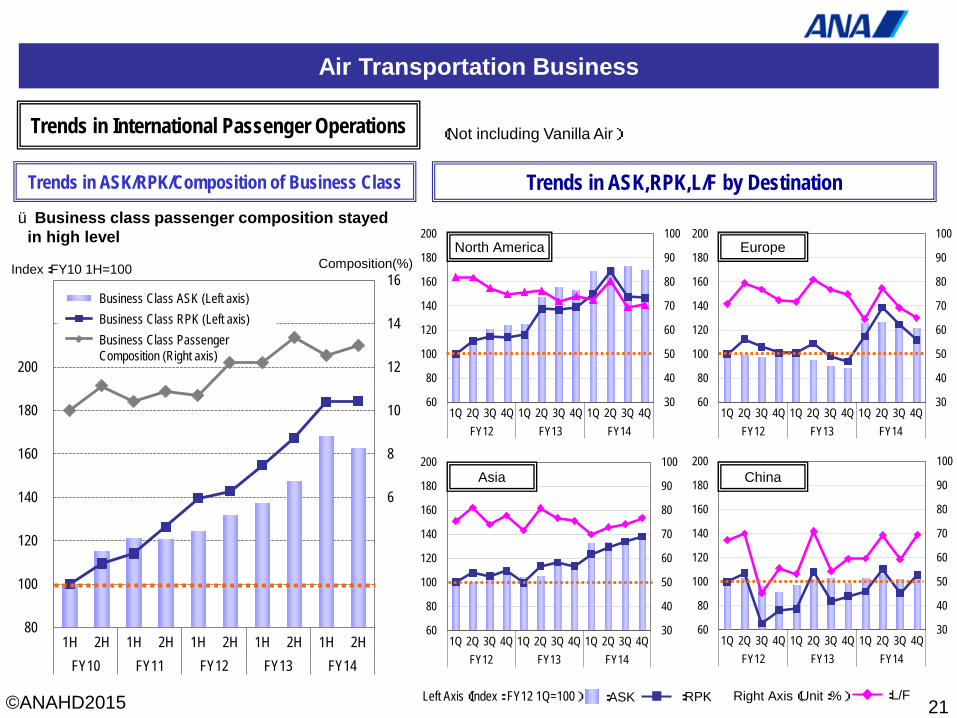
Trends of ASK, RPK and Yield
üIncreased both RPK and yield level steadily
FY2014 Revenue Change Factors üHighly achieved in revenues by capturing demand in-line with ASK expansion
60
80
100
120
140
160
1Q 2Q 3Q 4Q 1Q 2Q 3Q 4Q 1Q 2Q 3Q 4Q
FY12 FY13 FY14
ASK RPK
Yield
Trends in International Passenger Operations (Not including Vanilla Air)
Index:FY12 1Q=100
395.3
468.3
+16.5
+56.5
FY13 FY14
Main Passenger Factors
ASK increase Demand trend FSC Marketing measures, etc.
Main Unit Price Factors
Yield management Passenger class / route mix changes Foreign exchange FSC
(Figures in parentheses represent results for 4Q only)
(¥Billion)
+30.5 + 4.0 +14.0 + 8.0
(+8.0) (+2.0) (+5.0) (+3.5)
+12.0 - 8.0
+10.5 +2.0
(+2.5) (- 4.0)
(+4.0) (- 4.5)
©ANAHD2015
0
2
4
6
8
10
12
14
16
80
100
120
140
160
180
200
220
240
1H 2H 1H 2H 1H 2H 1H 2H 1H 2HFY10 FY11 FY12 FY13 FY14
ビジネスクラス座席キロ(ASK)左軸 ビジネスクラス旅客キロ(RPK)=左軸 ビジネスクラス旅客数構成比=右軸
Air Transportation Business
21 :ASK Left Axis(Index: FY12 1Q=100) Right Axis(Unit:%) :RPK :L/F
Trends in ASK,RPK,L/F by Destination Trends in ASK/RPK/Composition of Business Class
Composition(%)
ü Business class passenger composition stayed in high level
Trends in International Passenger Operations (Not including Vanilla Air)
30
40
50
60
70
80
90
100
60
80
100
120
140
160
180
200
1Q 2Q 3Q 4Q 1Q 2Q 3Q 4Q 1Q 2Q 3Q 4QFY12 FY13 FY14
30
40
50
60
70
80
90
100
60
80
100
120
140
160
180
200
1Q 2Q 3Q 4Q 1Q 2Q 3Q 4Q 1Q 2Q 3Q 4QFY12 FY13 FY14
30
40
50
60
70
80
90
100
60
80
100
120
140
160
180
200
1Q 2Q 3Q 4Q 1Q 2Q 3Q 4Q 1Q 2Q 3Q 4QFY12 FY13 FY14
30
40
50
60
70
80
90
100
60
80
100
120
140
160
180
200
1Q 2Q 3Q 4Q 1Q 2Q 3Q 4Q 1Q 2Q 3Q 4QFY12 FY13 FY14
North America
Asia
Europe
China
Index:FY10 1H=100
Business Class ASK (Left axis)
Business Class RPK (Left axis)
Business Class Passenger Composition (Right axis)
©ANAHD2015
Air Transportation Business
22
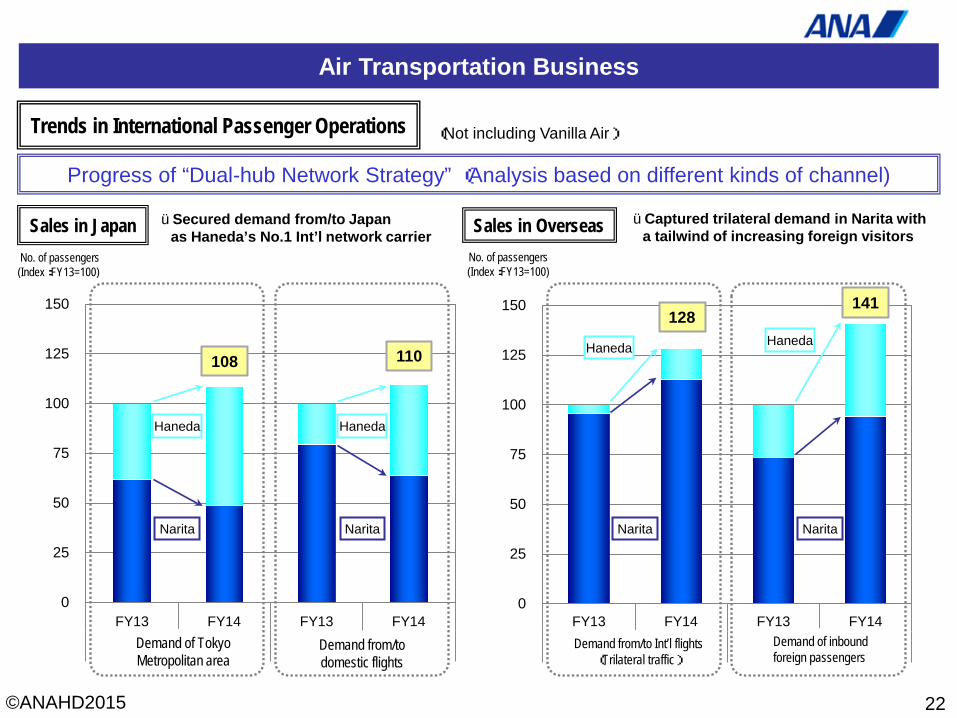
Progress of “Dual-hub Network Strategy” (Analysis based on different kinds of channel)
üSecured demand from/to Japan as Haneda’s No.1 Int’l network carrier
0
25
50
75
100
125
150
FY13 FY14 FY13 FY14
首都圏 内際接続
0
25
50
75
100
125
150
FY13 FY14 FY13 FY14
際際接続 訪日外国人
108 110
128 141
国際線乗継需要 (三国間流動) 訪日外国人需要
FY13 FY14 FY13 FY14 FY13 FY14 FY13 FY14 FY13 FY14
Trends in International Passenger Operations (Not including Vanilla Air)
Sales in Japan Sales in Overseas No. of passengers (Index:FY13=100)
No. of passengers (Index:FY13=100)
Demand of Tokyo Metropolitan area
Demand from/to domestic flights
Demand from/to Int’l flights (Trilateral traffic)
Demand of inbound foreign passengers
Narita
Haneda
Narita
Haneda
Narita Narita
Haneda Haneda
üCaptured trilateral demand in Narita with a tailwind of increasing foreign visitors
©ANAHD2015
Air Transportation Business
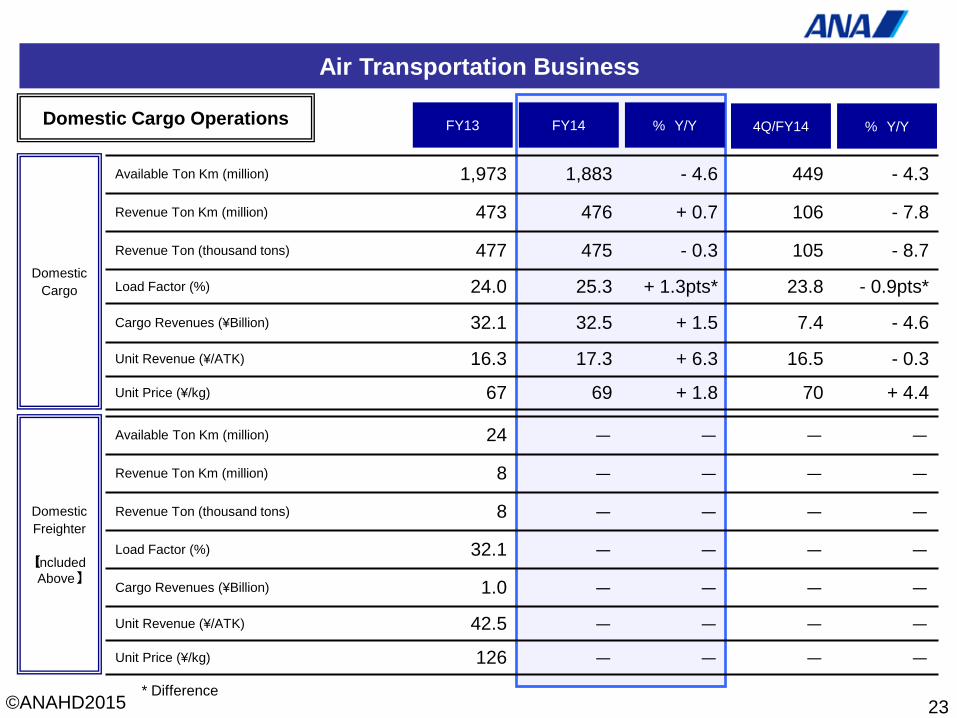
Domestic Cargo
Available Ton Km (million) 1,973 1,883 - 4.6 449 - 4.3
Revenue Ton Km (million) 473 476 + 0.7 106 - 7.8
Revenue Ton (thousand tons) 477 475 - 0.3 105 - 8.7
Load Factor (%) 24.0 25.3 + 1.3pts* 23.8 - 0.9pts*
Cargo Revenues (¥Billion) 32.1 32.5 + 1.5 7.4 - 4.6
Unit Revenue (¥/ATK) 16.3 17.3 + 6.3 16.5 - 0.3
Unit Price (¥/kg) 67 69 + 1.8 70 + 4.4
23
Domestic Freighter
【Included
Above】
Available Ton Km (million) 24 - - - -
Revenue Ton Km (million) 8 - - - -
Revenue Ton (thousand tons) 8 - - - -
Load Factor (%) 32.1 - - - -
Cargo Revenues (¥Billion) 1.0 - - - -
Unit Revenue (¥/ATK) 42.5 - - - -
Unit Price (¥/kg) 126 - - - -
% Y/Y FY14 FY13 % Y/Y 4Q/FY14 Domestic Cargo Operations
* Difference

©ANAHD2015
Intentionally Blank
24
©ANAHD2015
Air Transportation Business
25
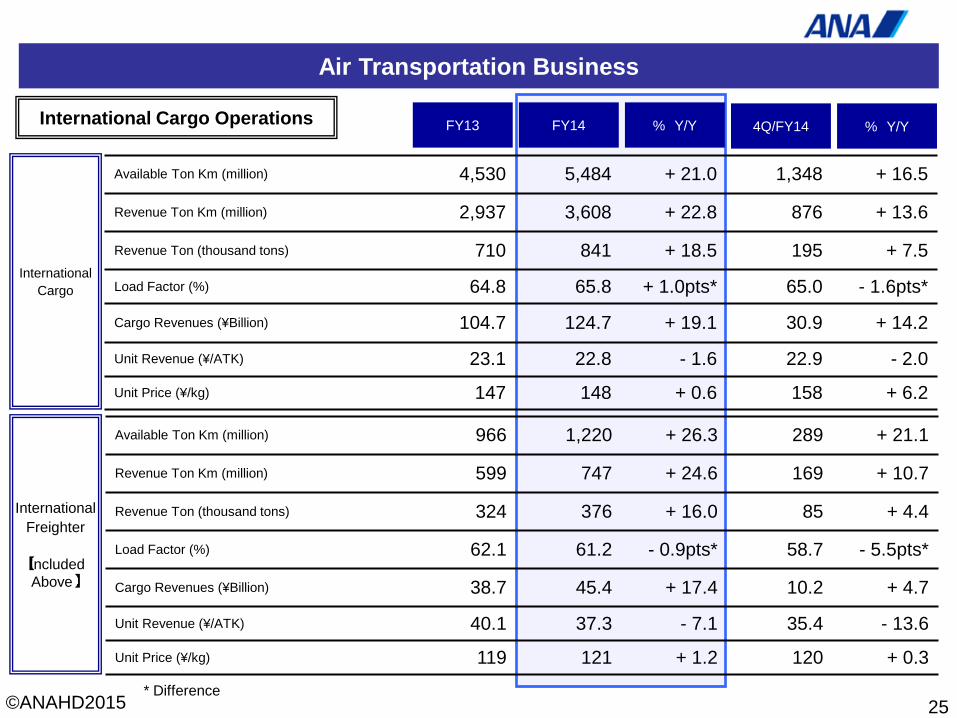
International Cargo
Available Ton Km (million) 4,530 5,484 + 21.0 1,348 + 16.5
Revenue Ton Km (million) 2,937 3,608 + 22.8 876 + 13.6
Revenue Ton (thousand tons) 710 841 + 18.5 195 + 7.5
Load Factor (%) 64.8 65.8 + 1.0pts* 65.0 - 1.6pts*
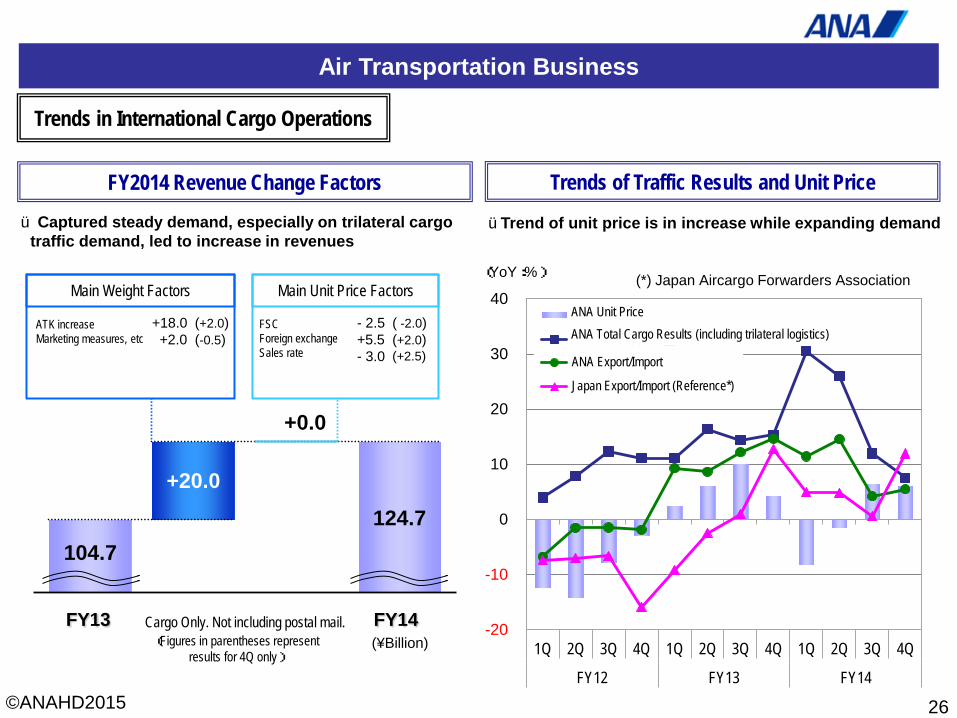
Cargo Revenues (¥Billion) 104.7 124.7 + 19.1 30.9 + 14.2
Unit Revenue (¥/ATK) 23.1 22.8 - 1.6 22.9 - 2.0
Unit Price (¥/kg) 147 148 + 0.6 158 + 6.2
International Freighter
【Included
Above】
Available Ton Km (million) 966 1,220 + 26.3 289 + 21.1
Revenue Ton Km (million) 599 747 + 24.6 169 + 10.7
Revenue Ton (thousand tons) 324 376 + 16.0 85 + 4.4
Load Factor (%) 62.1 61.2 - 0.9pts* 58.7 - 5.5pts*
Cargo Revenues (¥Billion) 38.7 45.4 + 17.4 10.2 + 4.7
Unit Revenue (¥/ATK) 40.1 37.3 - 7.1 35.4 - 13.6
Unit Price (¥/kg) 119 121 + 1.2 120 + 0.3
% Y/Y FY14 FY13 % Y/Y 4Q/FY14 International Cargo Operations
* Difference
©ANAHD2015
Air Transportation Business
(*) Japan Aircargo Forwarders Association
26
ü Captured steady demand, especially on trilateral cargo traffic demand, led to increase in revenues
üTrend of unit price is in increase while expanding demand
-20
-10
0
10
20
30
40
1Q 2Q 3Q 4Q 1Q 2Q 3Q 4Q 1Q 2Q 3Q 4Q
FY12 FY13 FY14
ANA全体貨物単価
ANA全体貨物重量
ANA日本輸出入重量
日本輸出入重量(参考*)
Trends in International Cargo Operations
FY2014 Revenue Change Factors Trends of Traffic Results and Unit Price
ANA Unit Price
ANA Total Cargo Results (including trilateral logistics)
ANA Export/Import
Japan Export/Import (Reference*)
(YoY:%)
104.7 124.7
+20.0
FY13 FY14
+0.0
Main Weight Factors
ATK increase Marketing measures, etc
Main Unit Price Factors
FSC Foreign exchange Sales rate
+18.0 +2.0
(+2.0) (-0.5)
- 2.5 +5.5 - 3.0
( -2.0) (+2.0) (+2.5)
(Figures in parentheses represent results for 4Q only)
Cargo Only. Not including postal mail. (¥Billion)
©ANAHD2015
Air Transportation Business
27
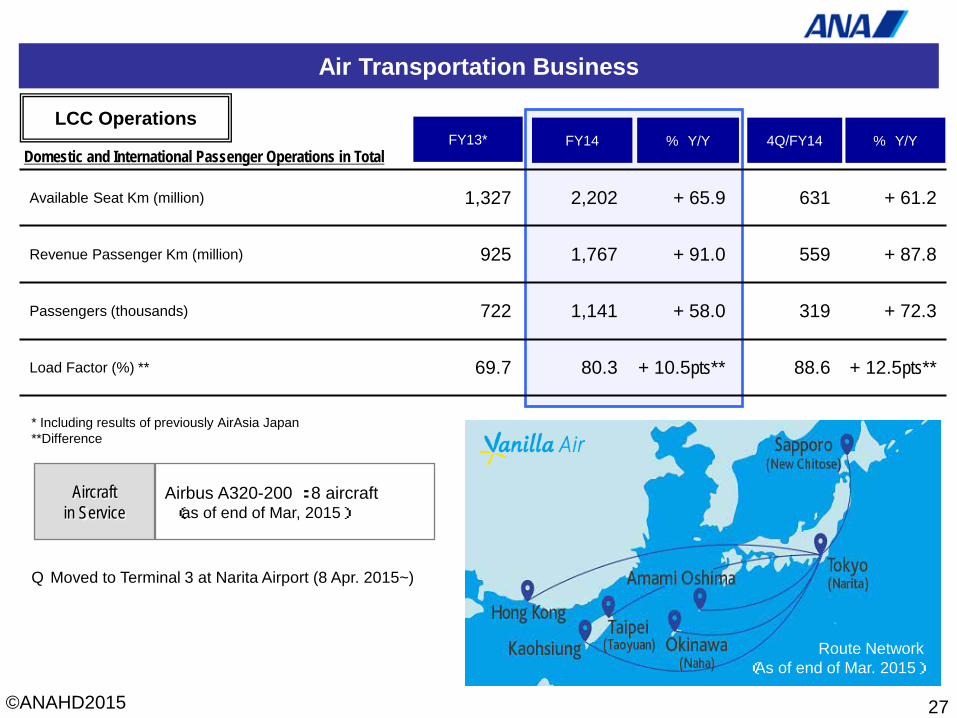
Q Moved to Terminal 3 at Narita Airport (8 Apr. 2015~)
Available Seat Km (million) 1,327 2,202 + 65.9 631 + 61.2
Revenue Passenger Km (million) 925 1,767 + 91.0 559 + 87.8
Passengers (thousands) 722 1,141 + 58.0 319 + 72.3
Load Factor (%) ** 69.7 80.3 + 10.5pts** 88.6 + 12.5pts**
% Y/Y FY14 FY13* % Y/Y 4Q/FY14 LCC Operations
Domestic and International Passenger Operations in Total
* Including results of previously AirAsia Japan **Difference
Aircraft in Service
Airbus A320-200 : 8 aircraft (as of end of Mar, 2015)
Route Network (As of end of Mar. 2015)
©ANAHD2015
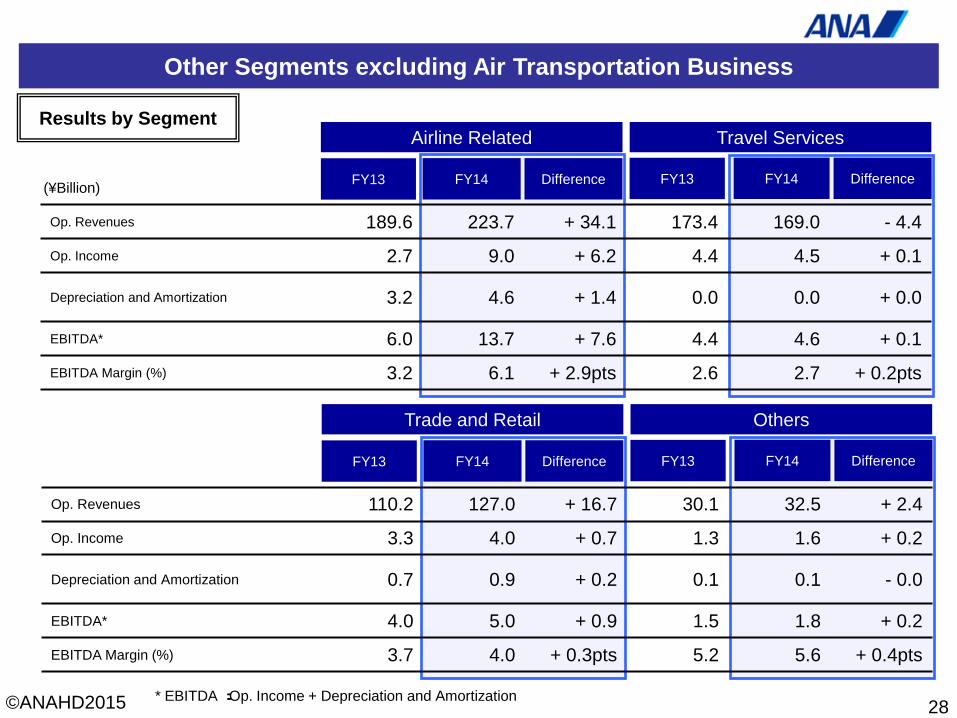
Other Segments excluding Air Transportation Business
Airline Related Travel Services
FY13 FY14 Difference FY13 FY14 Difference
Op. Revenues 189.6 223.7 + 34.1 173.4 169.0 - 4.4
Op. Income 2.7 9.0 + 6.2 4.4 4.5 + 0.1
Depreciation and Amortization 3.2 4.6 + 1.4 0.0 0.0 + 0.0
EBITDA* 6.0 13.7 + 7.6 4.4 4.6 + 0.1
EBITDA Margin (%) 3.2 6.1 + 2.9pts 2.6 2.7 + 0.2pts
28
Trade and Retail Others
FY13 FY14 Difference FY13 FY14 Difference
Op. Revenues 110.2 127.0 + 16.7 30.1 32.5 + 2.4
Op. Income 3.3 4.0 + 0.7 1.3 1.6 + 0.2
Depreciation and Amortization 0.7 0.9 + 0.2 0.1 0.1 - 0.0
EBITDA* 4.0 5.0 + 0.9 1.5 1.8 + 0.2
EBITDA Margin (%) 3.7 4.0 + 0.3pts 5.2 5.6 + 0.4pts
Results by Segment
* EBITDA :Op. Income + Depreciation and Amortization
(¥Billion)
©ANAHD2015
29
Ⅲ. FY2015 Earnings Forecast 《Details》
©ANAHD2015
FY2015 Earnings Forecast
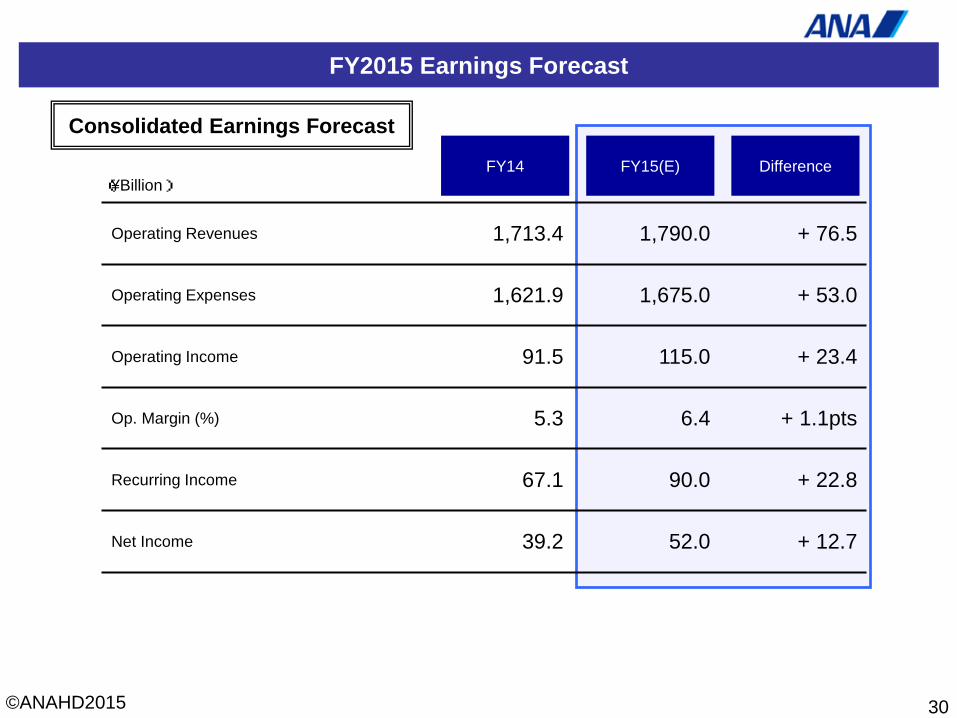
Difference FY15(E) FY14
Operating Revenues 1,713.4 1,790.0 + 76.5
Operating Expenses 1,621.9 1,675.0 + 53.0
Operating Income 91.5 115.0 + 23.4
Op. Margin (%) 5.3 6.4 + 1.1pts
Recurring Income 67.1 90.0 + 22.8
Net Income 39.2 52.0 + 12.7
30
Consolidated Earnings Forecast
(¥Billion)
©ANAHD2015
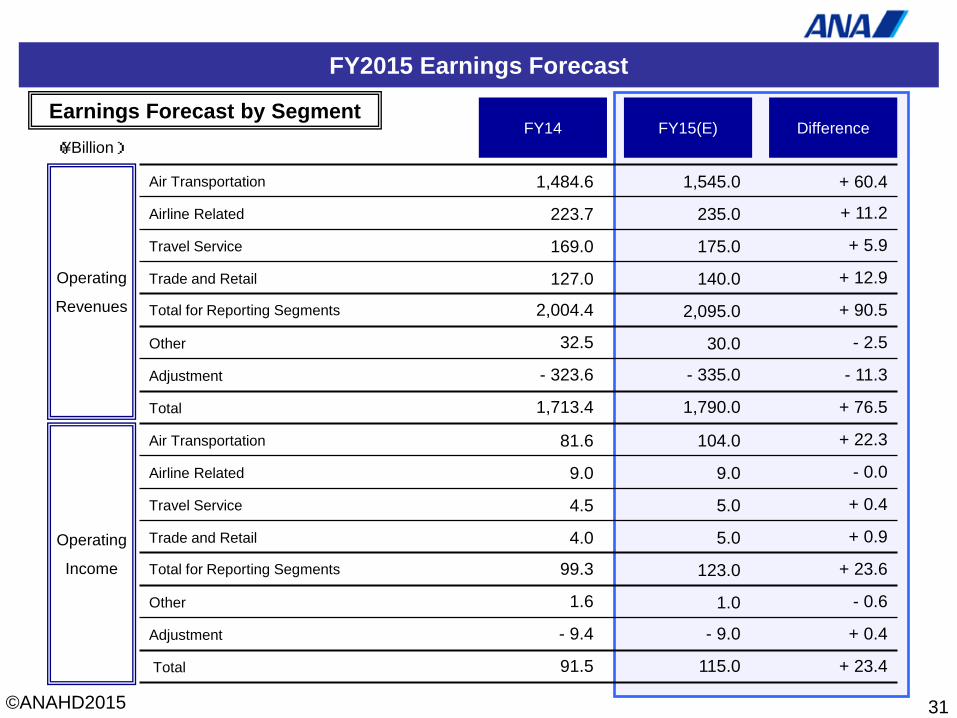
FY2015 Earnings Forecast
Operating
Revenues
Operating
Income
Difference FY15(E) FY14
Air Transportation 1,484.6 1,545.0 + 60.4
Airline Related 223.7 235.0 + 11.2
Travel Service 169.0 175.0 + 5.9
Trade and Retail 127.0 140.0 + 12.9
Total for Reporting Segments 2,004.4 2,095.0 + 90.5
Other 32.5 30.0 - 2.5
Adjustment - 323.6 - 335.0 - 11.3
Total 1,713.4 1,790.0 + 76.5
Air Transportation 81.6 104.0 + 22.3
Airline Related 9.0 9.0 - 0.0
Travel Service 4.5 5.0 + 0.4
Trade and Retail 4.0 5.0 + 0.9
Total for Reporting Segments 99.3 123.0 + 23.6
Other 1.6 1.0 - 0.6
Adjustment - 9.4 - 9.0 + 0.4
Total 91.5 115.0 + 23.4
31
Earnings Forecast by Segment (¥Billion)
©ANAHD2015
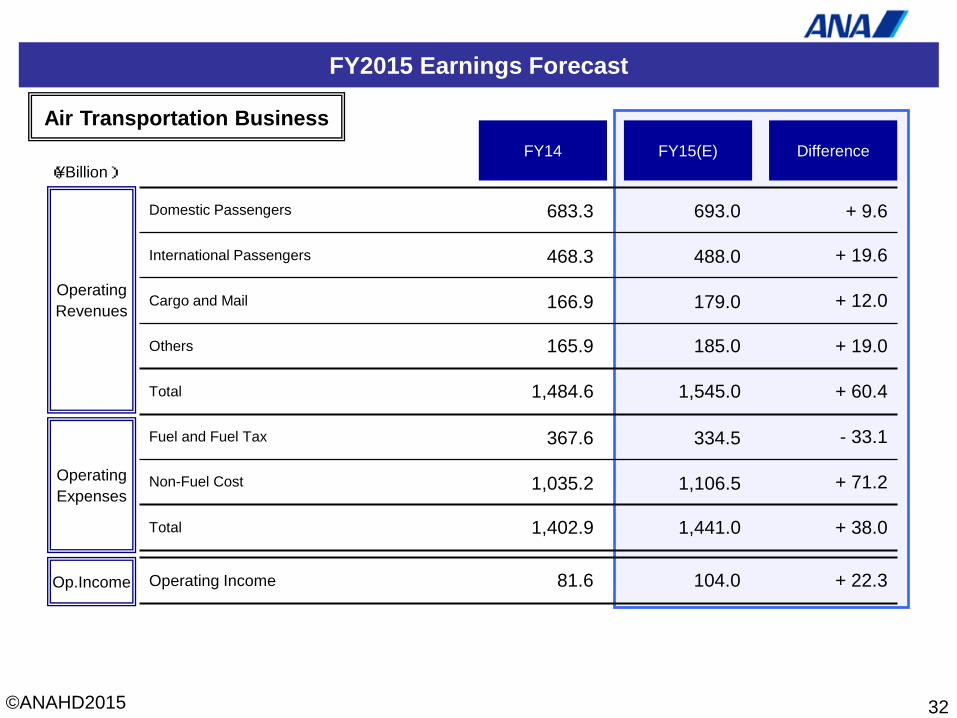
Operating Revenues
Operating Expenses
Difference FY15(E) FY14
FY2015 Earnings Forecast
Op.Income
Domestic Passengers 683.3 693.0 + 9.6
International Passengers 468.3 488.0 + 19.6
Cargo and Mail 166.9 179.0 + 12.0
Others 165.9 185.0 + 19.0
Total 1,484.6 1,545.0 + 60.4
Fuel and Fuel Tax 367.6 334.5 - 33.1
Non-Fuel Cost 1,035.2 1,106.5 + 71.2
Total 1,402.9 1,441.0 + 38.0
Operating Income 81.6 104.0 + 22.3
32
Air Transportation Business
(¥Billion)
©ANAHD2015
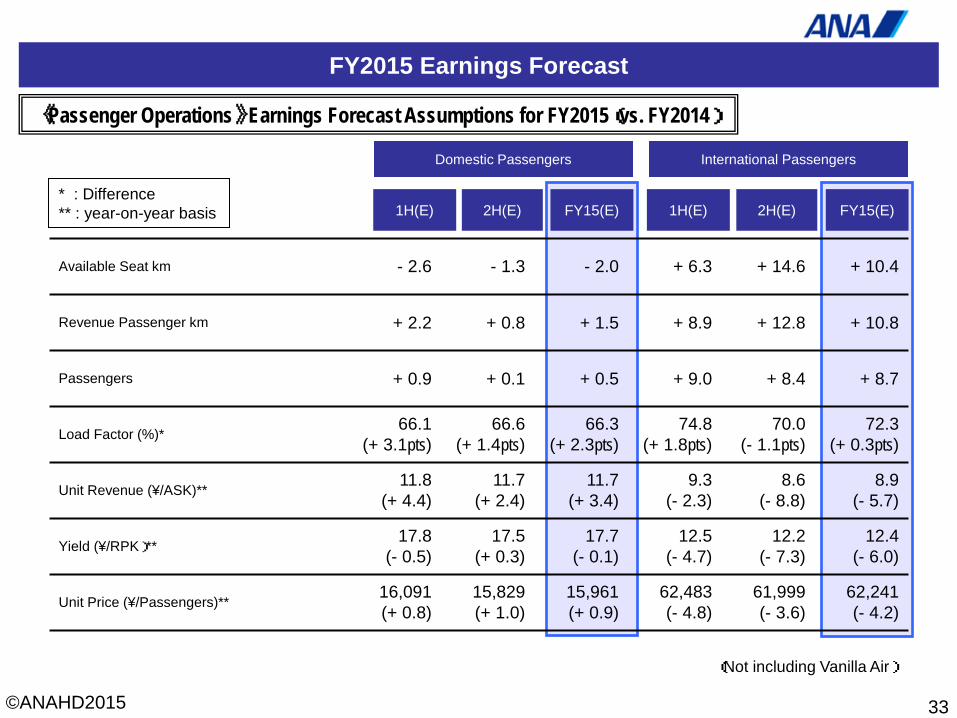
FY2015 Earnings Forecast
Domestic Passengers International Passengers
Available Seat km - 2.6 - 1.3 - 2.0 + 6.3 + 14.6 + 10.4
Revenue Passenger km + 2.2 + 0.8 + 1.5 + 8.9 + 12.8 + 10.8
Passengers + 0.9 + 0.1 + 0.5 + 9.0 + 8.4 + 8.7
Load Factor (%)* 66.1 (+ 3.1pts)
66.6 (+ 1.4pts)
66.3 (+ 2.3pts)
74.8 (+ 1.8pts)
70.0 (- 1.1pts)
72.3 (+ 0.3pts)
Unit Revenue (¥/ASK)** 11.8 (+ 4.4)
11.7 (+ 2.4)
11.7 (+ 3.4)
9.3 (- 2.3)
8.6 (- 8.8)
8.9 (- 5.7)
Yield (¥/RPK)** 17.8 (- 0.5)
17.5 (+ 0.3)
17.7 (- 0.1)
12.5 (- 4.7)
12.2 (- 7.3)
12.4 (- 6.0)
Unit Price (¥/Passengers)** 16,091 (+ 0.8)
15,829 (+ 1.0)
15,961 (+ 0.9)
62,483 (- 4.8)
61,999 (- 3.6)
62,241 (- 4.2)
2H(E) FY15(E) 1H(E) 2H(E) FY15(E) 1H(E)
33
《Passenger Operations》 Earnings Forecast Assumptions for FY2015(vs. FY2014)
(Not including Vanilla Air)
* : Difference ** : year-on-year basis
©ANAHD2015
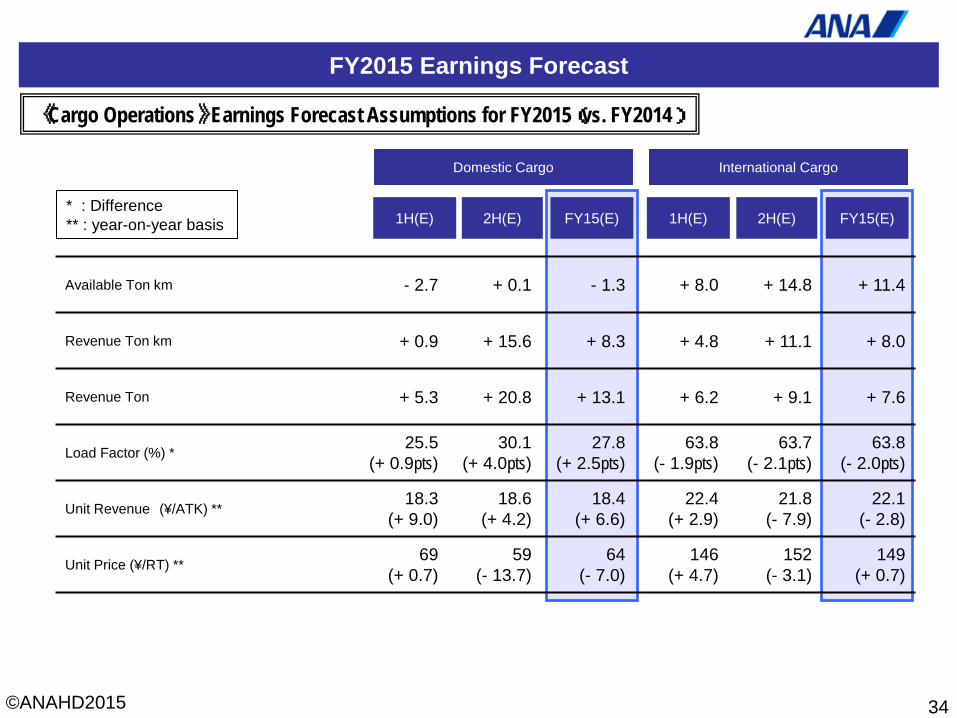
FY2015 Earnings Forecast
34
Domestic Cargo International Cargo
2H(E) FY15(E) 1H(E) 2H(E) FY15(E) 1H(E)
《Cargo Operations》 Earnings Forecast Assumptions for FY2015(vs. FY2014)
* : Difference ** : year-on-year basis
Available Ton km - 2.7 + 0.1 - 1.3 + 8.0 + 14.8 + 11.4
Revenue Ton km + 0.9 + 15.6 + 8.3 + 4.8 + 11.1 + 8.0
Revenue Ton + 5.3 + 20.8 + 13.1 + 6.2 + 9.1 + 7.6
Load Factor (%) * 25.5 (+ 0.9pts)
30.1 (+ 4.0pts)
27.8 (+ 2.5pts)
63.8 (- 1.9pts)
63.7 (- 2.1pts)
63.8 (- 2.0pts)
Unit Revenue (¥/ATK) ** 18.3 (+ 9.0)
18.6 (+ 4.2)
18.4 (+ 6.6)
22.4 (+ 2.9)
21.8 (- 7.9)
22.1 (- 2.8)
Unit Price (¥/RT) ** 69 (+ 0.7)
59 (- 13.7)
64 (- 7.0)
146 (+ 4.7)
152 (- 3.1)
149 (+ 0.7)
©ANAHD2015
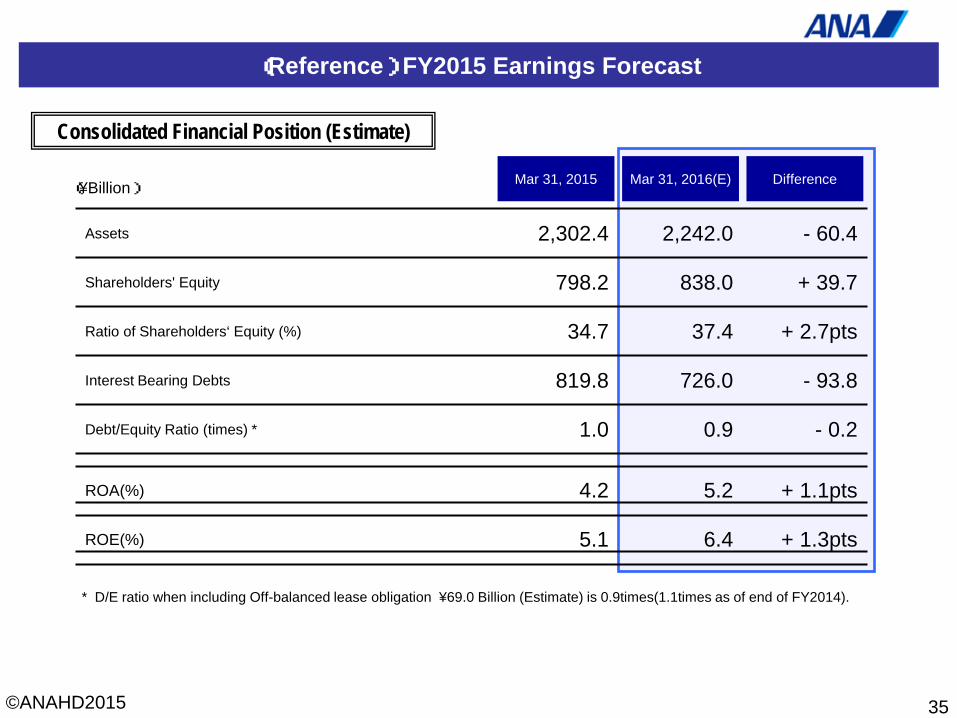
(Reference) FY2015 Earnings Forecast
35
Assets 2,302.4 2,242.0 - 60.4
Shareholders' Equity 798.2 838.0 + 39.7
Ratio of Shareholders‘ Equity (%) 34.7 37.4 + 2.7pts
Interest Bearing Debts 819.8 726.0 - 93.8
Debt/Equity Ratio (times) * 1.0 0.9 - 0.2
Difference Mar 31, 2016(E) Mar 31, 2015
ROA(%) 4.2 5.2 + 1.1pts
ROE(%) 5.1 6.4 + 1.3pts
Consolidated Financial Position (Estimate)
(¥Billion)
* D/E ratio when including Off-balanced lease obligation ¥69.0 Billion (Estimate) is 0.9times(1.1times as of end of FY2014).
©ANAHD2015
36
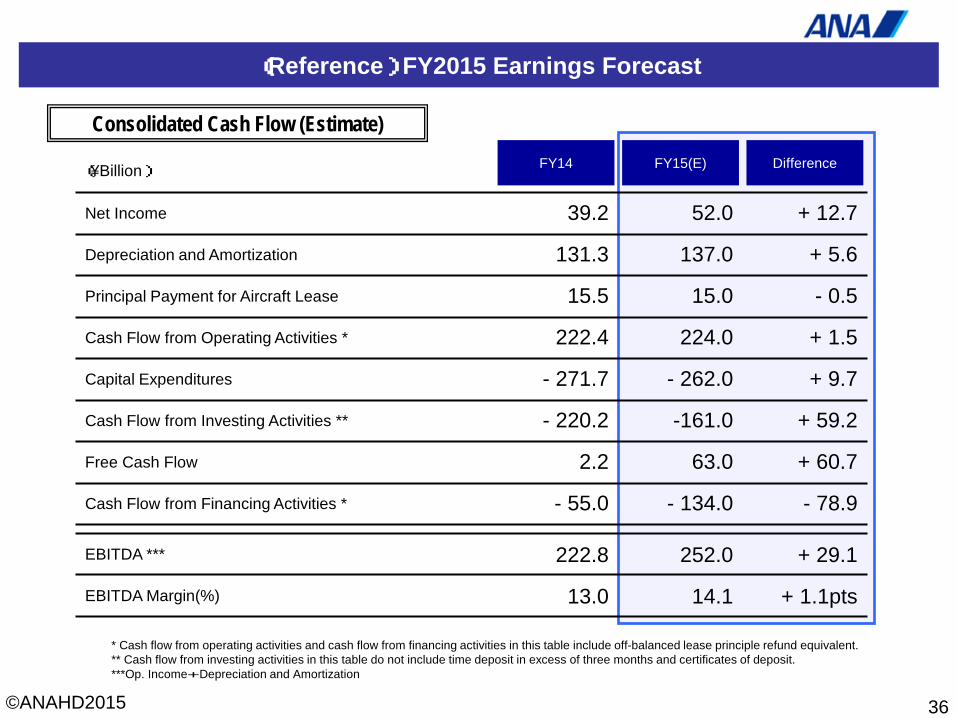
Net Income 39.2 52.0 + 12.7
Depreciation and Amortization 131.3 137.0 + 5.6
Principal Payment for Aircraft Lease 15.5 15.0 - 0.5
Cash Flow from Operating Activities * 222.4 224.0 + 1.5
Capital Expenditures - 271.7 - 262.0 + 9.7
Cash Flow from Investing Activities ** - 220.2 -161.0 + 59.2
Free Cash Flow 2.2 63.0 + 60.7
Cash Flow from Financing Activities * - 55.0 - 134.0 - 78.9
Difference FY15(E) FY14
EBITDA *** 222.8 252.0 + 29.1
EBITDA Margin(%) 13.0 14.1 + 1.1pts
(Reference) FY2015 Earnings Forecast
Consolidated Cash Flow (Estimate)
(¥Billion)
* Cash flow from operating activities and cash flow from financing activities in this table include off-balanced lease principle refund equivalent. ** Cash flow from investing activities in this table do not include time deposit in excess of three months and certificates of deposit. ***Op. Income+Depreciation and Amortization
©ANAHD2015
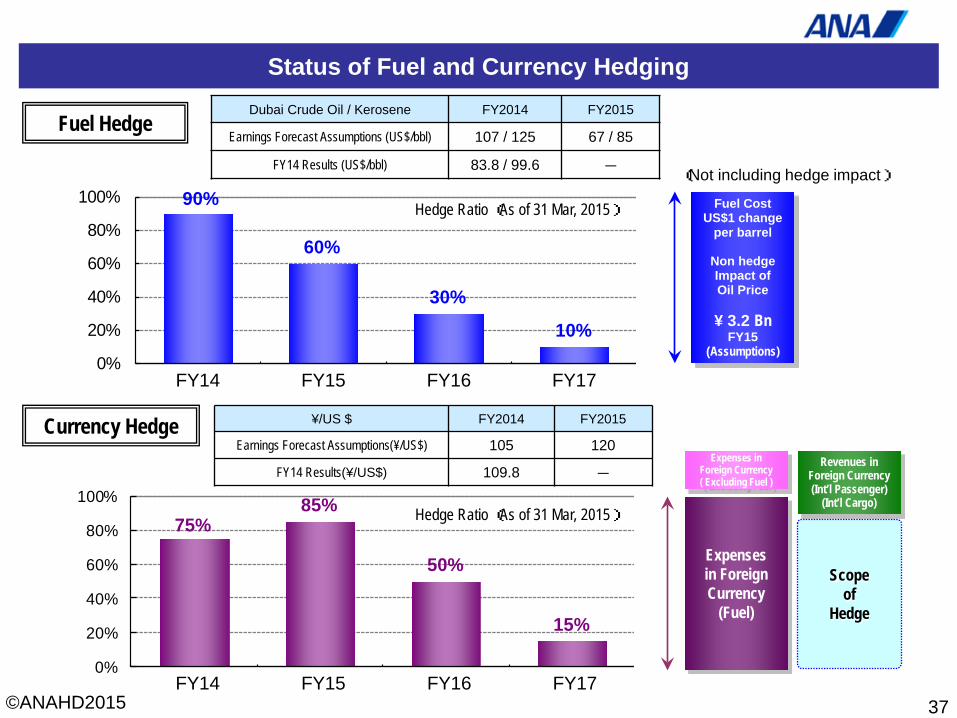
(Not including hedge impact)
Status of Fuel and Currency Hedging
75%85%
50%
15%
0%
20%
40%
60%
80%
100%
Expenses in Foreign Currency ( Excluding Fuel )
Revenues in Foreign Currency (Int’l Passenger)
(Int’l Cargo)
Scope of
Hedge
Expenses in Foreign Currency
(Fuel)
FY14 FY15 FY16 FY17
FY14 FY15 FY16 FY17
37
Dubai Crude Oil / Kerosene FY2014 FY2015
Earnings Forecast Assumptions (US$/bbl) 107 / 125 67 / 85
FY14 Results (US$/bbl) 83.8 / 99.6 -
¥/US $ FY2014 FY2015
Earnings Forecast Assumptions(¥/US$) 105 120
FY14 Results(¥/US$) 109.8 -
Fuel Hedge
Currency Hedge
Hedge Ratio (As of 31 Mar, 2015)
Hedge Ratio (As of 31 Mar, 2015)
Fuel Cost US$1 change
per barrel
Non hedge Impact of Oil Price
¥ 3.2 Bn
FY15 (Assumptions)
90%
60%
30%
10%
0%
20%
40%
60%
80%
100%
©ANAHD2015
+0
+20
+40
+60
+80
+100
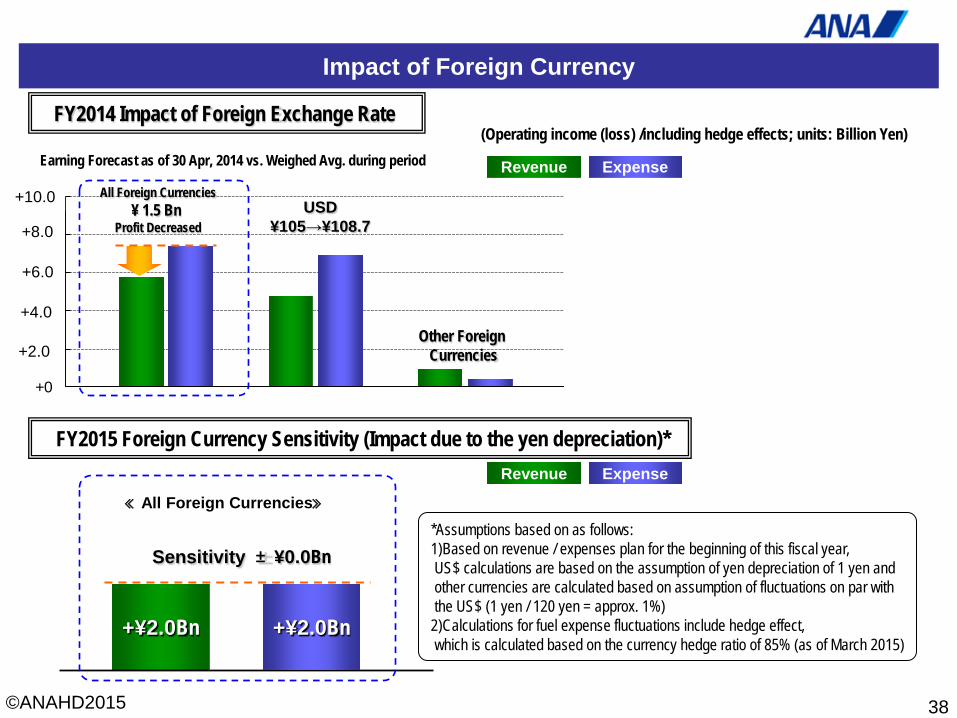
Impact of Foreign Currency
38
Revenue Expense
+¥2.0Bn
Revenue Expense
+¥2.0Bn
FY2014 Impact of Foreign Exchange Rate
FY2015 Foreign Currency Sensitivity (Impact due to the yen depreciation)*
+10.0
+8.0
+6.0
+4.0
+2.0
All Foreign Currencies ¥ 1.5 Bn
Profit Decreased USD
¥105→¥108.7
Other Foreign Currencies
*Assumptions based on as follows: 1)Based on revenue / expenses plan for the beginning of this fiscal year, US$ calculations are based on the assumption of yen depreciation of 1 yen and other currencies are calculated based on assumption of fluctuations on par with the US$ (1 yen / 120 yen = approx. 1%) 2)Calculations for fuel expense fluctuations include hedge effect, which is calculated based on the currency hedge ratio of 85% (as of March 2015)
(Operating income (loss) /including hedge effects; units: Billion Yen) Earning Forecast as of 30 Apr, 2014 vs. Weighed Avg. during period
≪All Foreign Currencies≫
Sensitivity ±¥0.0Bn
©ANAHD2015
39
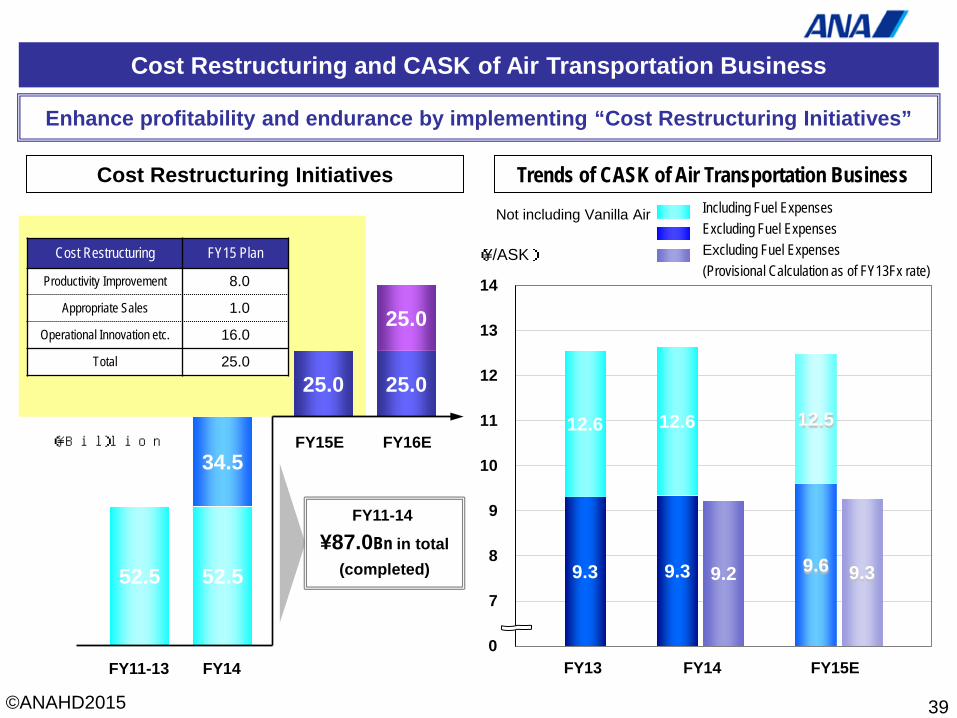
Cost Restructuring and CASK of Air Transportation Business
Enhance profitability and endurance by implementing “Cost Restructuring Initiatives”
34.5
52.5
FY11-13 FY14
25.0
Cost Restructuring Initiatives
FY15E
Cost Restructuring FY15 Plan
Productivity Improvement 08.0
Appropriate Sales 01.0
Operational Innovation etc. 16.0
Total 25.0
Trends of CASK of Air Transportation Business
25.0
25.0
FY16E
52.5
(¥/ASK)
Not including Vanilla Air
9.3 9.3 9.2 9.6 9.3
12.6 12.6 12.5
6
7
8
9
10
11
12
13
14
0 FY13 FY14 FY15E
Including Fuel Expenses Excluding Fuel Expenses Excluding Fuel Expenses (Provisional Calculation as of FY13Fx rate)
(¥Billion)
FY11-14
¥87.0Bn in total (completed)

©ANAHD2015
Intentionally Blank
40
©ANAHD2015
Ⅳ. Supplemental Reference
41
©ANAHD2015
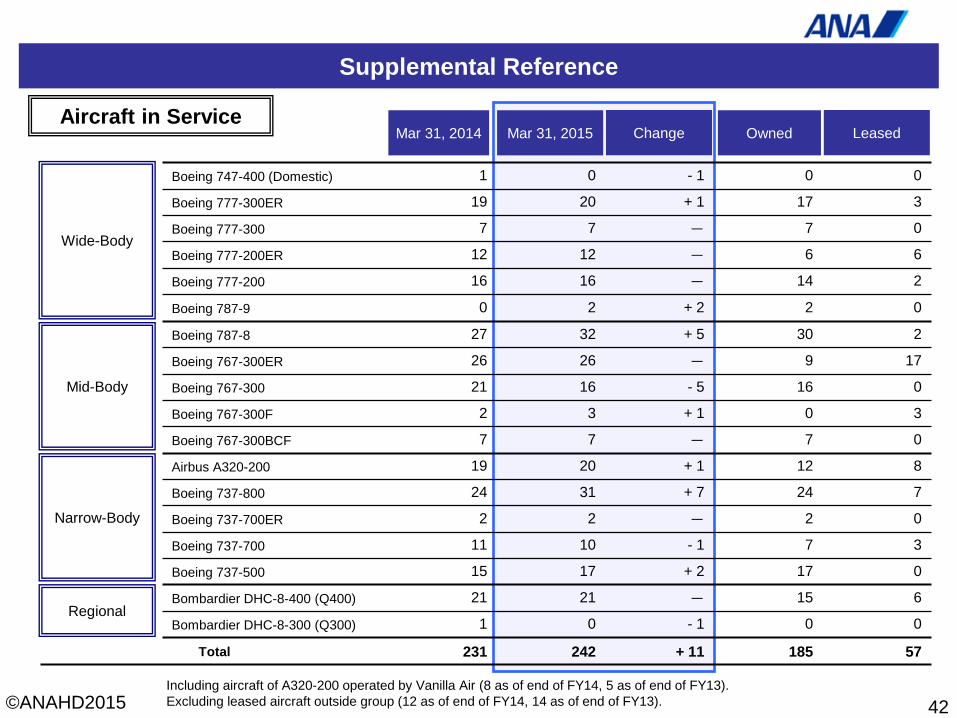
Supplemental Reference
Mar 31, 2014
Boeing 747-400 (Domestic) 1 0 - 1 0 0
Boeing 777-300ER 19 20 + 1 17 3
Boeing 777-300 7 7 - 7 0
Boeing 777-200ER 12 12 - 6 6
Boeing 777-200 16 16 - 14 2
Boeing 787-9 0 2 + 2 2 0
Boeing 787-8 27 32 + 5 30 2
Boeing 767-300ER 26 26 - 9 17
Boeing 767-300 21 16 - 5 16 0
Boeing 767-300F 2 3 + 1 0 3
Boeing 767-300BCF 7 7 - 7 0
Airbus A320-200 19 20 + 1 12 8
Boeing 737-800 24 31 + 7 24 7
Boeing 737-700ER 2 2 - 2 0
Boeing 737-700 11 10 - 1 7 3
Boeing 737-500 15 17 + 2 17 0
Bombardier DHC-8-400 (Q400) 21 21 - 15 6
Bombardier DHC-8-300 (Q300) 1 0 - 1 0 0
Total 231 242 + 11 185 57
Mar 31, 2015 Owned Change Leased
Wide-Body
Mid-Body
Narrow-Body
Regional
42
Aircraft in Service
Including aircraft of A320-200 operated by Vanilla Air (8 as of end of FY14, 5 as of end of FY13). Excluding leased aircraft outside group (12 as of end of FY14, 14 as of end of FY13).
©ANAHD2015
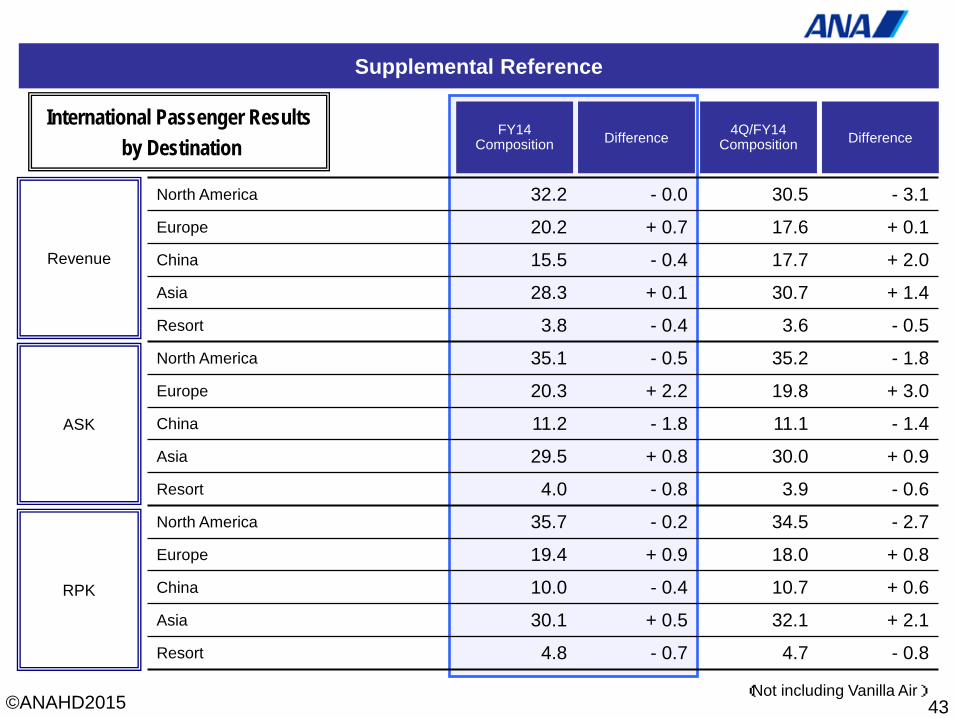
Supplemental Reference
FY14 Composition Difference
North America 32.2 - 0.0 30.5 - 3.1
Europe 20.2 + 0.7 17.6 + 0.1
China 15.5 - 0.4 17.7 + 2.0
Asia 28.3 + 0.1 30.7 + 1.4
Resort 3.8 - 0.4 3.6 - 0.5
North America 35.1 - 0.5 35.2 - 1.8
Europe 20.3 + 2.2 19.8 + 3.0
China 11.2 - 1.8 11.1 - 1.4
Asia 29.5 + 0.8 30.0 + 0.9
Resort 4.0 - 0.8 3.9 - 0.6
North America 35.7 - 0.2 34.5 - 2.7
Europe 19.4 + 0.9 18.0 + 0.8
China 10.0 - 0.4 10.7 + 0.6
Asia 30.1 + 0.5 32.1 + 2.1
Resort 4.8 - 0.7 4.7 - 0.8
Revenue
ASK
RPK
4Q/FY14 Composition Difference
43
International Passenger Results by Destination
(Not including Vanilla Air)
©ANAHD2015
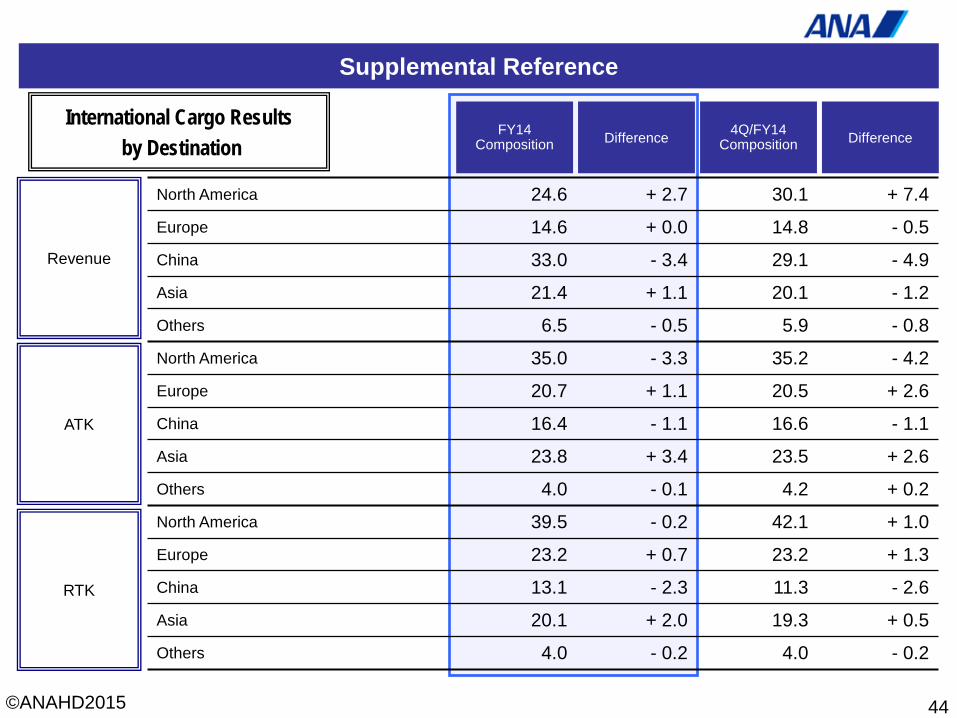
Supplemental Reference
FY14 Composition Difference
North America 24.6 + 2.7 30.1 + 7.4
Europe 14.6 + 0.0 14.8 - 0.5
China 33.0 - 3.4 29.1 - 4.9
Asia 21.4 + 1.1 20.1 - 1.2
Others 6.5 - 0.5 5.9 - 0.8
North America 35.0 - 3.3 35.2 - 4.2
Europe 20.7 + 1.1 20.5 + 2.6
China 16.4 - 1.1 16.6 - 1.1
Asia 23.8 + 3.4 23.5 + 2.6
Others 4.0 - 0.1 4.2 + 0.2
North America 39.5 - 0.2 42.1 + 1.0
Europe 23.2 + 0.7 23.2 + 1.3
China 13.1 - 2.3 11.3 - 2.6
Asia 20.1 + 2.0 19.3 + 0.5
Others 4.0 - 0.2 4.0 - 0.2
Revenue
ATK
RTK
4Q/FY14 Composition Difference
44
International Cargo Results by Destination

©ANAHD2015
(MEMO)
45

©ANAHD2015
(MEMO)
46
©ANAHD2015
47
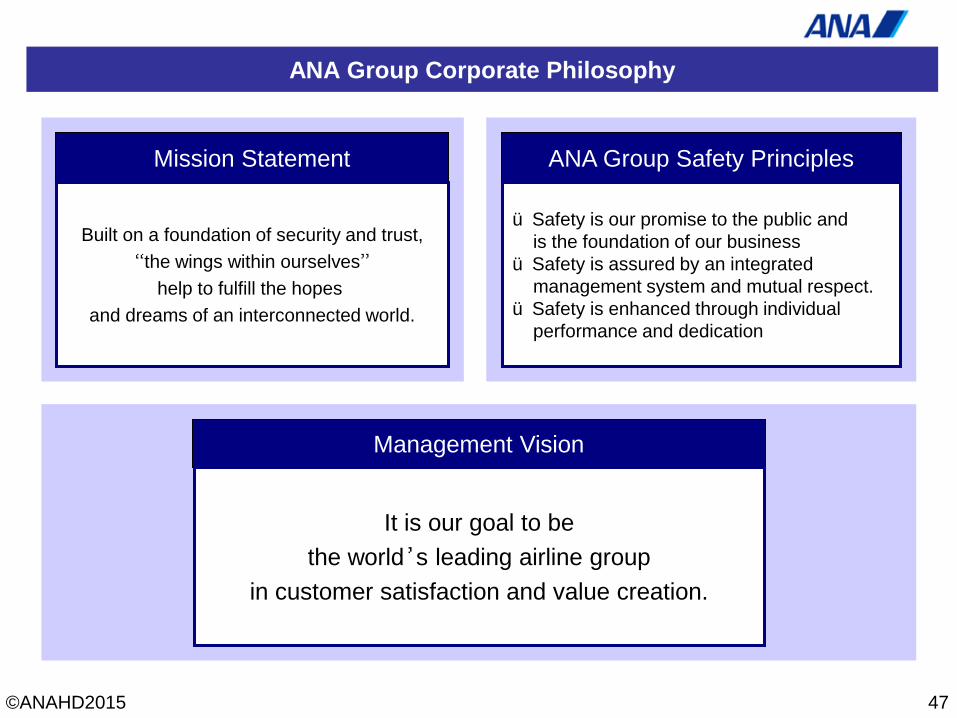
ANA Group Corporate Philosophy
Mission Statement
Built on a foundation of security and trust, “the wings within ourselves”
help to fulfill the hopes and dreams of an interconnected world.
ANA Group Safety Principles
ü Safety is our promise to the public and is the foundation of our business ü Safety is assured by an integrated management system and mutual respect. ü Safety is enhanced through individual performance and dedication
Management Vision
It is our goal to be the world’s leading airline group
in customer satisfaction and value creation.
©ANAHD2015
Investor Relations, ANA HOLDINGS INC. Phone +81-(0)3-6735-1030 E-Mail: [email protected]
48
Thank you.
This material is available on our website.
http://www.anahd.co.jp/en
Investor Relations IR Library Presentations
Cautionary Statement Forward-Looking Statements. This material contains forward-looking statements based on ANA HOLDINGS INC.’s current plans, estimates, strategies, assumptions and beliefs. These statements represent the judgments and hypotheses of the Company’s management based on currently available information. Air transportation, the Company’s core business, involves government-mandated costs that are beyond the Company’s control, such as airport utilization fees and Fuel taxes. In additions, conditions in the markets served by the Company are subject to significant fluctuations. It is possible that these conditions will change dramatically due to a number of factors, such as trends in the economic environment, aviation fuel tax, technologies, demand, competition, foreign exchange rate fluctuations, and others. Due to these risks and uncertainties, it is possible that the Company’s future performance will differ significantly from the contents of this material. Accordingly, there is no assurance that the forward-looking statements in this material will prove to be accurate.