An updated Review of Tuna Growth performance in Ranching ...
18
An updated Review of Tuna Growth performance in Ranching and Farming Operations Brian Jeffriess ASBTIA CCSBT-EC/1610/BGD 02 (Previously CCSBT-ESC/1609/14)
Transcript of An updated Review of Tuna Growth performance in Ranching ...
An updated Review of Tuna Growth
performance in Ranching and Farming
Operations
Brian Jeffriess
ASBTIA
CCSBT-EC/1610/BGD 02 (Previously CCSBT-ESC/1609/14)

2
This work is copyright. Apart from any use as permitted
under the Copyright Act 1968, no part may be reproduced
by any process without prior written permission from the
Australian Southern Bluefin Tuna Industry Association.
Requests and inquiries concerning reproduction and rights
should be addressed to the
Australian Southern Bluefin Tuna Industry Association,
PO Box 1146
PORT LINCOLN
South Australia 5606

3
Executive Summary
Background Since 2008, Japan has annually submitted a number of papers (except 2013) to the Commission for the Conservation of Southern Bluefin
Tuna (CCSBT) Extended Scientific Committee (ESC) concluding
there is unaccounted catch mortality in the Australian southern bluefin
tuna (SBT) ranching process (i.e. the Australian surface fishery).
While Japan appears to be accepting that Australia is declaring the
correct number of SBT caught, their main point appears to be that the
method of the government taking the actual weight and length (of
~3,000 fish @ 100 fish ≥ 10kg sample/tow) is potentially under-stating
the weight into the pontoons.
Japan’s assessment is that “It seems highly unlikely that farmed SBT
can obtain such high growth rates.” Japan’s reasoning is that there
can’t be such a significant difference in growth rates between wild and
farmed SBT.
The issue has been discussed in detail during official visits by the
Japanese Government, industry and scientists (invited) and by the
CCSBT Quality Assurance Review (QAR) consultants in 2014 to
report on the weight sampling process and all other parts of the supply
chain.
Issues
Until our paper to the ESC in 2014, Japan’s hypotheses have never been
tested against the very large public data base on tuna ranching and
farming. As one base literature source on the issue notes – “Models for
wild SBT are unlikely to be applicable to farmed fish.” (Gunn et al.
2002).
Growth rates are much faster in intensive farms than in the wild. This
is not surprising – because accelerating the growth is one of the main
purposes of aquaculture, particularly where it can take advantage of
high seasonal growth.
Purpose This Paper updates the Australian Papers submitted to the 2014 and
2015 ESC meetings. The aim of these reviews are to:
(1) Outline some of the large literature base on growth in tuna
farming and ranching, including the relevance of wild growth
models to intensive, and often seasonal livestock production.
(2) Test the plausibility of Japan’s conclusions against Feed
Conversion Ratio (FCR) and other farming benchmarks.
(3) Note other issues with Japan’s methodology (e.g. using wild
tagged fish data).
(4) Respond to comments made at the last 2015 ESC meeting.
4
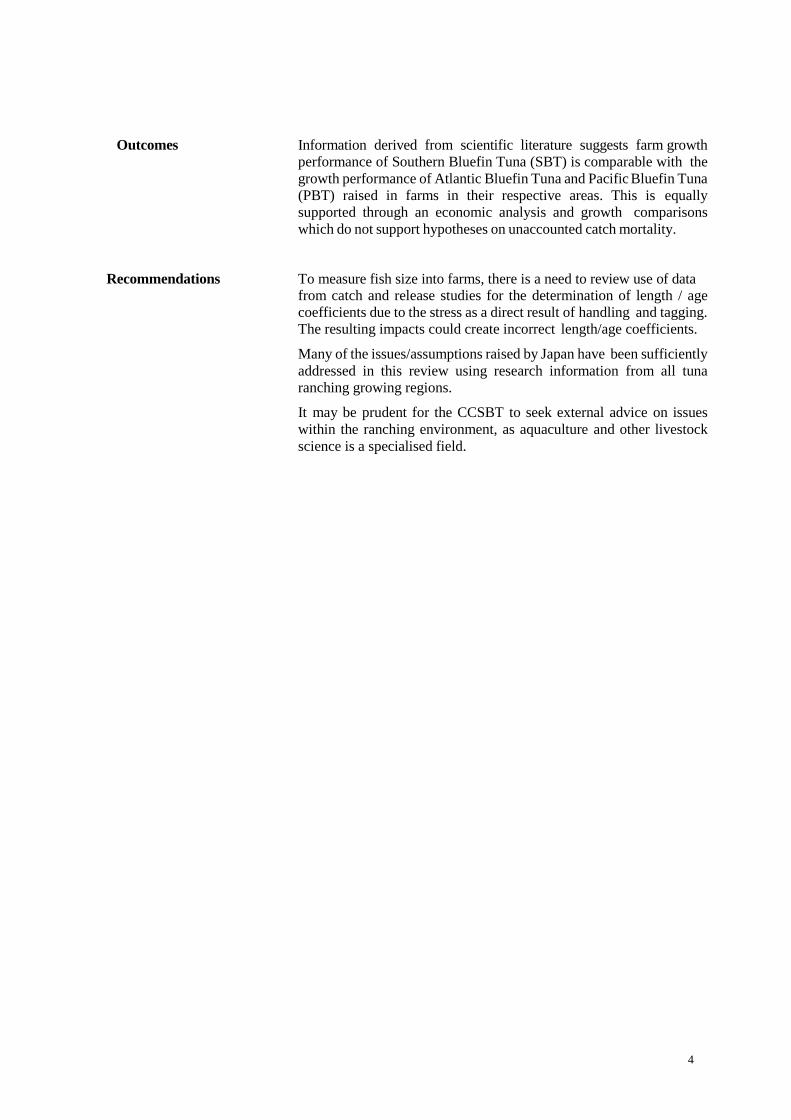
Outcomes Information derived from scientific literature suggests farm growth
performance of Southern Bluefin Tuna (SBT) is comparable with the
growth performance of Atlantic Bluefin Tuna and Pacific Bluefin Tuna
(PBT) raised in farms in their respective areas. This is equally
supported through an economic analysis and growth comparisons
which do not support hypotheses on unaccounted catch mortality.
Recommendations To measure fish size into farms, there is a need to review use of data from catch and release studies for the determination of length / age
coefficients due to the stress as a direct result of handling and tagging.
The resulting impacts could create incorrect length/age coefficients.
Many of the issues/assumptions raised by Japan have been sufficiently
addressed in this review using research information from all tuna
ranching growing regions.
It may be prudent for the CCSBT to seek external advice on issues
within the ranching environment, as aquaculture and other livestock
science is a specialised field.

5
Contents
A REVIEW OF TUNA GROWTH PERFORMANCE IN RANCHING AND FARMING
OPERATIONS ........................................................................................................................................... 1
EXECUTIVE SUMMARY ................................................................................................................... 3
BACKGROUND ................................................................................................................................... 6
GROWTH PERFORMANCE IN TUNA RANCHING AND FARMING ...................................... 7 MEDITERRANEAN ATLANTIC BLUEFIN TUNA (ABT) ............................................................................... 7
JAPAN PACIFIC BLUEFIN TUNA (PBT) .................................................................................................. 8
MEXICAN PACIFIC BLUEFIN TUNA (MPBT)AND OTHER TUNA ............................................................... 9 AUSTRALIAN SOUTHERN BLUEFIN TUNA (SBT) ..................................................................................... 9
GROWTH PERFORMANCE IN WILD TUNA.............................................................................. 10
APPLYING WILD TUNA STOCK MODELS DERIVED FROM CATCH AND RELEASE
CONVENTIONAL TAGS ................................................................................................................ 10
ASSUMPTIONS TO INFORM ANALYSIS OF UNACCOUNTED CATCH MORTALITY OF
AUSTRALIAN RANCHED SOUTHERN BLEUFIN TUNA .......................................................... 11 BACKGROUND TO THE RAW DATA USED IN THEIR CALCULATIONS ........................................................ 11
APPLICATION OF 141 TAGGED WILD FISH CAUGHT AND TRANSFERRED INTO FARMS ............................ 12
IMPACT OF ENVIRONMENTAL CONDITIONS ON GROWTH PERFORMANCE .............................................. 13
BIAS IN AVERAGE WEIGHT SAMPLE TO DETERMINE VOLUME OF CATCH ................................................ 14 THE ECONOMIC AND FEED CONVERSION RATIO (FCR) IMPLICATIONS BENCHMARKED
INTERNATIONALLY ............................................................................................................................ 14
POINTS RAISED BY JAPAN AT THE 2015 ESC ......................................................................16
DISCUSSION POINTS FOR PARTICIPANTS OF THE CCSBT EXTENDED SCIENTIFIC
COMMITTEE ................................................................................................................................... 16
REFERENCES .................................................................................................................................... 17
6
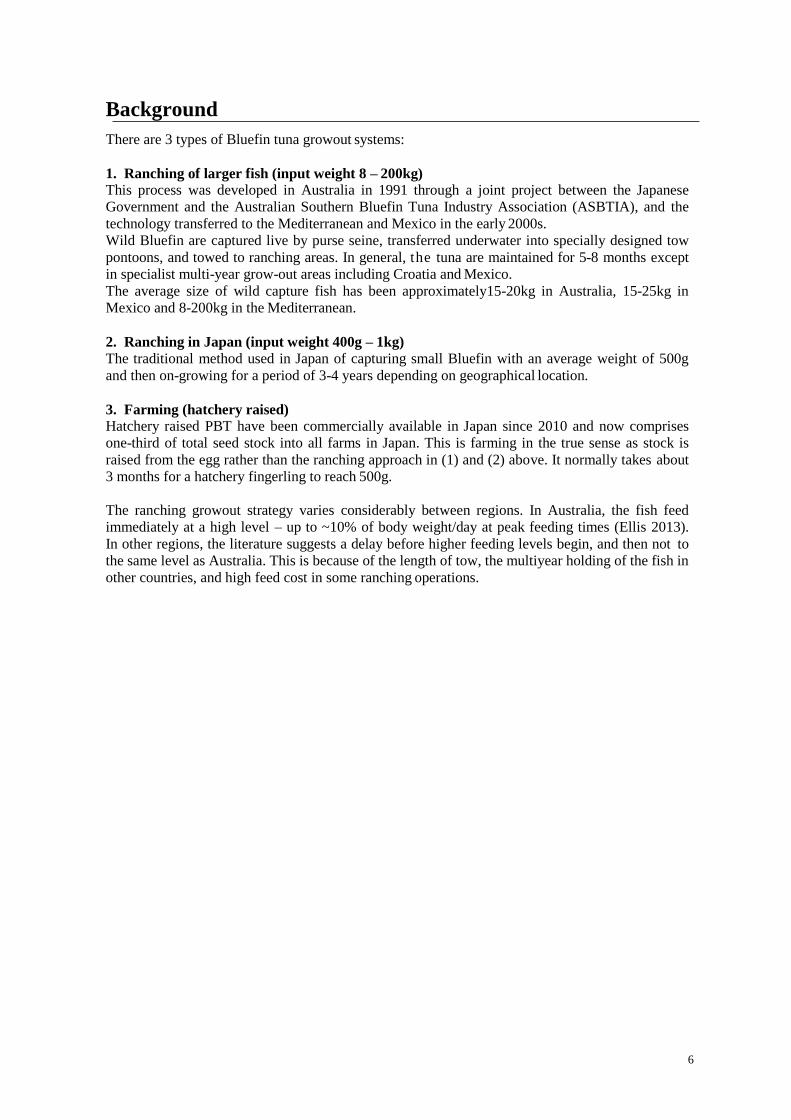
Background
There are 3 types of Bluefin tuna growout systems:
1. Ranching of larger fish (input weight 8 – 200kg) This process was developed in Australia in 1991 through a joint project between the Japanese
Government and the Australian Southern Bluefin Tuna Industry Association (ASBTIA), and the
technology transferred to the Mediterranean and Mexico in the early 2000s.
Wild Bluefin are captured live by purse seine, transferred underwater into specially designed tow
pontoons, and towed to ranching areas. In general, the tuna are maintained for 5-8 months except
in specialist multi-year grow-out areas including Croatia and Mexico.
The average size of wild capture fish has been approximately15-20kg in Australia, 15-25kg in
Mexico and 8-200kg in the Mediterranean.
2. Ranching in Japan (input weight 400g – 1kg) The traditional method used in Japan of capturing small Bluefin with an average weight of 500g
and then on-growing for a period of 3-4 years depending on geographical location.
3. Farming (hatchery raised) Hatchery raised PBT have been commercially available in Japan since 2010 and now comprises
one-third of total seed stock into all farms in Japan. This is farming in the true sense as stock is
raised from the egg rather than the ranching approach in (1) and (2) above. It normally takes about
3 months for a hatchery fingerling to reach 500g.
The ranching growout strategy varies considerably between regions. In Australia, the fish feed
immediately at a high level – up to ~10% of body weight/day at peak feeding times (Ellis 2013).
In other regions, the literature suggests a delay before higher feeding levels begin, and then not to
the same level as Australia. This is because of the length of tow, the multiyear holding of the fish in
other countries, and high feed cost in some ranching operations.
An updated Review of Tuna Growth performance in Ranching and Farming Operations
7
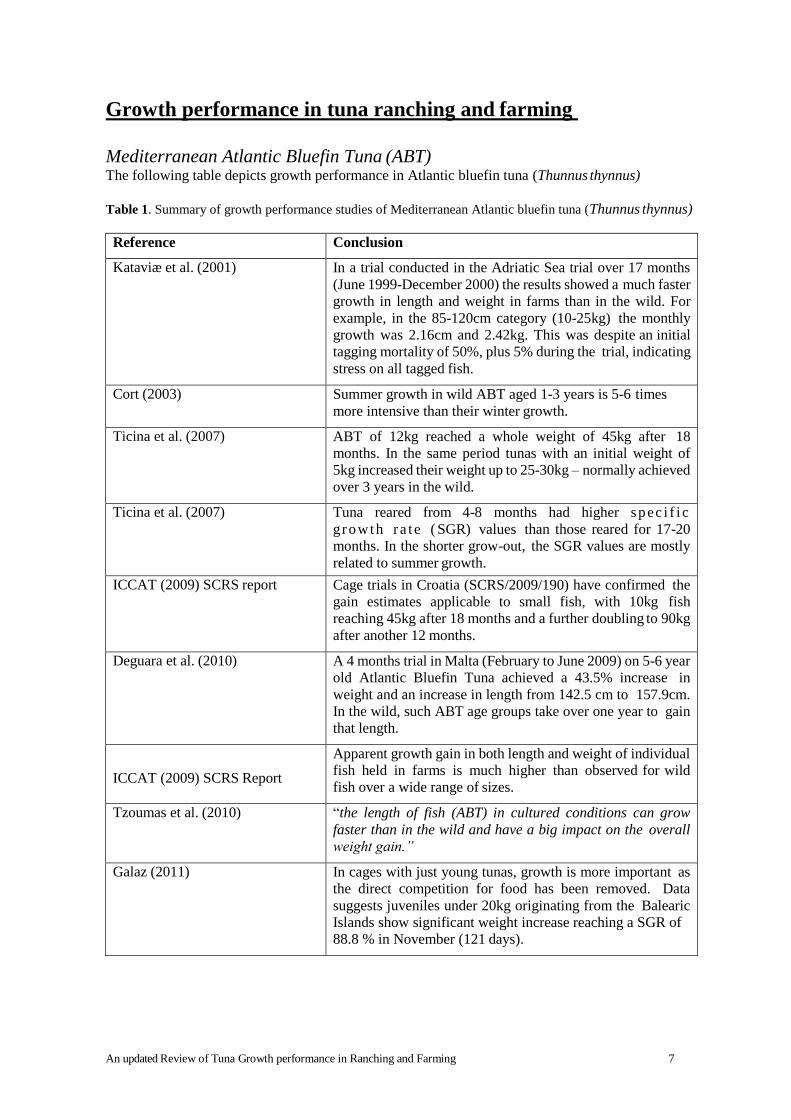
Growth performance in tuna ranching and farming
Mediterranean Atlantic Bluefin Tuna (ABT) The following table depicts growth performance in Atlantic bluefin tuna (Thunnus thynnus)
Table 1. Summary of growth performance studies of Mediterranean Atlantic bluefin tuna (Thunnus thynnus)
Reference Conclusion
Kataviæ et al. (2001) In a trial conducted in the Adriatic Sea trial over 17 months
(June 1999-December 2000) the results showed a much faster
growth in length and weight in farms than in the wild. For
example, in the 85-120cm category (10-25kg) the monthly
growth was 2.16cm and 2.42kg. This was despite an initial
tagging mortality of 50%, plus 5% during the trial, indicating
stress on all tagged fish.
Cort (2003) Summer growth in wild ABT aged 1-3 years is 5-6 times
more intensive than their winter growth.
Ticina et al. (2007) ABT of 12kg reached a whole weight of 45kg after 18
months. In the same period tunas with an initial weight of
5kg increased their weight up to 25-30kg – normally achieved
over 3 years in the wild.
Ticina et al. (2007) Tuna reared from 4-8 months had higher spec i f i c
growth r a t e ( SGR) values than those reared for 17-20
months. In the shorter grow-out, the SGR values are mostly
related to summer growth.
ICCAT (2009) SCRS report Cage trials in Croatia (SCRS/2009/190) have confirmed the
gain estimates applicable to small fish, with 10kg fish
reaching 45kg after 18 months and a further doubling to 90kg
after another 12 months.
Deguara et al. (2010) A 4 months trial in Malta (February to June 2009) on 5-6 year
old Atlantic Bluefin Tuna achieved a 43.5% increase in
weight and an increase in length from 142.5 cm to 157.9cm.
In the wild, such ABT age groups take over one year to gain
that length.
ICCAT (2009) SCRS Report
Apparent growth gain in both length and weight of individual
fish held in farms is much higher than observed for wild
fish over a wide range of sizes.
Tzoumas et al. (2010) “the length of fish (ABT) in cultured conditions can grow
faster than in the wild and have a big impact on the overall
weight gain.”
Galaz (2011) In cages with just young tunas, growth is more important as
the direct competition for food has been removed. Data
suggests juveniles under 20kg originating from the Balearic
Islands show significant weight increase reaching a SGR of
88.8 % in November (121 days).

An updated Review of Tuna Growth performance in Ranching and Farming Operations
8
Japan Pacific Bluefin Tuna (PBT)
The following table depicts growth performance in Japanese Pacific bluefin tuna (Thunnus
orientalis)
Table 2. Summary of growth performance studies of Japanese Pacific bluefin tuna (Thunnus orientalis)
Reference Conclusion
Ikeda (2003) PBT at the Wakayama (Kinki University) research station
stocked at 150-500g could achieve a weight of 50kg in 3
years.
PBT at Okinawa of same input size could achieve 100kg in 4
years. Wild PBT are 30kg at 3 years, and 40kg at 4 years.
Masuma et al. (2008) Concluded farmed PBT exceeded growth of wild PBT
Goto (2014) The most recent data we have seen is where two trials with a
trial manufactured feed and a baitfish control showed similar
length and weight growth for both feeds. The manufactured
feed results were:
Trial One Place Nagasaki Period 16/6/13 to 16/12/13
Water temp 16-29OC
Feeding Once/day for 6 days/week
Feed rate 1.5-2.0%BW/day
FCR 3.8
Weight growth Start 16kg – end 33.5kg
Length growth Start 89cm – end 113cm
Trial Two Place Kagoshima Period 7/11/13 to 26/5/14
Water temp 19-24OC
Feeding Once/day for 6 days/week
Feed rate 1.5-2.5%BW/day
FCR 3.7
Weight growth Start 9kg – end 18.5kg Length growth Start 77cm – end 98.5cm

An updated Review of Tuna Growth performance in Ranching and Farming Operations
9
Mexican Pacific Bluefin Tuna (MPBT)and other tuna
The following table depicts growth performance in Mexican bluefin tuna (Thunnus orientalis)
Table 3. Summary of growth performance studies of Mexican Pacific bluefin tuna (Thunnus orientalis)
Reference Conclusion
Sylvia et al. (2002) Growth performance of tunas over a 2.5 months period
in water temperature 18-220C
Species Start wt (kg) Final wt
(kg)
PBT 45 70
Bigeye (Thunnus obesus) 25-30 45
Yellowfin (Thunnus albacares) 20-25 35
Australian Southern Bluefin Tuna (SBT)
The following table depicts growth performance in southern bluefin tuna Thunnus maccoyii
Table 4. Summary of growth performance studies of Australian Southern bluefin tuna, Thunnus maccoyii
Reference Conclusion
Gordon et al. (2006) Examples from confidential feed research in 2002
showed the following growth performance
Days in Start Finish
culture wt (kg) length (cm) wt (kg) length (cm)
173 16 95 30.13 108
170 14.5 97 28.7 109
174 26 112 45.3 120
The growth achieved was despite high mortality levels as a
result of tagging and an 18-day weaning period for
manufactured feeds.
Ellis (2013) Specific Growth Rates in feed trials in 2005 were around
60% better than Atlantic Bluefin of the same size and age,
and held for a similar period, as reported in Ticina et al.
(2007). This is despite noting a period of suppressed feeding
in the SBT trials – apparently due to blood fluke infections
(Cardicola forsteri).
Australia had an intensive research program on development of alternative feeds (to wet feeds) in
the 1990’s and first half of the 2000’s when the focus shifted to fish health. As a result there was
no specific research on growth rates – but data on wet feed controls and on manufactured trials are
available.
An updated Review of Tuna Growth performance in Ranching and Farming Operations
10
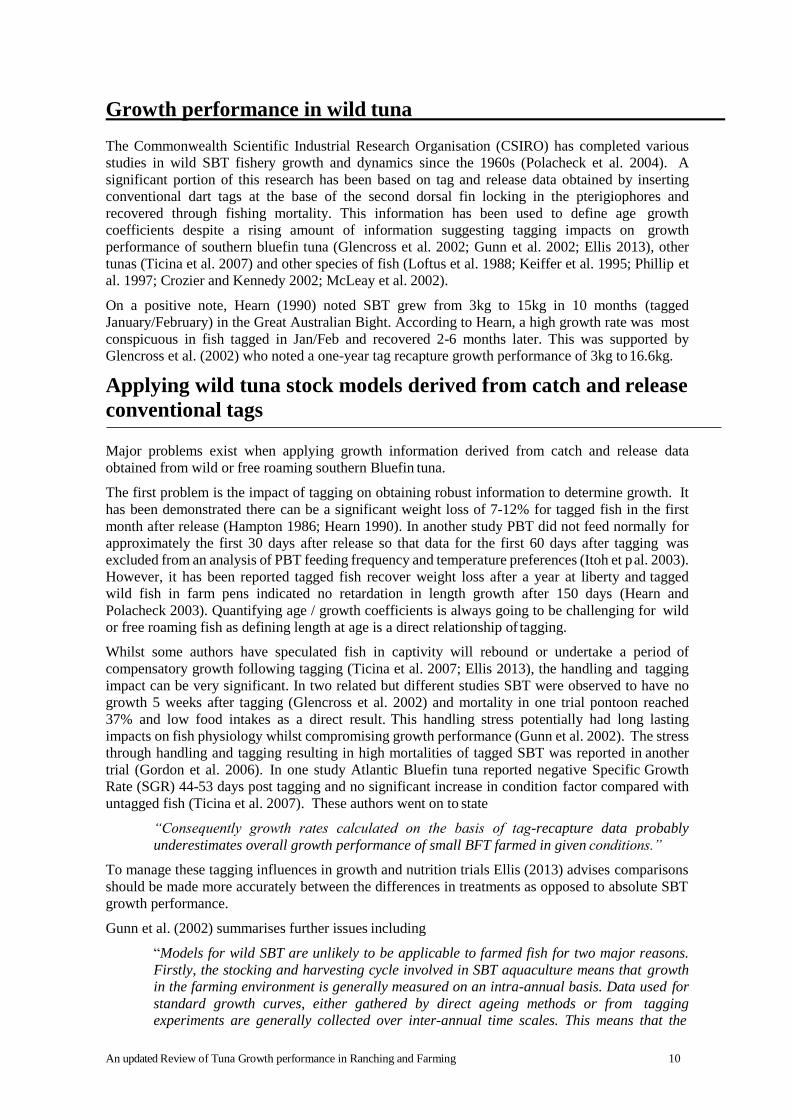
Growth performance in wild tuna
The Commonwealth Scientific Industrial Research Organisation (CSIRO) has completed various
studies in wild SBT fishery growth and dynamics since the 1960s (Polacheck et al. 2004). A
significant portion of this research has been based on tag and release data obtained by inserting
conventional dart tags at the base of the second dorsal fin locking in the pterigiophores and
recovered through fishing mortality. This information has been used to define age growth
coefficients despite a rising amount of information suggesting tagging impacts on growth
performance of southern bluefin tuna (Glencross et al. 2002; Gunn et al. 2002; Ellis 2013), other
tunas (Ticina et al. 2007) and other species of fish (Loftus et al. 1988; Keiffer et al. 1995; Phillip et
al. 1997; Crozier and Kennedy 2002; McLeay et al. 2002).
On a positive note, Hearn (1990) noted SBT grew from 3kg to 15kg in 10 months (tagged
January/February) in the Great Australian Bight. According to Hearn, a high growth rate was most
conspicuous in fish tagged in Jan/Feb and recovered 2-6 months later. This was supported by
Glencross et al. (2002) who noted a one-year tag recapture growth performance of 3kg to 16.6kg.
Applying wild tuna stock models derived from catch and release
conventional tags
Major problems exist when applying growth information derived from catch and release data
obtained from wild or free roaming southern Bluefin tuna.
The first problem is the impact of tagging on obtaining robust information to determine growth. It
has been demonstrated there can be a significant weight loss of 7-12% for tagged fish in the first
month after release (Hampton 1986; Hearn 1990). In another study PBT did not feed normally for
approximately the first 30 days after release so that data for the first 60 days after tagging was
excluded from an analysis of PBT feeding frequency and temperature preferences (Itoh et pal. 2003).
However, it has been reported tagged fish recover weight loss after a year at liberty and tagged
wild fish in farm pens indicated no retardation in length growth after 150 days (Hearn and
Polacheck 2003). Quantifying age / growth coefficients is always going to be challenging for wild
or free roaming fish as defining length at age is a direct relationship of tagging.
Whilst some authors have speculated fish in captivity will rebound or undertake a period of
compensatory growth following tagging (Ticina et al. 2007; Ellis 2013), the handling and tagging
impact can be very significant. In two related but different studies SBT were observed to have no
growth 5 weeks after tagging (Glencross et al. 2002) and mortality in one trial pontoon reached
37% and low food intakes as a direct result. This handling stress potentially had long lasting
impacts on fish physiology whilst compromising growth performance (Gunn et al. 2002). The stress
through handling and tagging resulting in high mortalities of tagged SBT was reported in another
trial (Gordon et al. 2006). In one study Atlantic Bluefin tuna reported negative Specific Growth
Rate (SGR) 44-53 days post tagging and no significant increase in condition factor compared with
untagged fish (Ticina et al. 2007). These authors went on to state
“Consequently growth rates calculated on the basis of tag-recapture data probably
underestimates overall growth performance of small BFT farmed in given conditions.”
To manage these tagging influences in growth and nutrition trials Ellis (2013) advises comparisons
should be made more accurately between the differences in treatments as opposed to absolute SBT
growth performance.
Gunn et al. (2002) summarises further issues including
“Models for wild SBT are unlikely to be applicable to farmed fish for two major reasons.
Firstly, the stocking and harvesting cycle involved in SBT aquaculture means that growth
in the farming environment is generally measured on an intra-annual basis. Data used for
standard growth curves, either gathered by direct ageing methods or from tagging
experiments are generally collected over inter-annual time scales. This means that the
An updated Review of Tuna Growth performance in Ranching and Farming Operations
11
magnitude of error acceptable from growth models based on inter-annual data may be too
great for useful predictions of short-term growth. Secondly, the growth of wild fish is
probably related to intra-annual variation in food availability, and migration costs
dependent on different environmental conditions. Farm conditions are very different to
those in the wild and may alter growth rates considerably via different consumption rates,
possibly restricted activity levels and altered thermal conditions.”
Gunn et al. (2002) found that that the von Bertalanffy model did not perform well with the
variance in the data being too great to obtain plausible parameter estimates. The relatively short
time span of farm growth data restricts the usefulness of the von Bertalanffy in this situation as the
variance in the data is too large relative to the growth being modelled. Furthermore, “the parameter
estimates of the von Bertalanffy growth function (VBGF) (used) were not plausible and the model
predicted growth badly.”
The bioenergetics models indicate the large degree to which tunas utilise energy for movement
rather than growth, and why Food Conversion Ratios (FCR) are relatively high in tuna ranching
compared with other fish. Gunn et al. (2002) notes:
“Tunas have generally been found to turn over energy at a high rate through continuous
swimming for ram ventilation and through the need to cover large distances in order to
find food in an uncertain and patchy pelagic environment.”
“it is possible that taking away the need for active foraging and the restriction of the cage
significantly alters the activity pattern from those (compared with) those in the wild. This
will undoubtedly alter the energy budget and growth of the fish.”
A bioenergetic model approach is now widely used in Australian tuna ranching operations to
optimise growth and performance (Gunn et al. 2002; Ellis 2013).
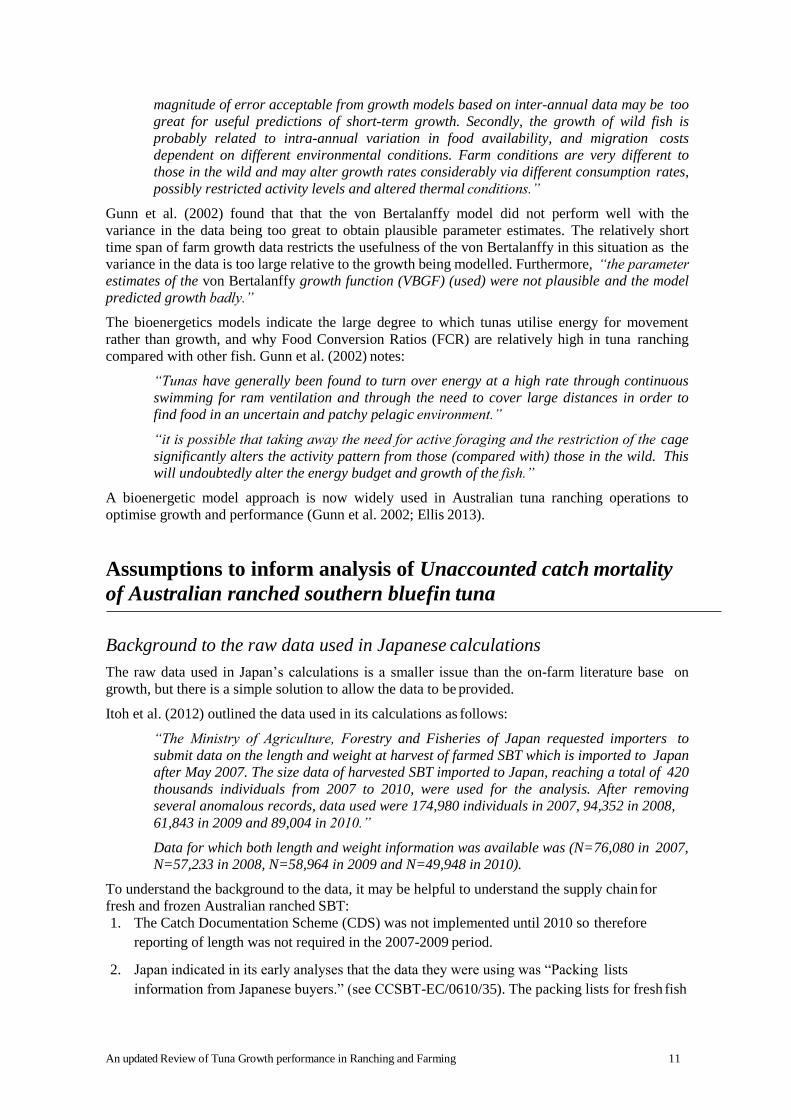
Assumptions to inform analysis of Unaccounted catch mortality
of Australian ranched southern bluefin tuna
Background to the raw data used in Japanese calculations
The raw data used in Japan’s calculations is a smaller issue than the on-farm literature base on
growth, but there is a simple solution to allow the data to be provided.
Itoh et al. (2012) outlined the data used in its calculations as follows:
“The Ministry of Agriculture, Forestry and Fisheries of Japan requested importers to
submit data on the length and weight at harvest of farmed SBT which is imported to Japan
after May 2007. The size data of harvested SBT imported to Japan, reaching a total of 420
thousands individuals from 2007 to 2010, were used for the analysis. After removing
several anomalous records, data used were 174,980 individuals in 2007, 94,352 in 2008,
61,843 in 2009 and 89,004 in 2010.”
Data for which both length and weight information was available was (N=76,080 in 2007,
N=57,233 in 2008, N=58,964 in 2009 and N=49,948 in 2010).
To understand the background to the data, it may be helpful to understand the supply chain for
fresh and frozen Australian ranched SBT:
1. The Catch Documentation Scheme (CDS) was not implemented until 2010 so therefore
reporting of length was not required in the 2007-2009 period.
2. Japan indicated in its early analyses that the data they were using was “Packing lists
information from Japanese buyers.” (see CCSBT-EC/0610/35). The packing lists for fresh fish
An updated Review of Tuna Growth performance in Ranching and Farming Operations
12
normally show only a total weight shipment. For frozen fish, a packing list consists of number
of fish in weight categories.
3. For fresh shipments, the fish are actually owned by the Australian exporter so that any
documentation was owned by the Australian company. What is referred to in documents such
as CCSBT-EC/0610/35 as “Japanese buyers” are actually agents of the Australian company,
not a buyer. These agents simply take a commission (normally 3.5%) on the sale.
4. Fresh SBT shipments are not randomly selected and are specifically chosen for the Japanese
market and larger and higher conditioned fish are selected.
5. In discussions with fresh product agents, all have rejected that any documents they may have
held have been supplied to anyone else. In addition length/weight data could not come from
auctioneers who have no reason to know the length of individual fish or record this information.
6. The number of samples used by Japan in 2007 and 2008 is more than the number of fresh
ranched SBT shipped to Japan in those years.
7. For frozen SBT, there are two channels:
a. Japanese freezer/reefer vessels handle the large majority of frozen fish. The
fish are slung onto these boats in groups of 5-15 fish.
b. Some SBT are shipped via freezer container, particularly to smaller buyers
who do not have the volume for a freezer boat.
8. The freezer boat process is that the SBT are harvested at the pontoons, gilled and gutted, and
then taken to the freezer boat, then slung as above. Because the fish are then graded depending
on size, quality and condition, a representative of the Australian company is always on the
freezer boat. After finishing the final processing on the freezer boat, the SBT are then frozen.
9. To our knowledge, until 2014, there has never been any indication that fish were measured
and they were seldom individually weighed by the frozen buyer.
Japan’s reason for not supplying the raw data is that they may be breaching confidence with those
agents in Japan, which handle Australia’s fresh SBT. However, because these Japanese companies
are only agents, the data actually belongs to the Australian tuna ranching company.
Therefore, as the owners of the data, the Australian industry is pleased to provide the permission to
Japan to provide it back to us for cross-checking. This is separate from Japan’s methodology – but it
will at least provide some cross-checking of the accuracy of the data base.
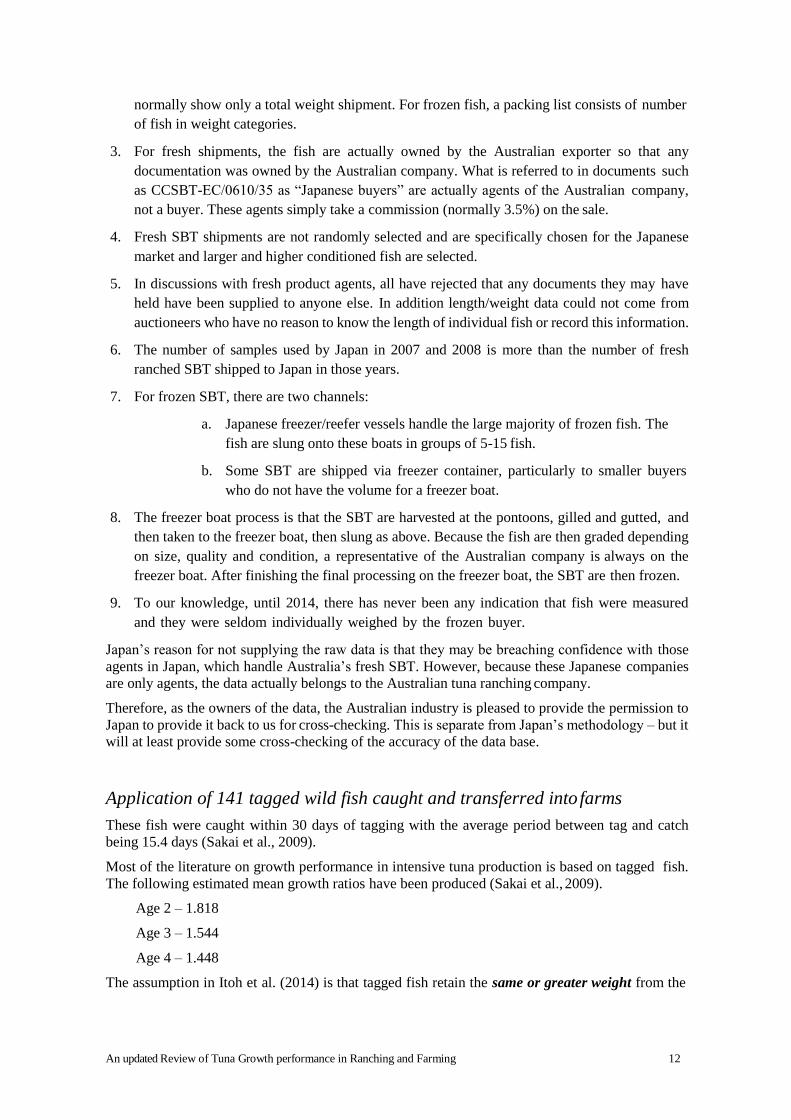
Application of 141 tagged wild fish caught and transferred into farms
These fish were caught within 30 days of tagging with the average period between tag and catch
being 15.4 days (Sakai et al., 2009).
Most of the literature on growth performance in intensive tuna production is based on tagged fish.
The following estimated mean growth ratios have been produced (Sakai et al., 2009).
Age 2 – 1.818
Age 3 – 1.544
Age 4 – 1.448
The assumption in Itoh et al. (2014) is that tagged fish retain the same or greater weight from the

An updated Review of Tuna Growth performance in Ranching and Farming Operations
13
point of tagging in the wild to entry into the farms.
This appears to be the opposite and in contrast to information presented in this review in respect to
growth achieved by bluefin tunas worldwide and the impact of tagging and handling in controlled
research experiments focused on growth.
Impact of environmental conditions on growth performance
Itoh et al. (2014) note the following von Bertalanffy growth coefficient K (VBKs) for various wild
tuna species
SBT (ages 2-6) 0.219
Pacific BT 0.173
Atlantic BT 0.089
Bigeye 0.180
Yellowfin 0.557
Albacore 0.134
As reported in the Mediterranean, Mexican and Japan growth performance sections of this paper,
growth in farms is dimensionally greater than these wild VBK’s. Part of the reason is that the above
VBK’s are not seasonally based (Gunn et al. 2002), and cover a range of age groups with different
growth patterns.
Itoh et al. (2014) note that different captive Pacific Bluefin growth rates in different farms in Japan could be related to higher water temperatures and compare the temperatures in Japan with the lower ones in Port Lincoln. However, this is in contrast to very high growth rates achieved in both
weight and length in water temperatures averaging 16.90C (Deguara et al. 2010).
The bioenergetics model of Gunn et al. (2002) found that food consumption is the key indicator of
growth – a linear relationship between consumption and growth and predicted higher temperatures
should result in more efficient assimilation rates. However, thermoregulation may “buffer” SBT
metabolism to temperature effects to a degree that is not found in other ectothermic fish. They
found temperature much less important in the case of SBT and that it is relatively unimportant in
determining growth.
These researchers concluded that it is plausible there is an optimum temperature range for growth
performance in SBT, with a peak occurring around 180C. This may be related to activity levels
due to water temperature or changes in metabolic demands due to water temperature. This is consistent with the findings of Ellis (2013) that SBT feel greater heat stress at water temperatures
above 200C. This is perhaps also consistent with Itoh et al. (2003) who found PBT preferred a
temperature range of 14-200 C.
In Japan, Masuma et al. (2008) found water temperature important in growth performance
PBT at age zero reach the following weights after 3 years in culture
30-50kg in Shizuoka (north of Kinki)
50kg in central Japan (Kusimoto)
60kg at Kagoshima (south of Kinki)
75kg at Amami further south, and
100kg at Yaeyama (the southernmost island of Japan) after 4 years.
Possible reasons for the difference in growth could be related to
Feed delivery and frequency
Nutritional content of feed
An updated Review of Tuna Growth performance in Ranching and Farming Operations
14
Development of the thermoregulatory capacity of small juvenile tuna. It is likely the
southern warmer waters allow tuna to develop this capacity quicker thereby facilitating
increased growth in the early stages
It is likely small juvenile PBT do not have cold adapted enzymes to assist with digestion
thereby holding back their digestive capability in cooler waters
Site-specific conditions relating to blood fluke infections of Cardicola orientalis and C.
opisthorchis. These trematode parasites cause significant impacts to the cardiovascular
system and result in depressed feeding, stress and mortality. For example, the SBT ranching
mortalities were 10.5% and 13.5% in 2009 and 2010 respectively, before falling to ~ 1% in
2015 when a solution was found.
SBT have very short towing periods allowing ranching companies to increase growth
rapidly through optimised feeding strategies using Formu-bait © (van Barneveld and Ellis,
2007)
From a health point of view SBT are very robust having survived high mortality in the wild (Nowak
et al. 2003).
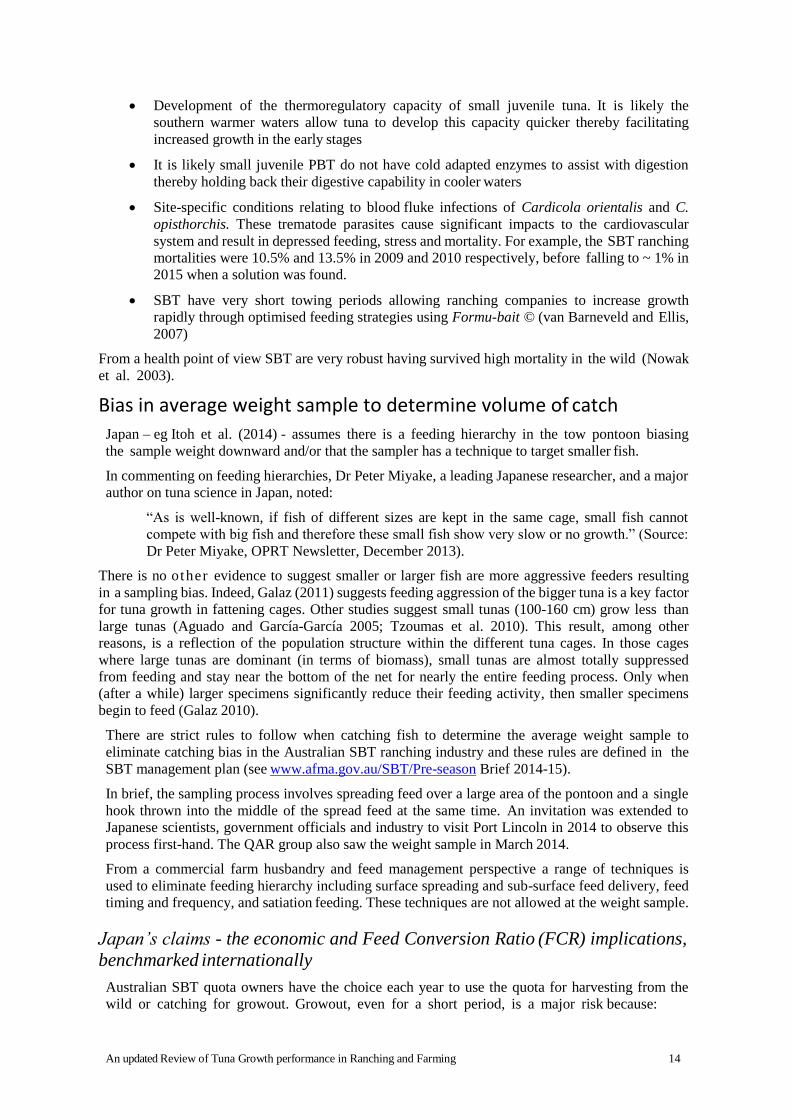
Bias in average weight sample to determine volume of catch
Japan – eg Itoh et al. (2014) - assumes there is a feeding hierarchy in the tow pontoon biasing
the sample weight downward and/or that the sampler has a technique to target smaller fish.
In commenting on feeding hierarchies, Dr Peter Miyake, a leading Japanese researcher, and a major
author on tuna science in Japan, noted:
“As is well-known, if fish of different sizes are kept in the same cage, small fish cannot
compete with big fish and therefore these small fish show very slow or no growth.” (Source:
Dr Peter Miyake, OPRT Newsletter, December 2013).
There is no other evidence to suggest smaller or larger fish are more aggressive feeders resulting
in a sampling bias. Indeed, Galaz (2011) suggests feeding aggression of the bigger tuna is a key factor
for tuna growth in fattening cages. Other studies suggest small tunas (100-160 cm) grow less than
large tunas (Aguado and García-García 2005; Tzoumas et al. 2010). This result, among other
reasons, is a reflection of the population structure within the different tuna cages. In those cages
where large tunas are dominant (in terms of biomass), small tunas are almost totally suppressed
from feeding and stay near the bottom of the net for nearly the entire feeding process. Only when
(after a while) larger specimens significantly reduce their feeding activity, then smaller specimens
begin to feed (Galaz 2010).
There are strict rules to follow when catching fish to determine the average weight sample to
eliminate catching bias in the Australian SBT ranching industry and these rules are defined in the
SBT management plan (see www.afma.gov.au/SBT/Pre-season Brief 2014-15).
In brief, the sampling process involves spreading feed over a large area of the pontoon and a single
hook thrown into the middle of the spread feed at the same time. An invitation was extended to
Japanese scientists, government officials and industry to visit Port Lincoln in 2014 to observe this
process first-hand. The QAR group also saw the weight sample in March 2014.
From a commercial farm husbandry and feed management perspective a range of techniques is
used to eliminate feeding hierarchy including surface spreading and sub-surface feed delivery, feed
timing and frequency, and satiation feeding. These techniques are not allowed at the weight sample.
Japan’s claims - the economic and Feed Conversion Ratio (FCR) implications,
benchmarked internationally
Australian SBT quota owners have the choice each year to use the quota for harvesting from the
wild or catching for growout. Growout, even for a short period, is a major risk because:
An updated Review of Tuna Growth performance in Ranching and Farming Operations
15
(1) There is no forward market for SBT. Therefore when the SBT are caught for ranching, the
operator takes the risk of not knowing the Yen price and exchange rate until the harvest up to
7-8 months later.
(2) The risk of substantial mortalities
(3) The capital assets of the quota owner can be used for either ranching or catching directly for
the market.
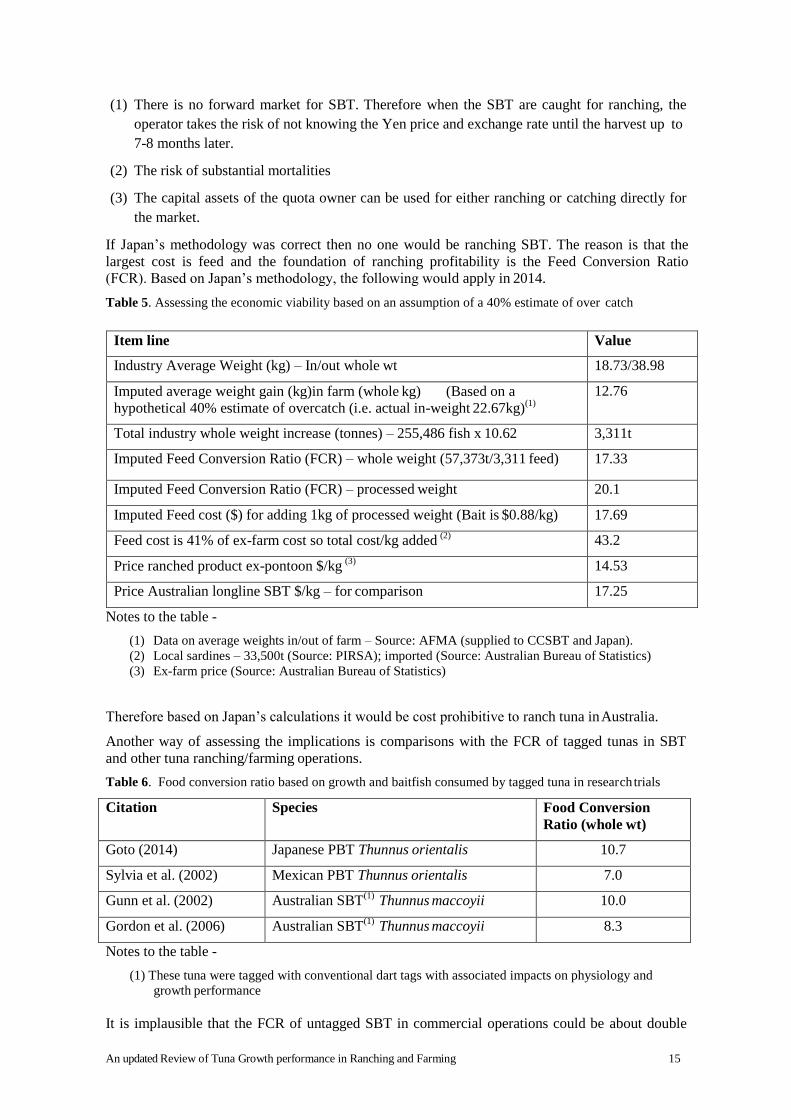
If Japan’s methodology was correct then no one would be ranching SBT. The reason is that the
largest cost is feed and the foundation of ranching profitability is the Feed Conversion Ratio
(FCR). Based on Japan’s methodology, the following would apply in 2014.
Table 5. Assessing the economic viability based on an assumption of a 40% estimate of over catch
Item line Value
Industry Average Weight (kg) – In/out whole wt 18.73/38.98
Imputed average weight gain (kg)in farm (whole kg) (Based on a
hypothetical 40% estimate of overcatch (i.e. actual in-weight 22.67kg)(1)
12.76
Total industry whole weight increase (tonnes) – 255,486 fish x 10.62 3,311t
Imputed Feed Conversion Ratio (FCR) – whole weight (57,373t/3,311 feed) 17.33
Imputed Feed Conversion Ratio (FCR) – processed weight 20.1
Imputed Feed cost ($) for adding 1kg of processed weight (Bait is $0.88/kg) 17.69
Feed cost is 41% of ex-farm cost so total cost/kg added (2)
43.2
Price ranched product ex-pontoon $/kg (3)
14.53
Price Australian longline SBT $/kg – for comparison 17.25
Notes to the table -
(1) Data on average weights in/out of farm – Source: AFMA (supplied to CCSBT and Japan).
(2) Local sardines – 33,500t (Source: PIRSA); imported (Source: Australian Bureau of Statistics)
(3) Ex-farm price (Source: Australian Bureau of Statistics)
Therefore based on Japan’s calculations it would be cost prohibitive to ranch tuna in Australia.
Another way of assessing the implications is comparisons with the FCR of tagged tunas in SBT
and other tuna ranching/farming operations.
Table 6. Food conversion ratio based on growth and baitfish consumed by tagged tuna in research trials
Citation Species Food Conversion
Ratio (whole wt)
Goto (2014) Japanese PBT Thunnus orientalis 10.7
Sylvia et al. (2002) Mexican PBT Thunnus orientalis 7.0
Gunn et al. (2002) Australian SBT(1)
Thunnus maccoyii 10.0
Gordon et al. (2006) Australian SBT(1)
Thunnus maccoyii 8.3
Notes to the table -
(1) These tuna were tagged with conventional dart tags with associated impacts on physiology and
growth performance
It is implausible that the FCR of untagged SBT in commercial operations could be about double
An updated Review of Tuna Growth performance in Ranching and Farming Operations
16
that of tagged SBT required to meet the hypothesis of a 40% overcatch estimate into farms.
Note: The above analysis for 2014 Australian ranching produces a very similar answer to the analysis
for 2013 (see CCSBT-ESC/1409/11). The preliminary analysis of the 2015 data also produces a
similar outcome.
Points raised by Japan at the 2015 ESC At the 2015 ESC meeting, Japan raised only three points on Australia’s Paper:
(1) Australia to provide evidence that the l/w relationship of farmed fish is different from wild
SBT. This question appears to misunderstand Australia’s point – that intensively fed
farmed fish grow faster than wild fish. However, in many cases their l/w relationship is
different from wild fish – and the range of condition factors in wild fish is the main reason
that a large percentage of wild fish are auctioned (see JMR 2006, page 17).
(2) Australia to calculate how a FCR of 10:1 and a gain of, say 15kg whole wt could be
profitable. The calculation is 15kg x 10:1 x $A 0.88/kg feed = $A132/fish.
Japan’s question also:
a. Misunderstands that the real value is the quota itself.
b. If Japan’s hypothesis was correct – why would there still be ranching in Mexico
and the Mediterranean. Under Japan’s hypothesis all the FCR data shown in
Australia’s Paper for Mexico, Mediterranean and Japan farming must be
substantially wrong.
(3) Not in the ESC Report – but Japan also questioned whether such a high percentage of the
South Australian sardine quota could be used for tuna ranching. The reasons are that there
is only a very small market in Australia for sardines for human consumption, and because
eleven of the fourteen sardine licences are owned by tuna ranching companies.
Discussion points for participants of the CCSBT
Extended Scientific Committee
We propose participants of the CCSBT Extended Scientific Committee review this
information in response to the hypotheses of Japan of unaccounted catch mortality. The
extensive literature and the analysis here suggest there is no foundation to Japan’s
hypotheses. Specifically, the CCSBT ESC is encouraged to address the following points.
There is a need to review data from catch and release studies in the wild fishery for the
determination of length/age coefficients due to stressors as a direct result of handling
and tagging. It is plausible that compromised SBT will falsely lower length/age
relationships of free ranging SBT for a lengthy period.
Many of the issues/assumptions raised by Japan have been sufficiently addressed using
research information from all tuna ranching growing regions in this review.
It may be prudent for the CCSBT to seek external advice on issues within the
ranching environment, as aquaculture science is a very specialist field.
An updated Review of Tuna Growth performance in Ranching and Farming Operations
17
References
Aguado-Giminez, F. and Garcia-Garcia., B (2005). Changes in some morphometric relationships in
Atlantic bluefin tuna (Thunnus thynnus Linanaeus 1758) as a result of fattening process. Aquaculture,
Volume 249, September 2005).
Cort J. (2003). Age and growth of the bluefin tuna (Thunnus thynnus thynnus) of the Northeast Atlantic.
In: Bridges, C.R., Gordin, H., Garcia, A. (Eds.), Proceedings of the Symposium on Domestication of the
Bluefin Tuna, Thunnus thynnus thynnus, 3–8 February 2002.
Crozier, W and Kennedy, G. (2002). Impact of tagging with coded wire tags on marine survival of wild
Atlantic salmon (Salmo salar L.) migrating from the R. Bush. Northern Ireland Fisheries Research. 59
Vol 2, 209-215.
Deguara S., Saviour, S., Caruana, S. and Agius, C. (2010). Results of the first growth trial carried out in
Malta with 60kg farmed Atlantic Bluefin Tuna (Thynnus thynnus L.). SCRS/2009/134 Collect. Vol. Sci.
Pap. ICCAT, 65(3): 782-786 (2010).
Ellis, D. (2013). The measurement of visceral temperature patterns and implications for feeding practices
in ranched southern bluefin tuna Thunnus maccoyii. Submitted in fulfillment for the degree of Master of
Applied Science, June 2013, University of Tasmania.
Galaz, T. (2011). Eleven years – 1995-2005 – of experience on growth of bluefin tuna (Thunnus
thynnus) in farms. SCRS/2011/160 Collect. Vol. Sci. Pap. ICCAT, 68(1): 163-175.
Glencross, B., Clarke, S. and Buchanan, J. (2002). Temporal Growth Patterns of Farmed Juvenile
Southern Bluefin Tuna, Thunnus maccoyii (Castelnau) Fed Moist Pellets. Journal of the World
Agriculture Society. June 2002.
Gordon, R., Bayly, G. and Foster, C. (2006). Commercialisation trials for a manufactured tuna feed.
Aquafin CRC Project 1A.3 January 2006.
Goto, T. (2014). Development of artificial feed for farmed bluefin tuna, Thunnus orientalis, Nippon
Suisan Kaisha. Presentation to WAS Conference, Adelaide, June 2014.
Gunn, J., Patterson, T. and Rough, K. (2002). Experimental analyses of the effects of ration and feeding
frequency on the thermodynamics, energetics, growth and condition of farmed Southern Bluefin Tuna.
CSIRO Marine Research. FRDC Project 97/363. May 2002.
Hampton, J. (1986). Effect of tagging on the condition of southern bluefin tuna, Thunnus maccoyii
(Castlenau). Australian Journal and Freshwater Research 37 in 1986.
Hearn, W. and Polacheck, T. (2003). Estimating long-term growth rate changes of southern Bluefin tuna
(Thunnus maccoyii) from two periods of tag return data. Fishery Bulletin January 2003.
Hearn, W. (1990). Comments on Optimal Growth of Southern Bluefin Tuna (SBT). CSIRO Division of
Fisheries 6 April 1990.
ICCAT. (2009). Report for the Biennial Period 2008-2009, Part II (2009), Vol 2. SCRS
Ikeda, S. (2003). Rearing Market and domestic production of cultured tuna in Japan – cultured tuna in
the Japanese market. In: Bridges, C.R., Gordin, H., Garcia, A. (Eds.), Proceedings of the 1st
International Symposium on Domestication of the Bluefin Tuna, Thunnus thynnus thynnus, 3-8 February 2002.
Cartagena, Spain. Cah. Options Mediterr., vol. 60, pp. 83– 84.
Itoh, Y.,Tsuji, S. and Nitta, A. (2003). Migration patterns of young Pacific bluefin tuna (Thunnus
orientalis) determined with archival tags. Fishery Bulletin, July 2003.
Itoh, T., Akatsuka, Y., Kawashima, T., and Mishima, M (2012). Analyses on age composition, growth
and catch amount of southern bluefin tuna used for farming in 2007-2101. Paper CCSBT-ESC/1208/30 to
ESC 2012.
Itoh, T., Suzuki, K. and Takeda, S. (2014). Unaccounted catch mortality in Australian SBT farming
fishery between 2001 and 2013 estimated from information of TIS and CDS. Paper CCSBT-
An updated Review of Tuna Growth performance in Ranching and Farming Operations
18
OMMP/1406/09 (Rev). July 2014
Kataviæ, I., Tièina, V. and Franièeviæ, V. (2001). A preliminary study of the growth rate of Bluefin tuna
from Adriatic when reared in floating cages. SCRS/2001/092
Keiffer, J. D., Kubacki, M. R., Phelan, F. J. S., Phillip D. P. and Tufts, B. L. (1995). Effects of catch and
release angling on nesting smallmouth bass. Transactions of the American Fisheries Society. 124, 70-76.
Loftus, A.J., Taylor, W. W., and Keller, M. (1988). An evaluation of lake trout (Salvelinus namaycush)
hooking mortality in the upper great lakes. Can. J. Fish. Aquat. Sci. 45, 1473-1479.
Masuma, S., Miyashita, S., Yamamoto, H. and Kumai, H. (2008). Status of bluefin tuna farming,
broodstock management, breeding and fingerling production in Japan. Review in Fisheries Science.
16:385-390.
McLeay, L. J., Jones, G. K. and Ward, T. M. (2002). National Strategy for the Survival of Released Line-
caught Fish: A Review of Research and Fishery Information. Fisheries Research and Development
Corporation Project 2001/101. Henley Beach, South Australia. South Australian Research and
Development Institute, 121 pp.
Norita T. (2002). Feeding of bluefin tuna : Experiences in Japan and Spain. In : Bridges C.R. (ed.),
García, A. (ed.), Gordin, H. (ed.). Domestication of the bluefin tuna Thunnus thynnus thynnus.
Nowak, B., Rough, K., Ellis, D., Crane, M., Cameron, A. and Clarke, S. (2003). Aquafin CRC – Southern
Bluefin Tuna Aquaculture Subprogram: A risk assessment of factors influencing the health of southern
bluefin tuna. Fisheries Resaerch and Development Corporation and Aquafin CRC.
OPRT. (2013). Organization for the Promotion of Responsible Fishing (OPRT). Newsletter. December
2013.
Phillip, D. P., Toline, C. A., Kubacacki, M. R., Philipp, D. B. F. and Phelan, F. J. S. (1997). The impact of
catch-and-release angling on the reproductive success of smallmouth bass and largemouth bass. North
American Journal of Fisheries. 17, 557-567.
Polacheck, T. (2012). Assessment of IUU fishing for Southern Bluefin Tuna. Marine Policy, 36, 1150-
1165.Polacheck, T., Eveson, J. P. and Laslett, G. M. (2004). Increase in growth rates of southern bluefin
tuna (Thunnus maccoyii) over four decades: 1960 to 2000. Can. J. Fish. Aquat. Sci. 61, 307-322.
Sakai, O., Itoh, T. and Sakamoto, T. (2009). Estimation of growth in farmed Southern Bluefin Tuna
using the CCSBT conventional tagging data. Paper CCSBT-ESC/0909/31 to 2009 CCSBT.
Sylvia, P. Belle, S. and Smart, A. (2002). Current status and future prospective of bluefin tuna ( Thunnus
thynnus orientalis) farming in Mexico and the West Coast of the United States. In : Bridges C.R.(ed.),
García A. (ed.), Gordin H. (ed.). Domestication of the bluefin tuna Thunnus thynnus thynnus.
Ticina, V., Katavic, I. and Grubisic, L. (2007). Growth indices of small northern bluefin tuna (Thunnus
thynnus, L) in growth-out rearing cages.” Aquaculture (2007)
Tzoumas, A., Ramfos, A., De Metrio, G., Corriero, A., Spinos, E., Vavassis, C. and Katselis, G. (2010).
Weight growth of Atlantic Bluefin Tuna (Thynnus thynnus, L.1758) as a result of a 6-7 months fattening
process in the Central Mediterranean. SCRS/2009/135 Collect. Vol. Sci. Pap. ICCAT, 65(3): 787-800
van Barneveld R. and Ellis, D. (2007). Practical nutrition of farmed Southern Bluefin Tuna Thunnus
maccoyii. Aquafin CRC, Adelaide. Commercial in confidence.