ADE IT Modernization Effort Update Arizona Data Governance Commission
1
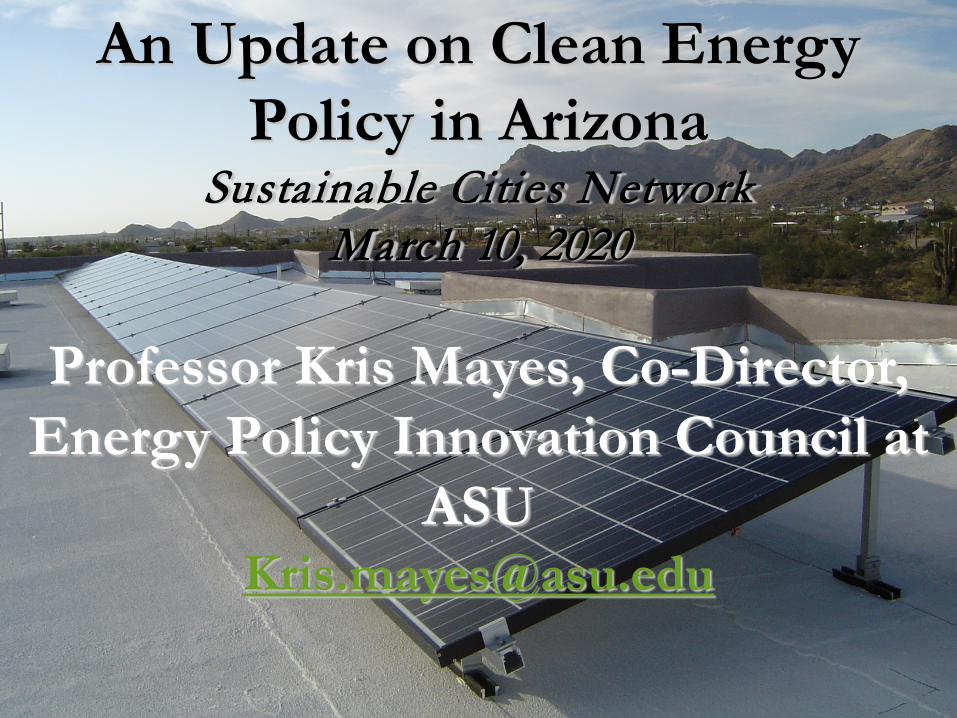
An Update on Clean Energy Policy in Arizona
Sustainable Cities NetworkMarch 10, 2020
Professor Kris Mayes, Co-Director, Energy Policy Innovation Council at


Foundational Policies Supporting Renewable Energy
• 30% Federal Investment Tax Credit (ITC) (Now expiring) • Renewable Portfolio Standards (RES)
• 15% by 2025• 30% DG Carve-out• Applies to utilities under ACC jurisdiction• Largely met, or will be within a few years.
• Net Energy Metering (NEM)/Value of Solar Export Rate• Underpins DG value proposition
• PURPA• Organized Energy Markets (CAISO, MISO, PJM)
ASU Utility of the Future Center 3

ASU Utility of the Future Center 4
0.00%
2.00%
4.00%
6.00%
8.00%
10.00%
12.00%
14.00%
16.00%
Rene
wab
le E
nerg
y (%
Ret
ail S
ales
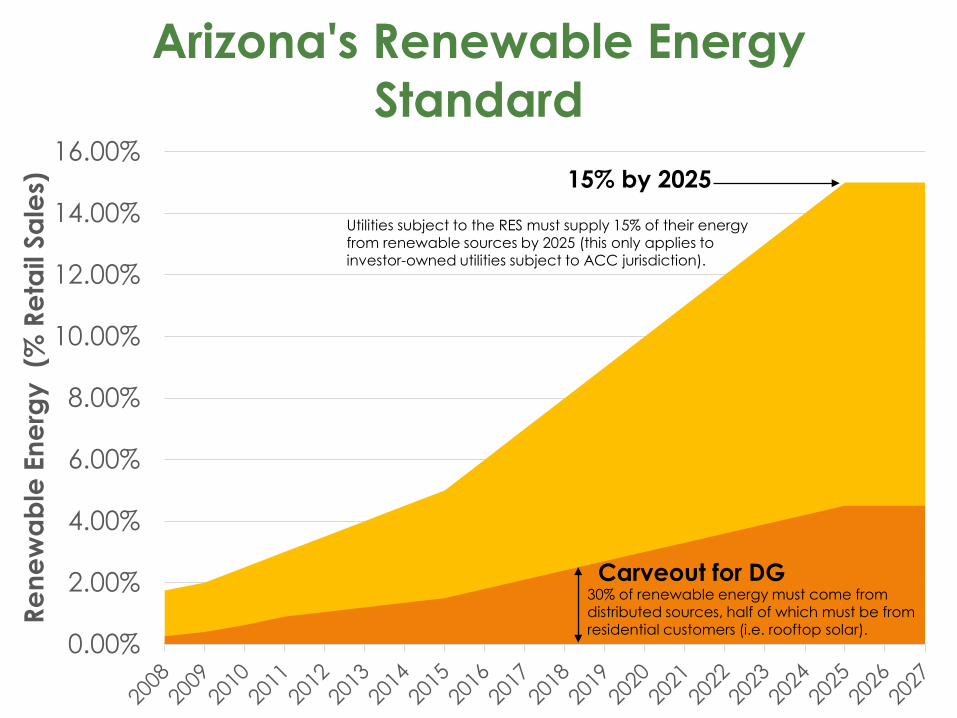
)Arizona's Renewable Energy
Standard15% by 2025
Carveout for DG
Utilities subject to the RES must supply 15% of their energy from renewable sources by 2025 (this only applies to investor-owned utilities subject to ACC jurisdiction).
30% of renewable energy must come from distributed sources, half of which must be from residential customers (i.e. rooftop solar).
ASU Utility of the Future Center 6

Slide courtesy of SWEEP7
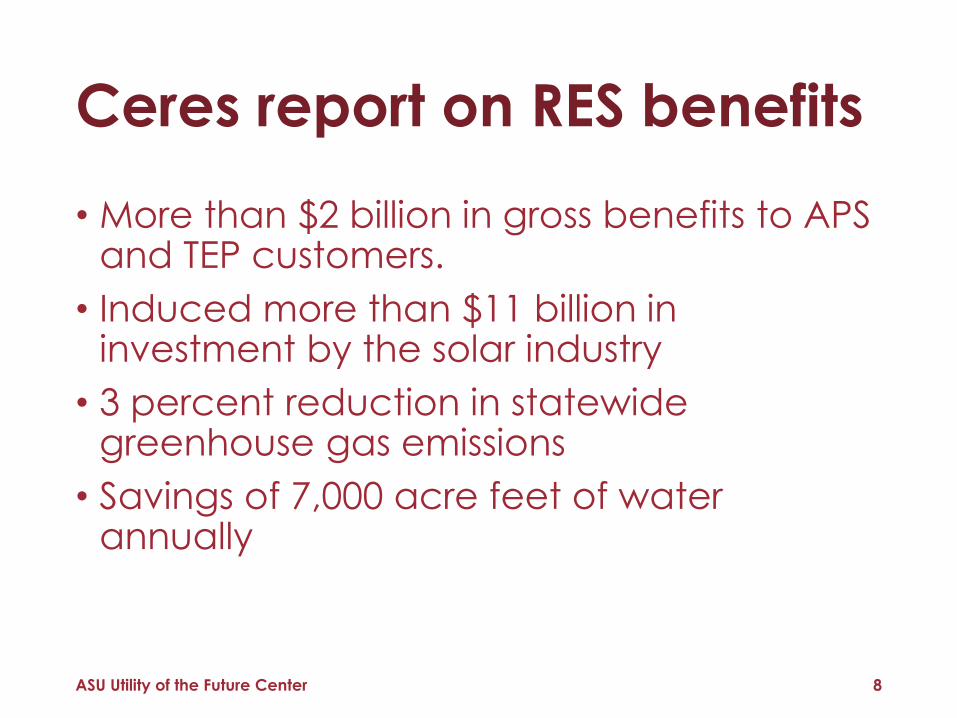
• More than $2 billion in gross benefits to APS and TEP customers.
• Induced more than $11 billion in investment by the solar industry
• 3 percent reduction in statewide greenhouse gas emissions
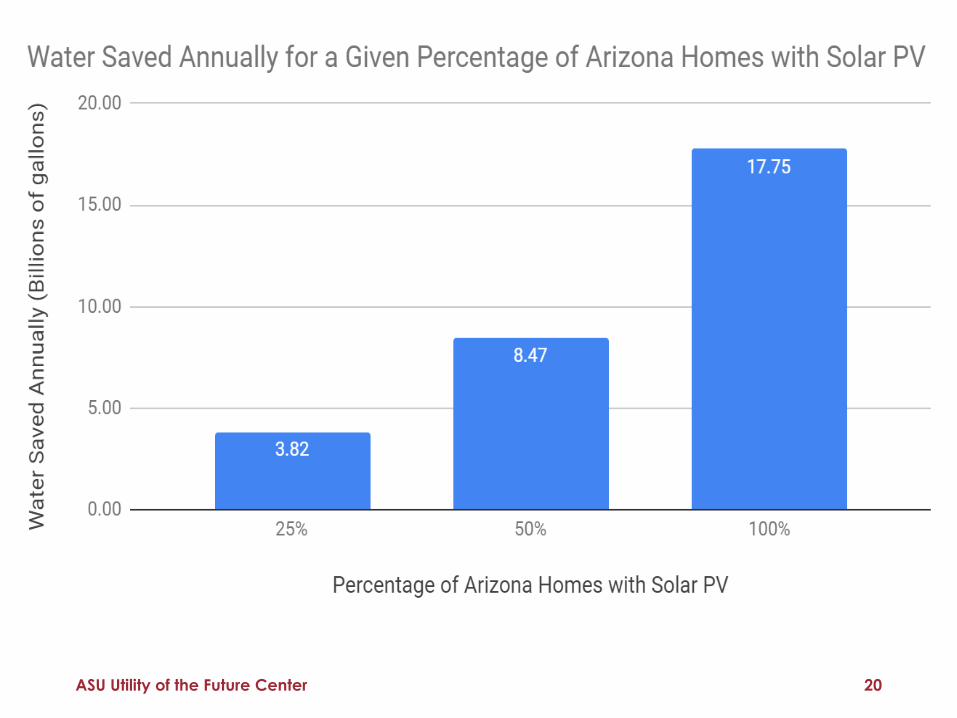
• Savings of 7,000 acre feet of water annually
ASU Utility of the Future Center 8
Ceres report on RES benefits

• Energy-related CO2 emissions have declined from about 102 million metric tons in 2008 to 87 MMT in 2016, about a 10% decline.1
• The CO2 benefit from 2008 through 2018 was approximately $309 million total.
ASU Utility of the Future Center 9
Benefits of the 15% Renewable Energy Standard in AZ
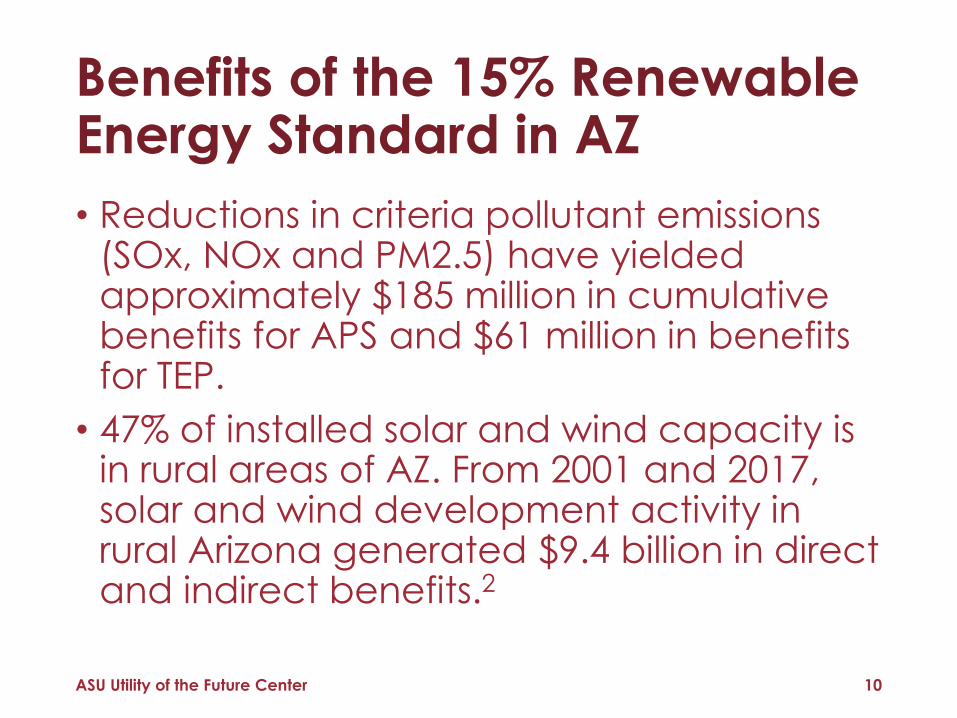
• Reductions in criteria pollutant emissions (SOx, NOx and PM2.5) have yielded approximately $185 million in cumulative benefits for APS and $61 million in benefits for TEP.
• 47% of installed solar and wind capacity is in rural areas of AZ. From 2001 and 2017, solar and wind development activity in rural Arizona generated $9.4 billion in direct and indirect benefits.2
ASU Utility of the Future Center 10
Benefits of the 15% Renewable Energy Standard in AZ

• Generally, REST surcharges have typically remained within the $3-4/month range for APS and $3-5/month range for TEP. Individual customer bill impacts have also been limited due to a monthly REST surcharge cap that was approved by the ACC.
ASU Utility of the Future Center 11
Benefits of the 15% Renewable Energy Standard in AZ

ASU Utility of the Future Center 12
Benefits of the 15% Renewable Energy Standard in AZ

ASU Utility of the Future Center 13
Benefits of the 15% Renewable Energy Standard in AZ

ASU Utility of the Future Center 14
Benefits of the 15% Renewable Energy Standard in AZ

ASU Utility of the Future Center 15
Benefits of the 15% Renewable Energy Standard in AZ
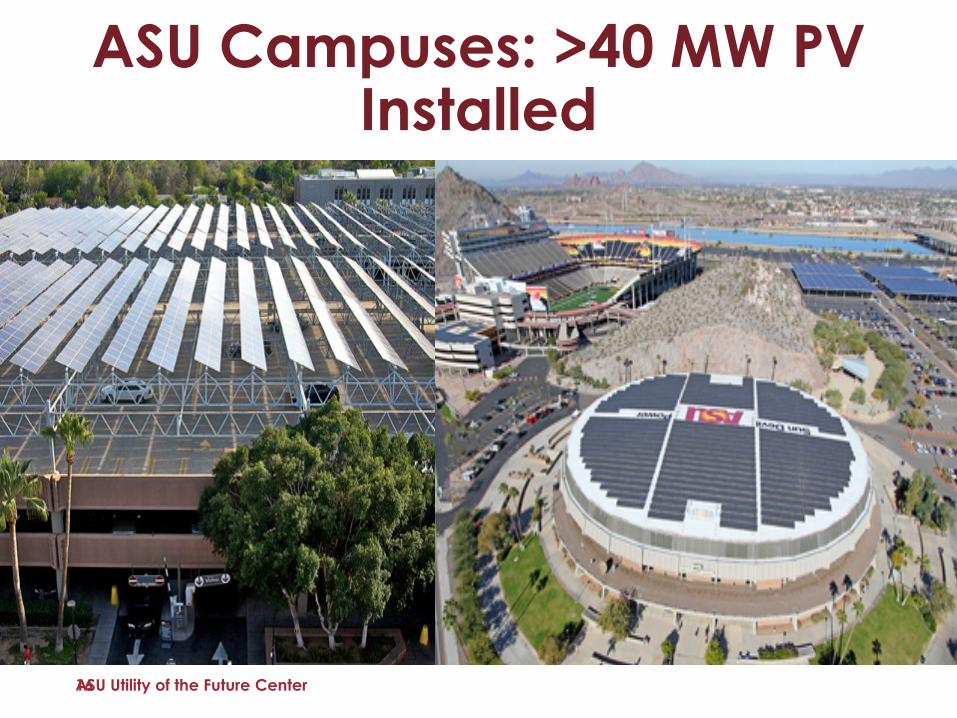
ASU Campuses: >40 MW PV Installed
ASU Utility of the Future Center16

Solana (Abengoa): 280 MW CSP with 6hr Thermal Storage
ASU Utility of the Future Center17

• ACC recently adopted an EV Roadmap to encourage utilities to invest in electric vehicle infrastructure.
• EV charging infrastructure to eliminate range anxiety; pilot rates to encourage off-peak charging; education and outreach.
• Average customer savings = $176 per year by 2050, due to an estimated 5.5 percent reduction in rates.
• Who should build EV charging stations/infrastructure?
• SRP’s sustainability goals call for 500,000 EVs on the roads.
ASU Utility of the Future Center 18
Electric Vehicles in AZ
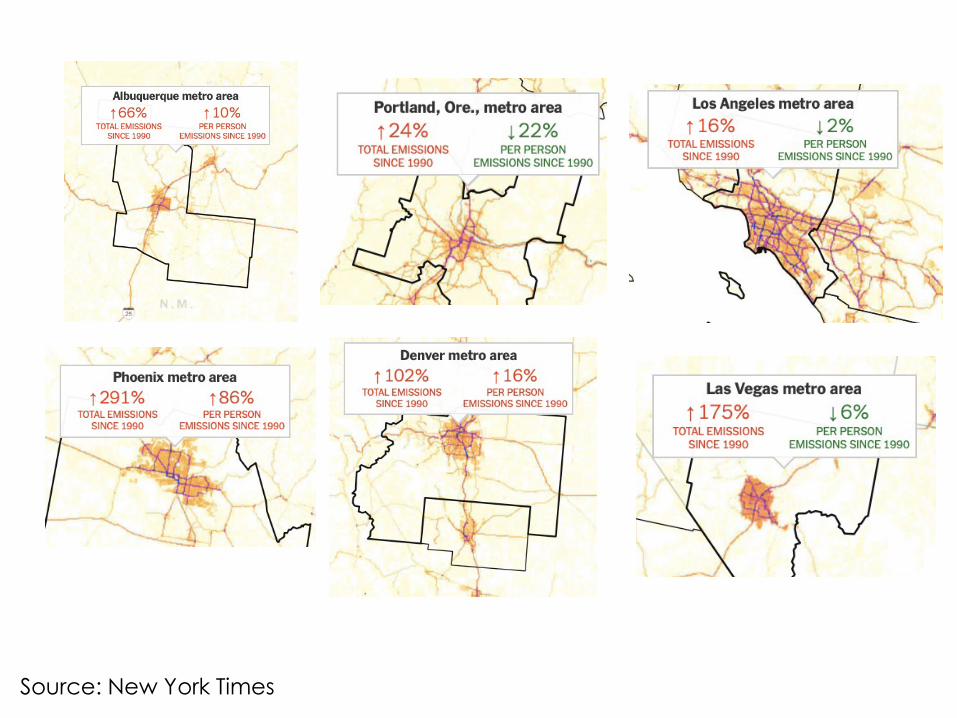
Source: New York Times
ASU Utility of the Future Center 20

ASU Utility of the Future Center 21
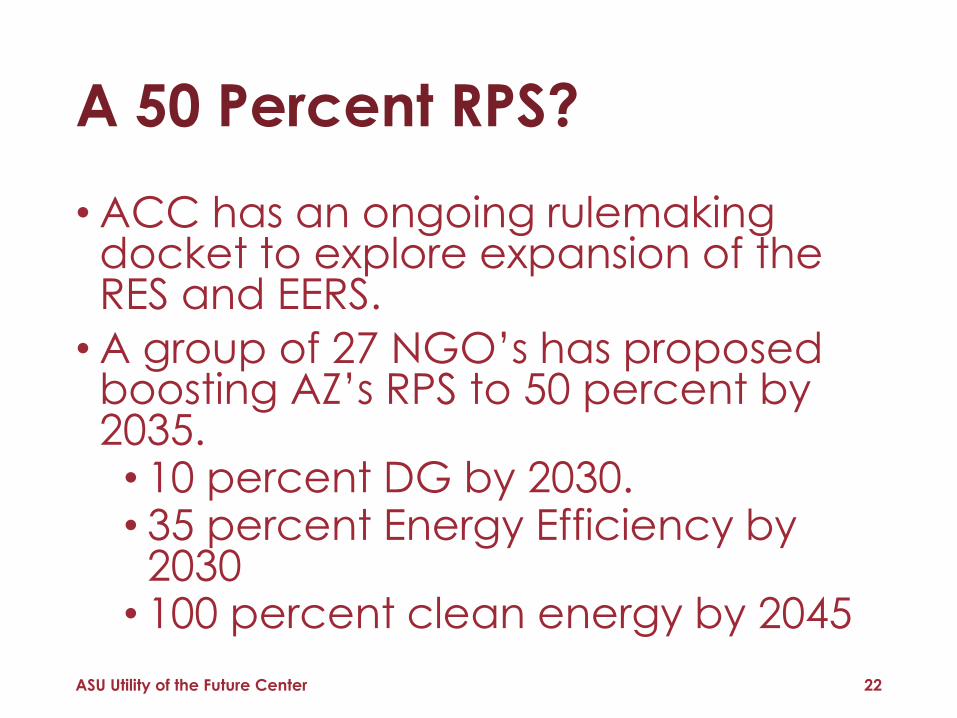
• ACC has an ongoing rulemaking docket to explore expansion of the RES and EERS.
• A group of 27 NGO’s has proposed boosting AZ’s RPS to 50 percent by 2035.
• 10 percent DG by 2030.• 35 percent Energy Efficiency by
2030• 100 percent clean energy by 2045
ASU Utility of the Future Center 22
A 50 Percent RPS?
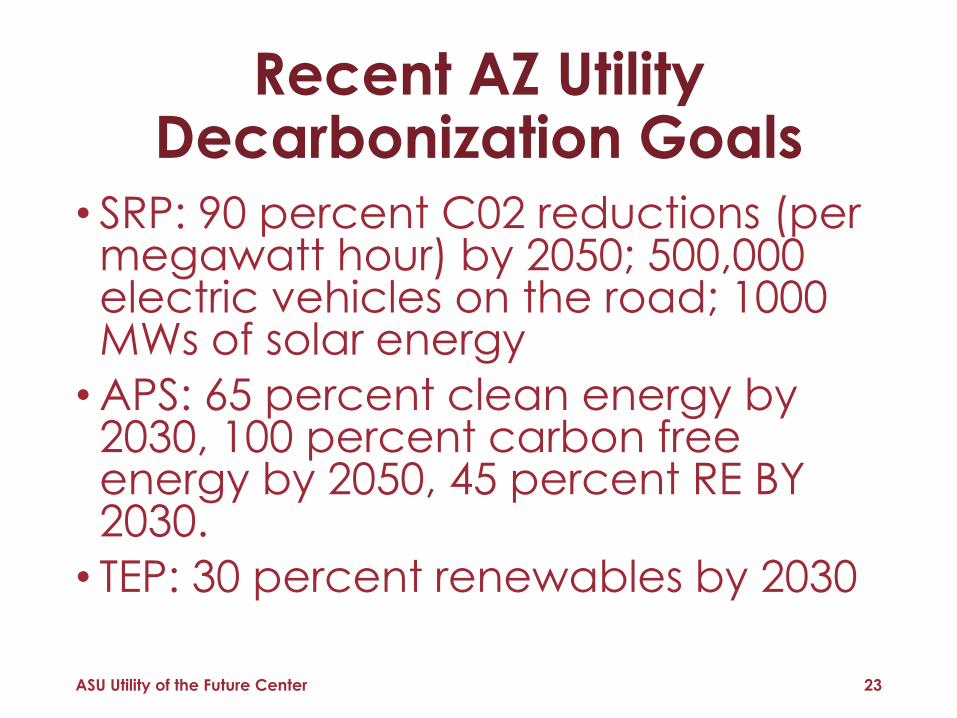
• SRP: 90 percent C02 reductions (per megawatt hour) by 2050; 500,000 electric vehicles on the road; 1000 MWs of solar energy
• APS: 65 percent clean energy by 2030, 100 percent carbon free energy by 2050, 45 percent RE BY 2030.
• TEP: 30 percent renewables by 2030
ASU Utility of the Future Center 23
Recent AZ Utility Decarbonization Goals
• APS: • 65 percent clean energy by 2030,
with 45 percent coming from RE• 100 percent clean, carbon free
electricity by 2050• End of all coal-fired generation by
2031
ASU Utility of the Future Center 24
Recent AZ Utility Decarbonization Goals

• Things to note from APS’ 2020 announcement:
• Strong commitment to continue Palo Verde operation
• Commitment to continued natural gas generation
• Preference for broadly defined policies over a renewable portfolio standard
ASU Utility of the Future Center 25
Recent AZ Utility Decarbonization Goals

• Things to note from APS’ 2020 announcement:
• Encourages in-home technology like rooftop solar, LED lighting, and smart thermostats
• Encourages Evs• APS is saying specific details to
come in its April IRP filing.
ASU Utility of the Future Center 26
Recent AZ Utility Decarbonization Goals
• Things to note from APS’ 2020 announcement:
• Interest in modern nuclear reactor designs
• Interest in hydrogen• Interest in energy storage, carbon
capture and storage
ASU Utility of the Future Center 27
Recent AZ Utility Decarbonization Goals

• Utilities are confident of how to get to 80 percent; do not know how to get the last 20 percent.
• Development of new technologies and pathways for clean energy growth will be key.
• Will it be hydrogen?• Synthetic fuels?
• Do we know how to turn the natural gas system down?
• I.e. what happens when gas plants are shut down and flows on gas pipelines are turned significantly down?
• Carbon capture will be critical
ASU Utility of the Future Center 28
Getting to 100 Percent: The Biggest Challenge Ahead

Coal Plants Now Uneconomic Across the U.S.

Sources: • 2013 Colorado College “Conservation in the West Poll” conducted by Fairbank,
Maslin, Maullin, Metz & Assoc. and Public Opinion Strategies: • 2013 Public Opinion Strategies Poll.• 2011 APS/Morrison Institute Informed Perception Project Report:
• 62% of voters say that solar is the first energy source they would encourage AZ to use more of.
• 60% of Republican primary voters said they would be less likely to vote for a candidate who voted to end solar programs.
• Nearly 90% of customers support a state renewable energy standard.
ASU Utility of the Future Center 30
What Do AZ Customers Want?

ASU Utility of the Future Center 31
Arizona Solar Hotspots

ASU Utility of the Future Center 32

• Bloomberg New Energy Finance released estimates recently that two thirds of the $7.7 trillion to be spent on energy projects between now and 2030 will go toward renewable energy projects, the result of declining costs.
• In Colorado, Xcel Energy recently announced that wind energy bid in to an RFP at below its system costs.
• Mid-American in Iowa, plans to spend $1.3 billion on 1,000MWs of wind, for largely economic reasons.
• Utility scale solar bids are coming in @ 2 cents a kw far lower than just a decade ago.
33
Renewables Costs Declining Everywhere

100 Cities, 10 Counties, 2 StatesCommit to 100% Clean Energy
34

190 Fortune 500 Companies Save$3.7 Billion/year with Renewable Energy
35

FROM:Did customers pay the correct amount for what they got?
TO:Are customers getting what they want?
Changing the central focus:
Utility and Regulatory Models for the Modern Era
by Ron Lehr

Cost of service ratemaking: why would utilities fight rooftop solar energy?• The rate formula:• R=O + (V-d)r
R=the Company’s revenue requirementO=the Company’s operating expensesV=the gross value of the Company’s capital
investmentD= the Company’s accrued depreciation(V-d)= the Company’s rate baser= the rate of return established by the regulatory
commission for the company to earn on its capital investment or rate base.
37
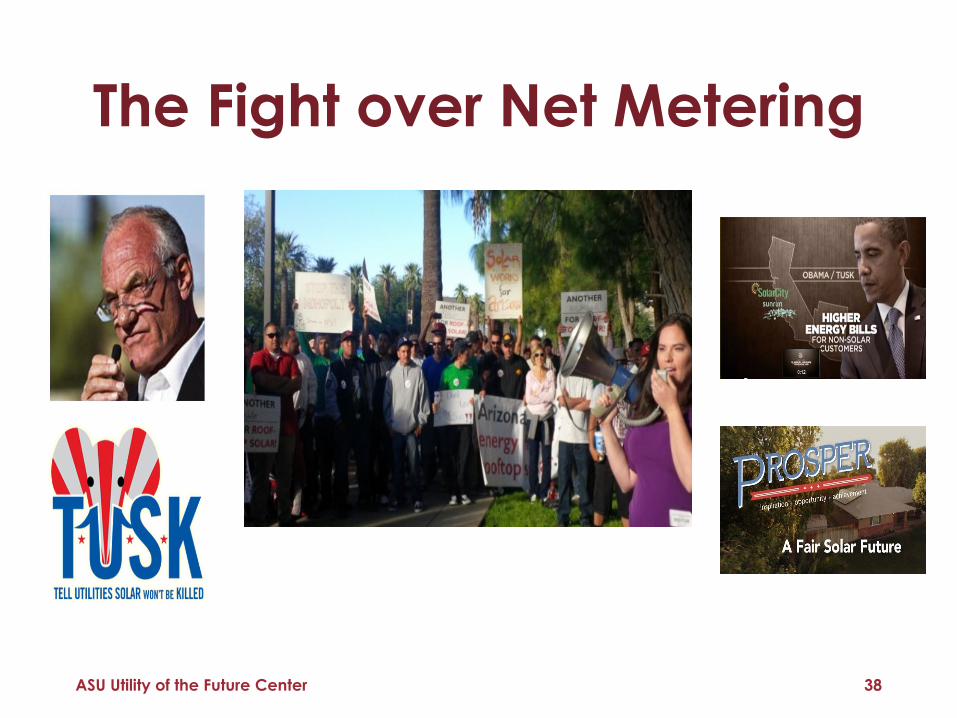
The Fight over Net Metering
ASU Utility of the Future Center 38
What policies are needed to further support and integrate renewables in the U.S.?
ASU Utility of the Future Center 39
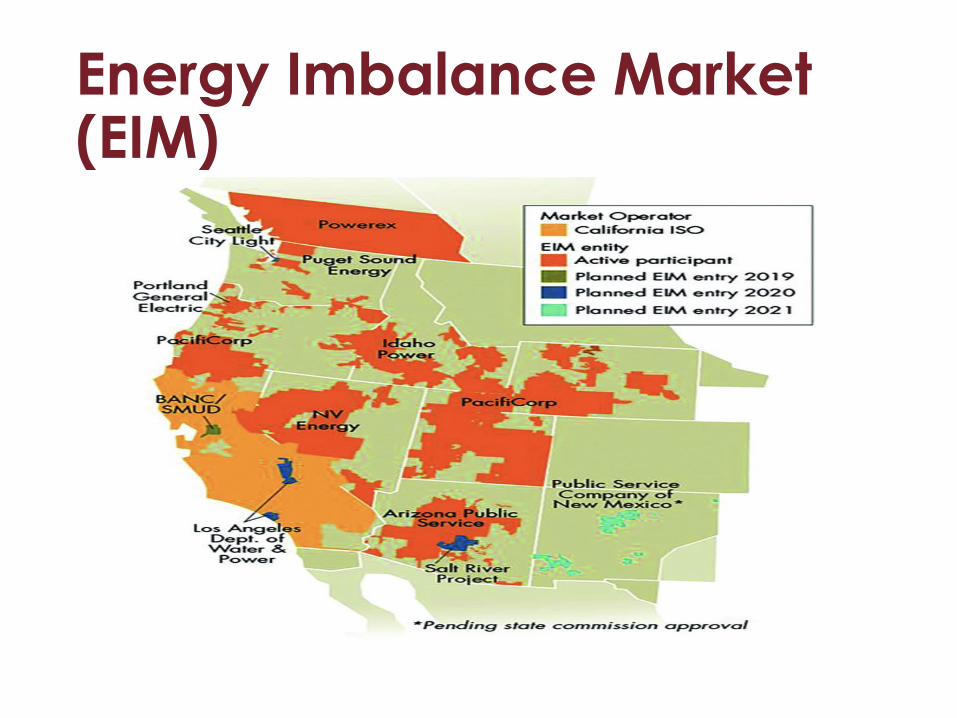
Energy Imbalance Market (EIM)

Energy Imbalance Market (EIM)
• CAISO is exploring the creation of a day ahead market that would allow resources outside of CA to bid into CAISO’s day ahead market.
• Could we see heightened levels of aggregated demand response, aggregated solar?
• Would further enhance the ability to integrate utility scale renewables, as well.
ASU Utility of the Future Center 42
Western Energy Day Ahead Market? The New Frontier

43
Arizona EHV Transmission Available Transmission Capacity (ATC)
Phoenix230 kVSystem
NavajoGlenCanyon
North Gila
PaloVerde
SilverKingKyrene
PinnaclePeakWestwing
Liberty
South
Saguaro
Vail
Greenlee
Cholla
Moenkopi
PreacherCanyon
McCullough
Eldorado
Mead
Tucson138 kVSystem
Devers
ImperialValley
Coronado
Four CornersShiprock
Tortolito
102
372
356
125556
0
0
0
Marketplace0
0 0
75
0
BrowningRudd787
0
Springerville
Transmission Line
Voltage Level500 kV 345 kV
ATC in MW
44
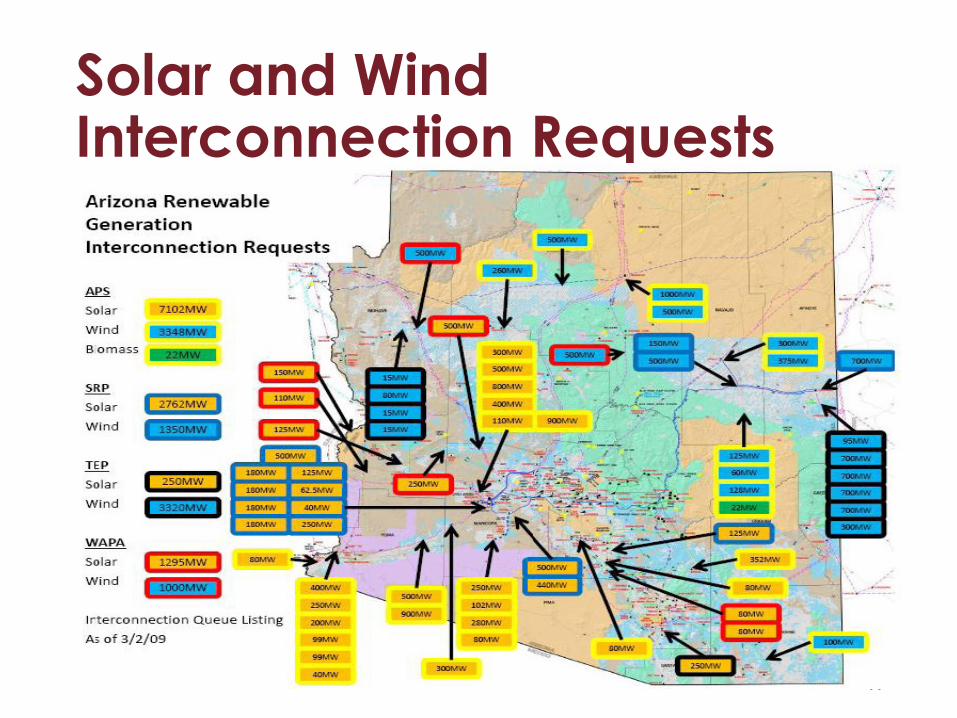
Solar and Wind Interconnection Requests

• Integrated Resource Planning for the Distribution System
• State PUC can require utilities to file two year plans, looking forward 10 years, for generation and transmission.
• Plans state how the utility plans to provide energy to its customers, and why it made those choices, i.e. why renewables over coal or gas over renewables, etc.
• Plans allow PUC members to ask questions and provide input and guidance to the utility.
• Some states are launching integrated distributionplanning (Hawaii, NY, E-21, MN)
ASU Utility of the Future Center 45
Vehicles for Facilitating Grid Mod in the Vertical State

• Scorecard Metrics to increase transparency and allow consumers to see the process of implementation of PBR.
• Introduction of competition into the energy market with a focus on meeting customer needs, ensuring reliability/resiliency, and emissions reductions.
• Earnings Adjustment Mechanisms (EAMs) introduced to allow utilities to earn regulated rate of return for meeting goals on customer engagement, energy efficiency, and DER interconnection.
• National Grid: Received 4 EAMs/8 total metrics in latest rate case; could earn up to $68 million over three years if it meets the targets set out. Pre-tax revenue adjustment would be made.
• Co. will track and report on a yearly basis. Began Jan 1, 2018.
• Platform Service Revenues introduced to compensate utilities for services such as bundled communication offerings, partnering with third parties to finance home energy technologies, etc. (Operating the state’s emerging distribution markets)
• Likely the most ambitious PBR framework in the US currently.
ASU Utility of the Future Center 46
NY’s Reforming the Energy Vision (REV)

• Hawaii PUC in the midst of a PBR process that is designing the nation’s first comprehensive PBR Framework.
• Considering incentives, rate mechanisms that encourage utilities to meet the state’s energy objectives, including 100 percent RPS, and avoid cap ex bias.
• Looking at the platform services model.
ASU Utility of the Future Center 47
Hawaii Performance Based Regulation
ASU Utility of the Future Center 48
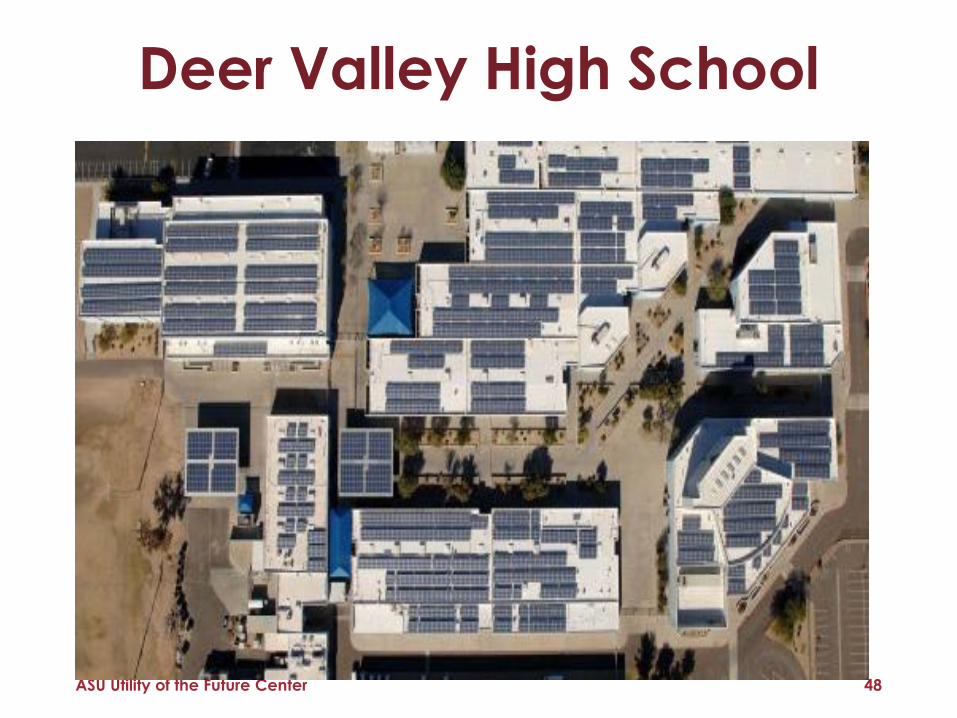
Deer Valley High School