An R&D Guide and Multiyear Plan for Improving Energy Use in … · 2019-12-19 · The R&D Guide and...
74
LBNL-56173 An R&D Guide and Multiyear Plan for Improving Energy Use in Existing Commercial Buildings R. C. Diamond Environmental Energy Technologies Division Lawrence Berkeley National Laboratory August 2004 Prepared for the U.S. Department of Energy Under Contract DE-AC03-76SF00098
Transcript of An R&D Guide and Multiyear Plan for Improving Energy Use in … · 2019-12-19 · The R&D Guide and...

LBNL-56173
An R&D Guide and Multiyear Plan for Improving Energy Use in Existing Commercial Buildings R. C. Diamond Environmental Energy Technologies Division Lawrence Berkeley National Laboratory August 2004 Prepared for the U.S. Department of Energy Under Contract DE-AC03-76SF00098

Acknowledgements Several people contributed to the initial planning meeting at the US Department of Energy that initiated this document. They included: Ed Barbour, Dru Crawley, Rick Diamond, Jerry Dion, David Hansen, Charlie Hemmeline, Ron Lewis, Ron Majette, Andrew Nicholls, Sean McDonald, John Ryan, & Lisa Stevenson. We would also like to acknowledge the people who shared their knowledge and ideas by responding to the web-based survey: Michael Baker, Lynn Benningfield, C. Britton, Karl Brown, John A. Bryant, Tony Cooper, Allan Daly, Cyane Dandridge, Rob Everhart, Paul Ewing, Clifford Federspiel, Glenn Friedman, Krishnan Gowri, Jeff Haberl, Philip Haves, Kristin Heinemeier, David Hewitt, Adam Hinge, Patrick Hughes, Kathryn Janda, Jeff Johnson, Betsy Krieg, Rick Kunkle, Mark Levi, Mike MacDonald, Douglas Mahone, Sean McDonald, Mithra Moezzi, Andrew Nicholls, Bill Pennington, Mary Ann Piette, John H. Reed, Eric Richman, Tim Salsbury, Mudit Saxena, Chris Scruton, Diana Shankle, Sandy Smith, Ed Spivey, Steve Taylor, Malcolm Verdict, Bruce Vincent, Andy Walker, Phil Welker, Rick Wiesner, and several anonymous respondents. Organizations that responded to the web-based survey included: American Council for an Energy Efficient Economy, Aspen Systems, California Energy Commission, PIER Buildings Team, California Energy Commission, Building Standards Development, General Services Administration, Heschong Mahone Group, Johnson Controls, Inc., LBNL, New Buildings Institute, NREL, Oberlin College, ORNL, Northwest Energy Efficiency Alliance, Pacific Gas and Electric Company, PNNL, Portland Energy Conservation, Inc., SBW Consulting, Inc., SMUD, Strategic Energy Innovations, Sustainable Energy Partnerships, Taylor Engineering, TecMRKT Works, TECO BGA, Texas A&M, University of California, CIEE, University of California, Center for the Built Environment, UC Berkeley, Washington State University, Energy Program and WaterFurnace International. Lastly, we would like to acknowledge the support and contributions of the Commercial Buildings Team, at the US Department of Energy, specifically John Ryan, Team Lead, and David Hansen, Project Manager for this work. This work was supported by the Assistant Secretary for Energy Efficiency and Renewable Energy, Building Technologies Program, of the US Department of Energy under Contract No. DE-AC03-76SF00098.
Comments Please send all comments on this document to David Hansen [email protected] or to Rick Diamond [email protected]
ii

Contents PART ONE An Introduction to the Guide: A Brief Glossary of Terms 1 PART TWO DOE’s vision for existing commercial buildings in 2015 3 PART THREE DOE’s criteria for selecting R&D projects in existing
commercial building 4 PART FOUR Creating a framework for a multiyear R&D plan 7 PART FIVE Potential R&D projects for the existing commercial sector 17 PART SIX Partners & Allies: Current and future activity 21 PART SEVEN Recommendations & Rationale for an R&D program
for the existing commercial sector 24 References 27 Websites 30 Appendix A Participants in the multiyear planning workshops Appendix B A five-year R&D plan for the existing commercial buildings sector
iii

iv

Part 1: Introduction
PART ONE: An Introduction to the Guide: “If you don’t know where you are going...You might end up someplace else...” Yogi Berra (1925- ) Why DOE? The US Department of Energy (DOE) is the federal agency charged with addressing the Nation’s energy issues. DOE’s Office of Energy Efficiency and Renewable Energy (EERE) leads the Federal government’s research, development, and deployment (RD&D) efforts to provide reliable, affordable, and environmentally sound energy for America’s future. The use of the term “DOE” in this guide refers generally to DOE’s Building Technologies (BT) Program, and specifically to the Commercial Buildings Team. Why a Guide for R&D? The R&D Guide and Multiyear Plan for Improving Energy Use in Existing Commercial Buildings is a guide to shape the R&D efforts for the next 5 years for the existing commercial building sector. The Guide identifies the goals for this work, and provides a basis for selecting R&D activities that will help achieve that goal. As the goal of improving the energy efficiency of commercial buildings is shared by many organizations and individuals, the Guide identifies potential partners and presents ways to maintain collaborative efforts. But foremost, this is a guide for DOE program managers and their contractors to refer to in order to develop clear, consistent and coherent R&D programs. The Guide is also a document to show Congress, OMB and others the methodology and logic
underlying the recommendations in this guide. What is “R&D”? Research & Development (R&D) is the systematic, investigative, and experimental activities that involve innovation and/or high levels of technical risk. R&D is typically carried out in order:
• •
To acquire new knowledge or To create new or improved materials, products, devices, processes or services.
The results of the R&D can be used in a variety of ways:
1. To introduce new products and practices into the private sector, e.g., new lighting technology.
2. To support public policy, e.g., new
codes and standards.
3. To provide information for other R&D and deployment efforts.
Short-term vs. long-term projects. DOE’s buildings R&D can be categorized as short-term (1-2 years), medium term (3-5 years) and long-term (5-10 years). An R&D program portfolio would typically include a mix of these projects. Should R&D be coupled to marketing? A fundamental question is whether the BT R&D projects need to be intimately linked with deployment and market strategies. In the private sector, R&D is typically carried out by one part of the organization and marketing by another. Ideally these two units work together to establish common goals and objectives, but in practice they are
1

Part 1: Introduction
often at odds with each other, competing for resources and recognition. The current organization of EERE separates R&D and deployment, but there is nevertheless an expectation that R&D will need to develop marketing and deployments efforts for their projects. Broad view or narrow view of R&D? Some policy makers have made the argument that there is no need for R&D in the existing commercial building sector—we already know what needs to be done, it just has to be implemented. This view is misleading in that it is too narrowly focused on what needs to be done at the present time. Thinking that we already know what lighting retrofits, O&M strategies, commissioning work, etc., are best for existing buildings ignores the enormous potential for not only refining these approaches through R&D to make them better, but it also ignores the potential to develop new approaches for future retrofits. What do we mean by “improving energy use”? The stated goal for this R&D Guide is to “improve” the energy use in existing commercial buildings. This goal could have been to “reduce energy use” “improve energy efficiency” or “improve energy-related performance”. While EERE has a mission to “increase the energy efficiency of buildings,” for many of the owners and workers in commercial buildings, improving performance is more relevant than energy efficiency. What is the “existing commercial buildings” sector? The existing commercial sector consists of 4.6 million buildings, representing
floorspace of over 67 billion square feet. The sector include educational facilities (schools, colleges & universities); food sales (markets) and food service (restaurants); health care facilities (hospitals & clinics); lodging (hotels, dormitories); retail; offices; public assembly; religious worship; service; warehouse and storage; and other non-residential facilities. But the commercial building sector is more than a compilation of floor area and energy consumption. It is the sector where millions of people work, play, study, receive medical assistance, pray, shop, eat, meet, store things, and perform a variety of other activities. The sector is also a real estate asset—a major investment of the nation’s capital. As such, it is owned and managed by a variety of financially motivated players, who all have roles and responsibilities for ensuring the operation of the buildings that make up this sector. And running through this entire conglomeration of buildings is the (mostly) silent consumption of energy. Energy is used to heat and cool, ventilate and provide a myriad of services. The basis of this Guide is to improve the consumption of energy, but this activity is nearly invisible to the principal actors. And so the focus often needs to be on the cost and performance of the services that energy provides, and who makes these decisions, and not on energy itself.
2

Part 2: Vision
PART TWO: DOE’s Vision for Existing Commercial Buildings in 2015 “If you don't know where you are going, any road will get you there.” (Unknown) The following list was developed at a (1/8/03) planning session with members of the BT Commercial Buildings team and EERE planning staff as DOE’s preliminary vision for the existing commercial sector in 2015: 1. Energy efficiency is established as a
public value. 2. DOE has impacted market
transformation rather than just developed “advanced technology”. We need to implement what is already known in a large part of the stock, rather than focus on new technology in a few buildings.
3. Energy efficiency is linked to comfort
and technology. 4. Building owners and occupants are more
aware of the connection between energy use and productivity, building performance, tenant satisfaction and profitability.
5. Building owners and operators have the
tools to identify energy saving opportunities and take actions.
6. Design and O&M tools are linked with
advanced technologies developed at DOE and elsewhere.
7. Every building has a professional energy
manager. 8. Existing commercial buildings have not
only maximized energy savings, but also
have the ability to control peak (demand) loads.
9. Existing commercial buildings are
brought up to current energy codes for new construction.
10. DOE has maximized the impact of its
programs, through work with partners and other players. DOE (BT) can’t do this alone for $2M/yr. Need to coordinate with Rebuild, SEP, ASERTTI and others.
Other possible elements of the vision identified by the team: •
•
Existing buildings reduce their energy use 20% through improved O&M
Existing buildings reduce their energy use another 20% through retrofitting new lamps, ballasts, controls and high-efficiency equipment.
3

Part 3: Criteria
PART THREE: DOE’s criteria for selecting R&D projects in existing commercial building “Our life is frittered away by detail ...Simplify, simplify.” Henry David Thoreau (1817-1862) The following list was developed at a (1/8/03) planning session with members of the BT Commercial Buildings team and EERE planning staff as DOE’s preliminary criteria for selecting R&D projects for the existing commercial sector: 1. Sufficient Resources. What level of
funding is needed to do the job? Critical mass versus likely funding, i.e., what will it take to get the job done versus what level of funding is realistic? Comment: We should think beyond current budget concerns—global warming may raise the issue to a higher need and we should be ready.
2. Clear Message. Is there programmatic
appeal? How do we package and market it to EERE, OMB, Congress and stakeholders? Is there a “Strong Message”? Note: See the OMB criteria for performance and budget guidance at the OMB website: http://www.whitehouse.gov/omb/budintegration/part_assessing2004.html
3. Energy Impacts. Are there significant
and measurable energy impacts? 4. Demonstrable Results. Are there
important, measurable impacts in addition to energy savings from the program outputs?
5. Early Successes. Have we targeted
likely adopters? Do we understand the market? Is there market receptivity?
6. DOE role. Is there a unique role for DOE? Is there a broad public benefit? Are others not already addressing the work?
7. Replicability. Is there replicability and
linkages to other players and resources? 8. Champions. Is there a strong (both
vocal and weighty) constituency? Do our current stakeholders have sufficient clout to raise the program to their representatives in Congress? Do we need to develop new partners, e.g., to champion these activities?
9. Security. Are there links with Homeland
Security? Are there issues here to pursue, such as indoor air quality that are important to both retrofit and safety and security?
10. Analytical soundness. Do we
understand the situation well enough to know what to pursue? Is the basic need for analysis and evaluation included as an essential part of the R&D effort?
In addition to the DOE criteria, stakeholders were asked via the web-based survey the question: What criteria should DOE use in setting R&D priorities for existing commercial buildings? [Number represents frequency of response] [33] User benefits, e.g., health, productivity,
& comfort [32] High energy savings [22] Long-term/ high risk research [20] Partnership with other organizations [19] Increased reliability [14] Short term/ low risk research [10] Demand reduction Other comments from the stakeholders about R&D criteria:
4
Part 3: Criteria
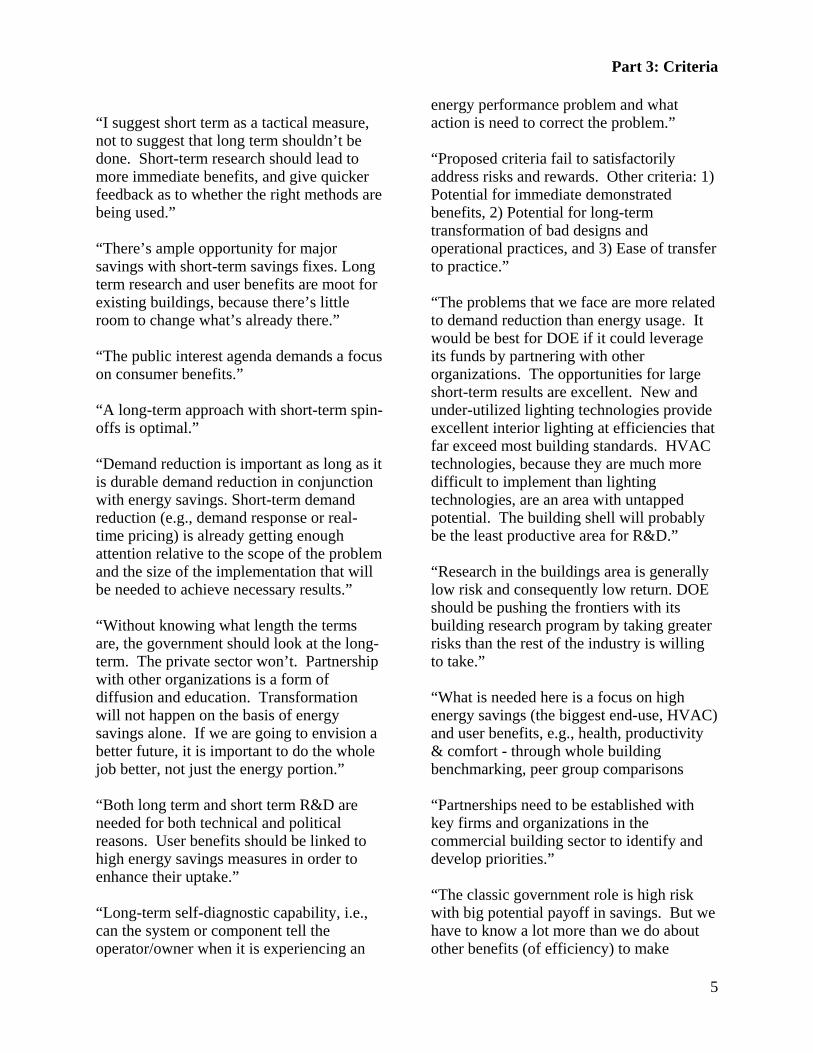
“I suggest short term as a tactical measure, not to suggest that long term shouldn’t be done. Short-term research should lead to more immediate benefits, and give quicker feedback as to whether the right methods are being used.” “There’s ample opportunity for major savings with short-term savings fixes. Long term research and user benefits are moot for existing buildings, because there’s little room to change what’s already there.” “The public interest agenda demands a focus on consumer benefits.” “A long-term approach with short-term spin-offs is optimal.” “Demand reduction is important as long as it is durable demand reduction in conjunction with energy savings. Short-term demand reduction (e.g., demand response or real-time pricing) is already getting enough attention relative to the scope of the problem and the size of the implementation that will be needed to achieve necessary results.” “Without knowing what length the terms are, the government should look at the long-term. The private sector won’t. Partnership with other organizations is a form of diffusion and education. Transformation will not happen on the basis of energy savings alone. If we are going to envision a better future, it is important to do the whole job better, not just the energy portion.” “Both long term and short term R&D are needed for both technical and political reasons. User benefits should be linked to high energy savings measures in order to enhance their uptake.” “Long-term self-diagnostic capability, i.e., can the system or component tell the operator/owner when it is experiencing an
energy performance problem and what action is need to correct the problem.” “Proposed criteria fail to satisfactorily address risks and rewards. Other criteria: 1) Potential for immediate demonstrated benefits, 2) Potential for long-term transformation of bad designs and operational practices, and 3) Ease of transfer to practice.” “The problems that we face are more related to demand reduction than energy usage. It would be best for DOE if it could leverage its funds by partnering with other organizations. The opportunities for large short-term results are excellent. New and under-utilized lighting technologies provide excellent interior lighting at efficiencies that far exceed most building standards. HVAC technologies, because they are much more difficult to implement than lighting technologies, are an area with untapped potential. The building shell will probably be the least productive area for R&D.” “Research in the buildings area is generally low risk and consequently low return. DOE should be pushing the frontiers with its building research program by taking greater risks than the rest of the industry is willing to take.” “What is needed here is a focus on high energy savings (the biggest end-use, HVAC) and user benefits, e.g., health, productivity & comfort - through whole building benchmarking, peer group comparisons “Partnerships need to be established with key firms and organizations in the commercial building sector to identify and develop priorities.” “The classic government role is high risk with big potential payoff in savings. But we have to know a lot more than we do about other benefits (of efficiency) to make
5

Part 3: Criteria
progress because efficiency by itself does not often sell.” “Energy savings is always number one. But, energy does not sell of its own accord, in most cases, so you need to appeal to user benefits. Reliability (performance, durability) is always issue with new technologies and will be issue for end user.” “I don’t think a lot of existing building owners will be interested in anything but short term/low risk stuff and their cooperation in any DOE effort will be essential.” “I suspect that one of the major drivers for owners/occupants will turn out to be user benefits, with energy coming along for the ride.” “DOE needs to have a mix of long-term and short-term research. It’s not a simple matter of one over the other. Potential energy savings should be a key driver. If we do it right other user benefits will come along such as increased reliability, demand reduction, healthier buildings, etc.”
6

Part 4: Framework
PART FOUR: Creating an appropriate framework for developing a multiyear plan “Make no little plans; they have no magic to stir men’s blood.... Make big plans... aim high in hope and work.” Daniel H. Burnham (1846 - 1912) “The map is not the territory” Alfred Korzybsk, Science and Sanity, (1933) Initial Questions: How should DOE think about the existing commercial building sector? Is it best disagreggated by building type, owner type, floor area, energy potential, areas not already being targeted, political constituency, or what? Are schools more popular than hospitals? Is large multifamily needier than small retail? Are there easier energy saving opportunities in large commercial than small office buildings? What are the elements of a planning framework? Possibilities for the matrix include “Stock characterization”, “players”, and “lifecycle stages”. How are these elements best organized? How does this effort relate to the EERE 2002 Strategic plan? How does this effort relate to the new EERE planning templates? Recognizing that DOE’s contribution to R&D will only be a small part of the effort needed, does it matter what building types, end uses, technologies, lifecycle interventions, decision makers, other drivers, etc., are targeted, as long as there is a healthy mix of activities, each of which meets the core criteria for R&D selection? Given that there are several players, e.g., utilities, States, ESCOs, etc., already active in this area, does it matter what DOE does, as long as it does it well? In other words, if
we are only taking little bites, does it matter how we slice the pie? What is the best way we can change the landscape, by sowing or scattering a few seeds, or by drawing up elaborate plans for a formal design? The stakeholder survey asked two questions in this area, the first on building types: What building types in the existing commercial buildings sector should DOE focus on? [32] Large commercial office (over 50,000 ft2) [29] Small commercial office (under 50,000 ft2) [22] K-12 schools [21] Hospitals [19] Retail [15] Colleges & Universities [11] Large multifamily Other/Comments about sectors: “Large commercial offices and hospitals (typical targets of this type of effort) are quite specialized buildings, designed by the more sophisticated practitioners. The bulk of buildings that need help are small offices, retail and schools.” “There will be a need to retrofit the large amount of inefficient K-12 space that has just been built and the large amount of inefficient College and University space that is now being built. Existing Hospitals will become more heavily used. This is all driven by demographics.” “Grocery is equally important as retail if distinguished from retail. Small office is only slightly less important.” “Small businesses often suffer the most from increased energy costs and lower coping capabilities. Schools and colleges have
7

Part 4: Framework
much to learn and teach about energy efficiency and user behavior. Research in these areas is a natural extension of their educational mission.” “Large and small office and retail account for the majority of commercial buildings and commercial building floor space. The are also relatively straightforward and more homogeneous, making solutions easier to identify and deploy.” “The small commercial sector will be the least productive because of the prevalence of triple-net leases. Otherwise, I believe you should focus on cross-cutting technologies and market-transformation issues and not focus on building types. Don’t put all of your eggs into a couple of baskets.” “There is a greater potential for enhancing the performance of larger facilities because there is more underutilized infrastructure available for deploying new technologies with little additional (relative) capital cost. For example, larger facilities often have networked control systems that are only functioning as time clocks.” “I think DOE should focus where most of the energy is used (CBECS would say mercantile & service, office and education.) I pick small office over large because there is more of it and the owners of large offices BOMA members, Hines, etc., don’t need DOE’s help nearly as much. I pick both education categories because K-12 is still very needy and colleges & universities are a way to get at large buildings where owners (at least theoretically) may take a life-cycle view.” “The focus should be on sub sectors and ownership groups where there are opportunities to create change, rather than targeting certain broad sectors.”
“While all categories of commercial building are deserving of attention, several categories appear to “under-served” in my mind. Small office and retail are two of these categories. They typically do not have access to appropriate assistance. Under “Other”, I’d suggest targeting “franchise” operations ranging from the MacDonalds of the world to Costco/WalMart etc. Not because these “franchise” operations don’t have access to what they might want, but because they represent one of the few “mass markets” in the commercial world.” “There are significant code ramifications when retrofitting commercial buildings. Recommendation is to focus on small commercial due to sheer numbers of them. Franchises would be an excellent initial target group.” Priority areas for DOE’s R&D in existing commercial buildings After asking about priorities across the building sector, the survey asked a question regarding R&D areas: What R&D areas should DOE pursue in the next five years at $2-10M/year to improve the energy efficiency in existing commercial buildings? The responses from the survey were as follows: [22] Diagnostic tools [21] Owner/occupant behavior and decision making [20] Controls [19] Commissioning [16] O&M [13] Benchmarking [11] Technology R&D [10] New technology retrofit demonstrations [8] Modeling tools [6] Market transformation
8

Part 4: Framework
Other/Comments about priority areas for R&D: “All of these need to be done. A good portfolio of research should include all of these categories.” “New technology is not the issue for existing buildings. Making them work better is the key. Benchmarking is necessary to measure progress, behavior, decisionmaking and O&M determine what actually gets done.” “One needs to know how well one is doing in order to make improvements (Benchmarking). Building Controls are currently very crude technology compared with industrial controls or other electric industry products. Diagnostic monitoring capability is important.” “In ‘diagnostic tools’, I also include the need for better data on energy services & behavior in the real world ... e.g., better end use consumption measurements & characterization (combining with technical & behavioral aspects). “Attention to integrating technology R&D with building use/building users: what is needed (vs. what can we do)? “ENERGY PLUS needs sustained DOE funding.” “Hard to choose, but with the building types I selected, I think these areas provide a good fit. Benchmarking because I think it works with decision-making, retrofit demonstrations because it necessarily involves changing real buildings and people’s practices. The other areas (e.g., the modeling tools) could be improved quietly behind closed doors with few benefits to the general public or building trades.”
“There is significant overlap between “commissioning”, “diagnostic tools” and “O&M”. Diagnostic tools represent an important strategy for overcoming the cost and skill shortage associated with both retro-commissioning and performance monitoring as part of O&M.” “On site energy options (renewables).” “All the areas listed will only provide marginal benefits. Other major areas should be: 1) Beyond Benchmarking - analyses of causes of both high and low benchmark energy performance scores.” 2) R&D of systems adaptation strategies to achieve high savings (make lemonade from lemons).” 3) Tech transfer methods - how to reach and influence the major key audiences (my take on "Market transformation" is that it tends to be too "hands off") “The most significant results, obtained for the least amount of money, will be found in two areas: (1) making better use of off-the-shelf technologies or market-ready technologies; and (2) better training for design professionals. For example, with respect to item 2, once a mechanical engineer is properly trained and experienced, he/she will replicate the results of the training in actual designs for years (probably decades) with incentives from utilities or governmental agencies.” “Market transformation assumes there is something ready for market exploitation. In fact, there are very few technologies of value "waiting to be exploited". There is a lack of smart innovative thinkers in the construction industry, which is dominated by an ultra-conservative low-risk mentality toward technology. DOE should seek to fill this vacuum and focus on the more technically difficult problems.”
9

Part 4: Framework
“DOE’s new program needs to be relevant in the context of what else is going on. Primary energy benchmarking provides a very low cost identification of building energy savings potential.” “It is important to better understand how buildings are maintained and operated and how to best influence changes toward more efficient operation.” “Under ‘Other’ I’d suggest that a lot more effort should go into data collection, and specifically data collection about energy-related systems in commercial buildings. CBECS is fine for general characteristics but poor for energy related matters. Specifics on equipment types, actual levels of performance, etc, etc., are all things that should be collected.” “Also, owner/occupant decision making in the low-end commercial world should be investigated. The design/build firms, the franchise operations, the “commercial building” that is really just a house with an office in it. We know little about these.” “O&M is a big issue. DOE has lots of programs telling folks what they should put in their buildings. And O&M programs that tell them what they should do. But there is a missing link that addresses “how” do you do O&M if you don’t have staff or can’t afford it.” “DOE does not have adequate benchmarking information. This is critical to be able to make many of the needed estimates. Owner/occupant behavior is absolutely critical to understanding why a building performs the way it does. Most of the behavioral data is outdated at this point in time.”
10

Part 4: Framework
R&D Matrices for Existing Commercial Buildings There are several ways to characterize the existing commercial sector, depending on one’s objective rationale for doing so. One can develop a matrix with any two, or even three of these variables. A. Energy Consumption. If the fundamental issue for DOE’s R&D projects is to develop new technologies to reduce energy consumption, it is useful to know where the energy is being used. Table 1 shows a breakdown of the sector by building type with total energy and energy intensity, for both site and source energy usage (CBECS 2002). B. Energy Costs & Savings. If the fundamental issue is to identify what are the cost savings, then we need to focus on the costs and savings potential for the sector. Table 2 shows the energy costs for the different building types, and gives potential savings for technical retrofits (30%) and operations and maintenance (10%). See also Table 3 for O&M savings. C. End Use Consumption. If the issue is to develop specific technologies for different end uses, then we will want to know where the energy is being used. Table 4 gives the enduse breakdown for the different building types in site energy. D. Decision makers. If the focus is on market transformation, then we need to know who are the market players. Table 5 gives an example of how to characterize the sector by decision makers who have an impact on energy consumption (Schick 2002).
E. Lifecycle Opportunities. If we want to understand at which times there is an opportunity to retrofit the existing building stock, we need to review the intervention opportunities such as renovation, remodeling and equipment replacement.
11

Part 4: Framework
Table 1: Energy Indices for Existing Commercial Building Sector [Source: EIA 2002 “1999 CBECS” Table C1 & C3] Shaded cells are the top three sectors per index. Index Sector
Floor Area
[Billion ft2]
Site Energy Use
[Trillion Btu]
Site Energy Intensity
[Kbtu/ft2]
Source Energy Use
[Trillion Btu]
Source Energy Intensity
[Kbtu/ft2]
Education 8.6 13%
649 11%
75 1169 10%
136
Food Sales & Service
2.8 4%
648 11%
231 1418 12%
506
Health Care 2.9 4%
515 9%
176 984 8%
339
Lodging 4.5 7%
450 8%
99 845 7%
188
Office 12.0 18%
1089 19%
90 2636 22%
220
Retail 10.3 15%
724 13%
70 1776 15%
172
Public 5.6 8%
461 8%
82 929 8%
166
Othera 20.4 30%
1199 21%
59 2232 19%
109
Total 67.3 100%
5733 100%
85 11,987 100%
178
Notes: aOther includes warehouse and storage, religious, service, vacant and “other”.
12

Part 4: Framework
Table 2: Cost & Savings Indices for Existing Commercial Sector [Source: EIA 2002 “1999 CBECS” Table C1, C2] Shaded cells are the top three sectors per index. Index Sector
Sector Energy Cost
[Billion $]
Energy Cost per floor area
[$/ft2]
Technical Cost Saving Potential
(30%)
[Billion $]
O&M Cost Savings potential
(10%)
[Billion $]
Source Energy Savings potential
(10%)
[Trillion Btu]
Education 8.0 0.93 2.4 0.8 117
Food Sales & Service
10.0 3.57 3.0 1.0 142
Health Care 5.6 1.93 1.7 0.6 98
Lodging 5.7 1.27 1.7 0.6 84
Office 17.8 1.48 5.3 1.8 264
Retail 13.0 1.26 3.9 1.3 178
Public 6.3 1.12 1.9 0.6 93
Othera 15.0 0.73 4.5 1.5 223
Total 82 1.21 25 8.2 1199
Notes: aOther includes warehouse and storage, religious, service, vacant and other.
13

Part 4: Framework
TABLE 3. Summary of Commercial Building O&M-Related Energy Savings Studies [Source: Hunt & Sullivan, 2002]
Estimated Savings [%]
Date of Study
Information Source* Notes
5 to 10 1986 Thompson, T. A. “Preventive Maintenance Saves Energy and Dollars,” Engineered Systems
Well-developed O&M program savings.
15.4
1992
Herzog, P., and L. LaVine, “Identification and Quantification of the Impact of Improper Operation…” ACEEE.
3-year study of seven office buildings to quantify improved operations potential.
15 to 30
1992
Piette, M. A. “Diagnostics for Building Commissioning and Operation.” LBNL.
Savings through improved operations and maintenance.
23
1994
Liu, M., et al., “Identifying and Implementing Improved Operation and Maintenance Measures…” ACEEE.
35-building and 104- school summary of energy cost savings from improved O&M.
15 to 25
1994
Szydlowski, R. F., et al., “No Maintenance - No Energy Efficiency.” PNNL.
Savings identified through O&M measure case studies.
5 to 15
1997
Gregerson, J. “Commissioning Existing Buildings.” E-Source.
44-building study of whole-building energy savings.
12
1997
Portland Energy Conservation Inc. (PECI). “What Can Commissioning Do for Your Building.”
175-building study of savings.
12 to 30
1998
Claridge, D., et al., “Implementation of Continuous Commissioning…”ACEEE.
Continuous commissioning savings range.
*See references for full citation.
14

Part 4: Framework
Table 4: End Use Indices (Site Energy) for Existing Commercial Sector [Source: EIA 1999 “1995 CBECS” Table 3] Shaded cells are the top three end uses for each sector
End Use(Site)
Sector
Space
Heating [Kbtu/ft2]
Cooling
[Kbtu/ft2]
Ventil-ation
[Kbtu/ft2]
Water
Heating
[Kbtu/ft2]
Lighting
[Kbtu/ft2]
Cooking
[Kbtu/ft2]
Refrig-eration
[Kbtu/ft2]
Office Equip-ment
[Kbtu/ft2]
Other
[Kbtu/ft2
Total Site
[Kbtu/ft2]
Education 33
42%
5
6%
2
2%
17
22%
16
20%
1
1%
1
1%
1
1%
3
4%
79
100%
Food Sales & Service
29
13%
16
7%
5
2%
18
8%
35
15%
36
16%
70
31%
2
1%
9
4%
229
100%
Health Care
55
23%
10
4%
7
3%
63
26%
39
16%
11
5%
5
2%
15
6%
34
14%
240
100%
Lodging 23
18%
8
6%
2
2%
51
40%
23
18%
7
6%
2
2%
4
3%
7
6%
127
100%
Office 24
25%
9
9%
5
5%
9
9%
28
29%
1
1%
0.4
1%
15
15%
5
5%
97
100%
Retail 31
41%
6
8%
3
4%
5
7%
23
30%
2
3%
1
1%
3
4%
4
5%
76
100%
Public 41
39%
6
6%
3
3%
20
19%
18
17%
2
2%
1
1%
4
4%
8
8%
105
100%
Othera 60
35%
9
5%
8
5%
15
9%
27
16%
-
-
1
1%
15
9%
36
21%
172
100%
Total 29
32%
6
7%
3
3%
14
15%
20
22%
4
4%
3
3%
6
7%
6
7%
90
100%
Notes: aOther does not include warehouse and storage, religious, service, and vacant.
15

Part 4: Framework
Table 5a. Commercial Real Estate Market Matrix [Source: Schick Consulting. 2002] An “X” identifies those assets that apply to a specific use.
BUILDING TYPE OWNER OCCUPIED
PRIVATELY OWNED /LEASED
INSTITUTION OWNED
/ADVISOR
INVESTOR OWNED
REIT Large office buildings X X X X Suburban offices X X X X Mixed use development X X X X Highrise multifamily X X X X Large retail malls X X X Strip malls X X Small office/retail X X Industrial office parks X X X X Warehouses X X X X Table 5b. Chains & Franchises Market Matrix [Source: Schick Consulting. 2002] An “X” identifies those assets that apply to a specific use.
BUILDING USE NATIONAL CHAINS
REGIONAL OR LOCAL CHAINS
FRANCHISES: SINGLE/MULTI
PLE
INDEPENDENT OWNER
Large retail stores X X Small retail stores X X X X Convenience stores X X X X Grocery stores X X X X Fast food restaurants X X X X Other restaurants X X X X Lodging X X X X Assisted living/ nursing homes
X X
Table 5c. Institutional Market Matrix [Source: Schick Consulting. 2002] An “X” identifies those assets that apply to a specific use. BUILDING TYPE /
USE
UNIVERSITIES & COLLEGES
K-12 SCHOOLS
FEDERAL GOVERN-
MENT
STATE / LOCAL
GOVERN-MENT
NON PROFITS
Large office buildings
X X X X
Small office buildings
X X X X X
Classrooms X X Large multiuse facilities
X X X X
Small multiuse facilities
X X X X X
Health care/ hospitals
X X
16

Part 5: R&D Projects
PART FIVE: Potential R&D Projects for the Existing Commercial Sector “The Guide is definitive. Reality is frequently inaccurate.” Douglas Adams, Hitchhikers Guide to the Galaxy The DOE planning team has not initially identified R&D projects for the existing commercial sector. Instead, we have relied on input from the stakeholder survey to identify priority R&D areas. The stakeholders were asked to respond to the following question: What do you think is the single most important R&D effort that DOE should support in this area? The responses have been grouped into the following four categories: 1. Diagnostic Tools, Benchmarking, O&M and Commissioning 1. Achieving demand and energy reduction
through commissioning and diagnostics. This has the largest potential impact because of the focus on existing buildings functioning optimally.
2. Automated diagnostic and
commissioning tools [hardware & software].
3. Continuous performance monitoring
systems. 4. Monitoring as a part of control system
upgrades is most important. This enables benchmarking, diagnostics, retro-commissioning, and owner decision making.
5. Building Commissioning -
documentation of energy savings and costs; protocols.
6. Economical diagnostics. 7. Documenting the costs and benefits of
commissioning. 8. Short to medium term payoff:
diagnostics for retro-commissioning and performance monitoring – “get buildings working, keep them working”.
9. Commissioning of existing buildings.
The frequency of poorly running buildings of all types is staggering. For very low-cost, low-risk the return is amazingly high. 15 - 30%!!
10. Reducing the “information burden”
associated with energy efficiency choices, strategies like standardized diagnostic tests and maybe even building some of this intelligence into self-diagnosing systems and components.
11. Performance enhancing technologies
that do not have large capital deployment costs, such as commissioning and operational procedures, software-oriented operational optimization methods.
12. Savings opportunities for O&M in
existing buildings. 13. Improving building performance, i.e.,
delivering lower energy bills (not just efficient technologies). Diagnostics and self-tuning technologies assure efficient equipment delivers savings over its expected lifetime. We don’t need new widgets, just more reliable building operations.
14. Automated Building Diagnostics related
to energy savings and maintaining indoor environmental quality.
17

Part 5: R&D Projects
2. Organizational & user behavior and decision making 1. DOE needs to substantially increase its
attention to societal, organizational, and behavioral issues including long term social trends which are likely to radically change the nature of the built environment, ownership patterns, decision-making and the way commercial buildings are used and managed in the next 20 years.
2. We need to understand the dynamics and
trends in commercial building markets. 3. DOE should consider research to
examine how the built environment, energy use and energy appliances influence health, productivity, and a host of other issues. Commercial building energy use is part of a larger energy using system that includes transportation, etc. Issues of land use and transportation also need to be considered in relation to commercial buildings.
4. The human dimensions aspects of
energy use systems. It is becoming clearer with time that we have highly efficient technologies already, and that the big gap right now is in the uptake of such technologies & also in the correct operation of such technologies. Human dimensions work can help us to understand the human part of the system better.
5. Productivity vs. environmental/physical
parameters 6. Personally, I think connecting energy
efficiency with other benefits like IEQ and affordability is important. Good retrofit practices can make a huge
contribution to adaptively reusing urban buildings.
7. Practices & results: How are our
technologies really working & how are buildings & energy used? Approach using statistical/survey measurements & other types of analyses (framing of the problem, market structure, etc.). Reassess efforts on the basis of these results. That is, basic research to characterize the “problem,” rather than to offer solutions to theoretical/convenient problems.
8. Understanding owner occupant behavior
and decision making. 9. DOE needs to identify key market
players that have influence over broad segments of the market. It needs to work with these players to identify complimentary interests that merge energy efficiency with commercial building industry needs and interests.
10. Characterization of the
renovation/retrofit market, by major building types (offices, hospitals, etc): who makes the decisions? Who are the major players? Who does most of the work? What are their motivations? How does the hospitality industry differ from hospitals and offices? Are design tools important or irrelevant?
11. I believe the characterization of building
stock and current practice in terms of energy systems and energy “features” is probably the single most important thing DOE can do. Once we have a better handle on what’s out there, then we can develop lots of targeted activities to change the situation.
12. Understanding how current and future
technologies work, and how WELL they
18

Part 5: R&D Projects
work, in real world settings against occupant needs and activities.
3. Technology R&D, New technology retrofit demonstrations 1. Reliable ways to upgrade lighting
systems, controls and daylighting. This has the largest energy savings potential, it’s climate independent, and it will have direct effects on productivity and user satisfaction.
2. Cost-effective energy and demand
feedback technology for homes and small businesses.
3. Improve the cost and performance of
photovoltaics.
4. Longer-term payoff: new technology (e.g., low energy cooling) suitable for retrofit.
5. Field demonstrations of system
adaptation strategies that achieve high savings in partnership with willing building trade groups or owners willing to put projects in place now.
6. Better HVAC. The country’s near-term
and most-pressing problems are going to be related to summer-peak demand for electricity. Air conditioning, including air-distribution systems, is the single largest contributor to summer peak loads. With respect to efficiency, HVAC significantly lags lighting in terms of design and implementation.
7. Better modeling tools for radiant heating
and cooling systems.
8. Further development of design and analysis software tools for HVAC design industry to use. These tools significantly enhance the ability of engineers to
predict the building performance benefits from retrofit measures and play a KEY role in justifying retrofit investments through life-cycle cost decision making.
9. Models for predicting the performance
of indoor spaces at the occupants’ actual locations: comfort, light, and indoor air quality. These would allow more comprehensive evaluation of costs/ benefits of building envelope/fenestration/HVAC choices.
10. Advanced sensors and controls applied
to decentralized HVAC systems such as GHP systems. Needed are low cost, very low power, durable, distributed sensor networks with wireless connectivity and bi-directional communications for data abstraction and control.
11. Fresh air ventilation and air movement
in complex buildings, leading to improved HVAC systems.
12. First understand the impacts of the
potential for energy savings, overall and by the various approaches that might be proposed both short term and long term.
13. Broad range GHP applications for
existing structures through the use of advanced wireless controls.
4. Market transformation & Environmental issues 1. How to get developed, but higher risk
technologies into the market. 2. Conversion to a hydrogen economy. 3. Emissions reduction calculations.
19

Part 5: R&D Projects
4. Please provide additional work on urban
heat island effects: the issues are so large that they are best addressed at the national level.
20

Part 6: Partners
PART SIX: Partners & Allies “With a little help from my friends.” John Lennon (1940 – 1980) As noted earlier in the Guide, DOE plans to identify partners and allies who are players in this sector. DOE has traditionally worked with a large number of players, including States, utilities, universities, industry and others on R&D projects. The stakeholder survey asked the following question: Who are appropriate partners for DOE Building Technology to work with in these R&D activities? The response from the stakeholder survey was as follows: [41] National Labs [25] Colleges & Universities [26] Industry organizations [25] Private industry [16] States [13] Utilities Other/Comments about partners: “At some level all of these groups must be involved.” “Owners / managers / investors.” “These three [industry organization, private industry, utilities] are most closely related to existing buildings, and so most likely to be able to effect changes.” “The public interest agenda is the key factor.” “Colleges and universities, because they can further the educational aspects of the research. National labs because the research is important and the time and specific
expertise is present. States because a more regional level is appropriate for building strategies. Industry and industry organizations tend to define which technologies and practices are followed, and utilities still have an interest in selling their product.” “DOE should partner more with building owners and property managers, both public and private, both to identify needs and to create market pull.” “Collaboratives like the Compressed Air Challenge.” “EPA” “Private research consortia have been delivering market-ready research results for ASERTTI and others. These include both for-profit research firms and non-profit groups.” “Cannot make any recommendations at this time because the topics are not identified. Any or all of these partners might be appropriate.” “Only a few people in higher education are appropriate. Utilities are mostly against this, but are useful to milk when they want to cooperate.” “End user organizations (e.g., non profits working in the sector).” “You should not focus on particular types of partners. Rather, create programs to which all can respond, to select the best potential partners.” “It is sad, but true, that most college graduates entering the construction industry have weak math and science backgrounds. This is related to the fact that the industry is perceived as low-tech and does not therefore attract the best technical minds. DOE could
21

Part 6: Partners
work on two fronts to address this issue, i.e., with universities to change the perception and with labs and industry to make actual changes.” “This is a multi-disciplinary activity better suited to partnerships between national labs and industry than universities (who have trouble even collaborating within departments let alone across disciplines). States and utilities that bring their own money would also be welcome.” “Networks need to be established among key players and methods for dissemination of information and knowledge need to be created using existing mechanisms.” “This depends wholly on what the nature of the work is.” “Private industry in terms of the building owners themselves, industry organizations like BOMA, and the Labs for their technical and "real-world" expertise. The other partners are really also appropriate as well, but I could only pick three.” “They are all important however, the national labs have concentrated brainpower, private industry is the key test for our success. Industrial organizations can be the needed conduit.”
22
Part 6: Partners
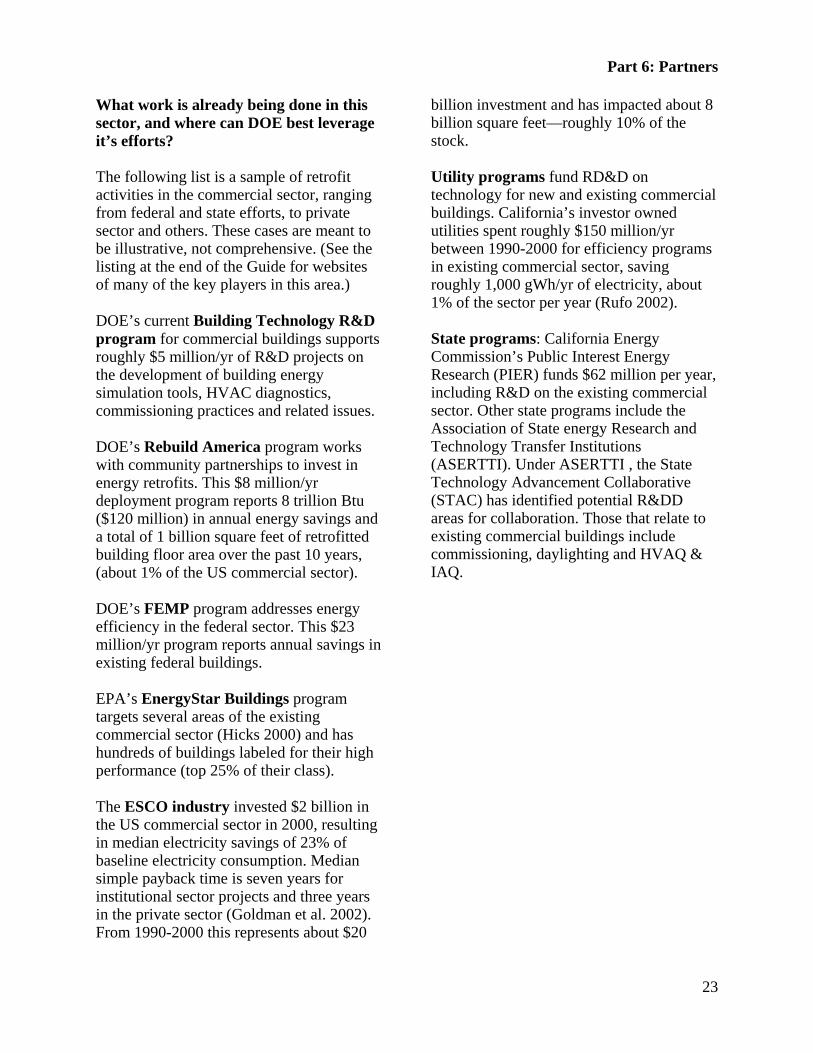
What work is already being done in this sector, and where can DOE best leverage it’s efforts? The following list is a sample of retrofit activities in the commercial sector, ranging from federal and state efforts, to private sector and others. These cases are meant to be illustrative, not comprehensive. (See the listing at the end of the Guide for websites of many of the key players in this area.) DOE’s current Building Technology R&D program for commercial buildings supports roughly $5 million/yr of R&D projects on the development of building energy simulation tools, HVAC diagnostics, commissioning practices and related issues. DOE’s Rebuild America program works with community partnerships to invest in energy retrofits. This $8 million/yr deployment program reports 8 trillion Btu ($120 million) in annual energy savings and a total of 1 billion square feet of retrofitted building floor area over the past 10 years, (about 1% of the US commercial sector). DOE’s FEMP program addresses energy efficiency in the federal sector. This $23 million/yr program reports annual savings in existing federal buildings. EPA’s EnergyStar Buildings program targets several areas of the existing commercial sector (Hicks 2000) and has hundreds of buildings labeled for their high performance (top 25% of their class). The ESCO industry invested $2 billion in the US commercial sector in 2000, resulting in median electricity savings of 23% of baseline electricity consumption. Median simple payback time is seven years for institutional sector projects and three years in the private sector (Goldman et al. 2002). From 1990-2000 this represents about $20
billion investment and has impacted about 8 billion square feet—roughly 10% of the stock. Utility programs fund RD&D on technology for new and existing commercial buildings. California’s investor owned utilities spent roughly $150 million/yr between 1990-2000 for efficiency programs in existing commercial sector, saving roughly 1,000 gWh/yr of electricity, about 1% of the sector per year (Rufo 2002). State programs: California Energy Commission’s Public Interest Energy Research (PIER) funds $62 million per year, including R&D on the existing commercial sector. Other state programs include the Association of State energy Research and Technology Transfer Institutions (ASERTTI). Under ASERTTI , the State Technology Advancement Collaborative (STAC) has identified potential R&DD areas for collaboration. Those that relate to existing commercial buildings include commissioning, daylighting and HVAQ & IAQ.
23

Part 7: Recommendations
PART SEVEN: Recommendations & Rationale for an R&D Program in Existing Commercial Buildings “I owe my success to having listened respectfully to the very best advice, and then going away and doing the exact opposite.” G. K. Chesterton (1874 - 1936) “Advice is what we ask for when we already know the answer but wish we didn't.” Erica Jong The following is a preliminary list of recommendations for creating an R&D program for existing commercial buildings. These recommendations have come from both the DOE team and the stakeholder survey: 1. Collect stakeholder input to help identify
priority R&D activities. 2. Use clear and consistent criteria for
project selection. 3. Maintain a portfolio that has a balance of
short-, medium-, and long-term R&D projects.
4. Identify a clear set of goals for the
program. 5. Conduct the basic analysis and
characterization tasks needed to understand and shape the R&D goals.
6. Evaluate the overall portfolio over time
to determine whether the correct priorities are being addressed and goals are being met.
7. Maintain some continuity of effort and
direction. It is particularly hard for partners, whether industry or States, to coordinate with DOE if the R&D priorities keep changing year-to-year.
8. Leverage impact by coordinating with
others in public and private sectors, e.g., Rationale for an DOE R&D Program in Existing Commercial Buildings A fundamental question is why DOE should support an activity in this area. The stakeholder survey asked the question: Why should DOE support this R&D activity? The responses were as follows: [26] Building owners & consumers aren’t aware of the benefits [21] No one else is doing the work [20] Industry won’t do high risk, long-term R&D Other/Comments about rationale for DOE support: “The problem is too large and the benefits too unappreciated for DOE not to be involved in efficiency research. Private industry will not do this without leadership by DOE and others.” “DOE has tended to approach R&D from a technology perspective. It needs to do much more to integrate societal and organizational perspectives into its thinking about R&D.” “This [lighting retrofit] has the largest energy savings potential, it’s climate independent, and it will have direct effects on productivity and user satisfaction. It doesn’t require long-term R&D, but there are industry-wide gaps in knowledge and application that need to be bridged.” “Monitoring results in significant performance improvements (you cannot manage what you cannot measure), but the
24

Part 7: Recommendations
benefits are difficult to quantify using conventional engineering methods.” “Because DOE should be a leader in the field and it should be sending signals that: 1. This is a key important part of energy efficiency; 2. That energy efficiency is a greater problem than just more & better widgets, and; 3. That it is willing to take a broad systems approach.” “The controls industry is abandoning R&D. There are new technologies becoming available that could fundamentally change the way buildings work. Controls don’t work well today.” “Local demonstrations do not get national attention; DOE sponsored technology demonstrations do get national attention and hence speed up the technology adoption rate “DOE has significant investments already in place with the DOE2 and EnergyPlus simulation engines. Only DOE can continue these efforts effectively. I suggest that DOE also should be in the business of developing interfaces to their engine to help the design community actually uses these tools effectively. Proper support and debugging of these complex tools is lacking at present.” “It’s a key barrier to implementation of commissioning, and it’s very difficult to do.” “Potential for building commissioning is unknown; utilities are under-funding this area.” “The US government and the DOE have supported energy-producers that cause environmental problems while reaping a profit. Contributing to environmental solutions is also an appropriate role for government.”
“A comprehensive program is required to produce both technology push and market pull.” “Several states are required to reduce emissions and buildings can play a major role in this.” Also, states are willing to pay up to $15, 000 per ton of NOx reduced.” “No one else has relationships with manufacturers and design community that would be needed to put together collaboratives and make these kinds of changes in how diagnostic services are provided and systems and components are designed.” “Largest single potential for savings in the commercial sector. Check out EUIs for new buildings vs. old buildings. Also, package vs. built-up systems. More complex equipment may be more efficient but is not performing very well. Check out www.newbuilding.org/PIER.” “It seems like you need to get to the heart of the decision makers in order to make changes to existing buildings. I have seen an embarrassing number of “Energy Audits” of the same buildings, without any implementation. It seems hard to get the money past the study phase, particularly when the owners have a “Simple Payback Period” mindset. What about life cycle costs and doing what is right? “So many problems would be solved with the conversion to a hydrogen society. It will happen, we need to make it happen sooner, not later, otherwise significant economic and social upheaval will result. The country needs to forge the political will to push this agenda forward.” “There are big opportunities in the buildings sector. I hope that you do increase your funding in this area. Be sure to complete demonstration projects as part of the
25
Part 7: Recommendations
program. Try to avoid licensing intellectual property to just one company - the more, the better - competition is good. Don’t overlook opportunities for improved productivity: a well-designed more-efficient building is a better work environment that a conventional building. Ranking the commercial-sector players in terms of importance (most important to least): (1) mechanical engineers, electrical engineers and architects; (2) manufacturers; (3) building owners; and (4) mechanical and electrical contractors.” “DOE should focus its resources on technologies that set the standard for large yet economic (pay-from-savings) energy use reductions in existing commercial buildings.” “DOE needs to help support and facilitate relationships with market players that would not otherwise occur.” “They are aware of it, sort of, but don’t realize the immediate payoffs of proper maintenance.” “The commercial sector could really benefit from something like the National Association of Home Builders and their extensive databases, but nothing like it exists in the fragmented commercial market.” “Industry won’t do the short term either. We are no longer in a crisis - regional or national. The government has an obligation to pursue this research and in term get the results implemented.”
26

References
REFERENCES Previous DOE Commercial Sector & related plans 1. Clough, D. 1996. “Commercial Buildings
Efficiency Program: Summary Program Plan,” Working draft, August 16, 1996, US DOE.
2. Myers, M. [Macdonald, ed.] 1995. “Notes
from the EBER Workshops, Atlanta, SF, DC.”
3. MacDonald, J. M., et al. 1986. “Commercial
Retrofit Research, Multi-Year Plan, FY 1986 - FY 1991,” ORNL report ORNL/CON-218.
4. US DOE, 1985. “Building Energy Research:
Multifamily Sector Multiyear Plan FY 1986-1991” prepared by LBNL, US DOE/CE-0142.
5. US White House. 2001. “National Energy
Policy,” report of the National Energy Policy Development Group. http://www.whitehouse.gov/energy/
Papers on Commercial Buildings R&D 1. Aitken, Donald. 1998. “Putting it together: Whole
Buildings and a Whole Buildings Policy,” Passive Solar Industries Council, Washington DC http://www.repp.org/repp_pubs/articles/aitken/aitken.html
2. Barwig, Floyd E., John M. House, Curtis J.
Klaassen, Morteza M. Ardehali, KN Toosi, Theodore F. Smith. 2002. “The National Building Controls Information Program,” In Proceedings of the ACEEE 2002 Summer Study on Energy Efficiency in Buildings, Washington, D.C.: American Council for an Energy Efficient Economy.
3. Blumstein, Carl and S. Wiel, 1998. “Public
Interest Research and Development in the Electric and Gas Utility Industries,” Utilities Policy, 7, 191.
4. Claridge, D. E., J. Haberl, M. Liu, J.
Houcek, and A. Athar. 1994. “Can You Achieve 150% of Predicted Retrofit Savings? Is it Time for Recommissioning?” In Proceedings of the ACEEE 1994 Summer Study on Energy Efficiency in Buildings, 5:73-88. Washington, D.C.: American Council for an Energy Efficient Economy.
5. Diamond, Rick and Mithra Moezzi, 2002.
“Becoming Allies: Combining Social Science and Technological Perspectives to Improve Energy Research and Policy Making,” In Proceedings, 2002 ACEEE Summer Study on Energy Efficiency in Buildings.
6. Dohrmann, Donald R., John H. Reed, Sylvia
Bender, Catherine Chappell, Pierre Landry. 2002. “Remodeling and Renovation of Nonresidential Buildings in California,” In Proceedings of the ACEEE 2002 Summer Study on Energy Efficiency in Buildings, Washington, D.C.: American Council for an Energy Efficient Economy.
7. Fisk, WJ, G. Brager, H. Burge, J.
Cummings, H. Levin, V. Loftness, M.J. Mendell, A. Persily, S. Taylor, J.S. Zhang. 2002. “Energy-related indoor environmental quality research: A priority agenda,” LBNL-50612. http://www.energy.ca.gov/pier/buildings/technical_papers/ASERTTI_IEQ.PDF
8. Gregerson, J. 1997. “Commissioning
Existing Buildings.” E-Source Tech Update, TU-97-3. E-Source, Inc., Boulder, CO.
9. Goldman CA, Osborn J, and Hopper N,
Singer TE, 2002. “Market Trends in the U.S. ESCO Industry: Results from the NAESCO Database Project” Lawrence Berkeley National Laboratory Report LBNL-49601 http://eetd.lbl.gov/ea/EMS/EMS_pubs.html
10. Golove, W.H. and Eto, J.H., 1996. Market
Barriers to Energy Efficiency: A Critical Reappraisal of the Rationale for Public Policies to Promote Energy Efficiency,
27

References
Lawrence Berkeley National Laboratory, Report No. LBL-38059.
11. Herzog, P. and L. LaVine. 1992.
“Identification and Quantification of the Impact of Improper Operation of Midsize Minnesota Office Buildings on Energy Use: A Seven Building Case Study.” In Proceedings of the ACEEE 1992 Summer Study on Energy Efficiency in Buildings. American Council for an Energy Efficient Economy, Washington, D.C.
12. Hicks, T. W., and B. von Neida. 2000. “An
Evaluation of America’s First ENERGY STAR® Buildings: The Class of 1999.” In Proceedings of the ACEEE 2000 Summer Study on Energy Efficiency in Buildings, 4:177-186. Washington, D.C.: American Council for an Energy Efficient Economy.
13. Huang, Y.J and E. Franconi. 1999.
“Commercial Heating and Cooling Loads Components Analysis,” Lawrence Berkeley National Laboratory Report, LBL-37208.
14. Hunt, W.D. and Sullivan G.P., 2002.
“Assessing the Potential for a FEMP Operations and Maintenance (O&M) Program to Improve Energy Efficiency. Pacific Northwest National Laboratory Report, PNNL-14076.
15. Liu, M., Houcek, J., et al. 1994. “Identifying
and Implementing Improved Operation and Maintenance Measures in Texas LoanSTAR Buildings.” In Proceedings of the ACEEE 1994 Summer Study on Energy Efficiency in Buildings. American Council for an Energy Efficient Economy, Washington, D.C.
16. National Research Council (NRC). 2001.
Energy Research at DOE: Was It Worth It? Energy Efficiency and Fossil Energy Research 1978 to 2000. Washington, D.C.: National Academy Press.
17. Nicholls, Andrew, Sean McDonald, John D.
Ryan, 2002. “Estimating the Benefits from Buildings Technologies: Issues, Challenges, and Lessons Learned from Blue Ribbon Panel Reviews,” In Proceedings of the
ACEEE 2002 Summer Study on Energy Efficiency in Buildings, Washington, D.C.: American Council for an Energy Efficient Economy.
18. Nilsson, Hans and Clas-Otto Wene, 2002.
“Best Practices in Technology Deployment Policies,” In Proceedings, 2002 ACEEE Summer Study on Energy Efficiency in Buildings.
19. Piette, M. A. 1992. Diagnostics for Building
Commissioning and Operation. Prepared for the California Institute for Energy Efficiency (CIEE) by Lawrence Berkeley National Laboratory, Berkeley, CA.
20. Portland Energy Conservation, Inc. (PECI),
1997. What Can Commissioning Do for Your Building. Portland, OR.
21. Reed, J. H., Dohrmann, D.R., Bender, S.,
Landry, P., and Chappell, C., 2002. “Market Segments in the Commercial Remodeling and Renovation Sector,” In Proceedings, 2002 ACEEE Summer Study on Energy Efficiency in Buildings.
22. Roth, K.W., D. Westphalen, J. Dieckmann,
S.D. Hamilton, and W. Goetzler. 2002. “Commercial building energy use—Volume III: Energy savings potential”. Cambridge, MA, Arthur D. Little for U.S. Department of Energy, Office of Building Technologies. Available as PDF from http://www.eren.doe.gov/buildings/documents/pdfs/hvacvolume3finalreport.pdf
23. Rufo, Mike and Fred Coito. 2002.
“California Statewide commercial sector energy efficiency potential study,” Pacific Gas & Electric Company, PG&E Report: Study ID #SW039A Volume 1&2. San Francisco, California. www.calmac.org/publications/CA_EEPotV1.pdfhttp://www.calmac.org/publications/CA_EEPotV2.pdf
24. Schick Consulting. 2002. “Target Market Priorities,”
Report done for the Northwest Energy Alliance http://www.nwalliance.org/resources/reports/104.pdf
28
References
25. Smith, Sandy, editor, 2002. “Decision-Making for Energy Efficiency in the Existing Commercial Building Sector,” Presentations from the ACEEE workshop on-line at http://www.aceee.org/human/index.htm
26. Szydlowski, R. F. 1994. “No Maintenance –
No Energy Efficiency.” In Proceedings of the 1994 World Energy Engineering Congress. Association of Energy Engineers, Atlanta, GA.
27. Thompson, T. A. 1986. “Preventive
Maintenance Saves Energy and Dollars,” Engineered Systems, July/August.
28. Westphalen, Detlef and Scott Koszalinski.
2001. “Energy Consumption Characteristics of Commercial Building HVAC Systems, Volume I: Chillers, Refrigerant Compressors, and Heating Systems,” Arthur D. Little, Inc. Cambridge, MA Arthur D. Little Reference No. 36922-00
29. Westphalen, Detlef and Scott Koszalinski.
1999. “Energy Consumption Characteristics of Commercial Building HVAC Systems, Volume II: Thermal Distribution, Auxiliary Equipment, and Ventilation,” Arthur D. Little, Inc. Cambridge, MA Arthur D. Little Reference No. 33745-00
30. US EPA, 2002. “Climate Action Report 2002”
Appendix B: Policies and Measures http://www.epa.gov/globalwarming/publications/car/appB.pdf
29

References
WEBSITES OF ORGANIZATIONS ACTIVE IN RD&D FOR EXISTING COMMERCIAL BUILDINGS [partial listing]
Federal Agencies US DOE
Overview of the existing commercial sector from the EIA/CBECS database http://www.eia.doe.gov/emeu/cbecs/contents.html The high performance commercial building demonstration projects http://www.eren.doe.gov/buildings/highperformance/ The Roadmap for High Performance Commercial Buildings http://www.eren.doe.gov/buildings/commercial_roadmap/ Rebuild America for existing commercial buildings http://www.rebuild.org/ Federal Energy Management Program for new and existing Federal facilities http://www.eren.doe.gov/femp/
US EPA
Energy Star buildings http://www.energystar.gov Energy Star for Businesses http://yosemite1.epa.gov/estar/business.nsf/webmenus/Business Energy Star for Small Commercial Buildings http://www.epa.gov/smallbiz/ Energy Star New Commercial Building Design process http://yosemite1.epa.gov/Estar/business.nsf/content/nbd_designprocess.htm
States Association of State Energy Research and Technology Transfer Institutions (ASERTTI) http://www.asertti.org
California California Energy Commission, Public Interest Energy Research, Commercial Buildings http://www.energy.ca.gov/pier/buildings/commercial.html
Florida
Florida Solar Energy Center, Buildings Program http://www.fsec.ucf.edu/bldg/index.htm
Iowa Iowa Energy Center, Commercial Buildings Program http://www.energy.iastate.edu/efficiency/commercial/studylist/index.htm
New York
NYSERDA, Commercial Buildings Program http://www.nyserda.org/buildng.html
Washington & Oregon Northwest Energy Efficiency Alliance http://www.nwalliance.org/projects/commercial.asp
Non-profits National Association of Energy Service Companies http://www.naesco.org New Buildings Institute http://www.newbuildings.org Portland Energy Conservation, Inc. http://www.peci.org Rocky Mountain Institute, Commercial Buildings http://www.rmi.org/sitepages/pid119.php US Green Buildings Council http://www.usgbc.org
For Profits
Architectural Energy Corporation http://www.archenergy.com
30

References
Eley & Associates http://www.eley.com/ Johnson Controls http://www.jci.com/ SBW Consulting http://www.sbwconsulting.com/ Taylor Engineering http://www.taylor-engineering.com Xenergy http://www.xenergy.com
National Labs LBNL, Commercial Systems Group http://eetd.lbl.gov/btp/abs/index.html NIST, Building Environment Division http://www.bfrl.nist.gov/863/bed.html NREL, High Performance Buildings http://www.nrel.gov/buildings_thermal/buildings.html#commercial ORNL, Building Technology Center http://www.ornl.gov/btc/programs.htm PNNL, Buildings Program http://www.pnl.gov/buildings/
Universities Carnegie Mellon, Center for Building Performance & Diagnostics http://www.arc.cmu.edu/cbpd/ MIT, Building Technology Research http://architecture.mit.edu/research/bt/resindex.html Purdue, Herrick Laboratories http://www.ecn.purdue.edu/Herrick/Research/ Texas A&M University, Energy Systems Laboratory http://www-esl.tamu.edu/ University of California Berkeley, Center for the Built Environment
http://www.cbe.berkeley.edu/
31


Appendix A
Appendix A: Individuals and Organizations who contributed to the Multiyear R&D Plan for Existing Commercial Buildings Two workshops were held in March 2003 to create the Multiyear R&D Plan for Existing Commercial Buildings. The following individuals participated in one of the two workshops: Gregg D. Ander, Southern California Edison Douglas Baston, Northeast by Northwest Carl J Blumstein, University of California Berkeley Mike Brambley, Pacific Northwest National Laboratory Martha Brook, California Energy Commission Karl Brown, University of California, Jim Brodrick, U S Department of Energy Natascha Castro, NIST Rick Diamond, Lawrence Berkeley National Laboratory Rob Everhart, Aspen Systems David Hansen, U S Department of Energy Phil Haves, Lawrence Berkeley National Laboratory Jeffrey P. Harris, Lawrence Berkeley National Laboratory Brad Hollomon, Pacific Northwest National Laboratory John House, Iowa Energy Center
Patrick Hughes, Oak Ridge National Laboratory Mark Hydeman, Taylor Engineering Nancy Jenkins, California Energy Commission Marty Johnson, U S Department of Energy Betsy Krieg, Pacific Gas & Electric Company Satish Kumar, Lawrence Berkeley National Laboratory Mingsheng Liu, University of Nebraska Mike MacDonald, Oak Ridge National Laboratory Sean McDonald, Pacific Northwest National Laboratory Mithra Moezzi, Lawrence Berkeley National Laboratory Cyrus Nasseri, U S Department of Energy Andrew Nicholls, Pacific Northwest National Laboratory Mary Ann Piette, Lawrence Berkeley National Laboratory John Reed, Innovology John Ryan, U S Department of Energy
A-1

Appendix A
Tim Salsbury, Johnson Controls Inc. Tony Schaffhauser, National Renewable Energy Laboratory Sandy Smith, American Council for an Energy-Efficient Economy Fred Smothers, F. Smothers & Associates
Dan Sze, U S Department of Energy Martin Weiland, ASHRAE Gren Yuill, University of Nebraska
A-2

Appendix B
PLAN ExCo: A 5-Year R&D Plan for Existing Commercial Buildings Development of a multiyear R&D plan for existing commercial buildings Following the development of the R&D Guide for Existing Commercial Buildings, which identified the vision, goals, partners, criteria and framework, the planning team held two all-day workshops, one in Washington DC and the other in San Francisco in March 2003. These workshops included a wide cross section of stakeholder from industry, academia, government and elsewhere to develop a multiyear R&D plan. The results of these two workshops were combined into the following draft five-year R&D plan for existing commercial buildings.
B-1

Appendix B
Goal of the Existing Commercial Buildings Program: DOE’s Building Technologies Program has set ambitious goals for the next generation of residential and commercial buildings by 2025: these new buildings will have net zero impact on nonrenewable energy resources. The goal for the Existing Commercial Buildings Program is to develop and demonstrate energy-efficient retrofit strategies that are 20% more efficient than existing commercial buildings for 5 different market segments by 2009 and 30% more energy efficient for 3 market segments by 2012 (Table B-1).
Table B-1: Goals, Market Sectors, Opportunities, Enabling Research and Potential Energy Savings for the Existing Commercial Buildings Sector.
Goals Market
Sector
Floor Area [Mft2]
Energy cost [$B]
Retrofit/O&M Opportunities
Enabling Research Sector Savings Potential (source energy)
[quads/yr]
Small Commercial
4,766 7.0
Lighting, controls Sector & market characterization; benchmarking; simple O&M toolkit; lighting guide
.180
Large Retail 5,631
6.0
Lighting, daylighting, Tune-ups, HVAC upgrades, controls
Sector & market characterization; benchmarking; advanced O&M toolkit; HVAC controls
.180
Large Multifamily
4,521 5.7
Lighting, tune-ups, HVAC
Sector & market characterization; benchmarking; simple O&M toolkit; lighting & appliance guide
.168
Public (federal, state &
municipal) 5561 6.3
Lighting, daylighting, Tune-ups, HVAC upgrades, controls
Sector & market characterization; benchmarking; simple and advanced O&M toolkit; lighting and daylighting guide
.186
Demonstrate 20 % greater energy efficiency than existing stock in 5 market sectors by 2009
Other (tbd) Schools 8,651
8.0
Lighting, daylighting, tune-ups, HVAC, controls. Retro -CX
Sector & market characterization; benchmarking; information management, simple and advanced O&M toolkit; lighting & daylighting guide
.351
Large Office 12,044
17.8
Lighting, daylighting, tune-ups, HVAC, controls. Retro -CX
Sector & market characterization; benchmarking; advanced O&M toolkit; automated diagnostics
.792
Demonstrate 30 % greater energy efficiency than existing stock in 3 market sectors by 2012 Other (tbd) Total annual savings
1.86
B-2
Appendix B
Background on the Existing Commercial Sector: The existing commercial sector consists of 4.6 million buildings, representing floorspace of over 67 billion square feet. The sector include educational facilities (schools, colleges & universities); food sales (markets) and food service (restaurants); health care facilities (hospitals & clinics); lodging (hotels, dormitories); retail; offices; public assembly; religious worship; service; warehouse and storage; and other non-residential facilities.
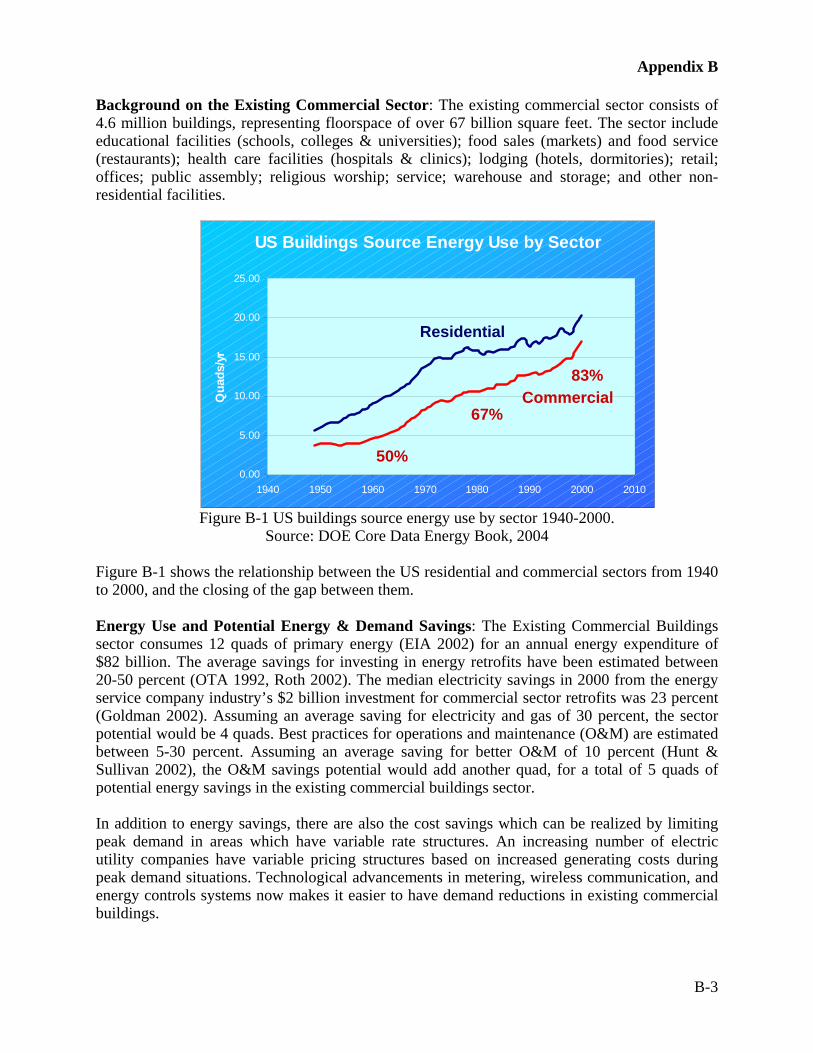
Figure B-1 US buildings source energy use by sector 1940-2000. Source: DOE Core Data Energy Book, 2004
Figure B-1 shows the relationship between the US residential and commercial sectors from 1940 to 2000, and the closing of the gap between them. Energy Use and Potential Energy & Demand Savings: The Existing Commercial Buildings sector consumes 12 quads of primary energy (EIA 2002) for an annual energy expenditure of $82 billion. The average savings for investing in energy retrofits have been estimated between 20-50 percent (OTA 1992, Roth 2002). The median electricity savings in 2000 from the energy service company industry’s $2 billion investment for commercial sector retrofits was 23 percent (Goldman 2002). Assuming an average saving for electricity and gas of 30 percent, the sector potential would be 4 quads. Best practices for operations and maintenance (O&M) are estimated between 5-30 percent. Assuming an average saving for better O&M of 10 percent (Hunt & Sullivan 2002), the O&M savings potential would add another quad, for a total of 5 quads of potential energy savings in the existing commercial buildings sector.
US Buildings Source Energy Use by Sector
0.00
5.00
10.00
15.00
20.00
25.00
1940 1950 1960 1970 1980 1990 2000 2010
Qua
ds/y
r
83%
67%
50%
Residential
Commercial
In addition to energy savings, there are also the cost savings which can be realized by limiting peak demand in areas which have variable rate structures. An increasing number of electric utility companies have variable pricing structures based on increased generating costs during peak demand situations. Technological advancements in metering, wireless communication, and energy controls systems now makes it easier to have demand reductions in existing commercial buildings.
B-3

Appendix B
Challenge of the Existing Commercial Building Sector. While new buildings can more easily benefit from new and improved technologies, as well as better methods of design and construction, existing buildings face different challenges. Not only are there the numerous technical challenges to renovating and retrofitting an existing commercial building, but there are significant institutional barriers to motivate building owners and managers to change how they operate and maintain their buildings. Throughout this plan is the underlying assumption that existing buildings have unique characteristics that make them different from new buildings. Even where the development and application of a new technology for a new building seems to offer a parallel opportunity for existing building retrofit, there is often a different challenge in integrating the technology in an existing building. Partners: This plan was developed with input from over 50 individuals and organizations active in the existing commercial buildings sector (see Appendix A for a list of contributors). DOE plans to collaborate with several of these and other organizations to meet its goals. Several states are currently supporting R&D for existing commercial buildings and this effort will be closely coordinated with these activities, for maximum leveraging of DOE funds and widespread implementation. Other partners are identified under the specific elements of the plan below.
B-4

Appendix B
Structure of the Overall R&D Plan An R&D plan for improving the energy performance of existing buildings can be compared to a medical model:
=
Medical Model
What are the elements necessary to achieve a healthy
population?
Building Model
What are the elements necessary to achieve a healthy
building stock? The “Medical Model” has four key elements as shown in Figure B-2.
1. Assessment (Triage)
2. Diagnosis (Tools)
3. Prescription (Remedies)
Healthy Population
4. Follow-up (Tests)
Figure B-2. A medical model for a healthy population.
The model for achieving a healthy building stock is similar. By “healthy” we include such characteristics as “energy efficient” “comfortable” “low maintenance”, etc. The characteristics of the Building Model looks are shown in Figure B-3.
1. Assessment (Triage)
2. Diagnosis (Tools)
3. Prescription (Remedies)
Healthy Buildings
4. Follow-up (Tests)
• Stock Characterization • Benchmarking • New technologies • Evaluation • Market characterization • Performance tools • Retrofit packages • Measurement • Organizational behavior • Simplified tools • Case studies • Standards • User needs • Automated tools • Training • Guidelines
Figure B-3. An R&D model for a “healthy” existing building stock.
Following this model, the proposed R&D Plan for Existing Commercial Buildings has four basic
B-5

Appendix B
elements: Element 1. Assessment: Market Characterization & Transformation
This element provides the data and analysis to establish the R&D activities and the overall framework for the deployment and market transformation activities.
Element 2. Diagnosis: Benchmarking, Diagnostics Tools, Commissioning, and O&M
This element provides the tools and knowledge base to identify energy saving opportunities and the means to achieve them.
Element 3. Remedies: Technology Development & Systems Integration. This element provides the individual technologies for retrofits and renovations as well as the protocols for measuring and analyzing building performance.
Element 4: Follow-up: Testing and Evaluation
This element covers the programmatic needs to analyze and evaluate whether the program is meeting its goals, and if not, what corrective steps need to be taken.
For each Element the plan identifies 3-5 individual Projects, including crosscutting projects. For each Project there are specific goals, descriptions, activities, outcomes and partners. The Activities are listed as short-term (1-2 years), medium-term (3-5 years) and in some cases, longer-term (10+ years). In addition to the descriptive text, each activity has a preliminary ranking, based on criteria described in each section. Energy impacts. The rankings are accompanied in some cases by estimates of potential energy savings. Energy savings can be defined in several ways: “Engineering savings” is the estimate of the theoretical savings for a given activity if adopted and working as intended. It is based on the physical characteristics of the strategy. “Adoption savings” is the estimate if the retrofit or strategy is adopted and works as intended. It depends on the likelihood of a given strategy being adopted. “Actual savings” is the estimate for a given strategy based on its technical potential, adoption and actual operation, which depends on all the above factors plus the operations and maintenance of the strategy. “Program savings” is the estimate attributable to the program. These savings are estimated in the absence of other activity. Because the analysis of energy savings is based on so many factors, most of which are unknown for the existing commercial sector, the rankings are based on the judgments of the industry groups, and not on explicit calculations. As more information is gained as a result of this program, the priorities for R&D should be revisited. Project Rankings.
B-6

Appendix B
Table B-2 shows a summary of the preliminary project rankings and estimates of the potential engineering energy savings.
Table B-2. Summary of Program Rankings
Project Ranking Energy Savings Potential
1. Markets, Orgs and Users 1a: Market characterization & analysis High n.a. 1b: Organizational behavior High n.a. 1c: User needs & behavior Medium high n.a. 1d: Crosscutting required n.a. 2. Benchmarking, Cx, Dx & O&M 2a: Benchmarking for Cx and O&M Medium high Medium 2b: Performance monitoring tools High High 2c: Simplified automated tools High High 2d: Fully Automated diagnostics Medium high Medium High 2e: Crosscutting required n.a. 3. Technology & Systems 3a: Detailed real building performance High n.a. 3b: Daylighting retrofits Medium high Medium 3c: Ventilation retrofits Medium high Medium 3d: Thermal distribution retrofits Medium high High 3e: Heating & cooling retrofits Medium High 3f: Lighting retrofits Medium High 3g: Crosscutting required n.a. 4. Follow-up 4a. Measurement & Evaluation Required n.a.
The project rankings do not always follow the energy savings potential due to other criteria that was applied by the group. In some cases there may be a large energy savings potential, e.g., Lighting retrofits”, but the DOE role was considered less needed.
B-7

Appendix B
Detailed Project Descriptions Element 1: Market Characterization & Transformation Scope and audience: Element 1 encompasses the R&D activities needed to characterize the existing commercial building sector and to understand the impact of organizations and individuals on technology development, adoption and performance. The scope of the work includes both short-term data collection and analysis, as well as longer-term R&D on technology adoption and implementation. The audience for the outcomes includes DOE policy and program managers, building owners and managers, commissioning agents, energy practitioners, utility program managers and energy researchers. Project 1a. Market characterization and trends and forces impacting energy use Goals: Understand the sector and market characterization to better direct the R&D effort. Identify the target sectors and market players as well as the demographic trends and market forces that can be tapped to further energy retrofits, retro-commissioning and operations and maintenance. Description: A characterization of the existing commercial sector, detailing the building types and systems, energy uses, current retrofit activity and R&D work. Activities for Years 1-2:
Activity 1: Stock Characterization. Characterize the stock by major building types (offices, hospitals, restaurants, convenience stores, “big box” retail, etc.). Identify the major building systems, e.g., Lighting, HVAC, and describe the types of controls and operators for the different building sub-sectors. Based on funding availability, start with a few sectors and characterize new sectors each year. Activity 2: Energy Analysis. Disaggregate, where possible, the energy consumption patterns, by building types, regions and end uses. Collaborate with EIA on CBECS and other data sources. Determine energy savings potential for different sub-sectors. Activity 3: Market Analysis. Identify the major players and market trends (e.g., demographics, allocation of resources) and analyze the energy intervention opportunities that these suggest. Look at new models and patterns of work. Review new business models for differentiating market segments and how they impact energy. Describe the current types and level of rehab and retrofit activity and determine potential for replicability and market penetration.
Activities for Years 3-5:
B-8

Appendix B
Activity 4: Continue sector characterization until all sectors have been analyzed. Review new technologies and strategies for new construction and see which are appropriate for retrofit in existing buildings.
Activity 5: Understand the implications of new information on the existing commercial sector and its impact on energy use. Look at trends related to:
6. Centralized vs. decentralized control systems 7. Outsourcing of energy & adoption of renewables 8. Buildings as part of community scale energy systems, e.g., look at transportation
issues, heat-island effects, etc.
Activity 6: Use the understanding of markets, trends and forces to refine or readjust the R&D and marketing activities.
Outcomes for Project 1a include reports on the detailed characterization of the sector, stock, players, and energy saving potential and related planning and policy issues. Partners for Project 1a include states, EPA, BOMA, ASHRAE, ACEEE, DOE/EIA, and others interested in developing R&D plans for existing commercial buildings. Rationale & Criteria The activities described in this task are fundamental for the program. They help identify the targets of opportunity, the likely adopters and the overall impacts. The tasks themselves do not lead to quantifiable energy savings, but provide the base knowledge on which such analyses can be performed. Similar work has been done for specific regions and building types (e.g., Schick 2002), but there is little national characterization of the retrofit opportunities, with the exception of the ten-year old OTA study (US Congress 1992) This work could be done incrementally, e.g., by building type, market sector, region, etc. Some level of overall analysis is required initially, but the remaining characterization could be done over several years. FY: Year 1 Year 2 Year 3 Year 4 Year 5Funding: $100-200k $100-200k $50-150k $100-300k $50-250k Ranking: High
B-9

Appendix B
Project 1b. Organizational Behavior & Decision Making Goals: Use knowledge of organizational behavior and decision making to shape policy and market transformation efforts. Description: A characterization and better understanding of the market players in the existing commercial buildings sector. Activities for Years 1-2:
Activity 1: Study how energy technologies get developed, selected, implemented and how they really work. Use statistical and survey measurements and other types of analyses (framing of the problem, market structure, etc.). Reassess R&D efforts on the basis of these results. Conduct the basic research to characterize the “problem,” rather than to offer solutions to theoretical and/or convenient problems. Activity 2: Develop case studies of the impacts of organizational decision making on energy performance. Document how behavioral and organizational norms impact energy decisions. Activity 3: Identify the roles and actions of key players that have influence over broad segments of the market.
Activity 4: Review the literature (published and “gray”) and identify the current values, drivers and problems for key organizations and subsectors, e.g., schools, hospitals, chains, franchises, etc.
Activity 5: Identify the unique characteristics of market sectors and actors that effect decisions impacting energy use, e.g., access to capital (bond, REIT), regulatory issues, access to information.
Activities for Years 3-5:
Activity 6: Use basic knowledge and case studies to promote organizational changes, through federal partners and building management companies.
Activity 7: Work with these players to identify complementary interests that merge energy efficiency with commercial building industry needs and interests.
Activity 8: Identify specific business models, e.g., how do small retail owners and managers interact with controls distributors?
Outcomes for Project 1b include reports on the impacts of organizational behavior on decisions that effect energy use, including identifying key players, trends, motivations and insights that will lead to market transformations.
B-10

Appendix B
Partners for Project 1b include states, EPA, BOMA, ASHRAE, ACEEE, and others interested in pursuing market transformation activities for existing commercial buildings. Rationale & Criteria The activities described in this task are often viewed as “deployment” and “tech transfer”. This is not the case—these are R&D tasks on how to do effective deployment and tech transfer, and such work is rarely done with the rigor that R&D requires. Again, the tasks themselves do not lead to quantifiable energy savings, but provide the basis that allows the energy savings to be achieved. In theory, one could estimate that an improved understanding of market actors would increase an adoption rate for a particular technology by, e.g., 10-20%, but these analyses would have to be done for specific cases. Similar work has been done for specific regions and building types (e.g., Rufo 2002), but there is little national characterization of the market opportunities. The most extensive study of market structure and energy efficiency in new commercial buildings (Lutzenhiser et al. 2001) concludes that they have only “scratched the surface” when it comes to understanding these issues—and they focused on new commercial buildings. DOE’s role should be to identify a few market players, e.g., easy-to-influence markets with a few actors (big-box retail) or underserved markets which are not receptive to energy messages (small retail), and/or players where there is a federal mandate to serve, e.g., low-income renters in large multifamily housing, and decide which criteria are highest priority for proceeding. The critical point here is not that more deployment is needed, but that we needed better understanding of how to do deployment effectively in key market segments. FY: Year 1 Year 2 Year 3 Year 4 Year 5Funding: $100-300k $125-450k $150-550k $200-600k $300-600k Ranking: High, Medium High
B-11

Appendix B
Project 1c. User issues: comfort, health & productivity Goals: Understand the context of energy use from a user perspective. Identify the relevant issues such as comfort, productivity, health, etc., which link user needs to energy use. Focus on user issues to advance technology adoption and acceptance. Description: A characterization of individual users of the existing commercial sector. Activities for Years 1-2:
Activity 1: Study the impact of environmental factors (e.g., thermal, light, and acoustic) on worker performance. Identify how people adapt and cope with building performance deficiencies and their impact on energy use. Document how people change their environments and how it differs from design intent. Review BOMA data on complaints and changes to the workplaces. Identify reasons for IAQ complaints. Activity 2: Observe how people interact with controls, e.g., manual vs. automatic. Test if people have wider acceptance of environmental conditions with local controls. Understand impact of real-time pricing on user behavior and satisfaction.
Activity 3: Develop and define metrics of worker productivity for different market sectors.
Activities for Years 3-5:
Activity 4: Use understanding of user behavior to design new control and technology interfaces. Activity 5: Pilot test the new technologies and evaluate the results.
Activities for Years 5-10:
Activity 6: Work with industry to package human factor studies into recommendations for product and building design. Activity 7: Work with industrial partners to bring new technologies to the market.
Outcomes for Project 1c include reports on the impacts of indoor environmental factors on occupant health, comfort, productivity and energy use. Partners for Project 1c include universities, states, EPA, BOMA, ASHRAE and others interested in pursuing market transformation activities for existing commercial buildings. Rationale & Criteria Ultimately, people don’t care about energy, but the quality of the work environment that energy supports. From a business perspective, the key questions are about the health, comfort and
B-12

Appendix B
productivity of the worker. Understanding the connections between these outcomes, the environmental conditions that affect them, and the energy that is used is a vast undertaking. These tasks can be evaluated to show specific energy savings. For example, improved daylighting can be studied to show impact on worker health and productivity and lower energy costs. Very few studies of these kind have been conducted (e.g., Heschong 2001), and often these studies raise more questions then they answer. There is a need for large, multiyear studies that can carefully evaluate the questions being asked. DOE’s role could be initiate a few studies in this area, perhaps with international collaborators since much of this work has been underway in Canada and Scandinavia. FY: Year 1 Year 2 Year 3 Year 4 Year 5Funding: $100-500k $150-550k $250-750k $250-750k $250-700k Ranking: Medium High [ranked lower because while it is important work, it is broader than DOE’s core mission]
B-13

Appendix B
Project 1d. Crosscutting Issues Goals: To coordinate the issues that are important across the program elements and outside the program. Examples include activities that overlap with other DOE programs in emerging technologies, FEMP, Rebuild America, Energy Star, and state and local programs. Description: The crosscutting overview needed to identify R&D activities and to plan their transfer to markets. Activities for Years 1-2:
Activity 1: Identify crosscutting issues and players and coordinate activity and information sharing.
Activity 2: Review the wealth of unpublished, or “gray” literature on the energy retrofit activity underway in commercial buildings. Practitioners have great knowledge of this subject, but don’t always write it up for others. Review trade journals, workshops and other means for collecting this information.
Activities for Years 3-5:
Activity 3: Continued identification of crosscutting issues and players and coordination of activity and information sharing.
Outcomes for Project 1d include reports on the coordination and integration of the overall planning activity. Partners for Project 1d include universities, states, EPA, BOMA, ASHRAE and others interested in R&D planning for existing commercial buildings. Rationale & Criteria The activities described in this task are programmatically necessary for the effective management of the overall R&D activity. FY: Year 1 Year 2 Year 3 Year 4 Year 5Funding: $50-100k $50-100k $50-100k $50-100k $50-100k Ranking: [Required]
B-14

Appendix B
Element 2: Benchmarking, Diagnostic Tools, (Retro) Commissioning, & O&M Scope and audience: Element 2 encompasses the R&D activities needed to improve diagnostics, benchmarks, commissioning and operations and maintenance of existing commercial buildings. Improved operations and maintenance are estimated to save between 5-30% of the energy used in existing commercial buildings (Hunt & Sullivan, 2002). The scope of the work is both short-term development of tools and protocols, as well as longer-term adoption and implementation. The audience for the outcomes includes building managers, commissioning agents, energy practitioners, utility program managers and energy researchers. Project 2a: Reliable and simple benchmarking tools to identify retrofit, commissioning needs and O&M opportunities. Goals: To develop reliable and simple benchmarking tools that will enable a building manager to diagnose and assess the energy performance of their building(s) and identify opportunities for energy savings. Building Types: All. Initial focus on offices, schools/universities and hospitals. Description: There is a need for simple energy benchmarks for several building types that can be easily used by building owners and managers. These comparison tools will allow building managers to identify problem areas and places for significant energy savings. Existing benchmarking tools include whole building tools for offices and in some regions of the country, schools. The need here is for both whole building benchmarks by type, e.g., large office, small commercial, school/university (classroom, lab and office) as well as sub-system benchmarks, e.g., lighting HVAC and plug loads. Activities for Years 1-2:
Activity 1: Work with ASERTTI, FEMP and local system benefit programs to obtain existing metered data and format this into a common database of baseline and retrofit performance. Develop the software tools to allow a user to compare their building with comparable buildings in the database.
Activity 2: Document case studies against actual data in the database (differentiated from CBECS). The case studies will show more detail than the benchmarking, and will be used to illustrate specific retrofits for specific building types.
Activities for Years 3-5:
Activity 3: Disseminate case study results back through ASSERTI, FEMP, NAESCo, and others, and evaluate performance.
Outcomes for Project 2a include the benchmarking tools and case studies needed to show the use of benchmarking as an important energy management strategy.
B-15

Appendix B
Partners for Project 2a include universities, labs, states, EPA, BOMA, NAESCo, ASHRAE and others interested in benchmarking for existing commercial buildings. Rationale & Criteria The activities in this Project specify the energy targets for different building types. Estimates of energy savings can be validated by comparison to baseline and retrofit databases. Case studies illustrate the specific examples, but the benchmark values are often more critical for building managers to make the case for investment. Energy savings based on benchmarking and retrofit identification could range from 5-10% of a buildings energy use, which sector wide represent .05-1 quads of energy savings. FY: Year 1 Year 2 Year 3 Year 4 Year 5Funding: $200-700k $350-850k $400-950k $400-950k $550-950k Ranking: Medium High [Based on energy savings potential and ease of adoption.]
B-16

Appendix B
Project 2b: Performance Monitoring Tools Goals: To develop the data infrastructure, e.g., sensors, data acquisition, and archives for retrieval to allow for monitoring building performance, both for retro-commissioning and performance monitoring. Building Types: All. Initial focus on owner-occupied office buildings and universities. Description: Current EMCS have the potential for collecting and presenting useful data on building operations, but are often limited by insufficient data points (sensors) as well as data storage and retrieval possibilities. There is a need for improved data infrastructure for building owners and managers to be able to monitor their buildings and identify problems in real time. These improved data acquisition and management tools will allow building managers to identify and correct problems, resulting in improved comfort and for significant energy savings. Activities for Years 1-2:
Activity 1: Identify projects where successful retro-commissioning activities are currently taking place. Document what works today—what information is needed and how is it best presented. Identify key faults, e.g., are buildings over ventilated? Pool and analyze data to see what works best. Activity 2: Develop the instrumentation packages for monitoring the key elements identified in Activity 1 for improving building performance, including the sensors, data acquisition hardware, and software to allow data analysis and decision making by the building operators.
Activities for Years 3-5: Activity 3: Work with industry partners to demonstrate the use and benefits of performance monitoring tools in a few demonstration projects.
Activity 4: Develop recommendations for the necessary building performance measurements, using both the existing energy management systems and by adding new sensors. Quantify the benefits in terms of energy, maintenance, comfort, etc.
Activities for Years 5-10:
Activity 5: Work with industry to develop guidelines for performance metrics and presentation formats and identify faults in particular buildings.
Activity 6: Develop manuals, deployment programs, etc. There are not enough people to do this job across the country; need to automate system to get it done (See Project 2c). Demonstrate why people would want this system in their building. Make this process cheaper and easier to do—make it business as usual.
Activity 7: Develop standards for retro commissioning.
B-17

Appendix B
Outcomes for Project 2b include the documentation of the best techniques for retro commissioning, the tools and techniques for data collection and analysis, the estimated potential for energy savings from employing these techniques, the quantification of other benefits from these strategies, and the market plan for widespread dissemination and adoption. Partners for Project 2b include Commissioning agents, control companies, building owners, national labs, universities. Rationale & Criteria The activities in this Project cover the work needed to collect, present and interpret meaningful data for a building operator to decide how to improve systems and operations of the building. Energy savings based on performance monitoring could range from 5-30%, which sector wide represent .05-3 quads of energy savings. FY: Year 1 Year 2 Year 3 Year 4 Year 5Funding: $200-500k $400-1000k $500-1100k $600-1150k $600-1150k Ranking: High [Based on high energy savings potential]
B-18

Appendix B
Project 2c: Simplified Automated Tools for Building Operators Goals: Develop the diagnostic tools to allow a building operator to improve building performance and lower operating costs. Description: These tools would be a “virtual assistant” for building operators. The toolbox would contain analytical techniques of energy use and the operator would be able to send data to web sites to analyze systems in the building. There would be a “problems and solutions” database. One tool would be a web-based tool for remote assistance. Most existing buildings will not get remote sensors in the near future, despite the advances in wireless technology, so this addition of trend logs will help provide the necessary data in ways not available through ECM systems. Commissioning agents, control companies, and owners/operators will be the partners for developing and adopting this approach . Existing Control companies would market this as an add-on service. Building Types: All. Initial focus on owner-occupied office buildings and universities. Activities for Years 1-2:
Activity 1: Compile existing “best practices” for O&M and develop standard packages of procedures. Activity 2: Identify and verify benefits for O&M scheduling opportunities. Activity 3: Develop analytical techniques in software to calibrate energy analysis models. Activity 4: Develop methodology to work with operators, to obtain information. Activity 5: Develop pattern recognition techniques.
Activities for Years 3-5: Activity 5: Develop database of problems and solutions. What are the top 100 problems by HVAC type? Show kWh savings, comfort and equipment longevity for solutions. Activity 6: Develop procedures to reveal problems through active tests.
Activities for Years 5-10:
Activity 7: Automate entire system. Activity 8: Evaluate and refine techniques.
Outcomes for Project 2c include the tools for guiding the best techniques for retro commissioning and retrofits, with guidelines for building operators, and the quantification of
B-19

Appendix B
other benefits from these strategies, and the market plan for widespread dissemination and adoption. Partners for Project 2c include commissioning agents, control companies, building owners and managers, national labs, and universities. Rationale & Criteria The activities in this Project will apply primarily to a few subsectors that have skilled building operators that can use additional “eyes and ears” in their work. Energy savings based on simplified automated tools could range from 5-20%, which sector wide represent .05-2 quads of energy savings. FY: Year 1 Year 2 Year 3 Year 4 Year 5Funding: $200-600k $400-800k $500-900k $550-1050k $550-1150k Ranking: High, Medium High[Based on energy savings potential and ease of adoption, and targeted sectors.]
B-20

Appendix B
Project 2d: Fully Automated Diagnostic Tools. Goals: This project goes the next step beyond the tools that help the building operator to develop fully automated tools that detect, diagnose and present solutions. The information from better diagnostics can help make the business case for justifying energy investments. Description: These diagnostics are for facilities that may not have a building operator or on-site energy manager, although these tools will also be very effective in buildings that do have a good operator or off-site operator. There is the expectation that technology will be packaged differently for different users. Should be able to be applied to small commercial buildings. Should apply to all buildings and aggregate at distribution centers. Controls applicable to large buildings. Building Types: All. Initial focus on small commercial buildings and schools. Activities for Years 1-2:
Activity 1: Simulation-based development environments. Activity 2: Refinement of fault detection including comparison of approaches. Activity 3: Fault detecting for a broader range of systems including unconventional systems. Activity 4: Application of current wireless sensing technology. Activity 5: Find industry partners to adopt technology. Activity 6: Pilot projects in impact assessment (energy impacts), correction and compensation. What can automatically be done to correct problem? How does a human operator respond? Activity 7: Develop and demonstrate methods for instigating O&M actions based on diagnostic information.
Activities for Years 3-5:
Activity 8: Application of self-configuring, low-cost wireless sensors and expanding to other sensing capabilities (mold, VOCs, etc.) Activity 9: Progressive localization of diagnosis—pinpoint failures in systems Activity 10: Expand effort to integrate system/component level diagnostics (what is most likely cause of problem? Have to look at hierarchy of systems to diagnose. Activity 11: Initiate efforts in predictive diagnostics and root cause analysis Activity 12: Method of test for diagnostic tools (lead to industry certification)
Activities for Years 5-10:
Activity 13: Development and test of “peel, stick and dispose” sensors Activity 14: Smart-dust for building applications (mini sensors) Activity 15: More distributed, lower-cost and more in-depth diagnosing. Activity 16: Adapting technologies to take advantage of ubiquitous sensing. Activity 17: Fault tolerant equipment and systems. Activity 18: Integration of controls and diagnostics.
B-21

Appendix B
Outcomes for Project 2d include the software for guiding the best techniques for fault detection, the interface guidelines for building operators, the quantification of other benefits from these strategies, and the market plan for widespread dissemination and adoption. Partners for Project 2d include commissioning agents, control companies, building owners and managers, national labs, and universities. Rationale & Criteria The activities in this Project are likely to lead to large energy savings in their targeted sectors. This information is critical for building managers to make the case for investment in energy retrofits. Energy savings based advanced diagnostics could range from 5-30%, which sector wide represent .05-3 quads of energy savings. FY: Year 1 Year 2 Year 3 Year 4 Year 5Funding: $200-700k $400-1000k $400-1100k $500-1150k $600-1150k Ranking: Medium High [Based on energy savings potential]
B-22

Appendix B
Project 2e. Crosscutting Issues for Benchmarking, Diagnostics, Commissioning and O&M Goals: To coordinate the issues that are important across the program elements and outside the program. Examples include activities that overlap with other DOE programs in emerging technologies, FEMP, Rebuild America, Energy Star, and state and local programs. Description: There is a great deal of activity independently pursued in the area of benchmarking, diagnostics, commissioning and O&M. This activity will look at the work being done by states, utilities, and others and align the DOE effort to best advance this field. Activities for Years 1-2:
Activity 1: Identify crosscutting issues and players and coordinate activity and information sharing.
Activities for Years 3-5:
Activity 2: Continued identification of crosscutting issues and players and coordination of activity and information sharing.
Outcomes for Project 2e include reports on the coordination and integration of the overall Element activity. Partners for Project 2e include universities, states, EPA, BOMA, ASHRAE and others interested in diagnostics, commissioning and O&M for existing commercial buildings. Rationale & Criteria The activities described in this task are programmatically necessary for the effective management of the overall R&D activity. FY: Year 1 Year 2 Year 3 Year 4 Year 5Funding: $50-100k $50-100k $50-100k $50-100k $50-100k Ranking: [Required]
B-23

Appendix B
Element 3: Technology Development and Systems Integration Scope and audience: Element 3 encompasses the R&D activities needed to develop and adopt technologies for retrofitting existing commercial buildings. In addition to technology development and demonstration, there is a project to look at whole-building performance. The scope of the work is both medium-term development of technology, as well as longer-term adoption and implementation. The audience for the outcomes includes building owners and managers, commissioning agents, energy practitioners, ESCOs, utility program managers and energy researchers. Several reports (Westphallen 2001, Roth 2002) have estimated energy savings for new technologies in commercial buildings. The projects listed here were all ranked lower than the proceeding Elements by the workshop participants. The general view was that for existing commercial buildings, the R&D need was on better characterization and diagnostics, information collection and management, tools and training, than on new technology. There was a need identified for better understanding of how buildings actually work (Project 3a) and that some work was needed on technologies that were specific to retrofits and not just for new construction. Projects 3b-3f address these issues. Project 3a. Field research on operation and performance of actual buildings Goals: Identify reasons for why existing buildings don’t perform as intended and develop a database of case studies, documenting both building performance and occupant and owner satisfaction. Description: A compilation of case studies of ordinary existing commercial buildings including both building performance (from an energy and systems perspective) together with post occupancy evaluations (from a user satisfaction perspective). Building Types: All. Activities for Years 1-2:
Activity 1: Develop or identify existing performance metrics and protocols for “building in use” and “post-occupancy” evaluations. Activity 2: Disseminate protocols through federal agencies, BOMA, ASHRAE, states, universities and others to encourage their use in collecting well-documented case studies of actual building performance.
Activities for Years 3-5:
Activity 3: Collect high quality, measured data on the performance of systems and interactions in buildings. Collect occupant
B-24

Appendix B
satisfaction data from building owners, managers and users to validate high performance and high satisfaction. Activity 4: Compare actual building performance to design predictions and assumptions. Identify reasons for differences and prepare guidance for future design efforts.
Outcomes for Project 3a include the performance indicators for both energy performance and occupant satisfaction, the database of a small number of well characterized buildings, the protocols for building performance evaluation, and the guidelines and recommendations for high-performance retrofits and operations. Partners for Project 3a include ASHRAE TC9.6, BOMA, GSA, building owners and managers, national labs, and universities. Rationale & Criteria This project was the highest ranking in the Element—people want to know how buildings actually perform. This project provides the basis for understanding which systems in existing buildings are most prone to failure, and is linked with Projects 2a & 2b. It is difficult to analyze the energy savings for this activity, but it provides key information and insights for the other projects in this element. FY: Year 1 Year 2 Year 3 Year 4 Year 5Funding: $250-600k $300-800k $350-800k $350-800k $400-900k Ranking: High [Based on value to other projects.]
B-25

Appendix B
Project 3b. Low-cost daylighting control systems retrofit package Goals: Work with states and industry to develop packages of daylight controls that are reliably and easily installed as retrofits, low-cost, and easily calibrated. Description: A retrofit package that will allow electric lights to be controlled when daylight is available. The package will include a reliable photosensor, both wire and wireless connections and a protocol for installation and commissioning. Building Types: All. An initial focus on office buildings. Activities for Years 1-2:
Activity 1: Work with industrial partners to develop an inexpensive photo-sensor that works reliably. Activity 2: Verify the photo-sensor performance in the lab and in test sites using industry installers. Activity 3 Assemble the necessary industry players of this fragmented market to develop a prototype system.
Activities for Years 3-5:
Activity 4: Work with industrial partners to develop specifications for components and systems. Activity 5: Address market barriers (e.g., high cost of dimming ballasts) through “golden carrot” strategies or other bulk purchase guarantees, e.g., federal agency procurement schedules. Activity 6: Develop and implement controls for demand response.
Outcomes for Project 3b include the package of retrofit strategies, the guidelines for building operators, the quantification of other benefits from these strategies, and the market plan for widespread dissemination and adoption. Partners for Project 3b include commissioning agents, control companies, building owners and managers, national labs, and universities. Rationale & Criteria Lighting controls were identified by the industry groups as one of the single largest technology opportunities for energy savings in existing commercial buildings. Lighting represents 22% of the sector site energy use. Energy savings based on lighting controls could range from 5-30% of lighting energy use, which sector wide represents .05-1.0 quads of energy savings.
B-26

Appendix B
FY: Year 1 Year 2 Year 3 Year 4 Year 5Funding: $250-800k $300-1200k $400-1200k $500-1200k $500-1200k Ranking: Medium High [Based on energy savings potential and ease of adoption.]
B-27

Appendix B
Project 3c. Innovative low-energy retrofits for ventilation systems Goals: Work with states and industry to develop packages of ventilation systems and controls that are reliably and easily installed as retrofits, low-cost, and easily calibrated. Description: A retrofit package for low-energy ventilation systems that can be installed in schools and small commercial buildings that may not have sufficient ventilation. Includes a protocol for installation and commissioning. Building Types: All. An initial focus on office buildings. Activities for Years 1-2:
Activity 1: Work with industrial partners to develop reliable ventilation system retrofits for specific building types. Activity 2: Commission the ventilation systems in the lab and in demonstration sites using industry installers. Activity 3 Assemble the necessary industry players of this fragmented market to develop a prototype system.
Activities for Years 3-5:
Activity 4: Work with industrial partners to develop specifications for components and systems. Activity 5: Address market barriers (e.g., high efficiency, quiet fans) through “golden carrot” strategies or other bulk purchase guarantees, e.g., federal agency procurement schedules. Activity 6: Develop and implement controls for demand response.
Outcomes for Project 3c include the software for guiding the best techniques for retro commissioning, the guidelines for building operators, the quantification of other benefits from these strategies, and the market plan for widespread dissemination and adoption. Partners for Project 3c include HVAC installers, building owners and managers, national labs, and universities. Rationale & Criteria The industry groups identified ventilation issues as the second most critical technology after lighting controls that needed R&D. Many ESCOs (and others) are unwilling to make improvements to HVAC systems in commercial buildings because of concerns that they will affect the ventilation in the buildings. DOE could play an important role in addressing these concerns by having better metrics and diagnostics to show ventilation improvements.
B-28

Appendix B
Energy savings based on ventilation improvements could range from 5-10% of ventilation energy, which sector wide could represent .05-0.1 quads of energy savings. FY: Year 1 Year 2 Year 3 Year 4 Year 5Funding: $100-800k $200-900k $300-1100k $300-1100k $300-1100k Ranking: Medium High [Based on energy savings potential and ease of adoption.]
B-29

Appendix B
Project 3d. Innovative retrofits for thermal distribution systems Goals: Work with states and industry to develop packages of retrofits for thermal distribution systems. Description: A retrofit package that will include leakage diagnostics and energy assessments of thermal distribution systems. Protocols and demonstrations of innovative retrofit technologies are also included. Building Types: All. An initial focus on small commercial buildings. Activities for Years 1-2:
Activity 1: Work with industrial partners to develop reliable thermal distribution system retrofits for specific building types. Activity 2: Test the retrofits in the lab and in demonstration sites using industry installers. Activity 3 Assemble the necessary industry players of this fragmented market to develop a prototype system.
Activities for Years 3-5:
Activity 4: Work with industrial partners to develop specifications for components and systems. Activity 5: Address market barriers for implementation
Outcomes for Project 3d include the software for guiding the best techniques for retro commissioning, the guidelines for building operators, the quantification of other benefits from these strategies, and the market plan for widespread dissemination and adoption. Partners for Project 3d include HVAC manufacturers, building owners and managers, national labs, and universities. Rationale & Criteria Recent R&D supported by DOE and others (Roth 2002) has identified the importance of thermal energy distribution (TED) systems in energy use for existing commercial buildings. R&D has led to improvements in residential and small commercial TED systems, and work is needed to address the issues in large commercial buildings. The TED energy savings result from both reduced fan energy as well as less space conditioning, and could range from 10 to 20% of HVAC energy use (based on limited data), which sector wide represents 0.4-0.8 quads of energy savings. FY: Year 1 Year 2 Year 3 Year 4 Year 5Funding: $0-800k $200-900k $200-1000k $350-1000k $350-1000k Ranking: Medium High [Based on energy savings potential and ease of adoption.]
B-30

Appendix B
Project 3e. Innovative retrofits for heating and cooling systems Goals: Work with states and industry to develop packages of retrofits for thermal distribution systems. Description: Packages that will allow for HVAC retrofits for specific applications. Building Types: All. An initial focus on small commercial buildings. Activities for Years 1-2:
Activity 1: Based on the work in Element 1, identify key opportunities for HVAC retrofit activities, based on energy savings potential, market partners and other criteria. Activity 2: Work with industrial partners to develop reliable heating and cooling system retrofits for specific building types. Determine what HVAC systems work best for particular retrofit applications, e.g., distributed heat pump systems vs. more centralized HVAC. Develop better modeling tools for innovative HVAC retrofits, e.g., radiant heating and cooling systems, as well as others to be determined. Investigate applications for combined heating, cooling and power. Activity 3 Work with industry partners to demo retrofits in pilot studies.
Activities for Years 3-5:
Activity 4: Work with industrial partners to develop specifications for components and systems. Further development of design and analysis software tools for HVAC design industry to use. These tools significantly enhance the ability of engineers to predict the building performance benefits from retrofit measures and play a KEY role in justifying retrofit investments through life-cycle cost decision making. Activity 5: Address market barriers for implementation
Outcomes for Project 3e include the package of HVAC retrofit strategies, the guidelines for building operators, the quantification of other benefits from these strategies, and the market plan for widespread dissemination and adoption. Partners for Project 3e include HVAC companies, building owners and managers, national labs, and universities. Rationale & Criteria. The judgment of the industry groups was that even though there was a lot of potential HVAC energy savings, there was less need for R&D specifically for HVAC equipment retrofit because new equipment could be easily introduced. Energy savings from improved HVAC could range from 5-50% of HVAC energy use, which sector wide represent .02-2 quads of energy savings. FY: Year 1 Year 2 Year 3 Year 4 Year 5
B-31

Appendix B
Funding: $0-800k $0-900k $100-900k $350-900k $350-900k Ranking: Medium [Based on perceived lesser need for HVAC technologies specifically for retrofits .]
B-32

Appendix B
Project 3f. Innovative retrofits for lighting systems Goals: Work with states and industry to develop packages of retrofits for lighting systems. Description: A retrofit package for new light fixtures and controls. The package will include a protocol for installation and commissioning. Building Types: All. An initial focus on small commercial buildings. Activities for Years 1-2:
Activity 1: Work with industrial partners to develop reliable lighting system retrofits for specific building types. Activity 2: Test the system retrofits in the lab and in demonstration sites using industry installers. Activity 3 Assemble the necessary industry players of this fragmented market to develop a prototype system.
Activities for Years 3-5:
Activity 4: Work with industrial partners to develop specifications for components and systems. Activity 5: Address market barriers for implementation
Outcomes for Project 3f include the software for guiding the best techniques for retro commissioning, the interface guidelines for building operators, the quantification of other benefits from these strategies, and the market plan for widespread dissemination and adoption. Partners for Project 3f include commissioning agents, control companies, building owners and managers, national labs, and universities. Rationale & Criteria. The judgment of the industry groups was that even though there was a lot of potential lighting energy savings, there was less need for R&D specifically for lighting equipment retrofit because new equipment could be easily introduced. Energy savings from improved lighting could range from 5-50% of lighting energy use, which sector wide represent .02-2 quads of energy savings. FY: Year 1 Year 2 Year 3 Year 4 Year 5Funding: $0-800k $0-800k $0-800k $100-800k $250-800k Ranking: Medium [Based on perceived lesser need for lighting technologies specifically for retrofits .]
B-33

Appendix B
Project 3g. Crosscutting Issues for New Technology and Systems Integration Goals: To coordinate the issues that are important across the program elements and outside the program. Examples include activities that overlap with other DOE programs in emerging technologies, FEMP, Rebuild America, Energy Star, and state and local programs. Description: There is a great deal of activity independently pursued in the area of new technologies and systems integration. This activity will look at the work being done by states, utilities, and others and align the DOE effort to best advance this field. Building Types: All. Activities for Years 1-2:
Activity 1: Identify crosscutting issues and players and coordinate activity and information sharing.
Activity 2: Assess the role and impact of building standards and regulations on the existing commercial building sector.
Activities for Years 3-5:
Activity 3: Continued identification of crosscutting issues and players and coordination of activity and information sharing.
Outcomes for Project 3g include reports on the coordination and integration of the overall Element activity. Partners for Project 3g include universities, states, EPA, BOMA, ASHRAE and others interested in new technology and systems integration for existing commercial buildings. Rationale & Criteria The activities described in this task are programmatically necessary for the effective management of the overall R&D activity. FY: Year 1 Year 2 Year 3 Year 4 Year 5Funding: $50-100k $50-100k $50-100k $50-100k $50-100k Ranking: [Required]
B-34

Appendix B
Element 4: Follow-Up (Measurement & Evaluation) Scope and audience: Element 4 encompasses the R&D activities needed to evaluate the performance of the overall program. Part of this work is done by the peer review and advisory groups. But specific R&D is needed to evaluate the progress and impacts of the program. The audience is primarily for DOE program managers, but also for Congress and other funders, industry partners and the research community. Project 4a. Program evaluation & impact Goals: Knowledge of which program elements and activities across the portfolio need revision to meet their objectives. Description: A review of the portfolio of projects and activities and an evaluation of their impacts. Building Types: All. Activities for Years 1-2:
Activity 1: Review and assess performance of initial projects Activity 2: Revise Multiyear Plan based on assessment completed in Activity 1.
Activities for Years 3-5:
Activity 3: Evaluate impacts of program, e.g., changes in standards and codes, others TBD Activity 4: Promulgate guidelines and resource material based on findings from the R&D activities and other activities TBD
Outcomes for Project 4a include program assessments, improved multiyear plans, and impact assessments. Partners for Project 4a include states and other organizations conducting R&D in these areas, evaluation community, planners, and others. Rationale & Criteria. This project both pulls together the individual cross-cutting elements, but also gives an overview of the entire program effectiveness. The level of funding for this task will scale with the size of the overall program. FY: Year 1 Year 2 Year 3 Year 4 Year 5Funding: $0-50k $50-100k $50-100k $50-100k $50-100k Ranking: [Required]
B-35