An Overview of USPTO Operations
39
An Overview of USPTO Operations David J. Kappos Under Secretary of Commerce for Intellectual Property and Director of the U.S. Patent and Trademark Office
Transcript of An Overview of USPTO Operations

An Overview of USPTO Operations
David J. Kappos Under Secretary of Commerce for Intellectual Property and Director of the U.S. Patent and Trademark Office

America Invents Act (AIA) 12 Month Timeline
2 4/9/2012
On Schedule
On Schedule
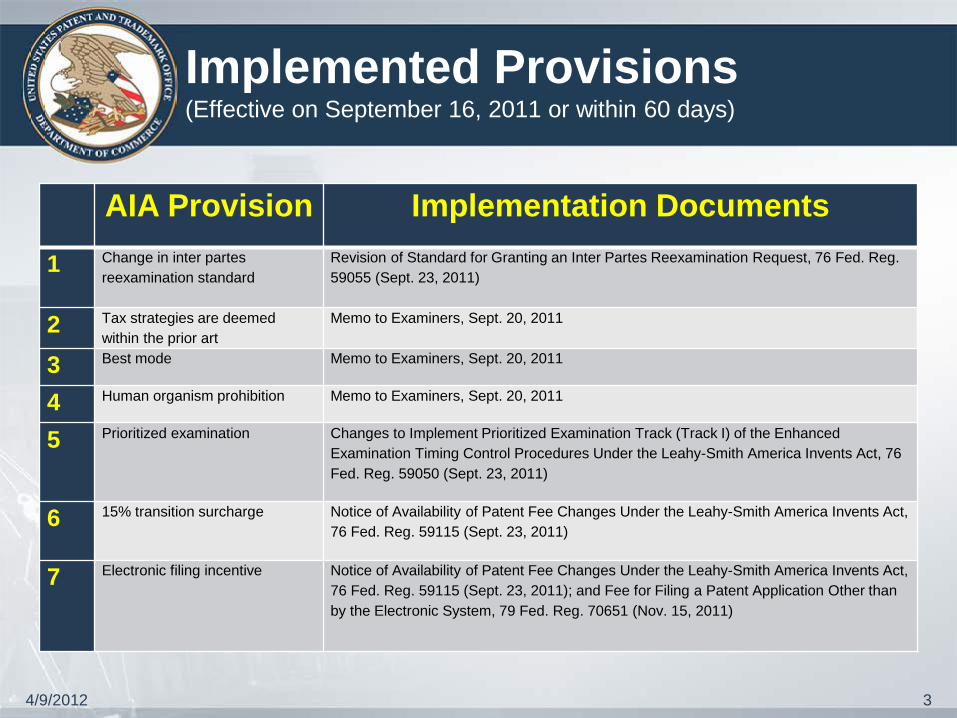
Implemented Provisions (Effective on September 16, 2011 or within 60 days)
AIA Provision Implementation Documents
1 Change in inter partes reexamination standard
Revision of Standard for Granting an Inter Partes Reexamination Request, 76 Fed. Reg. 59055 (Sept. 23, 2011)
2 Tax strategies are deemed within the prior art
Memo to Examiners, Sept. 20, 2011
3 Best mode Memo to Examiners, Sept. 20, 2011
4 Human organism prohibition Memo to Examiners, Sept. 20, 2011
5 Prioritized examination
Changes to Implement Prioritized Examination Track (Track I) of the Enhanced Examination Timing Control Procedures Under the Leahy-Smith America Invents Act, 76 Fed. Reg. 59050 (Sept. 23, 2011)
6 15% transition surcharge
Notice of Availability of Patent Fee Changes Under the Leahy-Smith America Invents Act, 76 Fed. Reg. 59115 (Sept. 23, 2011)
7 Electronic filing incentive
Notice of Availability of Patent Fee Changes Under the Leahy-Smith America Invents Act, 76 Fed. Reg. 59115 (Sept. 23, 2011); and Fee for Filing a Patent Application Other than by the Electronic System, 79 Fed. Reg. 70651 (Nov. 15, 2011)
3 4/9/2012

Proposed Rules in Progress (12 Month timeline)
4/9/2012 4
NPRMs Published as of January 25, 2012
NPRMs Published in February
Inventor’s oath / declaration Inter partes review
Third party submission of prior art in a patent application
Post grant review
Citation of prior art in a patent file Transitional program for covered business method patents
OED Statute of Limitations Derivation
Supplemental examination

5
Track I Statistics
Petitions Filed
Days to Petition Decision
% of Decided
Petitions Granted
Days from Petition to first Office
action Number of Track I Applications
2,711 46.3 98% 41.6
Examination Status
First Action on Merits
mailed
Final Dispositions
mailed
Allowances Mailed
Number of Track I applications 1481 39 153
4/9/2012
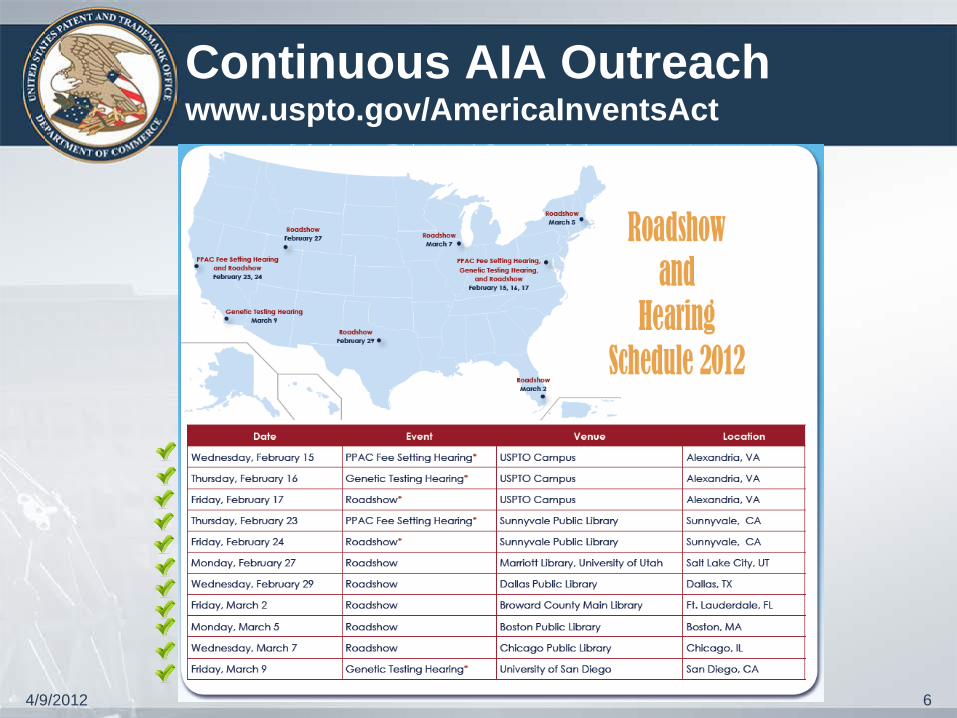
Continuous AIA Outreach www.uspto.gov/AmericaInventsAct
4/9/2012 6
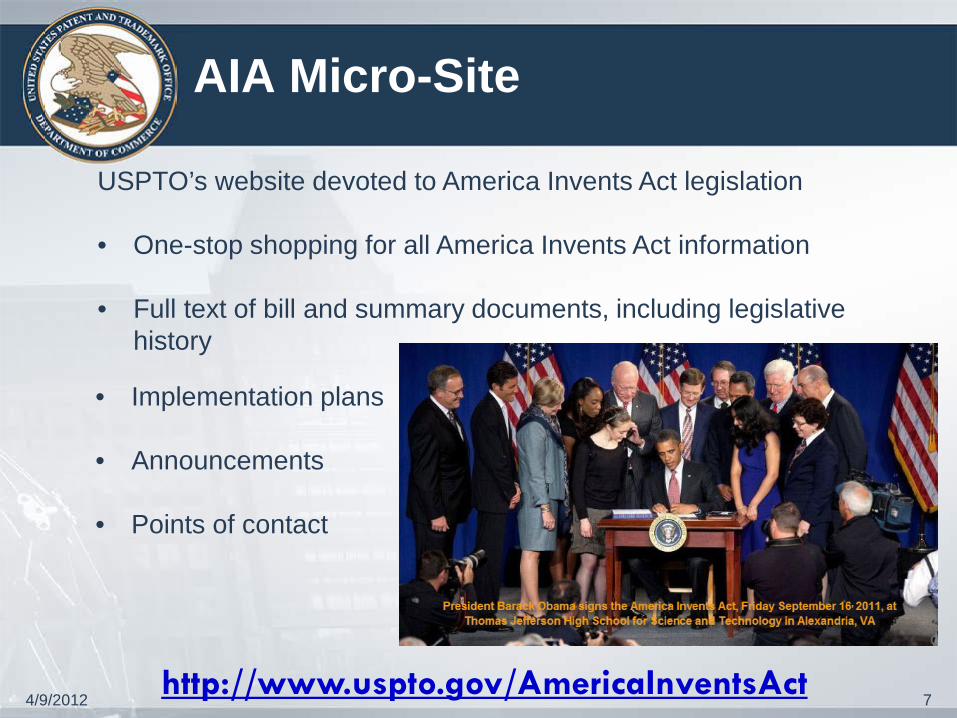
AIA Micro-Site
7 http://www.uspto.gov/AmericaInventsAct
USPTO’s website devoted to America Invents Act legislation • One-stop shopping for all America Invents Act information • Full text of bill and summary documents, including legislative
history
• Implementation plans • Announcements
• Points of contact
4/9/2012

Fee Setting 17 Month Timeline
4/9/2012 8

Elijah J. McCoy Satellite Office Detroit, MI • Scheduled: July 2012
• 100 ‘IP Experienced’ Patent
Examiners to be hired in first year of operation
• Office will have a Board of Patent Appeals Presence
• 1 of 3 planned Satellite Offices
4/9/2012 9
10

11
Unexamined Patent Application Backlog FY 2009 – FY 2012 (through March 20th)
650,449 as of March 19th.
FY 2012 Target (2013 President’s Budget): 621,800 – Includes CPC Production Adjustment.
Target Less CPC Adjustment: 615,000.
610,000620,000630,000640,000650,000660,000670,000680,000690,000700,000710,000720,000730,000740,000750,000760,000770,000
10/0
811
/08
12/0
801
/09
02/0
903
/09
04/0
905
/09
06/0
907
/09
08/0
909
/09
10/0
911
/09
12/0
901
/10
02/1
003
/10
04/1
005
/10
06/1
007
/10
08/1
009
/10
10/1
011
/10
12/1
001
/11
02/1
103
/11
04/1
105
/11
06/1
107
/11
08/1
109
/11
10/1
111
/11
12/1
101
/12
02/1
203
/20
Appl
icatio
ns Aw
aitin
g Firs
t Acti
on
650,303 as of March 20th.

12
0
25,000
50,000
75,000
100,000
125,000
150,000
175,000
200,000
225,000
250,000
275,000
300,000
325,000
350,000
375,000
400,000
425,000
450,000
475,000
500,000
525,000
550,000
2001 2002 2003 2004 2005 2006 2007 2008 2009 2010 2011 2012(Projected)
2012(Actuals)
Appl
icat
ions
Fiscal Year
Total UPR and RCE Filings FY 2001 – FY 2012 (through March 20th)
FY 2012 Target based on 2013 President’s Budget:
533,300 (5.2% Projected Growth over FY 2011)
234,386 Total UPR Filings Received so far in FY 2012.

13
RCE Backlog FY 2010 – FY 2012 (through March 20th)
85,836 as of March 6th.
0
10,000
20,000
30,000
40,000
50,000
60,000
70,000
80,000
90,000
10/0
911
/09
12/0
901
/10
02/1
003
/10
04/1
005
/10
06/1
007
/10
08/1
009
/10
10/1
011
/10
12/1
001
/11
02/1
103
/11
04/1
105
/11
06/1
107
/11
08/1
109
/11
10/1
111
/11
12/1
101
/12
02/1
203
/19
RC
E A
pplic
atio
ns A
wai
ting
Nex
t Ac
tion
RCE Backlog
RCE Backlog 85,973 as of March 20th.

10.012.014.016.018.020.022.024.026.028.030.032.034.036.038.040.0
10/08
11/08
12/08
01/09
02/09
03/09
04/09
05/09
06/09
07/09
08/09
09/09
10/09
11/09
12/09
01/10
02/10
03/10
04/10
05/10
06/10
07/10
08/10
09/10
10/10
11/10
12/10
01/11
02/11
03/11
04/11
05/11
06/11
07/11
08/11
09/11
10/11
11/11
12/11
01/12
02/12
Mon
ths
First Action Pendency Total Pendency
14
First Action Pendency and Total Pendency
FY 2009 – FY 2012 (through February)
First Action Pendency as of February 29th, 2012: 22.7 months.
Total Pendency as of February 29th, 2012: 34.0 months.
Average Total Pendency FY 2012 Target: 34.7 months (Actual as of 02/29/12 – 34.0 months) Average First Action Pendency FY 2012 Target: 22.5 months (Actual as of 02/29/12 – 22.7 months) (Average First Action Pendency FY 2012 Stretch Target Less CPC Adjustment: 22.3 months)

15
10.0
12.0
14.0
16.0
18.0
20.0
22.0
24.0
26.0
28.0
30.0
10/0
811
/08
12/0
801
/09
02/0
903
/09
04/0
905
/09
06/0
907
/09
08/0
909
/09
10/0
911
/09
12/0
901
/10
02/1
003
/10
04/1
005
/10
06/1
007
/10
08/1
009
/10
10/1
011
/10
12/1
001
/11
02/1
103
/11
04/1
105
/11
06/1
107
/11
08/1
109
/11
10/1
111
/11
12/1
101
/12
02/1
2
Mon
ths
Forward Looking First Action Pendency FY 2009 – FY 2012 (through February)
Forward Looking Pendency represents an estimate of the average number of months it would take to complete a first Office action under current and projected workload and resource levels for an application filed at the given date.
Forward Looking First Action Pendency as of February 29th, 2012: 16.8 months.

16
Interview Time FY 2008 – FY 2012 (through February)
(63,124 hours as of February, 2012, compared with 55,285 hours as of February, 2011.)
0
10,000
20,000
30,000
40,000
50,000
60,000
70,000
80,000
90,000
100,000
110,000
120,000
130,000
140,000
150,000
160,000
170,000
October November December January February March April May June July August September
Ho
urs
2008 2009 2010 2011 2012

01,0002,0003,0004,0005,0006,0007,0008,0009,000
10,00011,00012,00013,00014,00015,00016,00017,00018,00019,00020,00021,00022,00023,00024,00025,000
13 15 17 19 21 23 25 27 29 31 33 35 37 39 41 43 45 47 49 51 53 55 57 59
Num
ber o
f App
licat
ions
Months
Distribution of Corps Backlog (Tail)
Tail Cases Remaining Tail Cases Worked
17
FY 2012 COPA Backlog (Tail): Applications with filing dates on or before September 1st, 2010 (304,000 on Oct. 1, 2011) FY 2012 Goal: Reduce COPA Backlog (Tail) by 260,000 applications (17,515 applications have been disposed) 17,213 of the original COPA 1.0 cases are awaiting first action.
170,805 Total Tail Cases Remaining
FY2012 Goal: 260,000 Cases
133,195 Tail Cases Worked
126,805 Tail Cases Needed for Goal
Clearing the Oldest Patent Applications 2.0 (COPA) FY 2012 (through March 19th, 2012)
Projected 44K Cases Left in the Tail at EOFY 12
Applications to the right of the red line include pending cases from the COPA 1.0 initiative.
1.8
1.9
2.0
2.1
2.2
2.3
2.4
2.5
2.6
2.7
2.8
2.9
3.0
10/1
1/20
0811
/8/2
008
12/6
/200
81/
3/20
091/
31/2
009
2/28
/200
93/
28/2
009
4/25
/200
95/
23/2
009
6/20
/200
97/
18/2
009
8/15
/200
99/
12/2
009
10/1
0/20
0911
/7/2
009
12/5
/200
91/
2/20
101/
30/2
010
2/27
/201
03/
27/2
010
4/24
/201
05/
22/2
010
6/19
/201
07/
17/2
010
8/14
/201
09/
11/2
010
10/9
/201
011
/6/2
010
12/4
/201
01/
1/20
111/
29/2
011
2/26
/201
13/
26/2
011
4/23
/201
15/
21/2
011
6/18
/201
17/
16/2
011
8/13
/201
19/
10/2
011
10/8
/201
111
/5/2
011
12/3
/201
112
/31/
2011
1/28
/201
22/
25/2
012
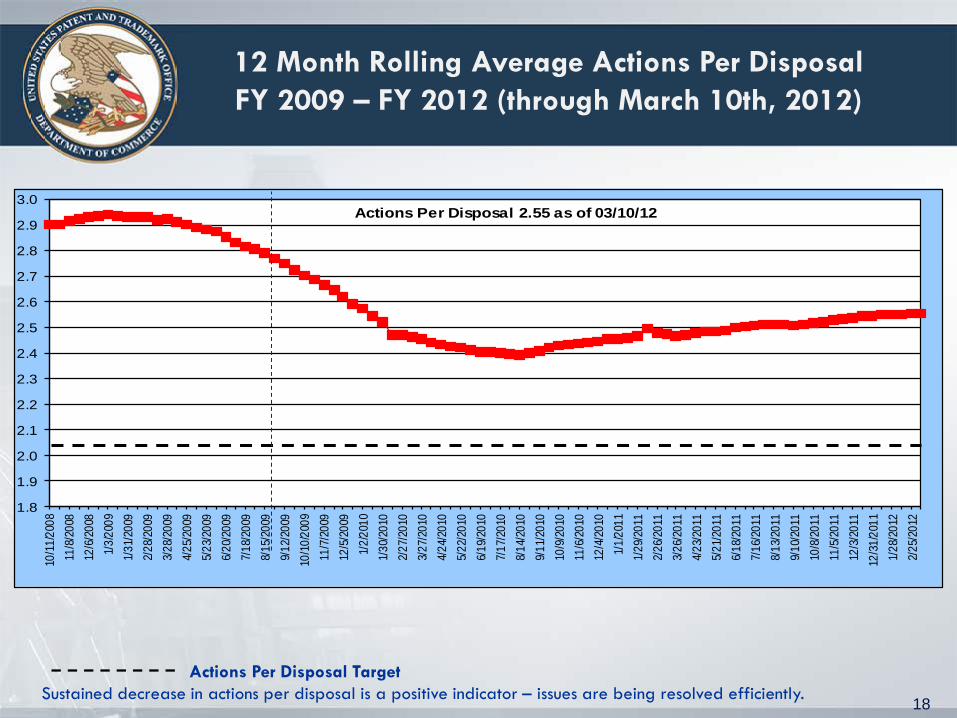
Actions Per Disposal 2.55 as of 03/10/12
18
Actions Per Disposal Target Sustained decrease in actions per disposal is a positive indicator – issues are being resolved efficiently.
12 Month Rolling Average Actions Per Disposal FY 2009 – FY 2012 (through March 10th, 2012)

40.0%
41.0%
42.0%
43.0%
44.0%
45.0%
46.0%
47.0%
48.0%
49.0%
50.0%
10/1
1/20
08
11/8
/200
8
12/6
/200
8
1/3/
2009
1/31
/200
9
2/28
/200
9
3/28
/200
9
4/25
/200
9
5/23
/200
9
6/20
/200
9
7/18
/200
9
8/15
/200
9
9/12
/200
9
10/1
0/20
09
11/7
/200
9
12/5
/200
9
1/2/
2010
1/30
/201
0
2/27
/201
0
3/27
/201
0
4/24
/201
0
5/22
/201
0
6/19
/201
0
7/17
/201
0
8/14
/201
0
9/11
/201
0
10/9
/201
0
11/6
/201
0
12/4
/201
0
1/1/
2011
1/29
/201
1
2/26
/201
1
3/26
/201
1
4/23
/201
1
5/21
/201
1
6/18
/201
1
0716
/11
8/13
/201
1
9/10
/201
1
10/8
/201
1
11/5
/201
1
12/3
/201
1
12/3
1/20
11
1/28
/201
2
2/25
/201
2
Allowance Rate
19 Sustained increase in allowance rate is a positive indicator – it shows increased efficiency of the workforce.
12 Month Rolling Average Allowance Rate, by Bi-Week FY 2009 – FY 2012 (through February 25th, 2012)
Allowance Rate as of 3/10/12: 49.6%

Central Re-examination Unit (CRU)
4/9/2012 20
• Significant decline in pendency: Increased staffing; Pilot program for waiving
the statement period; Streamlined process for handling petitions and publication of certificates
0
50
100
150
2011 2012
AVERAGE NUMBER OF DAYS TO ISSUE

Board of Patent Appeals & Interferences
4/9/2012 21
*Aggressive hiring to tackle BPAI backlog

80.0%
81.0%
82.0%
83.0%
84.0%
85.0%
86.0%
87.0%
88.0%
89.0%
90.0%
91.0%
92.0%
93.0%
94.0%
95.0%
96.0%
97.0%
98.0%
99.0%
100.0%
FY09Q1 FY09Q2 FY09Q3 FY09Q4 FY10Q1 FY10Q2 FY10Q3 FY10Q4 FY11Q1 FY11Q2 FY11Q3 FY11Q4 FY12-Nov
FY12-Dec
FY12-Jan
FY12-Feb
Perc
ent
Final Disposition Compliance Rate In-Process Compliance Rate Quality Index Reporting
Quality Measures Final Disposition, In-Process and QIR
12 Month Rolling Average FY 2009 – FY 2012 (through February)
2012 Final Disposition Compliance Rate Target Range
(95.6% - 96.7%). Actual as of February: 96.2%
2012 In-Process Compliance Rate Target Range
(94.6% - 96.0%). Actual as of February: 96%
22
2012 Quality Index Reporting Target Range
(88.3% - 91.60%). Actual as of February: 89.5%

23
Quality Measures

24
0255075
100125150175200225250275300325350375400425450475500525550
12/0901/1002/1003/1004/1005/1006/1007/1008/1009/1010/1011/1012/1001/1102/1103/1104/1105/1106/1107/1108/1109/1110/1111/1112/111/1202/12
Awaiting Decision Requests Granted Requests Dismissed Requests Denied Petitions Received
Request Summary 10/10 11/10 12/10 01/11 02/11 03/11 04/11 05/11 06/11 07/11 08/11 09/11 10/11 11/11 12/11 1/12 02/12 TotalPetitions Received 32 166 340 287 165 548 150 276 216 162 151 145 291 202 201 202 186 5,550Awaiting Decision (by month) 51 107 256 220 224 310 327 285 272 282 244 252 325 357 345 382 278Requests Granted (by month) 26 81 122 222 117 263 86 237 167 116 206 111 156 128 308 134 256 3,500Requests Denied (by month) 6 1 0 10 9 23 14 14 9 0 3 0 7 0 11 4 12 269Requests Dismissed (by month) 5 28 69 91 35 176 33 67 53 41 65 32 55 42 65 27 22 1,503
Green Technologies Pilot
Green Technologies Pilot Data as of February 27th, 2012
Average time from petition grant to final disposition: 303 daysShortest time from petition grant to final disposition: 47 daysLongest time from petition grant to final disposition: 740 days

Current Patent Prosecution Highway (PPH) Programs
Japan (JPO) Korea (KIPO) China (SIPO) European Patent Office (EPO) Germany (DPMA) Australia (IPAU) Canada (CIPO) United Kingdom (UKIPO) Denmark (DKPTO) Iceland (IPO) Norway (NIPO) Nordic Patent Institute (NPI) Finland (NBPR) Sweden (PRV)
Russia (Rospatent) Israel (ILPO) Taiwan (TIPO) Hungary (HPO) Spain (SPTO) Austria (APO) Singapore (IPOS) Mexico (IMPI)
4/9/2012 25
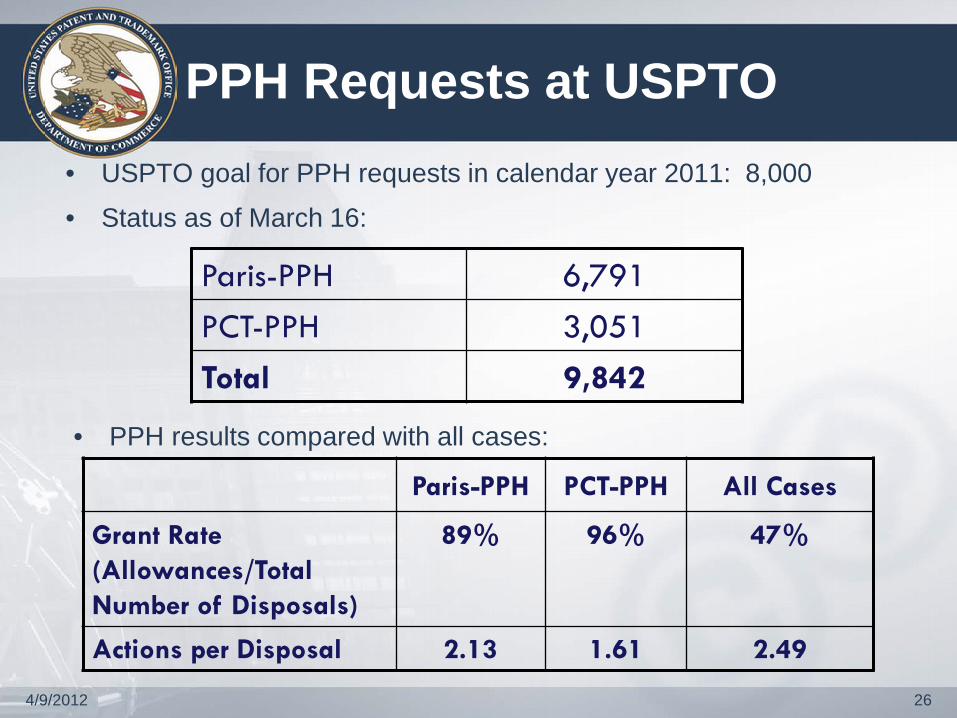
PPH Requests at USPTO • USPTO goal for PPH requests in calendar year 2011: 8,000
• Status as of March 16:
Paris-PPH 6,791 PCT-PPH 3,051 Total 9,842
Paris-PPH PCT-PPH All Cases
Grant Rate (Allowances/Total Number of Disposals)
89% 96% 47%
Actions per Disposal 2.13 1.61 2.49
• PPH results compared with all cases:
4/9/2012 26

Cooperative Patent Classification (CPC)
CPC Milestone Timeframe Introduction to CPC for all examiners. 2012
Develop Examiner Training with EPO. 2012-2014
Contractors apply CPC symbols to PGPUB pipeline documents. January 1, 2013
USPC and CPC symbols will be searchable in EAST/WEST, while routing remains based on USPC.
2013
CPC symbols will propagate from PGPUB to Grants 2013
Examiners will begin to add CPC symbols as needed on issued applications, with voluntary search capability of CPC symbols in EAST/WEST.
2013-2014
Final stage of CPC implementation. 2015
4/9/2012 27

Trademark Performance: Application Filings
• FY 2010: 368,939 classes
• FY 2011: 398,667 classes
• FY 2012 : projected 413,000 classes
-
50,000
100,000
150,000
200,000
250,000
300,000
350,000
400,000
450,000
FY 2
002
FY 2
003
FY 2
004
FY 2
005
FY 2
006
FY 2
007
FY 2
008
FY 2
009
FY 2
010
FY 2
011
FY 2
012
4/9/2012 28

Trademark Performance: Quality
FIRST ACTION COMPLIANCE In-process review evaluation of the statutory bases for which the Office raises issues and or refuses marks for registration based on the first office action.
95.5% 94.1%*
FINAL ACTION COMPLIANCE In-process review evaluation of the statutory bases for which the Office raises issues and or refuses marks for registration based on the examiner’s approval or denial of the application.
97.0% 96.4%*
EXCELLENT OFFICE ACTION New measure for FY 2011 indicating the comprehensive quality of the first Office action search, evidence, writing and decision making.
20.0% 22.1%
FY 2011 Trademark Performance Measures
FY 2012 Targets
FY 2012 Q1
Results
*Preliminary Numbers
4/9/2012 29
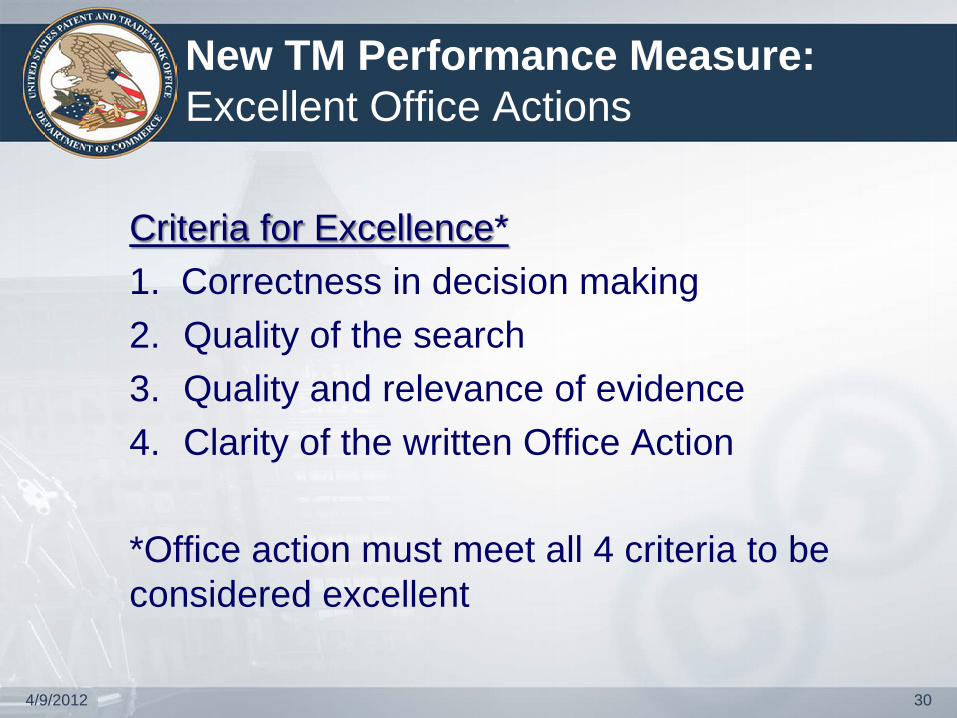
New TM Performance Measure: Excellent Office Actions
Criteria for Excellence* 1. Correctness in decision making 2. Quality of the search 3. Quality and relevance of evidence 4. Clarity of the written Office Action *Office action must meet all 4 criteria to be considered excellent
4/9/2012 30

Trademarks Next Generation
31

IP & Humanitarian Challenges
32
• President’s Global Development Agenda
• Awards competition for patent owners and licensees who apply their disruptive technologies to underserved people of the world
• Accepting Applications Since March 1, 2012
• Judges will choose winners in four categories: – medical technology – food and nutrition – clean technology – information technology
http:// patentsforhumanity. challenge.gov/


IP Awareness Assessment Tool
4/9/2012 34

Patents End-to-End (PE2E)
• IT Overhaul for the 21st Century • Dynamic views of drawings, claims, and annotations • Greater Examination & Agency Efficiency
4/9/2012 35
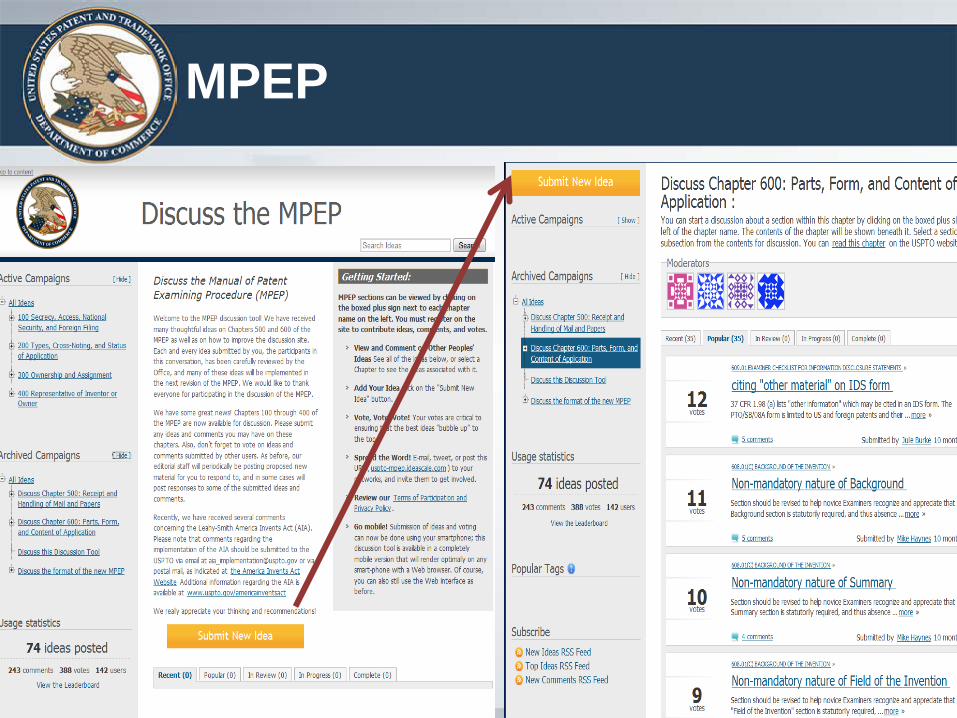
MPEP

TMEP IdeaScale Links
4/9/2012 37
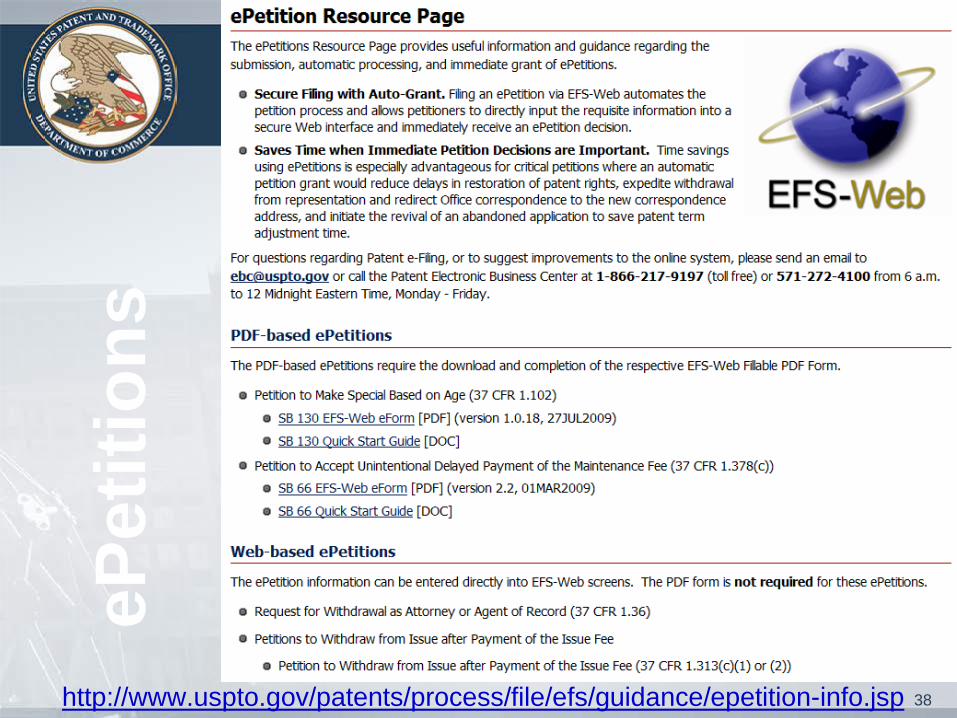
ePet
ition
s
http://www.uspto.gov/patents/process/file/efs/guidance/epetition-info.jsp
38

Thank You