An overview of software dd a scoing study
27
An Overview of Software Defect Density: A Scoping Study Syed Muhammad Ali Shah*, Maurizio Morisio, Marco Torchiano
Transcript of An overview of software dd a scoing study

An Overview of Software Defect
Density: A Scoping Study
Syed Muhammad Ali Shah*,
Maurizio Morisio, Marco Torchiano

SoftwareQualityDefect Density

Defect Density• Product quality measured in terms
of Defect Density (DD)
DD = CND/ Size• Where CND is the cumulative number
of post release defects in the observed period.
• Size is measured at the end of the observed period in thousands of lines of code (KLoC).

Typical Figures ofDD
RQ 1: What are the Typical Figures of DD in Software Projects
Such figures provide managers benchmarks to define quality goals upfront, to evaluate and to assess the quality

RQ2: Is there a difference in DD between open and closed source project?
Since often the context, motivation, and development process differ between open source and proprietary projects. We aim at finding some evidence, at least in terms of DD.

RQ3: Is there a difference in DD among programming languages?
Different programming languages encompass e.g. varying styles, expressive power and abstraction level. Such differences are likely to influence the DD of projects.

What is the relationship between DD and project size?
It provide researchers the evidence of a relationship between project size and DD.

What is the relationship of DD and project age?
It provides researchers the evidence of evolution of reliability over time, not only on failure happening (traditional reliability definition) but also on DD.

Scoping Study• Followed the framework of Arksey and
O’Malley for conducting our scoping study.
The framework has five stages
• Stage 1: Research Questions Definition
• Stage 2: Relevant Studies Identification
• Stage 3: Selection of Studies
• Stage 4: Charting the Data
• Stage 5: Results

Search StrategyThree phase search strategy.
Phase 1:
• Considers papers published in top software engineering journals from 2000 to 2011.
• The search string is “Defect Density” OR “Fault Density” OR “Reliability” is used.
Phase 2
• We search using two publication databases, IEEE explorer and ACM digital library.

….• The search keywords are “Software Defect
Density” and “Software Fault Density”.
Phase 3
• We followed the references of selected 18 papers to identify other relevant studies.
• We particularly searched the Promise proceedings
This led to a selection of 19 papers in total containing DD data about 110 projects.

Inclusion Criteria
• Are related to software engineering
• Are related to software projects
• Contain directly figures of DD, or contain data that allows to compute DD indirectly (such as number of post release defects and size in LOC)
• Mention that DD was computed after the particular release or the project (operation phase, post release phase, etc).

Data Analysis and HypothesisTo answer the research questions we used descriptive statistics, regression analysis and when applicable we also statistically test some hypothesis.
Concerning RQ 1: we used descriptive statistics and cumulative distribution diagrams.
Concerning RQ 4,5: we performed regression analysis

…..We answer RQ’s 2 and 3 by means of hypothesis testing
Concerning RQ2:
H20: There is no significant difference in term of DD between open source and close source projects.
H2a: There is a significant difference in term of DD between open source
and close source projects.
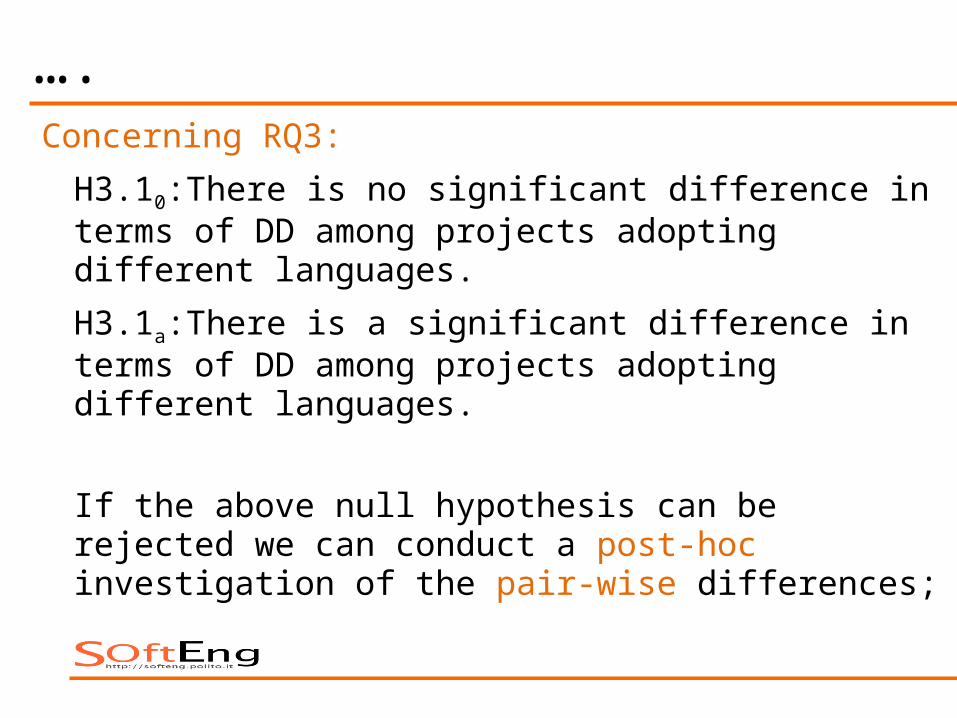
….Concerning RQ3:
H3.10:There is no significant difference in terms of DD among projects adopting different languages.
H3.1a:There is a significant difference in terms of DD among projects adopting different languages.
If the above null hypothesis can be rejected we can conduct a post-hoc investigation of the pair-wise differences;

DD Typical Figures
NUMBERS MEAN MEDIANSTANDARD DEVIATION
Projects 109 7.47 4.3 7.99
7.47

DD Vs. (open, closed source)
NUMBERS MEAN MEDIANSTANDARD DEVIATION
Closed source 77 8.6 5.4 8.49
Open source 32 4.66 2.75 5.84
Mann-Whitney
p = 0.004
Mann-Whitney
p = 0.004
Open source projects DD that is on average 4 defects/KLoC smaller than closed source ones

DD Vs. Programming languages
NUMBERS MEAN MEDIANSTANDARD DEVIATION
C 43 10.0 7.9 7.98
Java 45 5.9 3.5 6.22
C++ 11 8.73 1.3 13.17
Kruskal-Wallis
p = 0.009
Kruskal-Wallis
p = 0.009αB=α/3=0.016
Mann-Whitney
p = 0.003
Mann-Whitney
p = 0.003
C projects DD have 4.1 defect per KLoC higher than Java ones

DD Vs. Size of Projectlog(DD) = 5.12 - 0.341 log(Size)log(DD) = 5.12 - 0.341 log(Size)
log(DD) = 5.12 - 0.341 log(Size)Regression’s p-value is smaller than 0.001 and the corresponding adjusted R2 is 22%.
The negative correlation, for the log-values has a higher, though still small practical relevance.
The negative correlation, for the log-values has a higher, though still small practical relevance.

Defect Density
Size range N Mean Median Std Dev
upto 400K LoC 88 8.63 5.3 8.4
400K to 2M LoC 15 3.3 2.8 2.72
Above 2M LoC 5 0.38 0.40 0.28
Mann-Whitney
p <0.016
Mann-Whitney
p <0.016
αB=α/3=0.016
We find evidence that the larger the projects, the lower the defect density

DD Vs. Age of Project
DD = 1.86 + 0.59 AgeThe p-value of the regression is 0.011 and the corresponding
adjusted R2 is 13.8%.

Contingency TablesSize \ Type Closed Open
Small 63 82% 25 78%
Medium 12 15% 4 12%
Large 2 3% 3 10%
77 100% 32 100%
LangType\
C C++ Java Other
Closed 39 91% 11 100% 20 44% 7 70%
Open 4 9% 0 0% 25 56% 3 30%
43 100% 11 100% 45 100% 10 100%

Speculative Hypotheses
• Small projects are more in closed source projects (82%) than for open source ones (78%).
• C and Java Unbalanced use Open Source and Close Source may have some influence.
• Size is negatively correlated with defect density” Large projects typically put more effort on testing

Threats to Validity
• “survivorship bias”. Checking figures.
• Missed papers calling DD by another name.
• Little concern programming language, development mode.
• Size, defects are easily subject to ambiguities.
• 109 projects is not a negligible number, but is a very limited percentage of the number of projects released overall.

Main Limitations
Lack of process variables:
• Testing effort
• Quality effort in general
• code churn
• code history
• Experience (team and manager)
That are probably key factors for DD.

Conclusion• The first to mined the literature for DD
figures that had not been gathered and analyzed before.
• Found that development mode is a factor for DD
• Programming language is sometimes a factor for DD
• Found that projects size is relevant while Age is not a factor for DD

Thank You
Questions OR
CoffeeOR
Coffee