An overview of M&A in the Pharmaceutical · PDF fileAn overview of M&A in the Pharmaceutical...
29
An overview of M&A in the Pharmaceutical industry CPhI pre-connect meeting, Madrid, October 12, 2015 Dr. Christoph Bieri Managing Partner, Kurmann Partners AG and Chair, IMAP Healthcare Group Email: [email protected] / M: +41 79 771 21 14
Transcript of An overview of M&A in the Pharmaceutical · PDF fileAn overview of M&A in the Pharmaceutical...
An overview of M&A in the Pharmaceutical industry
CPhI pre-connect meeting, Madrid, October 12, 2015
Dr. Christoph Bieri
Managing Partner, Kurmann Partners AG and Chair, IMAP Healthcare Group
Email: [email protected] / M: +41 79 771 21 14
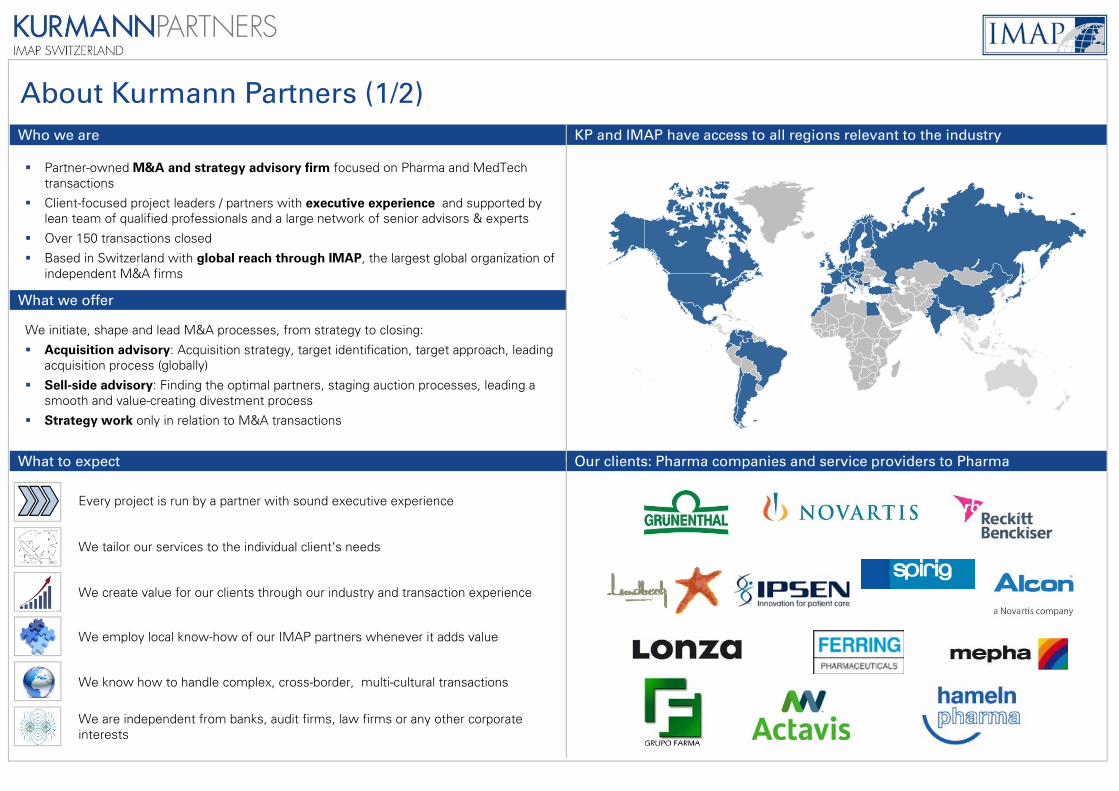
Partner-owned M&A and strategy advisory firm focused on Pharma and MedTechtransactions
Client-focused project leaders / partners with executive experience and supported by lean team of qualified professionals and a large network of senior advisors & experts
Over 150 transactions closed
Based in Switzerland with global reach through IMAP, the largest global organization of independent M&A firms
Who we are
We initiate, shape and lead M&A processes, from strategy to closing:
Acquisition advisory: Acquisition strategy, target identification, target approach, leading acquisition process (globally)
Sell-side advisory: Finding the optimal partners, staging auction processes, leading a smooth and value-creating divestment process
Strategy work only in relation to M&A transactions
About Kurmann Partners (1/2)
We create value for our clients through our industry and transaction experience
We employ local know-how of our IMAP partners whenever it adds value
We know how to handle complex, cross-border, multi-cultural transactions
We are independent from banks, audit firms, law firms or any other corporate interests
Every project is run by a partner with sound executive experience
We tailor our services to the individual client‘s needs
What we offer
What to expect Our clients: Pharma companies and service providers to Pharma
KP and IMAP have access to all regions relevant to the industry

About Kurmann Partners (2/2)
Pharma Project Leaders Our latest landmark deals
Dr. Christoph Bieri, Managing Partner
M.Sc. Biochemistry, PhD (Biophysics, ETH Lausanne)CEO of a VC-backed Biotech firm, The Boston Consulting GroupChairman of the IMAP Healthcare practiceWith KP since 2007
Peter Degen, Managing Partner
BA in Business Administration, Advanced Marketing at IMDCEO at Doetsch Grether and Sidroga; VP Latin America at Degussa/AstaMedica; Executive at Roche in Latam & Europe;With KP since 2010
Michel Le Bars, Partner
MBA HEC Paris; M.Sc. in Petroleum Eng. ENS Pétrole & MoteursMerck & Co.; Head BD EMEA, Strategy in Emerging Markets; Alcan – Lean Master Black Belt; Total, Oil & Gas Operations Management With KP since 2013
Transaction Support and Senior Advisors
In addition to our IMAP Partners around the globe, our transaction support team includes business analysts as well as legal advisor. Furthermore, KP employs the services of several senior advisors, highly qualified professionals with executive background in the following segments and areas:
Pharma R&D Pharma CMO OTC Consumer Health Generics Biotech
Oncology Medtech Dental Industry High Tech Energy Capital Markets
Bernard Pellereau, Partner
M.Sc. Chemistry, MBA Sorbonne20 years at Dow Chemical, President Europe, MEAF and India for Honeywell Specialty Materials With KP since 2009
Contact Details
Phone: +41 58 261 90 50
Address: Elisabethenanlage 25CH- 4051 Basel
Web: www.kurmannpartners.com

Agenda
Pharma M&A in 2013-2015
4 strategic archetypes for Pharma companies
Impact on Pharma’s manufacturing networks
Drivers for M&A of CMOs
Summary
www.kurmannpartners.com [email protected]
P. 4

0
1
2
3
4
5
6
7
8
9
10
11
12
13
14
15
2010-01-01 2011-05-16 2012-09-27 2014-02-09 2015-06-24
Rev
enue
mul
tiple
per
tra
nsac
tion Allergan/Actavis
Salix/Valeant
Perrigo/Mylan
01/2010 07/2010 01/2011 07/2011 01/2012 07/2012 01/2013 07/2013 01/2014 07/2014 01/2015 07/2015
Worldwide M&A Transactions with Pharma and Pharma-related targets, 2010 until Q3/2015
Note: Pharma deals with reported revenue multiple and deal size >USD 10m: n=581; bubble sizes represent deal size. Source: KP research, MergerMarket (retrieved on 06/10/2015)
Pharma M&A is arguably at its all-time high, with unprecedented valuations
Weighted average 2010
Weighted average 2011Weighted average 2012
Weighted average 2013
Weighted average 2014
Weighted average 2015
USD63bn
USD 15bn
USD35bn
www.kurmannpartners.com [email protected]
P. 5
0
50
100
150
200
250
300
2007 2008 2009 2010 2011 2012 2013 2014 2015
VR
X S
hare
Pric
e [U
SD
]
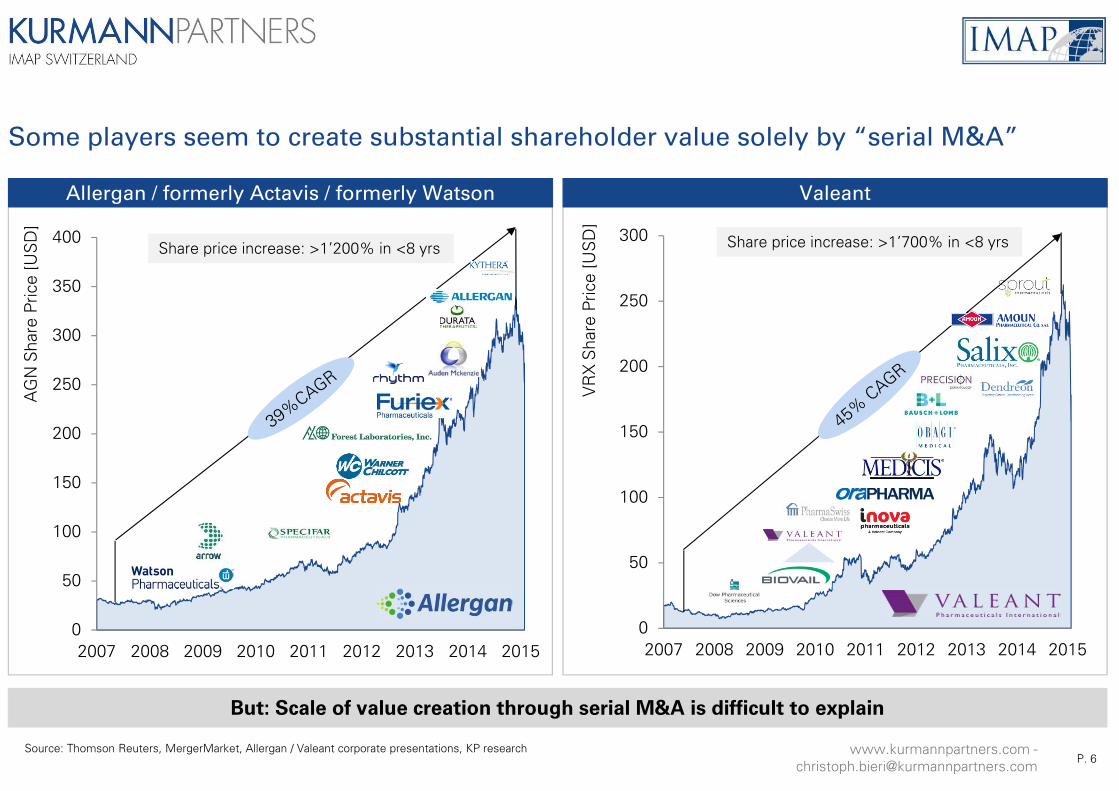
Share price increase: >1’700% in <8 yrs
0
50
100
150
200
250
300
350
400
2007 2008 2009 2010 2011 2012 2013 2014 2015
AG
N S
hare
Pric
e [U
SD
]
ValeantAllergan / formerly Actavis / formerly Watson
Source: Thomson Reuters, MergerMarket, Allergan / Valeant corporate presentations, KP research
But: Scale of value creation through serial M&A is difficult to explain
Some players seem to create substantial shareholder value solely by “serial M&A”
Share price increase: >1’200% in <8 yrs
www.kurmannpartners.com [email protected] P. 6

Source: Thomson Reuters
Allergan and Valeant vs. Top 10 Big Pharma, development of share price (Jan 2007=100)
0%
200%
400%
600%
800%
1000%
1200%
1400%
2007 2008 2009 2010 2011 2012 2013 2014 2015
AGN (Allergan)
VRX.TO (Valeant)
NOVN.VX (Novartis)
PFE (Pfizer)
SASY.PA (Sanofi)
ROG.VX (Roche)
MRK (Merck & Co)
JNJ (Johnson & Johnson)
AZN.L (AstraZeneca)
GSK.L (GlaxoSmithKline)
TEVA.TA (Teva)
www.kurmannpartners.com [email protected]
P. 7
Backup
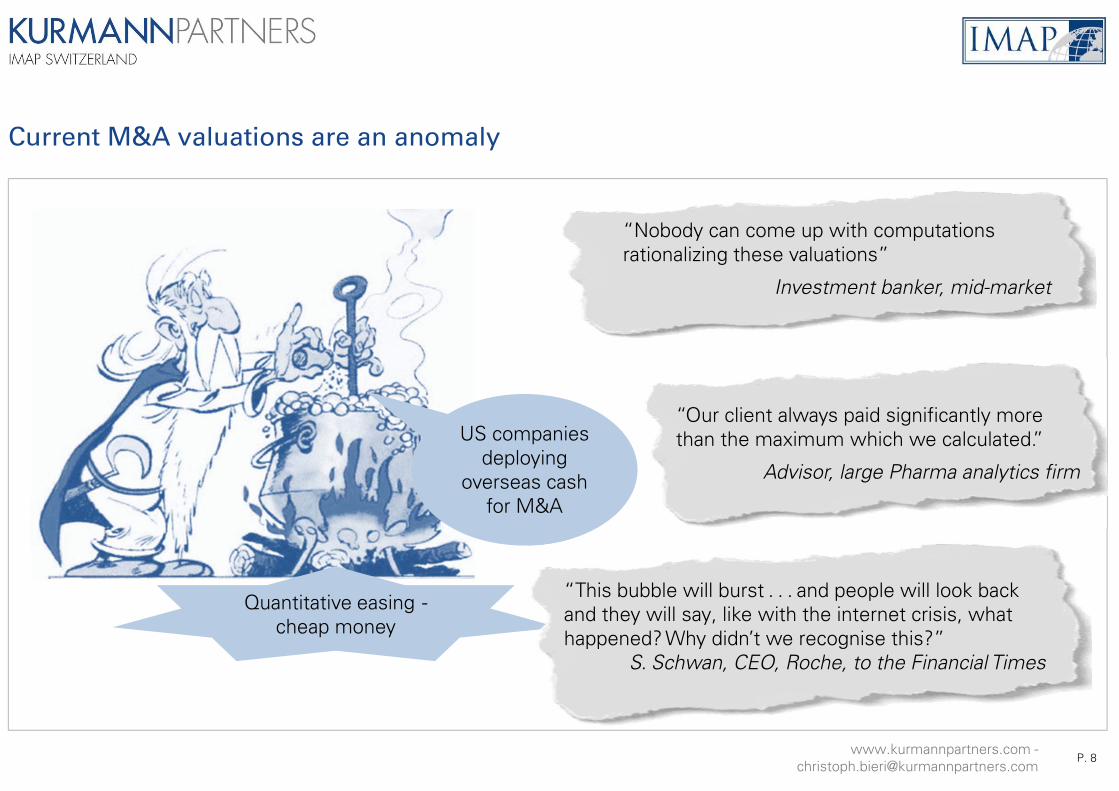
Current M&A valuations are an anomaly
Quantitative easing -cheap money
US companies deploying
overseas cash for M&A
“Nobody can come up with computations rationalizing these valuations”
Investment banker, mid-market
“This bubble will burst . . . and people will look back and they will say, like with the internet crisis, what happened? Why didn’t we recognise this?”
S. Schwan, CEO, Roche, to the Financial Times
“Our client always paid significantly more than the maximum which we calculated.”
Advisor, large Pharma analytics firm
www.kurmannpartners.com [email protected]
P. 8
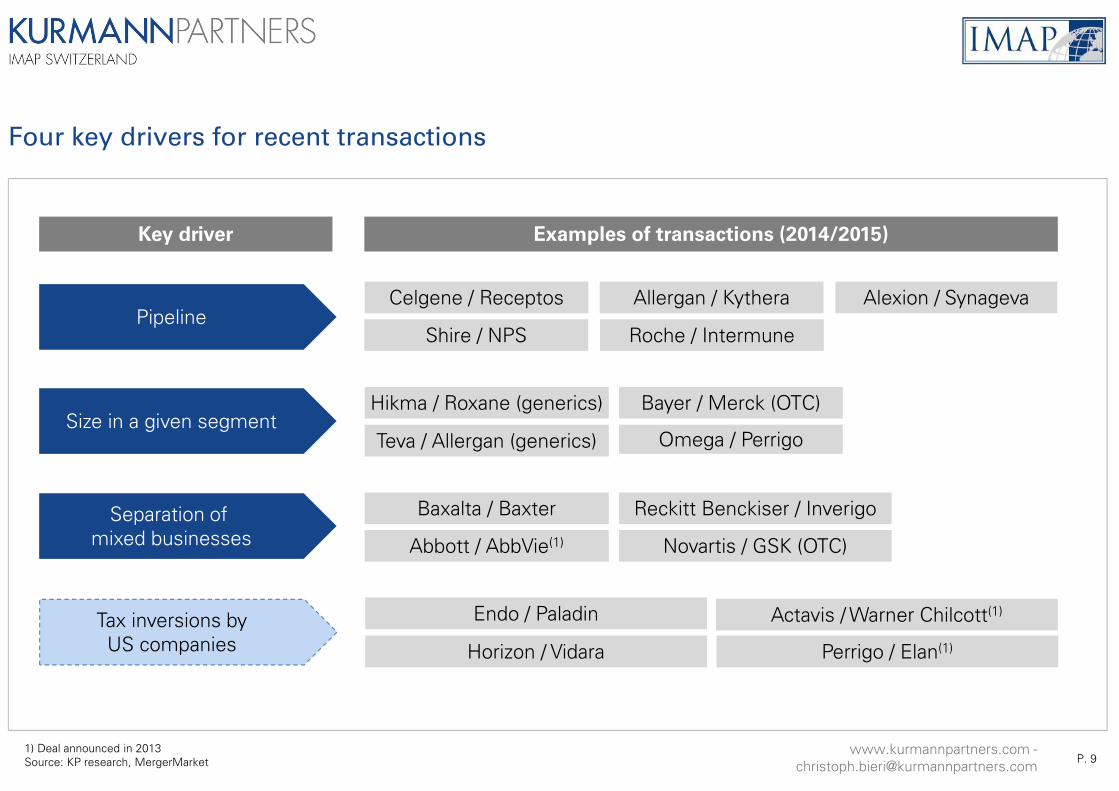
1) Deal announced in 2013Source: KP research, MergerMarket
Four key drivers for recent transactions
Key driver Examples of transactions (2014/2015)
PipelineAllergan / Kythera Alexion / Synageva
Shire / NPS Roche / Intermune
Celgene / Receptos
Size in a given segmentBayer / Merck (OTC)Hikma / Roxane (generics)
Teva / Allergan (generics) Omega / Perrigo
Separation of mixed businesses
Baxalta / Baxter
Novartis / GSK (OTC)Abbott / AbbVie(1)
Reckitt Benckiser / Inverigo
Tax inversions byUS companies
Actavis / Warner Chilcott(1)
Horizon / Vidara
Endo / Paladin
Perrigo / Elan(1)
www.kurmannpartners.com [email protected] P. 9
Agenda
Pharma M&A in 2013-2015
4 strategic archetypes for Pharma companies
Impact on Pharma’s manufacturing networks
Drivers for M&A of CMOs
Summary
www.kurmannpartners.com [email protected]
P. 10

0 10 20 30 40 50
Oil & gas
Automobiles
Media
Pharmaceuticals
Banks
High
Median
Low
… with Pharma one of the most visible driversHealthcare costs rise consistently…
1) Source: Worldbank2) Source: Financial Time
Healthcare cost evolution is out of bounds – Pharma is a contributor under the spotlight
9.0%
9.5%
10.0%
10.5%
11.0%
11.5%
12.0%
12.5%
13.0%
2000
2001
2002
2003
2004
2005
2006
2007
2008
2009
2010
2011
2012
2013 0%
5%
10%
15%
2010 2011 2012 2013 2014
Constant price increases2)
Annual % increase, wholesale drug prices
Total Health spending, % of GDP 1)
OECD countries
Pharma is one of the most profitable industries 2)
Net profit margin of top 10 companies by sector, 2014 (%)
www.kurmannpartners.com [email protected] P. 11
0
10
20
30
40
50
60
R&
D e
xpen
dutu
res
[US
D b
n20
13]
0
10
20
30
40
50
60
1963 1973 1983 1993 2003 2013
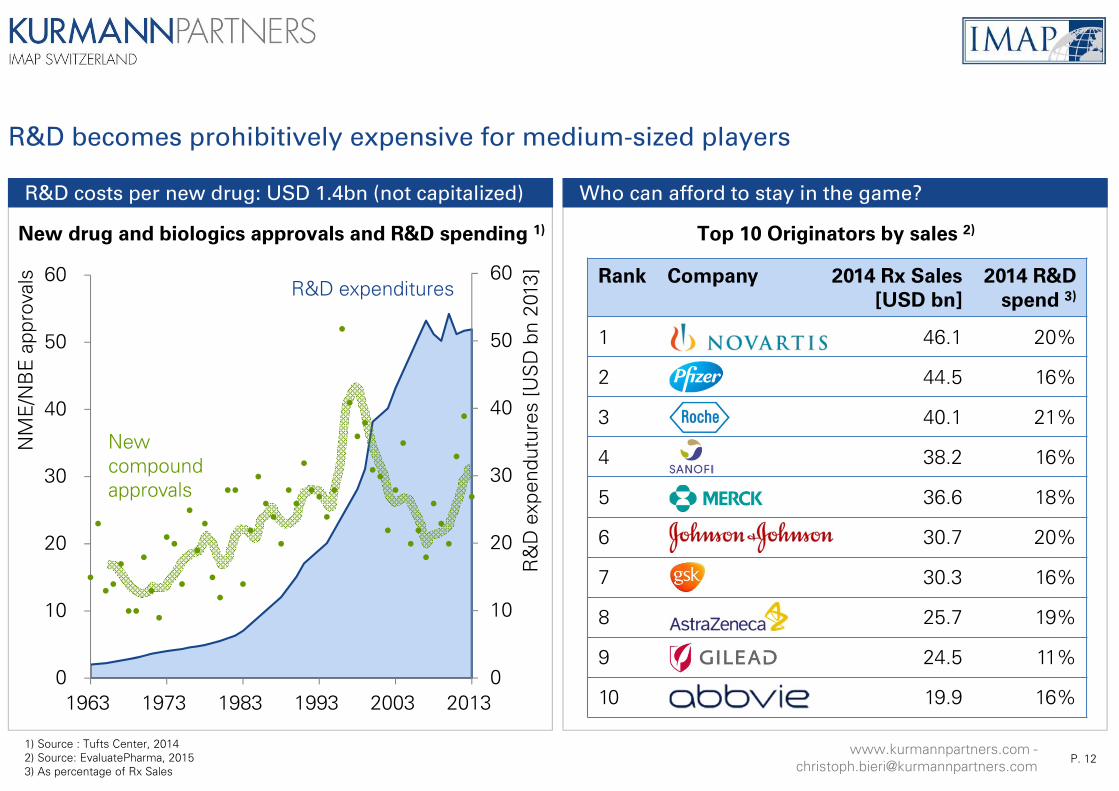
Who can afford to stay in the game?R&D costs per new drug: USD 1.4bn (not capitalized)
1) Source : Tufts Center, 20142) Source: EvaluatePharma, 20153) As percentage of Rx Sales
R&D becomes prohibitively expensive for medium-sized players
Top 10 Originators by sales 2)
NM
E/N
BE
app
rova
ls
New compound approvals
R&D expenditures
New drug and biologics approvals and R&D spending 1)
Rank Company 2014 Rx Sales
[USD bn]
2014 R&D
spend 3)
1 46.1 20%
2 44.5 16%
3 40.1 21%
4 38.2 16%
5 36.6 18%
6 30.7 20%
7 30.3 16%
8 25.7 19%
9 24.5 11%
10 19.9 16%
www.kurmannpartners.com [email protected] P. 12

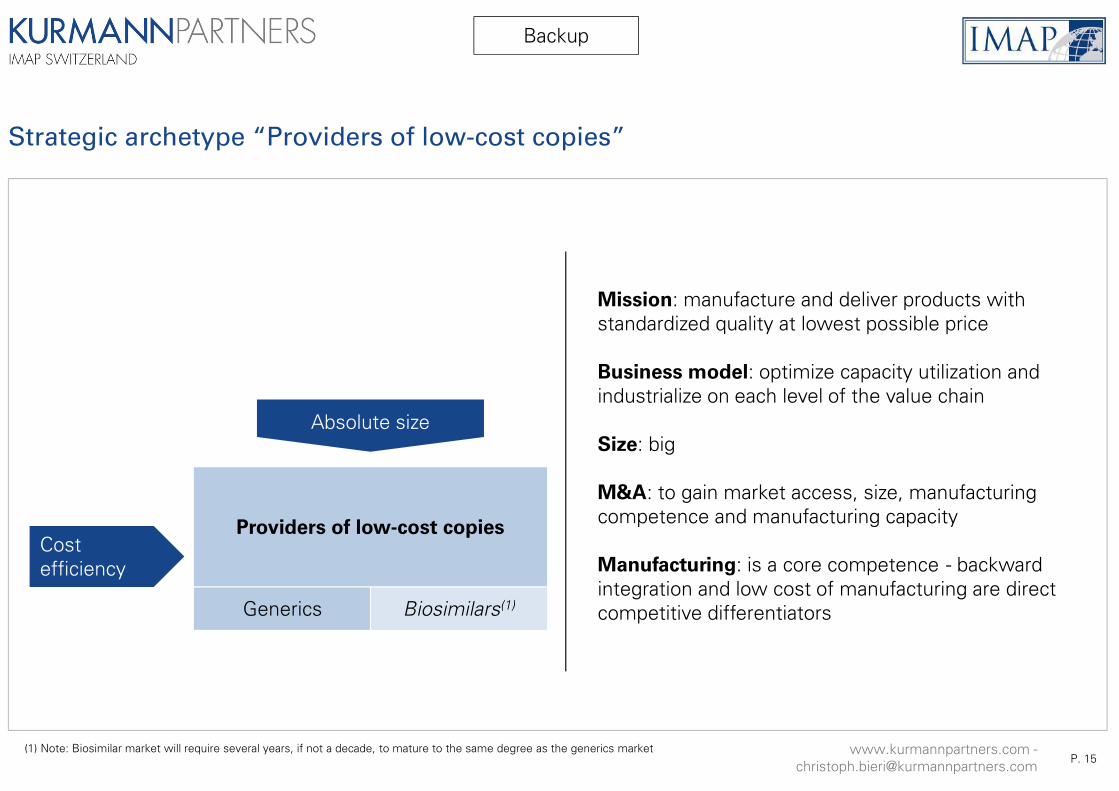
(1) Note: Biosimilar market will require several years, if not a decade, to mature to the same degree as the generics market
Four strategic archetypes will guide reorganization of the Pharma industry
Absolute size
Medical excellence
Originators
Find, develop, launch innovative new treatments. Globally, based on
strong R&D organization
Relative market share
Medical excellence
Point-of-call specialists
Provide comprehensive solutions for an indication / TA.
Build niche competence
Consumer marketing
OTC
Market consumer products with medical claim utilizing branding
know-how
In-house manufacturing is only strategic differentiator for generics, biosimilars, potentially OTC companies
www.kurmannpartners.com [email protected] P. 13
Cost efficiency
Providers of low-cost copies
Manufacture and deliver standard quality at lowest possible costs
Generics Biosimilars(1)

Strategic archetype “Originators”
Mission: find, develop, launch novel treatments
Business model: focused on acquiring innovations through internal R&D, licensing or M&A, and on developing, launching and marketing them
Size: global and big (USD 10bn and more)
M&A: to acquire new products or franchises (pipeline deals), or to gain size (“elephant deals”)
Manufacturing: should not be a core competence (could be outsourced), with the exception of complex biologicals or cell-based therapies
Absolute size
Medical excellence Originators
www.kurmannpartners.com [email protected] P. 14
Backup
(1) Note: Biosimilar market will require several years, if not a decade, to mature to the same degree as the generics market
Strategic archetype “Providers of low-cost copies”
Mission: manufacture and deliver products with standardized quality at lowest possible price
Business model: optimize capacity utilization and industrialize on each level of the value chain
Size: big
M&A: to gain market access, size, manufacturing competence and manufacturing capacity
Manufacturing: is a core competence - backward integration and low cost of manufacturing are direct competitive differentiators
Cost efficiency
Providers of low-cost copies
Absolute size
www.kurmannpartners.com [email protected] P. 15
Generics Biosimilars(1)
Backup

Already today, the top 5 generic drug companies control more than 50% of the worldwide market
1) Sources: MergerMarket, Evaluate Pharma, KP research2) Source: Statista, 2015
Low-cost providers (generics / biosimilars): absolute size is a key strategic differentiator
Teva + Actavis21%
Sandoz (Novartis)
11%
Mylan9%
Sun6%Aspen
4%
Hospira (Pfizer)
4%Sanofi
3%
Fresenius3%
Lupin3%
Other36%
Top 10 global generic drug manufacturers, 2014 2)
0
10
20
30
40
50
60
70
2004
2005
2006
2007
2008
2009
2010
2011
2012
2013
2014
2015
Cum
ulat
edde
al v
alue
[US
D b
n]
Acquisitions of generic drug manufacturers 1)
Deal values >USD 1bn
5 deals >1bn
www.kurmannpartners.com [email protected]
P. 16
Backup
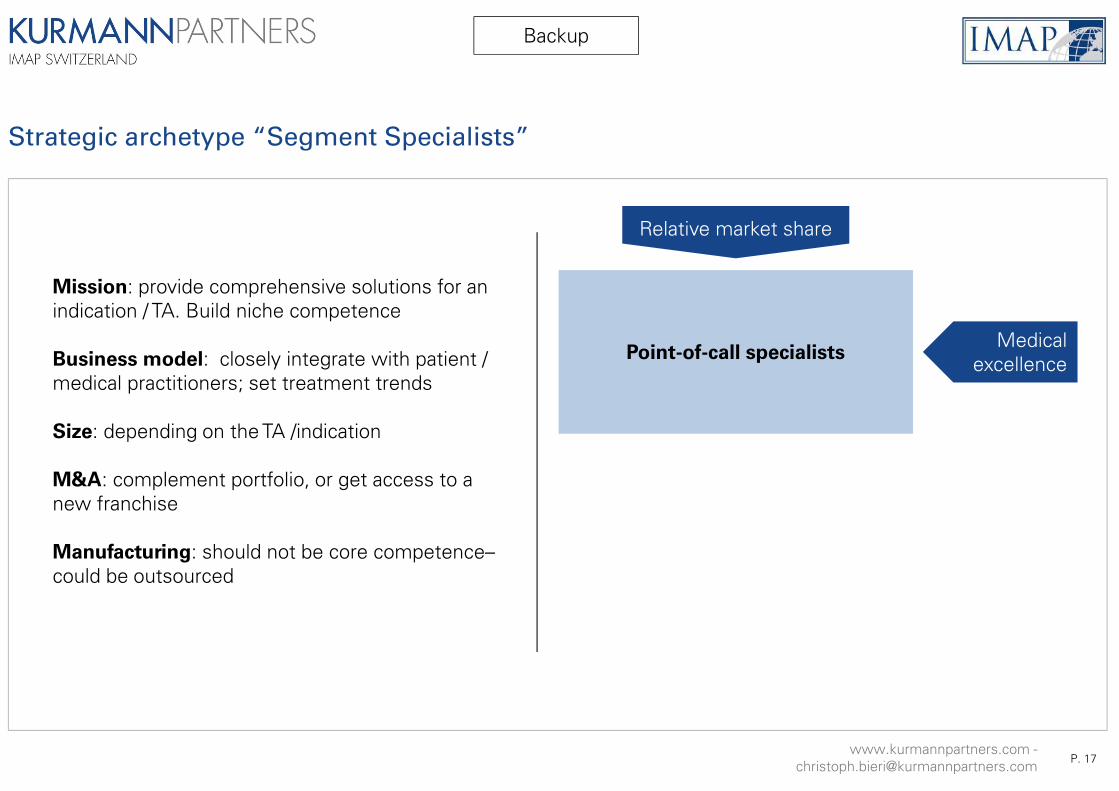
Strategic archetype “Segment Specialists”
Relative market share
Medical excellencePoint-of-call specialists
Mission: provide comprehensive solutions for an indication / TA. Build niche competence
Business model: closely integrate with patient / medical practitioners; set treatment trends
Size: depending on the TA /indication
M&A: complement portfolio, or get access to a new franchise
Manufacturing: should not be core competence–could be outsourced
www.kurmannpartners.com [email protected] P. 17
Backup
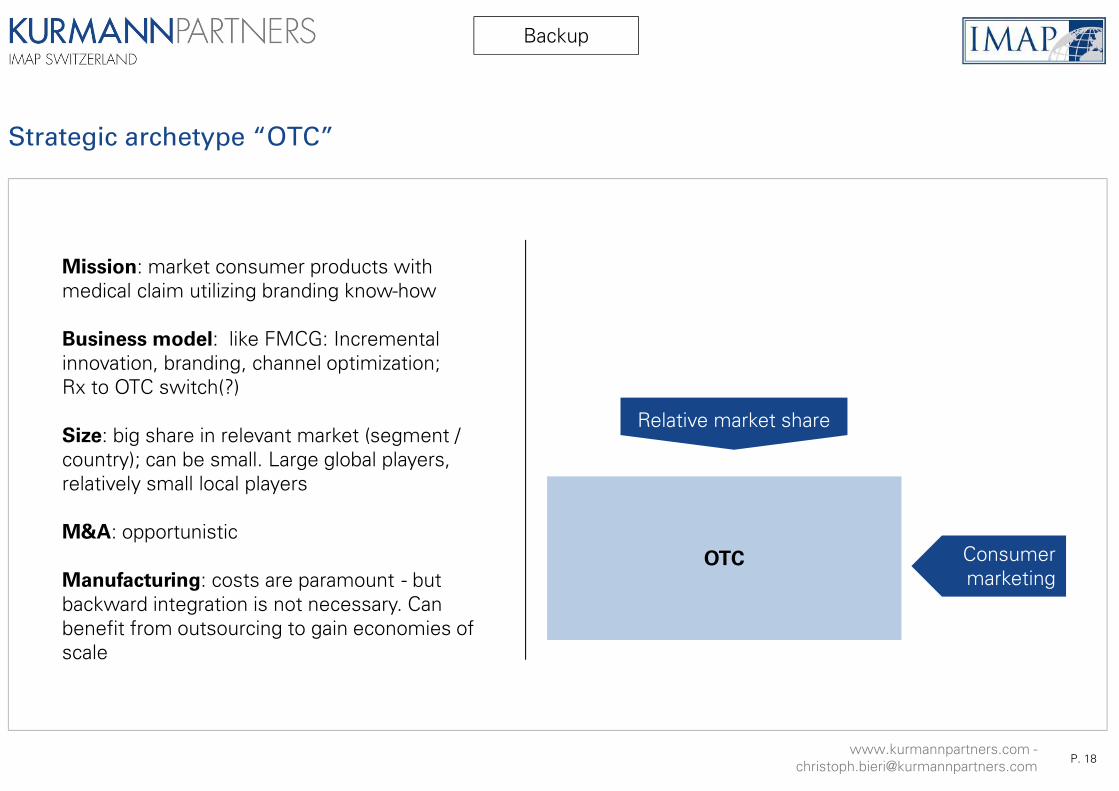
Strategic archetype “OTC”
Consumer marketing
OTC
Mission: market consumer products with medical claim utilizing branding know-how
Business model: like FMCG: Incremental innovation, branding, channel optimization; Rx to OTC switch(?)
Size: big share in relevant market (segment / country); can be small. Large global players, relatively small local players
M&A: opportunistic
Manufacturing: costs are paramount - but backward integration is not necessary. Can benefit from outsourcing to gain economies of scale
Relative market share
www.kurmannpartners.com [email protected] P. 18
Backup
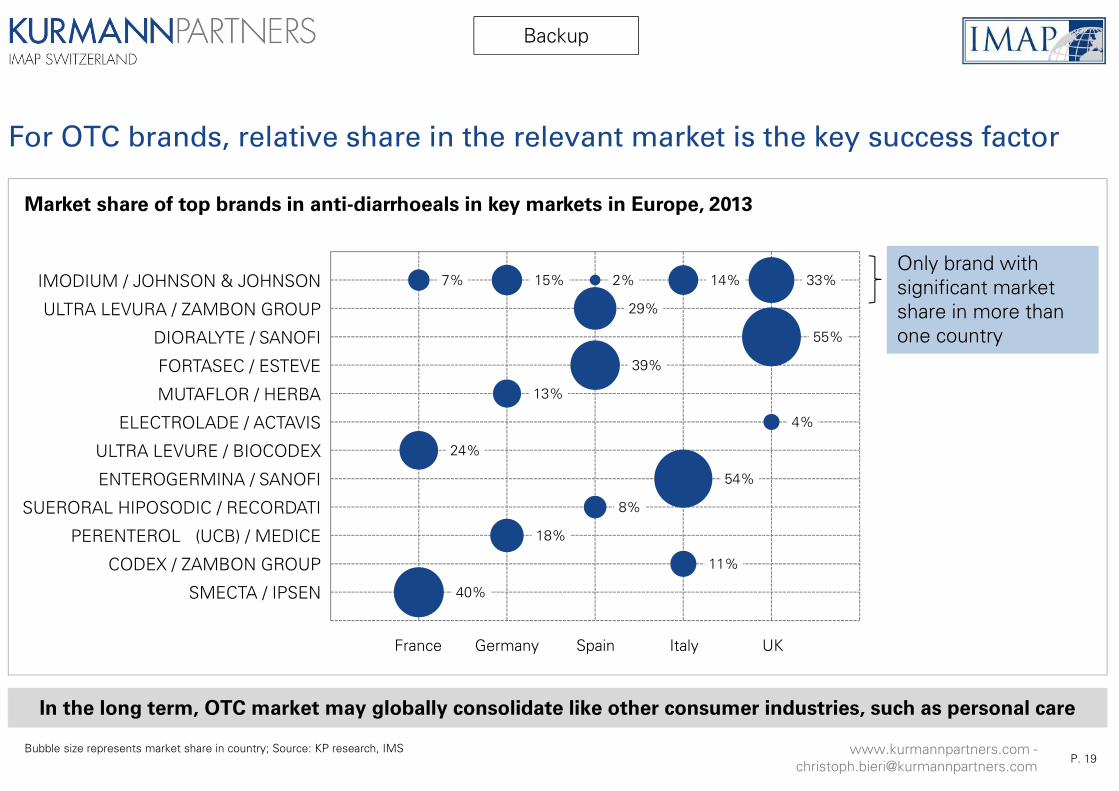
Bubble size represents market share in country; Source: KP research, IMS
For OTC brands, relative share in the relevant market is the key success factor
7%
24%
40%
15%
13%
18%
2%
29%
39%
8%
14%
54%
11%
33%
55%
4%
France Germany Spain Italy UK
IMODIUM / JOHNSON & JOHNSON
ULTRA LEVURA / ZAMBON GROUP
DIORALYTE / SANOFI
FORTASEC / ESTEVE
MUTAFLOR / HERBA
ELECTROLADE / ACTAVIS
ULTRA LEVURE / BIOCODEX
ENTEROGERMINA / SANOFI
SUERORAL HIPOSODIC / RECORDATI
PERENTEROL (UCB) / MEDICE
CODEX / ZAMBON GROUP
SMECTA / IPSEN
Market share of top brands in anti-diarrhoeals in key markets in Europe, 2013
Only brand with significant market share in more than one country
In the long term, OTC market may globally consolidate like other consumer industries, such as personal care
www.kurmannpartners.com [email protected] P. 19
Backup
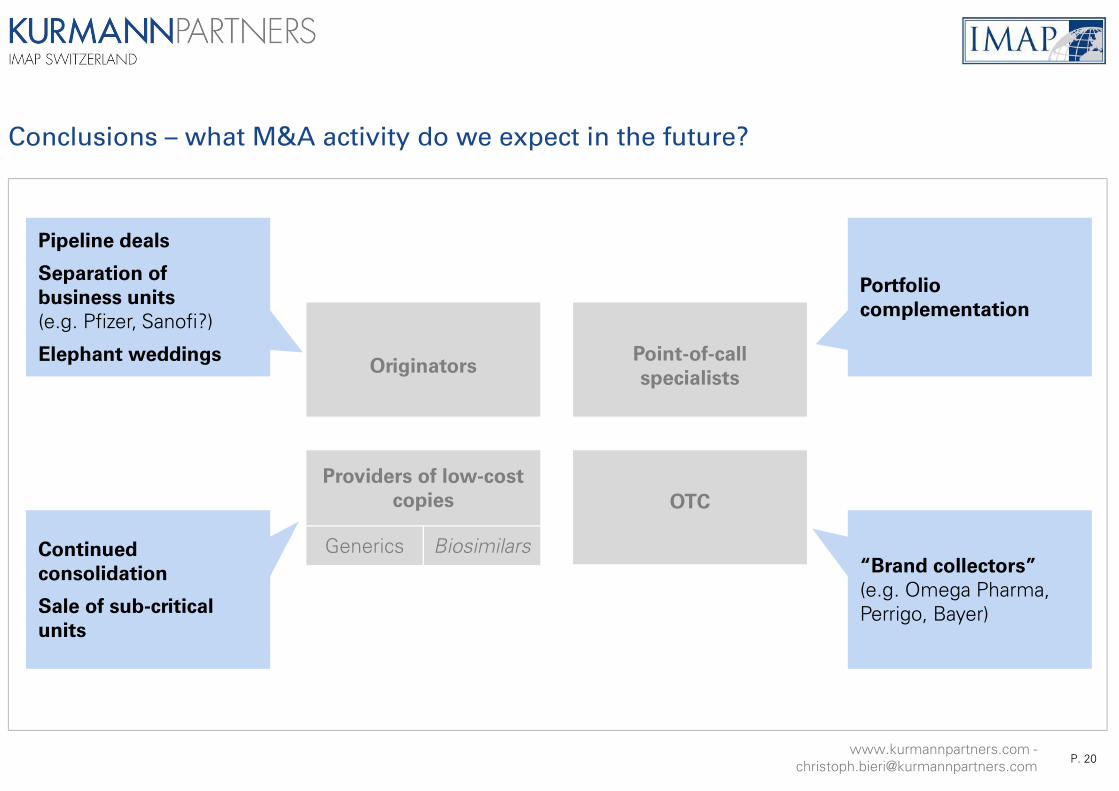
Conclusions – what M&A activity do we expect in the future?
Originators
Providers of low-cost
copies
Point-of-call
specialists
OTC
Pipeline deals
Separation of
business units
(e.g. Pfizer, Sanofi?)
Elephant weddings
Continued
consolidation
Sale of sub-critical
units
“Brand collectors”
(e.g. Omega Pharma, Perrigo, Bayer)
Portfolio
complementation
www.kurmannpartners.com [email protected] P. 20
Generics Biosimilars
Agenda
Pharma M&A in 2013-2015
4 strategic archetypes for Pharma companies
Impact on Pharma’s manufacturing networks
Drivers for M&A of CMOs
www.kurmannpartners.com [email protected]
P. 21
Summary
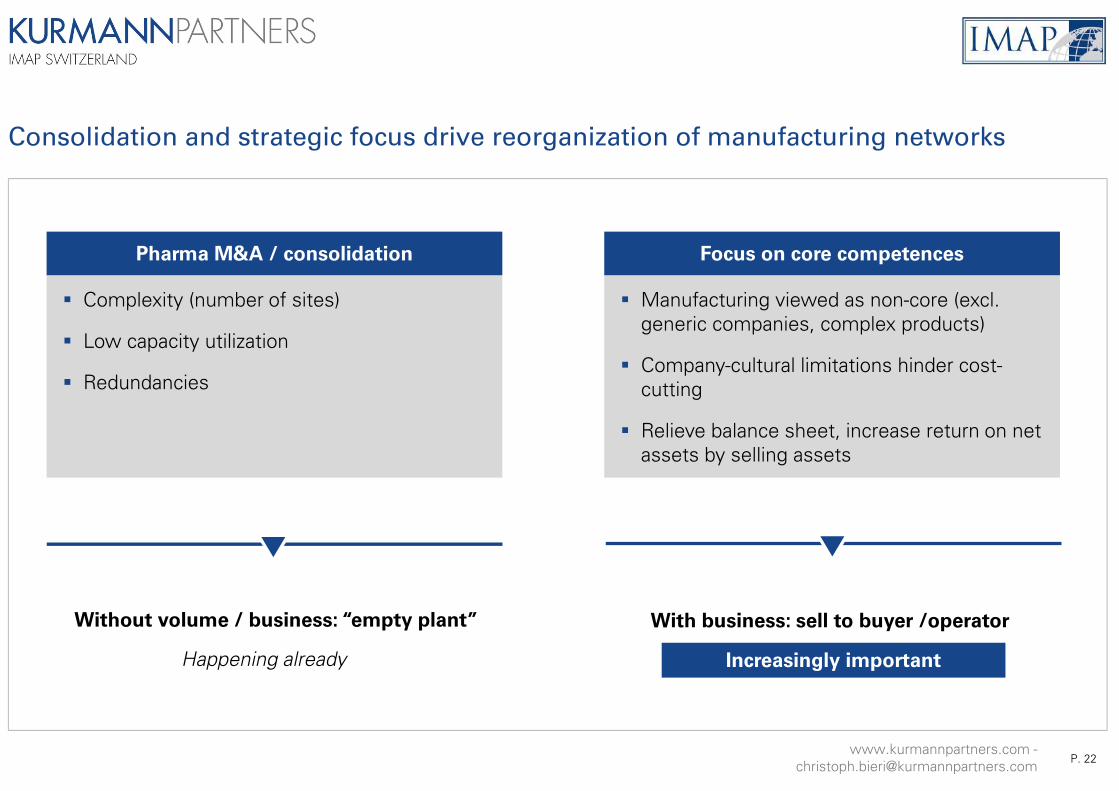
Consolidation and strategic focus drive reorganization of manufacturing networks
Without volume / business: “empty plant”
Happening already
With business: sell to buyer /operator
Increasingly important
Complexity (number of sites)
Low capacity utilization
Redundancies
Pharma M&A / consolidation
Manufacturing viewed as non-core (excl. generic companies, complex products)
Company-cultural limitations hinder cost-cutting
Relieve balance sheet, increase return on net assets by selling assets
Focus on core competences
www.kurmannpartners.com [email protected] P. 22
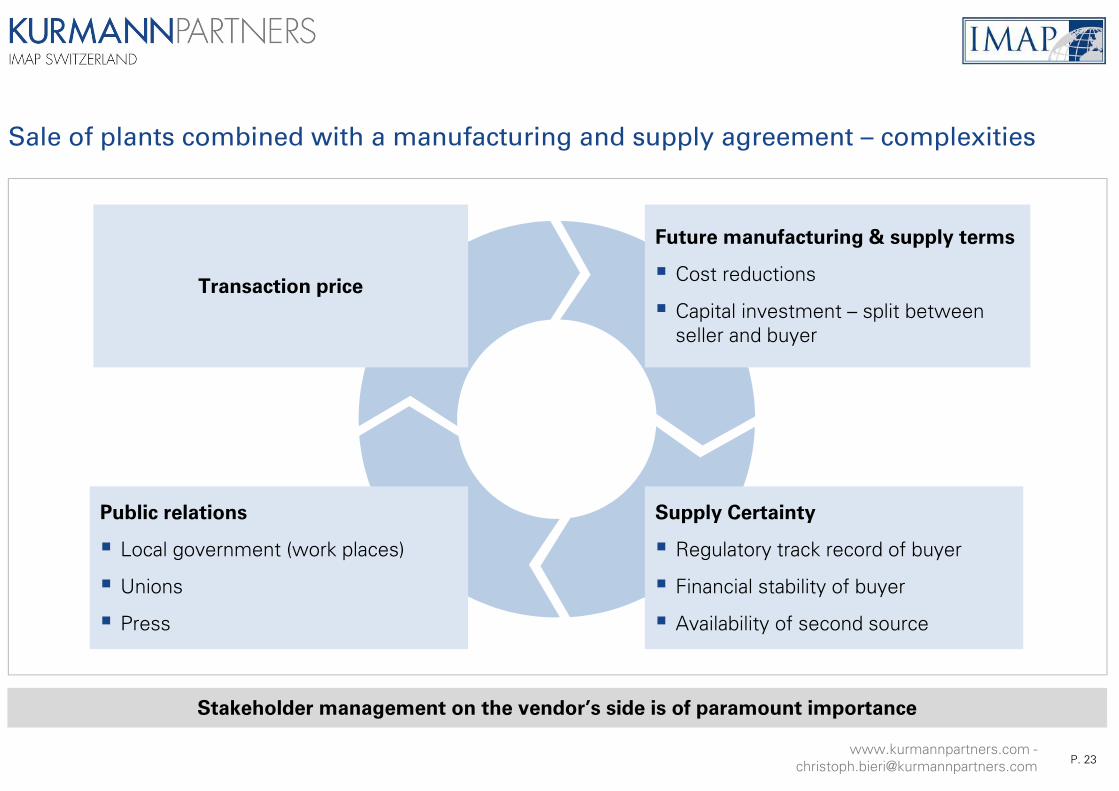
Stakeholder management on the vendor’s side is of paramount importance
Sale of plants combined with a manufacturing and supply agreement – complexities
Public relations
Local government (work places)
Unions
Press
Future manufacturing & supply terms
Cost reductions
Capital investment – split between seller and buyer
Transaction price
Supply Certainty
Regulatory track record of buyer
Financial stability of buyer
Availability of second source
www.kurmannpartners.com [email protected] P. 23
Agenda
Pharma M&A in 2013-2015
4 strategic archetypes for Pharma companies
Impact on Pharma’s manufacturing networks
Drivers for M&A of CMOs
Summary
www.kurmannpartners.com [email protected]
P. 24

Source: Recipharm, based on the 195 leading CDMOs globally
The CMO market is still highly fragmented
58
20
27
42
92
26%
46%
68%
85%
94%
100%
0%
10%
20%
30%
40%
50%
60%
70%
80%
90%
100%
0
20
40
60
80
100
> USD500m
USD 250m- 499m
USD 100m- 249m
USD 50m -99m
USD 25m -49m
USD < 25m
# of CDMOs Cumulative sales
Market facts
The majority of CMOs are privately owned and very few are owned by private equity or are listed
CMO market penetration rates are around 40%
The five largest CMOs command around 26% of total revenue
Only 6.7% of all CMOs generate revenues above USD 250m
Almost 50% of all CMOs display revenues below USD 25m
Market facts
www.kurmannpartners.com [email protected] P. 25

Source: MergerMarket, = Establishment of growth platform
Large players have been strengthening their position through M&A
2004 - 2010 2011 - 2015
Catalent
RevenueUSD 1.8bn
Relthy Laboratorios(BR), 2013
Zheijian Biotech (CN), 2013
R.P. Scherer GmbH (GE), 2012
Aptuit Inc. (USA), 2011
Cardinal / Catalent(USA), 2007
Micron Techn. (USA), 2014
Aenova
RevenueUSD 1 bn
Haupt Pharma (GE), 2013
Euro Vital Pharma (GE), 2012
Temmler Pharma (GE), 2012
Dragenopharm and Swiss Caps, 2008
Bio-Garten(GE) 2014
Contract Packaging(US) 2014
Siegfried
RevenueUSD 600m
BASF (supply bus.)(EU), 2015
Pharma Hameln(GE), 2014
Alliance Medical(FR), 2012
Fareva
RevenueUSD 1.8bn
Chromavis SPA (IT), 2013
Istituto de Angeli(IT), 2009
Heumann PCS(GE), 2007
Manufacturing site(FR), 2013
Manufacturing site(FR), 2008
Manufacturing site(FR), 2015
Patheon
RevenueUSD 1bn DSM
(NL), 2013
Banner Pharma(USA), 2012
Mova Pharma(PR), 2004
Irix Pharma(US), 2015
Agere Pharma(US), 2015
Unknown deal value
Merger / Carve-out / JV
Transaction of > USD 100m
www.kurmannpartners.com [email protected] P. 26

Opportunities for CMOs
Still relatively fragmented, with many niches
Gain economies of scale focusing on specific technologies
Opportunities to acquire sites with volumes from Pharma companies
Drivers for M&A in the CMO industry
Pressure on CMOs to grow
Consolidators already active
Size match – Big Pharma wants Big CMOs
Regulatory changes increase cost base / minimum size
+
!
Future:
Vertical disintegration of Pharma
Tiered supply chain (like automotive)
Large CMOs, or strong specialist CMOs
Past:
Integrated Pharma and many small CMOs
Future: Change of Pharma’s service needsToday: opportunities and pressure
www.kurmannpartners.com [email protected]
P. 27
Agenda
Pharma M&A in 2013-2015
4 strategic archetypes for Pharma companies
Impact on Pharma’s manufacturing networks
Drivers for M&A of CMOs
Summary
www.kurmannpartners.com [email protected]
P. 28

Thank you for your attention!
www.kurmannpartners.com [email protected] P. 29
Summary
Cost pressure forces Pharma companies to further focus their businesses, and to consolidate2
Four archetypes emerge which will guide the reorganization of the Pharma industry 3
In-house manufacturing becomes strategically less important4
CMOs must specialize and grow to match their clients’ changing needs5
Since 2014, Pharma has been in an overheated phase of M&A, which is likely to end soon1