An Overview of Indian Manufacturing Sector Pranav Kumar Policy Analyst, CUTS-CITEE.
17
An Overview of Indian An Overview of Indian Manufacturing Sector Manufacturing Sector Pranav Kumar Pranav Kumar Policy Analyst, CUTS-CITEE Policy Analyst, CUTS-CITEE
-
Upload
shavonne-oconnor -
Category
Documents
-
view
215 -
download
1
Transcript of An Overview of Indian Manufacturing Sector Pranav Kumar Policy Analyst, CUTS-CITEE.

An Overview of Indian An Overview of Indian Manufacturing SectorManufacturing Sector
Pranav KumarPranav Kumar
Policy Analyst, CUTS-CITEEPolicy Analyst, CUTS-CITEE
Presentation CoveragePresentation Coverage
Three distinct phase since independence Three distinct phase since independence Policy changes during the three phasesPolicy changes during the three phases Growth trends and the sector’s Growth trends and the sector’s
contribution in national incomecontribution in national income Mfg. contribution to exportsMfg. contribution to exports Employment generation in manufacturingEmployment generation in manufacturing Major challengesMajor challenges Major constraintsMajor constraints Steps requiredSteps required

Three Distinct Phase Since Three Distinct Phase Since IndependenceIndependence
Phase-I 1950-80: Main PoliciesPhase-I 1950-80: Main Policies Focus on large and heavy industriesFocus on large and heavy industries State control and central planningState control and central planning Import substitution Import substitution Rigid price controlsRigid price controls Severe restrictions on private initiatives Severe restrictions on private initiatives
WIDELY ACKNOWLEDGED TO HAVE BEEN WIDELY ACKNOWLEDGED TO HAVE BEEN UNSUCCESSFUL UNSUCCESSFUL
Three Distinct Phase Since Three Distinct Phase Since Independence (Contd.) Independence (Contd.)
Phase-II 1980-90: Main PoliciesPhase-II 1980-90: Main Policies Reduction of barriers to entry and Reduction of barriers to entry and
expansionexpansion Beginning of simplification of proceduresBeginning of simplification of procedures Providing easier access to better Providing easier access to better
technology and intermediate material technology and intermediate material importsimports
INTRODUCTION OF PIECEMEAL REFORMS INTRODUCTION OF PIECEMEAL REFORMS
Three Distinct Phase Since Three Distinct Phase Since Independence (Contd.)Independence (Contd.)
Phase-III 1991 Onwards: Main PoliciesPhase-III 1991 Onwards: Main Policies Reduction in and/or abolition of some restrictions, such Reduction in and/or abolition of some restrictions, such
as high tariff rates, import licensing, and QRsas high tariff rates, import licensing, and QRs Reducing the barriers to entry for FDIReducing the barriers to entry for FDI Abolition of industrial licensing Abolition of industrial licensing Private sector participation in sectors reserved for Private sector participation in sectors reserved for
public sectorpublic sector Fiscal and monetary reformsFiscal and monetary reforms
HIGH GROWTH IN TOTAL MANUFACTURING HIGH GROWTH IN TOTAL MANUFACTURING
Growth Performance of Indian Growth Performance of Indian Manufacturing (Phase-I)Manufacturing (Phase-I)
State-led import-substitution policy State-led import-substitution policy framework had helped create a framework had helped create a diversified manufacturing sector in Phase-diversified manufacturing sector in Phase-II
Industrial stagnation since the mid-1960s Industrial stagnation since the mid-1960s increasingly blamed on the policy increasingly blamed on the policy frameworkframework
This led to some tentative steps aimed at This led to some tentative steps aimed at liberalising these regimes in the late liberalising these regimes in the late 1970s and early 1980s 1970s and early 1980s
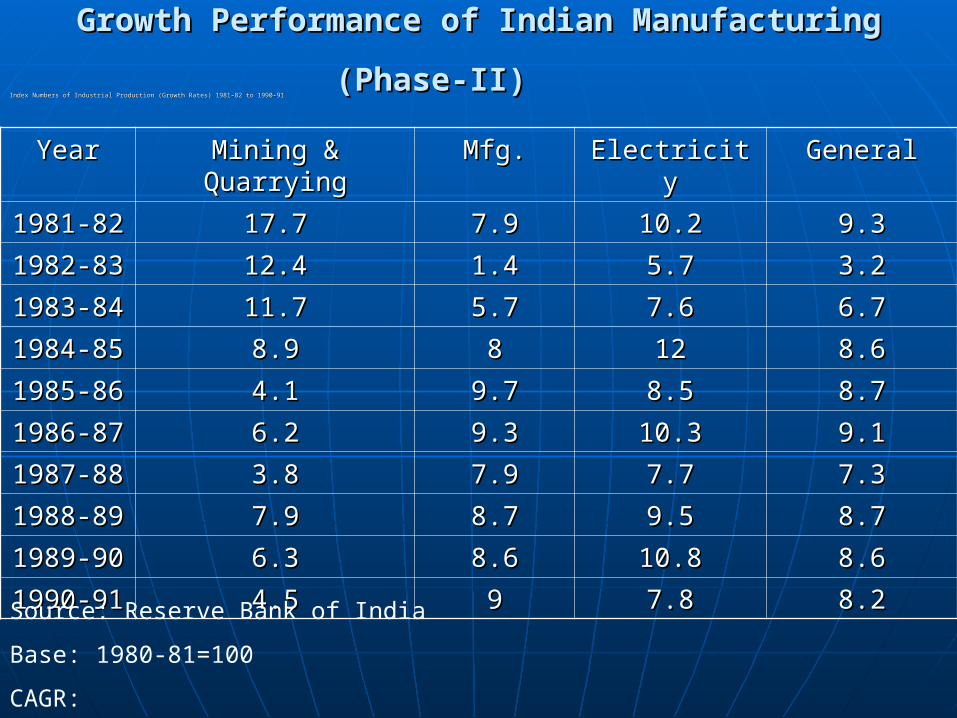
Growth Performance of Indian Manufacturing (Phase-II)Growth Performance of Indian Manufacturing (Phase-II) Index Numbers of Industrial Production (Growth Rates) 1981-82 to 1990-91Index Numbers of Industrial Production (Growth Rates) 1981-82 to 1990-91
YearYear Mining & QuarryingMining & Quarrying Mfg.Mfg. ElectricityElectricity GeneralGeneral
1981-821981-82 17.717.7 7.97.9 10.210.2 9.39.3
1982-831982-83 12.412.4 1.41.4 5.75.7 3.23.2
1983-841983-84 11.711.7 5.75.7 7.67.6 6.76.7
1984-851984-85 8.98.9 88 1212 8.68.6
1985-861985-86 4.14.1 9.79.7 8.58.5 8.78.7
1986-871986-87 6.26.2 9.39.3 10.310.3 9.19.1
1987-881987-88 3.83.8 7.97.9 7.77.7 7.37.3
1988-891988-89 7.97.9 8.78.7 9.59.5 8.78.7
1989-901989-90 6.36.3 8.68.6 10.810.8 8.68.6
1990-911990-91 4.54.5 99 7.87.8 8.28.2
Source: Reserve Bank of India
Base: 1980-81=100
CAGR:

Growth Performance of Indian Manufacturing (Phase-III)Growth Performance of Indian Manufacturing (Phase-III) Index Numbers of Industrial Production (Growth Rates) 1990-91 to 2005-06 Index Numbers of Industrial Production (Growth Rates) 1990-91 to 2005-06
YearYear GeneralGeneral YearYear GeneralGeneral
1990-911990-91 8.28.2 1998-991998-99 4.14.1
1991-921991-92 0.60.6 1999-001999-00 6.76.7
1992-931992-93 2.32.3 2000-012000-01 55
1993-941993-94 66 2001-022001-02 2.72.7
1994-951994-95 9.19.1 2002-032002-03 5.75.7
1995-961995-96 1313 2003-042003-04 77
1996-971996-97 6.16.1 2004-052004-05 8.48.4
1997-981997-98 6.76.7 2005-062005-06 8.28.2
Source: Reserve Bank of India
Base: 1980-81=100 for years 1990-94 and 1993-94=100 for remaining
Remarks: Industrial sector growth in India has fallen sharply in the later seven years (1997-98 to 2003-04) as compared to the first seven years after the reforms (1990-91 to 1996-97)
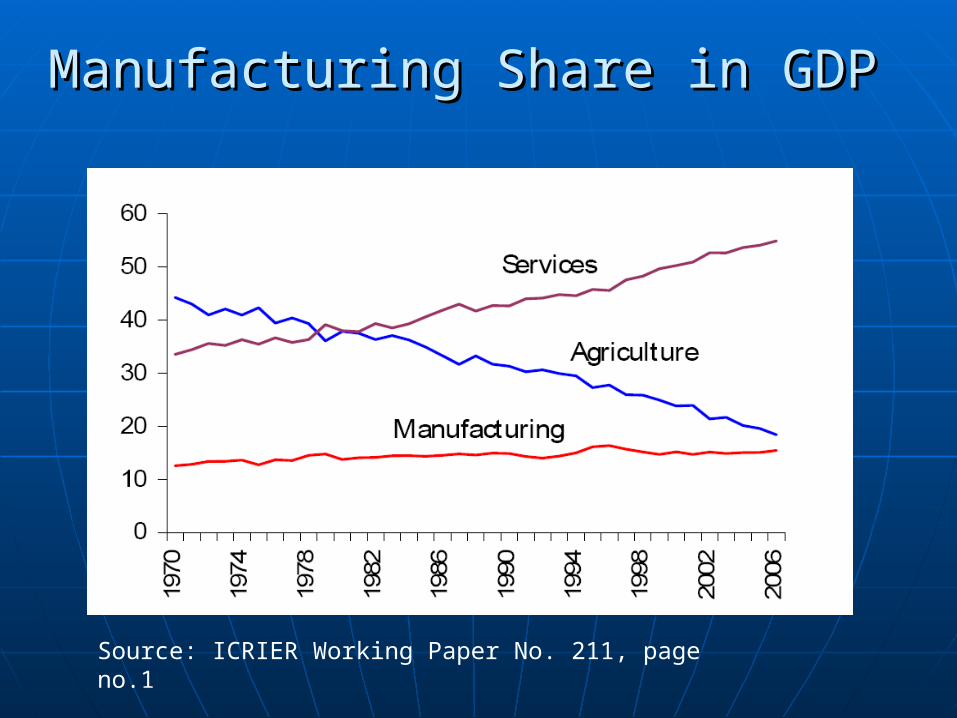
Manufacturing Share in GDP Manufacturing Share in GDP
Source: ICRIER Working Paper No. 211, page no.1
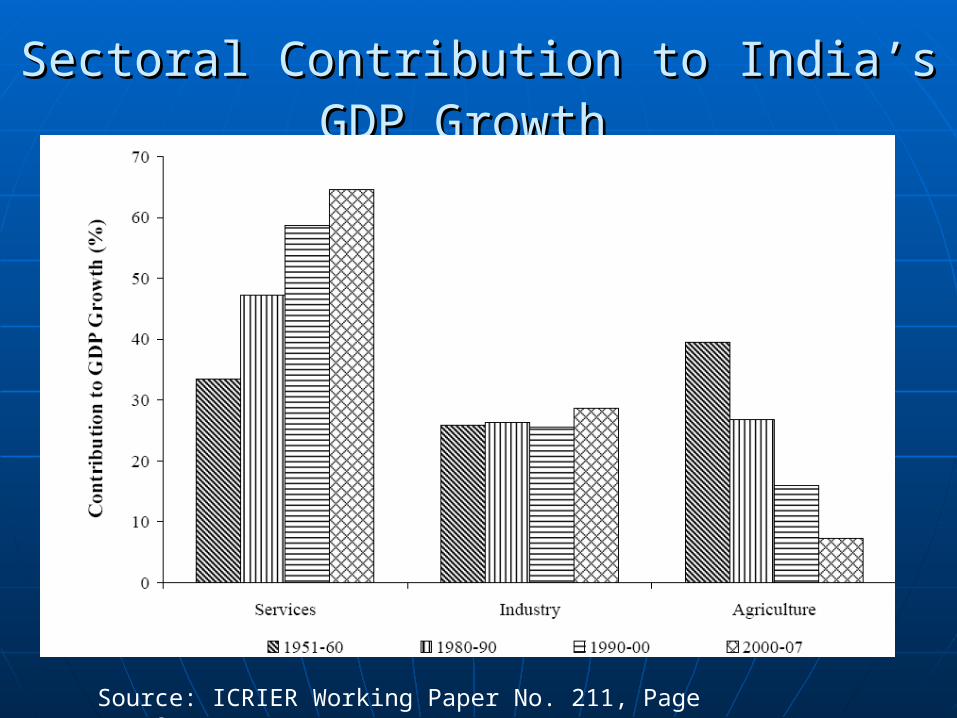
Sectoral Contribution to India’s GDP GrowthSectoral Contribution to India’s GDP Growth
Source: ICRIER Working Paper No. 211, Page no. 2

Manufacturing Contribution to ExportsManufacturing Contribution to Exports
Share (Per cent)Share (Per cent) CAGR CAGR 2000-01 2000-01 to 2004-to 2004-
0505
Growth rate (%)Growth rate (%)
2000-2000-0101
2005-2005-0606
2006-2006-0707
2005-2005-0606
2006-2006-0707
Mfg. goodsMfg. goods 78.878.8 72.072.0 68.668.6 15.315.3 19.619.6 16.916.9
Tex. Incl. RMGTex. Incl. RMG 23.623.6 14.514.5 12.512.5 4.34.3 20.420.4 5.75.7
Gems & jewelleryGems & jewellery 16.616.6 15.115.1 12.612.6 16.816.8 12.812.8 2.92.9
Eng. GoodsEng. Goods 15.715.7 20.720.7 23.323.3 25.425.4 23.423.4 38.138.1
Chemical & related prod.Chemical & related prod. 10.410.4 11.611.6 11.211.2 21.721.7 17.317.3 19.119.1
Leather & leather mfg.Leather & leather mfg. 4.44.4 2.62.6 2.42.4 5.55.5 11.111.1 12.112.1
Handicrafts (incl. carpet Handicrafts (incl. carpet handmade)handmade)
2.82.8 1.21.2 1.11.1 -5.3-5.3 30.330.3 4.14.1
Petroleum, crude & Petroleum, crude & products (incl.coal)products (incl.coal)
4.34.3 11.511.5 15.015.0 38.738.7 66.266.2 59.359.3
Total ExportsTotal Exports 100100 100100 100100 17.017.0 23.423.4 22.622.6
Source: Economic Survey 2007-08

Employment in ManufacturingEmployment in ManufacturingSectoral Employment Shares by CDS BasisSectoral Employment Shares by CDS Basis
19831983 1993-941993-94 1999-1999-0000
2004-2004-0505
Agri.Agri. 65.4265.42 61.0361.03 56.6456.64 52.0652.06
Mfg.Mfg. 11.2711.27 11.1011.10 12.1312.13 12.9012.90
Source: Various rounds of NSSO survey on employment and unemployment/Planning Commission
19801980 19901990 19911991 19921992 19931993 19941994 19951995 19961996 19971997 19981998 19991999 20002000 20012001
EmptEmpt 58.6258.62 63.2763.27 63.3363.33 64.2764.27 63.9663.96 64.1464.14 66.2166.21 66.5866.58 71.2971.29 68.5268.52 67.4367.43 66.1566.15 64.4364.43
Year-wise Employment in the Organised Manufacturing (In Lakh)
Source: Rajya Sabha Unstarred Question No. 1978, dated 15.12.2003
Main Challenges Facing Indian Main Challenges Facing Indian ManufacturingManufacturing
Sharp deceleration in manufacturing Sharp deceleration in manufacturing sector growth sector growth
Contribution in GDP remains constantContribution in GDP remains constant No significant contribution in employment No significant contribution in employment
generationgeneration Share in total exports is falling, though Share in total exports is falling, though
still the dominant export sectorstill the dominant export sector Labour-intensive manufacturing not Labour-intensive manufacturing not
performing wellperforming well
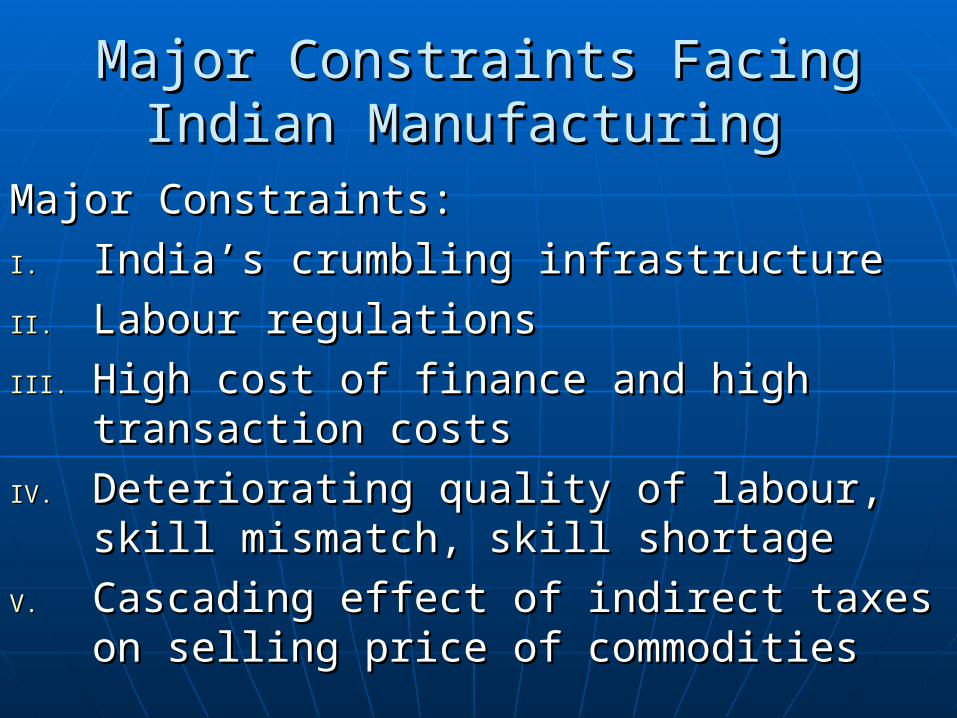
Major Constraints Facing Indian Major Constraints Facing Indian Manufacturing Manufacturing
Major Constraints:Major Constraints:
I.I. India’s crumbling infrastructureIndia’s crumbling infrastructure
II.II. Labour regulations Labour regulations
III.III. High cost of finance and high High cost of finance and high transaction coststransaction costs
IV.IV. Deteriorating quality of labour, skill Deteriorating quality of labour, skill mismatch, skill shortagemismatch, skill shortage
V.V. Cascading effect of indirect taxes on Cascading effect of indirect taxes on selling price of commodities selling price of commodities

Steps RequiredSteps Required
Increase investment in infrastructure Increase investment in infrastructure from 5 percent of GDP to 8 percent of the from 5 percent of GDP to 8 percent of the GDP by the end of 11GDP by the end of 11thth FYP FYP
Reform labour laws as rigidities Reform labour laws as rigidities introduced by unchanged regulations are introduced by unchanged regulations are holding back the mfg. sector growthholding back the mfg. sector growth
Financial sector need further revamping Financial sector need further revamping

Source: ICRIER working paper no. 211, Page no. 8